rehabilitation of hydropower
TRANSCRIPT
REHABILITATION OF HYDROPOWER
-An introduction to economic and technical issues
Joseph Goldberg and Oeyvind Espeseth Lier
Water Papers are published by the Water Unit, Transport, Water and ICT Department, Sustainable Development Vice Presidency. Water Papers are available on-line at www.worldbank.org/water. Comments should be e-mailed to the authors.
Water PapersWater Papers
June 2011
ii
TABLE OF CONTENTS
ACRONYMS AND ABBREVIATIONS ............................................................................................... iv
ACKNOWLEDGEMENTS ................................................................................................................... v
EXECUTIVE SUMMARY ................................................................................................................... vii
1 Context for the Study ................................................................................................................. 1
1.1 Regions ............................................................................................................................ 3
1.2 Climate Change and Changing Hydrology ...................................................................... 3
2 Report Outline ............................................................................................................................. 5
3 Rapid Assessment of Regional Hydropower Inventories ....................................................... 6
3.1 Data Base ........................................................................................................................ 6
4 Regional Inventories ................................................................................................................... 7
4.1 Unit Size and Age ............................................................................................................ 7
4.2 Factors Affecting Rehabilitation ..................................................................................... 10
4.2.1 Impacts of Age and Operating Conditions ........................................................ 10
4.2.2 Lack of O&M & Spares ..................................................................................... 11
4.2.3 Reliability, Availability and Outages .................................................................. 12
4.3 Coarse Screening of Hydropower Station Data Bases .................................................. 12
4.3.1 Objectives for Screening ................................................................................... 12
4.3.2 The Rapid Assessment Tool ............................................................................. 13
4.3.3 Hydro Asset Trigger Age of Components ......................................................... 14
4.3.4 Overall Screening Results ................................................................................ 15
4.3.5 Limitations ......................................................................................................... 16
5 Feasibility of Hydropower Rehabilitation ............................................................................... 17
5.1 Approach to Rehabilitation Analysis .............................................................................. 17
5.2 Approach Applied to Regional Data Base ..................................................................... 17
5.3 Upgrade Potential and Benefits ..................................................................................... 18
5.3.1 Turbines ............................................................................................................ 18
5.3.2 Generators ........................................................................................................ 20
5.3.3 Stator Windings ................................................................................................. 20
5.3.4 Stator cores ....................................................................................................... 20
5.3.5 Rotors ............................................................................................................... 20
5.3.6 Exciters ............................................................................................................. 21
5.3.7 Ventilation ......................................................................................................... 21
5.3.8 Oil Free Lubrication........................................................................................... 21
5.3.9 Step-Up Transformers ...................................................................................... 22
iii
5.3.10 Supporting Systems (Balance of Plant) ............................................................ 22
5.3.11 Overall Reliability .............................................................................................. 22
5.4 Rehabilitation Scenarios ................................................................................................ 23
5.4.1 Life Extension ................................................................................................... 23
5.4.2 Upgrade ............................................................................................................ 24
5.5 Investment Costs ........................................................................................................... 25
5.6 Economic Analysis ......................................................................................................... 26
6 Market Assessment .................................................................................................................. 27
6.1 Results by Region .......................................................................................................... 27
6.1.1 Life Extension Scenario .................................................................................... 28
6.1.2 Upgrade Scenario ............................................................................................. 28
6.1.3 Results at Other Reference Years .................................................................... 28
6.2 Sensitivity Analysis ......................................................................................................... 29
7 LESSONS DRAWN FROM Rehabilitation Projects ................................................................ 31
7.1 Background .................................................................................................................... 31
7.2 Case Study Content ....................................................................................................... 31
7.3 Case Study Projects ...................................................................................................... 33
7.4 Case Studies Results..................................................................................................... 34
8 Hydro Rehabilitation Projects - Barriers and Incentives ...................................................... 35
8.1 Technical ........................................................................................................................ 35
8.1.1 Introduction to Failure Probability Concepts ..................................................... 35
8.1.2 Other Analytical Approaches ............................................................................. 37
8.1.3 Rehabilitation Outage Impacts on Meeting Load .............................................. 37
8.1.4 Project Expansions ........................................................................................... 37
8.1.5 Dam Safety Driven Rehabilitation ..................................................................... 38
8.2 Financial ......................................................................................................................... 39
8.3 Institutional, Environmental and Social .......................................................................... 43
8.3.1 Opportunities and Incentives ............................................................................ 43
8.3.2 Weak Institutional Capacity .............................................................................. 43
8.3.3 Weak Private Sector ......................................................................................... 43
8.3.4 Regulatory Changes ......................................................................................... 44
8.3.5 Changes in Watershed ..................................................................................... 44
9 Conclusions .............................................................................................................................. 45
9.1 Hydropower Assets Tool ................................................................................................ 45
9.2 Market Analysis of Hydropower Rehabilitation .............................................................. 45
9.3 Lessons Learned from Rehabilitation Case Studies ...................................................... 46
iv
9.3.1 Technical ........................................................................................................... 46
9.3.2 Contractual / Implementation ............................................................................ 46
9.3.3 Institutional / Financial ...................................................................................... 47
9.3.4 Rehabilitation Projects - Barriers and Incentives .............................................. 48
References ....................................................................................................................................... 49
Tables
Table 4.1 Regional Data Base Plant Characteristics ............................................................................................ 7 Table 4.2 Suggested classification for assessment of plant availability (due diligence). .................................. 12 Table 4.3 Rapid Assessment Ratings ................................................................................................................ 14 Table 4.4 Country Summary Africa. .................................................................................................................. 15 Table 4.5 Country Summary Central America. ................................................................................................. 16 Table 5.1 Summary of Life Extension Benefits** ............................................................................................. 23 Table 5.2 Summary of Upgrade Benefits. ......................................................................................................... 24 Table 6.1 Economic Analysis of the Rehabilitation Potential for Africa and Central America by Year ** ........ 27 Table 6.2 Sensitivity Analysis of the Economic Rehabilitation Potential. ......................................................... 30 Table 7.1 Outline of Case Study Content .......................................................................................................... 32 Table 8.1 Example of one component of a risk register. .................................................................................. 41
Figures
Figure 1.1 The figure illustrates how energy production is lost over time. The Upgrade vs Life extension....... 1 Figure 1.3 Map of selected regions for study. .................................................................................................... 3 Figure 4.1 Typical Hydroelectric Station Configuration for a Kaplan turbine. .................................................. 10 Figure 5.1 Typical Hydropower Equipment Cost Data (Greenfield and Rehabilitation) ................................... 25 Figure 6.1 Variation of NPV for Various Assessment Years. ............................................................................. 29 Figure 8.1 Typical Failure-Probability Curve. .................................................................................................... 36 Figure 8.2 Assessment of Station Expansion or Redevelopment Potential ...................................................... 38
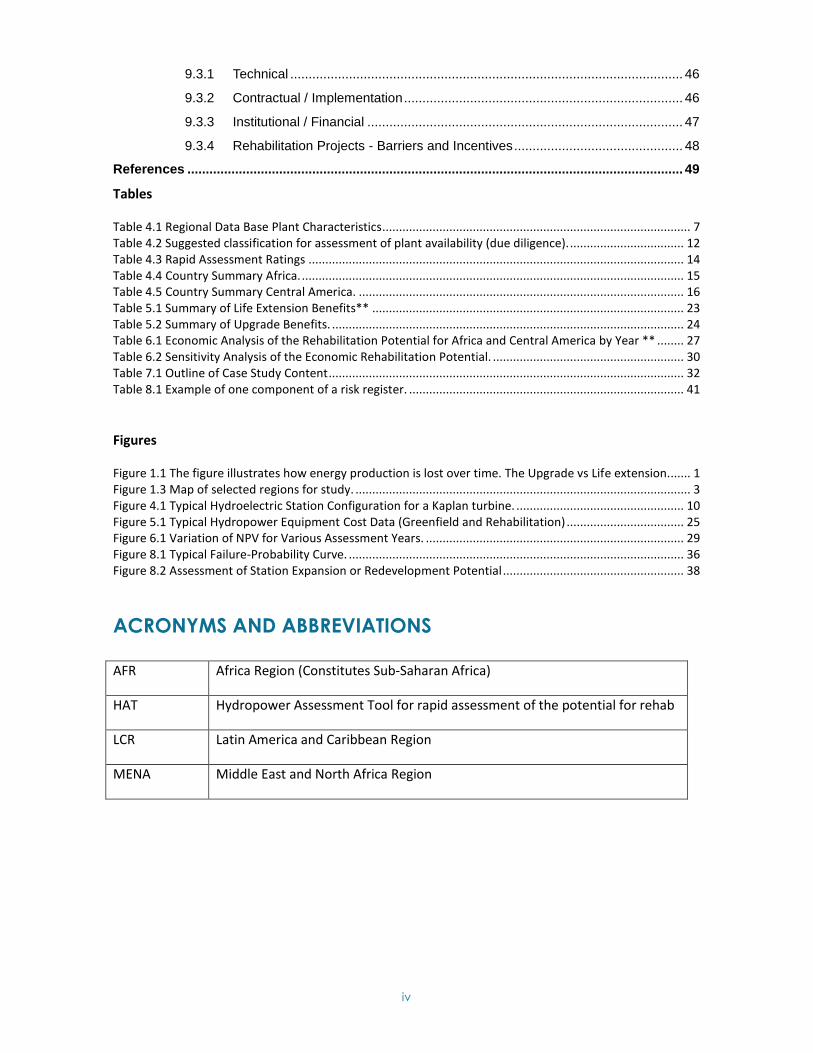
ACRONYMS AND ABBREVIATIONS
AFR Africa Region (Constitutes Sub-Saharan Africa)
HAT Hydropower Assessment Tool for rapid assessment of the potential for rehab
LCR Latin America and Caribbean Region
MENA Middle East and North Africa Region
v
ACKNOWLEDGEMENTS
The funding for this work has been provided by ESMAP and PPIAF.
The report was written by Oeyvind Espeseth Lier and Joseph Goldberg.
The foundation for this work was laid several years ago, beginning with a World Bank publication
describing a framework for policy and decision-making on dam and hydro plant rehabilitating and
uprating that was published by Donal O’Leary and Alessandro Palmieri in 2004. This work was
furthered by Daryl Fields and supported by Lars Ødegaard who initiated this work, until the current
team entered the picture. Thanks to all of the above for laying a solid foundation for this report.
This report is based on work undertaken by Hatch Ltd between 2009 and 2011 and draws on their
experience in rehabilitation projects worldwide.
The team has furthermore been supported by efforts from the peer reviewers. From the World
Bank Alessandro Palmieri and Dejan Ostojic. External peer reviewers were Francois Czerwinski
(ALSTOM) and Peter Mageuer (Andritz Hydro).
The following World Bank staff has provided further content and assistance: Omar Lyasse, Ahmad
Slaibi, Pekka Kalemi Salminen, Zenaida Chavez, Victoria Minoian, Rikard Liden, Amanda McMahon,
Immaculate Bampadde, Hywon Cha Kim, Linda Adigwe, Refat Abdallah, Parivash Mehrdadi Kishore
Nadkarni, Dmytro Glazkov, Clemencia Torres de Mastle, Pankaj Gupta, Samuel O’Brian, Marcus
Wishart and Andrey Gurevich.
Data has been given to us by our clients in the regions. A special thanks to all those involved in
compiling and extracting historical data utilized in this report.

vi
APPROVING MANAGER
Julia Bucknall, Sector Manager, TWIWA
CONTACT INFORMATION
This paper is available online at http://www.worldbank.org/water. The authors may also be
contacted through the Water Help Desk at [email protected].
DISCLAIMER
This volume is a product of the staff of the International Bank for Reconstruction and
Development/The World Bank. The findings, interpretations, and conclusions expressed in
this paper do not necessarily reflect the views of the Executive Directors of The World Bank
or the governments they represent.
The World Bank does not guarantee the accuracy of the data included in this work. The
boundaries, colors, denominations, and other information shown on any map in this work
do not imply any judgment on the part of The World Bank concerning the legal status of any
territory or the endorsement or acceptance of such boundaries
The material in this publication is copyrighted. Copying and/or transmitting portions or all
of this work without permission may be a violation of applicable law. The International Bank
for Reconstruction and Development/The World Bank encourages dissemination of its work
and will normally grant permission to reproduce portions of the work promptly. For
permission to photocopy or reprint any part of this work, please send a request with
complete information to the Copyright Clearance Center, Inc., 222 Rosewood Drive,
Danvers, MA 01923, USA; telephone 978-750-8400; fax 978-750-4470; http://www.copy-
right.com/. All other queries on rights and licenses, including subsidiary rights, should be
addressed to the Office of the Publisher, The World Bank, 1818 H Street NW, Washington,
DC 20433, USA; fax 202-522-2422; e-mail: [email protected]
Rehabilitation of Hydropower
vii
EXECUTIVE SUMMARY
1. Size of the hydroelectric plant rehabilitation market. The market for hydroelectric plant rehabilitation (abstracting from major civil works modifications to headworks to alter river flows) is large in developing countries, both absolutely and even more significantly, proportionally to total power generation and energy production. Part of this study was devoted to development of a coarse screening tool device (the hydropower assessment tool) which, applied to a proprietary data base, results in inventories of existing plants in two regions of the world - continental Africa and Central America and Mexico. These plants sum to a total capacity of over 22,000 MW in Africa and 15,000 MW in Central America and Mexico assets which if they had to be replaced today would require US$ 50 - 100 billion in Greenfield costs, and of course years of planning and construction. Of those totals, 8500 MW in Africa and nearly 3800 MW in Central America1 are over 35 years old, not old for the headworks which house and serve the generating plants themselves, but approaching replacement age for various electro-mechanical assemblies in the plants. Within the next decade, these aggregate plant capacities will roughly double to 16,500 MW in Africa and 8600 MW in Central America. This then, for only two regions of the developing world, is the large and important market for hydroelectric plant rehabilitation. 2. Scenarios of choice and scenarios of necessity. In developed countries and more fortunate developing countries, there is always some redundancy in energy sources which permit well-planned maintenance programs for hydroelectric plants, and replacement of parts and entire assemblies on a fairly routine basis. The funding for such measures is also needed, either by publicly regulated private utility businesses, or government entities of various types. Much of the discussion of this report concerns the technical, cost, and benefit factors which impact decisions on when larger investments, such as those involving full-scale rehabilitation or replacement of major equipment, should be made, what types of rehabilitation might be implemented, how much this might cost, what problems might arise, and what benefits might be achieved. These are all scenarios of choice. If, however, no investment action is taken, the scenario becomes one of necessity. Eventually plant deterioration will pass the stages of efficiency loss and occasional breakdown and outages, and approach total collapse, where the entire value of the plant, the headworks itself is not only at stake, but represents an increasing safety risk. Such factors as a shortage of funds, perceived impossibility of shedding load to permit opportunities for rehabilitation, political myopia or conflict, among others, can pose serious challenges. Many of the plants in this data base are over 70 years old, quite a few over 90. Anecdotally, many are in extremely poor condition, yet still absolutely necessary to their generation systems. One lesson of this exercise is to include hydro plants in rationally planned rehabilitation cycles before the period of choice ends, and that of emergency rehabilitation begins. To do otherwise is simply to waste the existing assets. 3. Greenfield projects versus rehabilitation. Though often couched in oppositional terms, there is no real dichotomy between true Greenfield hydroelectric projects and hydroelectric rehabilitation operations in terms of providing renewable energy to power systems. When major
1 In the remainder of the document, references to Central America include Costa Rica, Nicaragua, Panama,
Honduras, and El Salvador, as well as Mexico.

Rehabilitation of Hydropower
viii
new sources of renewable energy are needed in areas where good dam or run-of-river sites are available, Greenfield developments of various configurations must be considered. Rehabilitation is first about retaining and preserving what is already functioning, and then about possible incremental increases in capacity at existing sites, hopefully at reasonable cost and with minimal delay. The line be between the two may become blurred where major civil works modifications - including new tunnels, penstocks, bays for additional turbines and generators are built into existing headworks to permit major capacity additions. As such investments imply large changes in the handling of river flows, and thus to partake of the main character of site specific, Greenfield hydroelectric projects, they are not covered in detail in this report. Indeed, the lack of such major impacts on the natural environment (and by extension on the social environment) should be, and typically is, a major "advantage" of rehabilitation projects, in terms of preserving nature and saving time. On the other hand, the very complexities of Greenfield projects may rightly be seen as opportunities to create large public goods, like removing catastrophic peaks of floods, preserving environmental flows, and making rivers navigable, in addition to providing power and water for the dry season - goods far beyond the financing and implementation of rehabilitation projects. 4. Complications of rehabilitation. Despite the above, many rehabilitation projects do not proceed as simply, cheaply, or quickly as planned. Perhaps the largest problem is that mentioned above - extracting the working units from their constant generation program, first to possibly dismantle the units to make an accurate detailed assessment of the condition of each unit to determine the true costs and time of rewinding or replacement. Then, suppliers and consumers must prepare for the temporary outage. When this is compounded by increases in cost estimates when dismantling and detailed analysis finally does occur, political factors often enter to further delay and complicate project schedules. In some cases, this has actually forced years of waiting, e.g., for new thermal capacity to actually be installed in the system to permit this hydro outage. More common would be the stretching of the rehabiliation schedule to permit unit-by-unit rehabilitation. Then there are often debates within governments on the issue of like-for-like replacement of parts and assemblies, versus upgrades into more modern equipment. The former may not owe its force simply to institutional inertia - comfort with known equipment and processes. As a very mature technology, only very old hydroelectric equipment has very strong design efficiency handicaps (perhaps only 5-15%) against the most modern. By far the largest boost to performance (perhaps up to 30%) from rehabilitation will derive from the replacement of deteriorated equipment by new or rebuilt equipment, and this can be achieved with more traditional designs. New designs for major assemblies will require reviewing designs for all connected modules in the plant, to ensure that interrelated processes continue to work smoothly, and for agencies depleted of skilled engineers, or even of funds or time, this may argue for safety of like-for-like replacement - if the old equipment is still available. Finally, many rehabilitation projects do not escape the major safeguard (impact) issues of the past at all, but inherit as legacies the ignored environmental and social (especially resettlement) issues ignored by the original Greenfield projects planned and/or implemented 30 or 50 years before. And indeed this assessment is often correct, and put into practice. The critical political point which here needs to be made by the relevant political leadership, is that legacy issues are not brought by the rehabilitation project - only their potential solutions - and thus undue delay of the rehabilitation project on such grounds harms the very public goods ostensibly at stake.
Rehabilitation of Hydropower
1
1 CONTEXT FOR THE STUDY
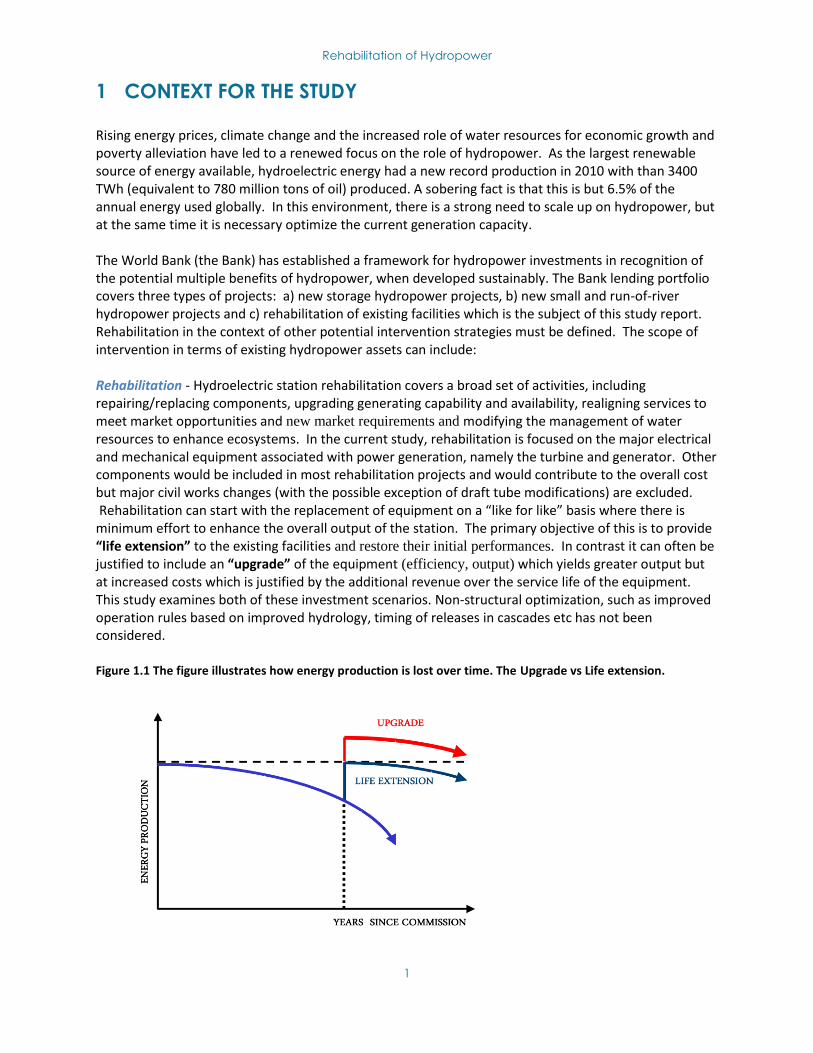
Rising energy prices, climate change and the increased role of water resources for economic growth and poverty alleviation have led to a renewed focus on the role of hydropower. As the largest renewable source of energy available, hydroelectric energy had a new record production in 2010 with than 3400 TWh (equivalent to 780 million tons of oil) produced. A sobering fact is that this is but 6.5% of the annual energy used globally. In this environment, there is a strong need to scale up on hydropower, but at the same time it is necessary optimize the current generation capacity. The World Bank (the Bank) has established a framework for hydropower investments in recognition of the potential multiple benefits of hydropower, when developed sustainably. The Bank lending portfolio covers three types of projects: a) new storage hydropower projects, b) new small and run-of-river hydropower projects and c) rehabilitation of existing facilities which is the subject of this study report. Rehabilitation in the context of other potential intervention strategies must be defined. The scope of intervention in terms of existing hydropower assets can include: Rehabilitation - Hydroelectric station rehabilitation covers a broad set of activities, including repairing/replacing components, upgrading generating capability and availability, realigning services to meet market opportunities and new market requirements and modifying the management of water resources to enhance ecosystems. In the current study, rehabilitation is focused on the major electrical and mechanical equipment associated with power generation, namely the turbine and generator. Other components would be included in most rehabilitation projects and would contribute to the overall cost but major civil works changes (with the possible exception of draft tube modifications) are excluded. Rehabilitation can start with the replacement of equipment on a “like for like” basis where there is minimum effort to enhance the overall output of the station. The primary objective of this is to provide “life extension” to the existing facilities and restore their initial performances. In contrast it can often be justified to include an “upgrade” of the equipment (efficiency, output) which yields greater output but at increased costs which is justified by the additional revenue over the service life of the equipment. This study examines both of these investment scenarios. Non-structural optimization, such as improved operation rules based on improved hydrology, timing of releases in cascades etc has not been considered. Figure 1.1 The figure illustrates how energy production is lost over time. The Upgrade vs Life extension.
Rehabilitation of Hydropower
2
Project Expansion – Hydroelectric generating stations have been known to have service lives of up to 100 years and in some instances even longer. Where the service life is long then it is quite likely that the station may not be developed to its economic potential based on today’s energy and capacity values and equipment cost and performance. In such instances an increase in station capacity (Project Expansion) by installing additional generating units can be justified. In most cases significant increases in station capacity will require installation of additional units, which if not foreseen and prepared for in the original design/construction will likely require major civil works. Such cases of project expansion are not covered (except in passing) in this report. Project Redevelopment – In projects where the residual service life is too short to justify Rehabilitation or Project Expansion, Project Redevelopment can be considered. In this scenario the civil works (potentially a dam and power facilities) is redeveloped with completely new generating equipment. This scenario is not considered in this study since it, in most cases, requires extensive site-specific engineering studies including environmental and sustainability assessments which cannot be treated in a broad based manner as is being done for the current study. Greenfield Development – Greenfield development is the design and construction of a totally new generating station at a site not currently developed. Noted advantages of rehabilitation schemes compared to Greenfield developments are cost effectiveness, a shorter development and implementation schedule, lower hydrologic, socio-environmental and institutional risks, and decreased financing risk. Potential disadvantages of rehabilitations include unexpected technical problems, unexpected legacy environmental and social issues, unattained performance issues, losses and impacts associated with downtime and potential institutional issues. The hydroelectric industry has undergone several phases of project development over its roughly 110 years of existence. Up to the 1980’s, most of the developments occurred as Greenfield projects. However, with an increasingly strict regulatory environment and with competitive alternative sources of energy supply, the appetite for capital intensive Greenfield hydro projects diminished in the 1980’s and 1990’s. During this period, emphasis shifted to the improvement and upgrading of existing facilities that had aged significantly and for which substantial modernization and increase in efficiencies and output could be achieved at relatively modest cost. In addition to direct rehabilitation projects, deregulation and privatization of the industry introduced the need for technical and financial due diligence assessments, often as part of acquisition efforts. These projects usually involve assessment of the potential for upgrading, technical project improvements and enhancement of environmental and socioeconomic benefits. Significant generation benefits from improved efficiencies and improved/optimized plant operation as well as reductions in operation and maintenance costs, have traditionally provided the economic justification for rehabilitation projects. In most of the developed world, such projects also afford the opportunity to address environmental and socio-economic concerns associated with plant operations and these are usually incorporated in a relicensing process, resulting in sustainable conditions for plant operations. It is in this backdrop, as well as the recent increases in the costs of new construction, that the increasing value of hydroelectric station rehabilitation, as opposed to Greenfield development is recognized. While advantages of rehabilitation schemes have been identified and realized in developed countries, the practices surrounding rehabilitation schemes in developing countries are not as well documented.
Rehabilitation of Hydropower
3
1.1 Regions
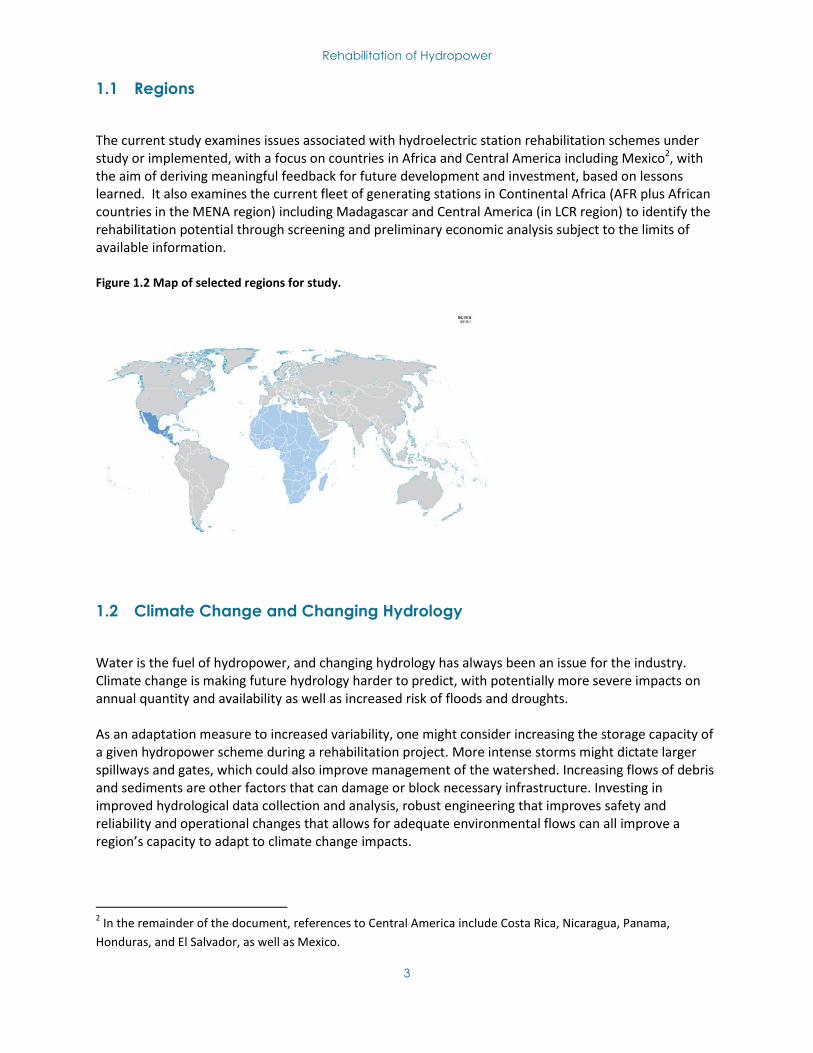
The current study examines issues associated with hydroelectric station rehabilitation schemes under study or implemented, with a focus on countries in Africa and Central America including Mexico2, with the aim of deriving meaningful feedback for future development and investment, based on lessons learned. It also examines the current fleet of generating stations in Continental Africa (AFR plus African countries in the MENA region) including Madagascar and Central America (in LCR region) to identify the rehabilitation potential through screening and preliminary economic analysis subject to the limits of available information. Figure 1.2 Map of selected regions for study.
1.2 Climate Change and Changing Hydrology
Water is the fuel of hydropower, and changing hydrology has always been an issue for the industry. Climate change is making future hydrology harder to predict, with potentially more severe impacts on annual quantity and availability as well as increased risk of floods and droughts. As an adaptation measure to increased variability, one might consider increasing the storage capacity of a given hydropower scheme during a rehabilitation project. More intense storms might dictate larger spillways and gates, which could also improve management of the watershed. Increasing flows of debris and sediments are other factors that can damage or block necessary infrastructure. Investing in improved hydrological data collection and analysis, robust engineering that improves safety and reliability and operational changes that allows for adequate environmental flows can all improve a region’s capacity to adapt to climate change impacts.
2 In the remainder of the document, references to Central America include Costa Rica, Nicaragua, Panama,
Honduras, and El Salvador, as well as Mexico.

Rehabilitation of Hydropower
4
The World Bank is mapping climate change data3 as well as its possible impacts on power systems4 and adaptive strategies to counter adverse risks. Typically the time scale involved with climate change exceeds the lifetime of equipment installed during a rehabilitation project. The operating demands might be predicted however, with more variability and more extreme weather to be expected. Integration of other, intermittent, renewable energy sources will have to be factored in as well. Future hydropower rehabilitation projects must consider these factors in combination with other demands on water infrastructure caused by climate change, including the values at risk and vulnerability of stakeholders as well as other project-specific risks.
3 The Climate Change Knowledge Portal http://sdwebx.worldbank.org/climateportal/
4 Hands-on Energy Adaptation Toolkit (HEAT) http://www.esmap.org/esmap/node/342

Rehabilitation of Hydropower
5
2 REPORT OUTLINE
Section 1 provides a concise summary of the results of the study and includes an overview of the
conclusions as well as lessons learned based on the assessment of the case studies.
Section 2 gives the context for the study including the definition of a set of hydroelectric project
development options as background to related discussions of rehabilitation later in the report.
Section 3 provides an overview of the contents of this report.
Section 4 discusses the development and application of an assessment tool to facilitate the Rapid
Assessment of Regional Hydropower Inventories. This assessment tool has been applied to a data
base/inventory of generating station information in the African and Central American regions to identify
possible candidates for rehabilitation. The characteristics of the two inventories are outlined in the
section and details of the approach and the results of the application of the tool to the two regions are
given in Annex A.
Section 5 presents a screening-level economic assessment model which quantifies potential costs and
benefits associated with hydropower rehabilitation, concluding with generally accepted economic
parameters. Details of the development of the economic model are given in Annex B.
Section 6 summarizes the application of the economic model to the two data base/inventory of
generating station information for the two regions (Africa and Central America). The application of the
economic model is not intended to provide site-specific economic parameters for each station since
there is insufficient information in the data base for this. The objective of modeling is to provide an
order-of magnitude Market Assessment of the potential for rehabilitation based on the limited data
available in the data base.
Section 7 presents a summary of the important elements of a number of case studies involving historical
Rehabilitation and Expansion Projects. The section is the source of a list of overall Lessons Learned
which is presented in the Conclusions section.
Section 8 is a summary of issues which covers the spectrum of Incentives to Barriers associated with the
rehabilitation of hydro projects under three broad categories: Technical, Financial and Environmental /
Institutional.
Section 9 contains a summary of the conclusions reached in the study.
Rehabilitation of Hydropower
6
3 RAPID ASSESSMENT OF REGIONAL HYDROPOWER INVENTORIES
Details regarding the Rapid Assessment Tool that has been developed to screen the data base for
projects can be found in Appendix A. the results of which application can be found in the next section.
3.1 Data Base
The UDI World Electric Power Plants Data Base5 (WEPP) has been used as the universe of hydropower
plants in Africa and Central America. The WEPP data base is a comprehensive, global inventory of
electric power generating units. It contains ownership, location, and engineering design data for power
plants of all sizes and technologies operated by regulated utilities, private power companies, and
industrial or commercial auto-producers in every country in the world.
The version that was purchased includes the best data available to the publisher as of March 2009. For
this study generating stations are called “plants” and the plants are composed of individual generating
“units” which can be examined individually in terms of rehabilitation. Characteristics of units can vary in
terms of capacity and year of commissioning so this allows a more accurate assessment to be carried
out.
5 http://www.platts.com This data base is published by Platts, a division of The McGraw Hill Companies, Inc.
Rehabilitation of Hydropower
7
4 REGIONAL INVENTORIES
The characteristics of the Africa and Central America WEPP data bases were examined as a preparatory
step to the application of the Rapid Assessment Tool. The following sections discuss the key
characteristics of the fleet of generating stations making up the two regional data bases.
4.1 Unit Size and Age
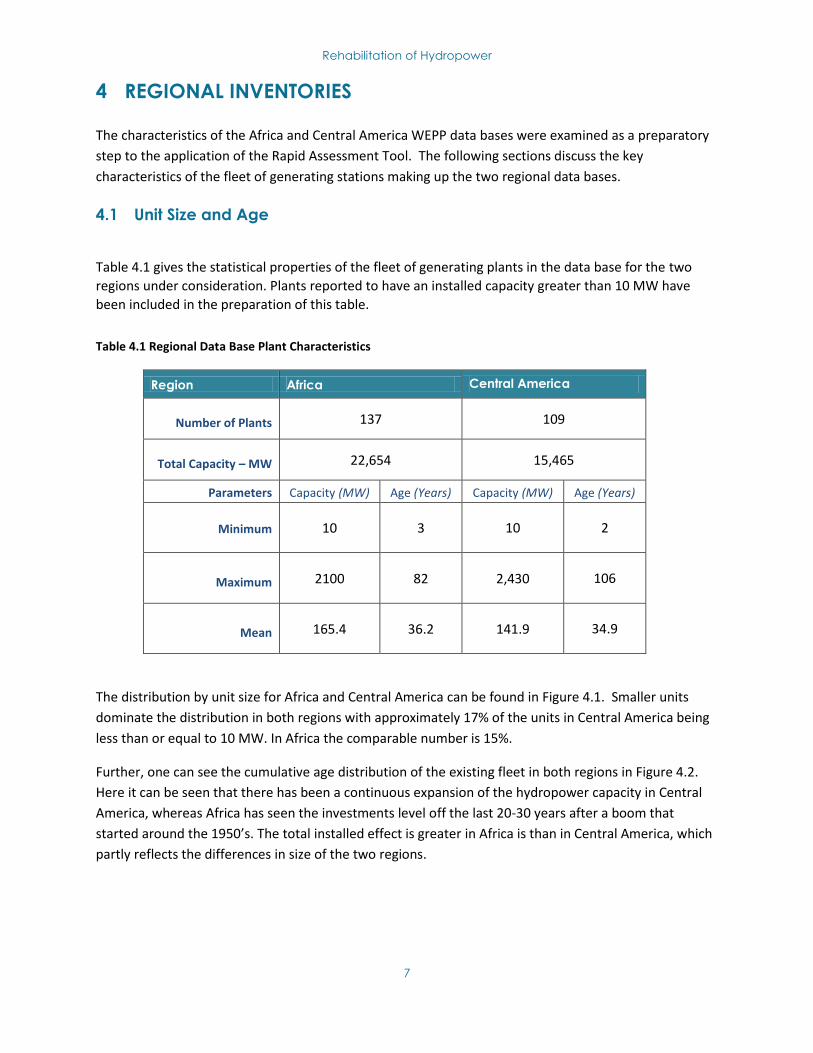
Table 4.1 gives the statistical properties of the fleet of generating plants in the data base for the two
regions under consideration. Plants reported to have an installed capacity greater than 10 MW have
been included in the preparation of this table.
Table 4.1 Regional Data Base Plant Characteristics
Region Africa Central America
Number of Plants 137 109
Total Capacity – MW 22,654 15,465
Parameters Capacity (MW) Age (Years) Capacity (MW) Age (Years)
Minimum 10 3 10 2
Maximum 2100 82 2,430 106
Mean 165.4 36.2 141.9 34.9
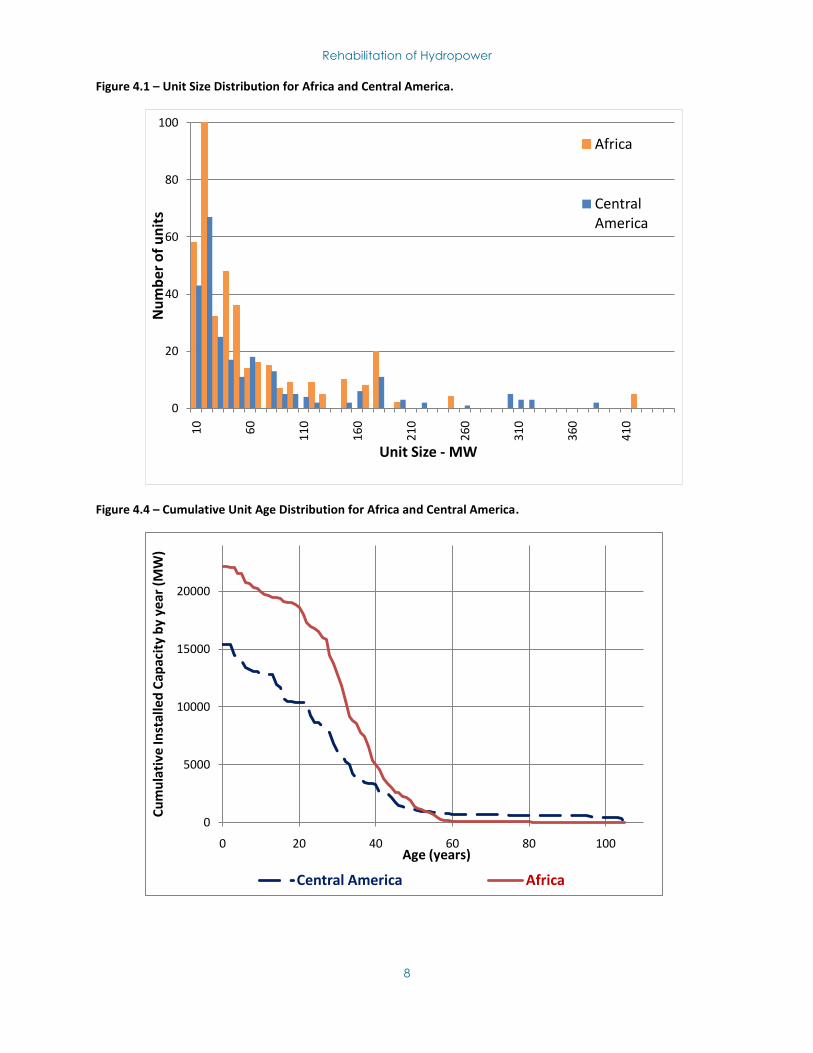
The distribution by unit size for Africa and Central America can be found in Figure 4.1. Smaller units
dominate the distribution in both regions with approximately 17% of the units in Central America being
less than or equal to 10 MW. In Africa the comparable number is 15%.
Further, one can see the cumulative age distribution of the existing fleet in both regions in Figure 4.2.
Here it can be seen that there has been a continuous expansion of the hydropower capacity in Central
America, whereas Africa has seen the investments level off the last 20-30 years after a boom that
started around the 1950’s. The total installed effect is greater in Africa is than in Central America, which
partly reflects the differences in size of the two regions.
Rehabilitation of Hydropower
8
Figure 4.1 – Unit Size Distribution for Africa and Central America.
Figure 4.4 – Cumulative Unit Age Distribution for Africa and Central America.
0
20
40
60
80
100
10
60
11
0
16
0
21
0
26
0
31
0
36
0
41
0
Nu
mb
er o
f u
nit
s
Unit Size - MW
Africa
Central America
0
5000
10000
15000
20000
0 20 40 60 80 100
Cu
mu
lati
ve In
stal
led
Cap
acit
y b
y ye
ar (
MW
)
Age (years)
Central America Africa
Rehabilitation of Hydropower
9
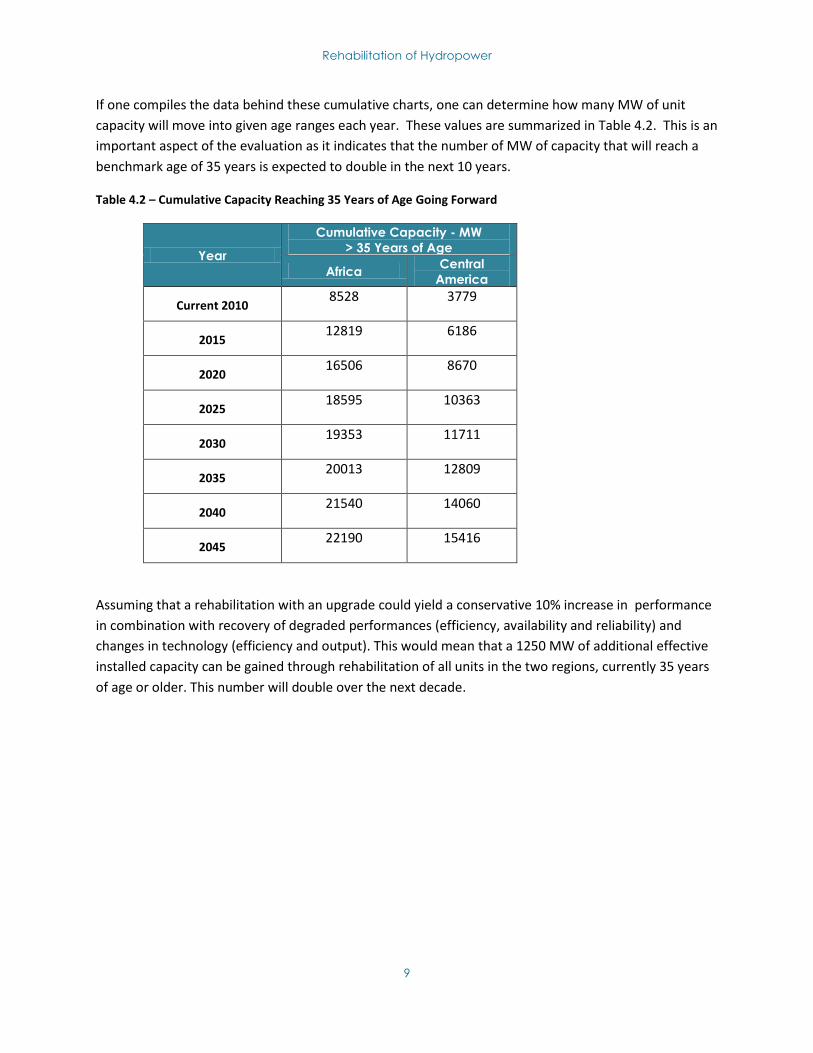
If one compiles the data behind these cumulative charts, one can determine how many MW of unit
capacity will move into given age ranges each year. These values are summarized in Table 4.2. This is an
important aspect of the evaluation as it indicates that the number of MW of capacity that will reach a
benchmark age of 35 years is expected to double in the next 10 years.
Table 4.2 – Cumulative Capacity Reaching 35 Years of Age Going Forward
Year
Cumulative Capacity - MW
> 35 Years of Age
Africa Central
America
Current 2010 8528 3779
2015 12819 6186
2020 16506 8670
2025 18595 10363
2030 19353 11711
2035 20013 12809
2040 21540 14060
2045 22190 15416
Assuming that a rehabilitation with an upgrade could yield a conservative 10% increase in performance
in combination with recovery of degraded performances (efficiency, availability and reliability) and
changes in technology (efficiency and output). This would mean that a 1250 MW of additional effective
installed capacity can be gained through rehabilitation of all units in the two regions, currently 35 years
of age or older. This number will double over the next decade.
Rehabilitation of Hydropower
10
4.2 Factors Affecting Rehabilitation
Rehabilitation is complex, and involves many engineering terms. The following section is to be
considered as an introduction to terms one might encounter in technical reports. The impacts of age and
operating conditions in terms of the various components are discussed below.
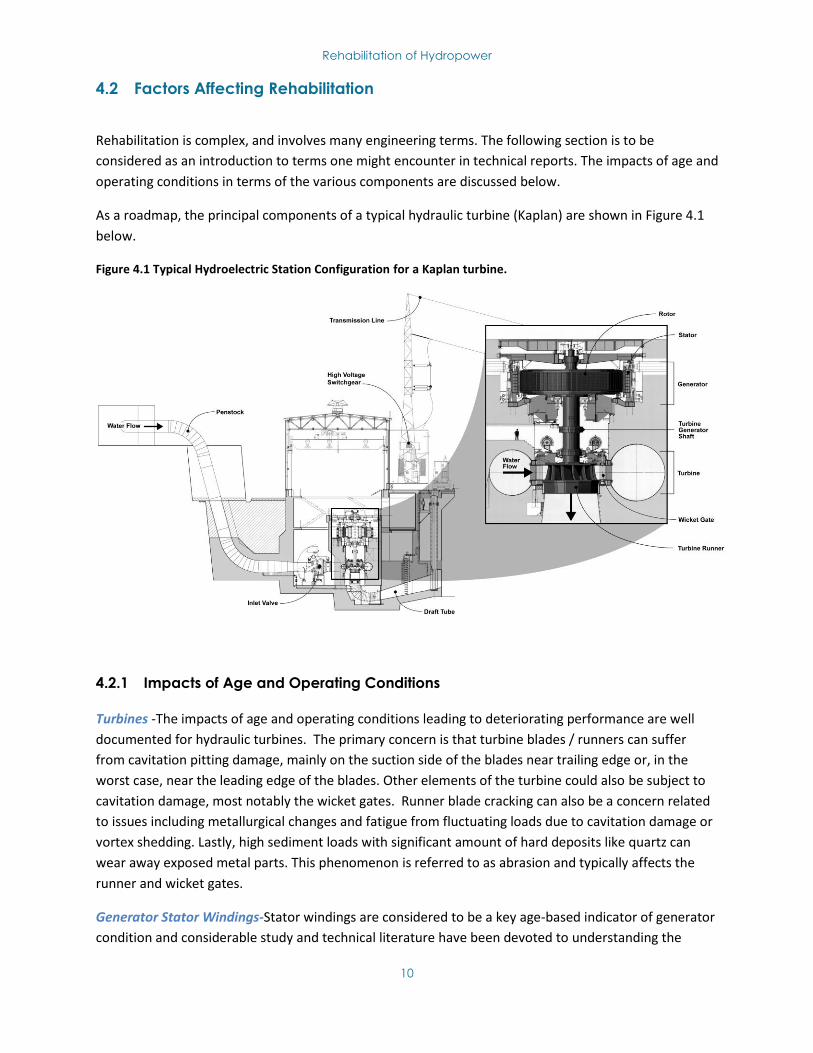
As a roadmap, the principal components of a typical hydraulic turbine (Kaplan) are shown in Figure 4.1
below.
Figure 4.1 Typical Hydroelectric Station Configuration for a Kaplan turbine.
4.2.1 Impacts of Age and Operating Conditions
Turbines -The impacts of age and operating conditions leading to deteriorating performance are well
documented for hydraulic turbines. The primary concern is that turbine blades / runners can suffer
from cavitation pitting damage, mainly on the suction side of the blades near trailing edge or, in the
worst case, near the leading edge of the blades. Other elements of the turbine could also be subject to
cavitation damage, most notably the wicket gates. Runner blade cracking can also be a concern related
to issues including metallurgical changes and fatigue from fluctuating loads due to cavitation damage or
vortex shedding. Lastly, high sediment loads with significant amount of hard deposits like quartz can
wear away exposed metal parts. This phenomenon is referred to as abrasion and typically affects the
runner and wicket gates.
Generator Stator Windings-Stator windings are considered to be a key age-based indicator of generator
condition and considerable study and technical literature have been devoted to understanding the
Rehabilitation of Hydropower
11
factors which influence winding life. Based on historical stators windings experience, statistical data
indicates that stator windings should generally provide 45 years (or more) of reliable operating life. A
review of operating records and reports would have to be carried out on a site-specific basis to
determine the actual soundness of the stator windings
Generator Rotor-A key element associated with the rotor other than the windings is the shape and
alignments as it affects the airgap between the rotor and stator during operation. Improper
performance during transient events such as field flashing, synchronization, over-speed, etc – under
certain circumstances could lead to a damaging rotor/stator ‘rub’. If ‘indicators’ on the unit operation
show potential problems then a comprehensive program of dynamic monitoring and analysis of the unit
geometry and mechanical response – i.e. airgap monitoring, vibration monitoring, etc. may be required.
Bearings-The shaft and bearings can take various configurations depending on the type and
manufacturer of unit. Many problems have been experienced with bearings and it is important to
monitor the bearing temperature. A key consideration with regard to bearings is that in a rehabilitation
involving a significant upgrade the ability of the existing bearing to take the load has to be carefully
considered.
Lubrication – Mineral oil & grease has long been used as a standard for lubrication of equipment such as
bearings, bushes, wicket gates journals, valve trunnions, governing oil pack, Kaplan runner hub etc. After
years of operation, there is a potential risk of leakage, which may lead to loss of lubrication and thus
damages plus the risk of polluting the environment.
Change of operating pattern – Initially designed for “base load” operations, some units are nowadays
tackling “peak load” needs and other ancillary services such as frequency regulation, support of other
intermittent renewable sources (wind, solar) etc. This increases the number of Starts & Stops per year
from few dozens per year to several hundreds per year, which have accelerated aging effects through
thermal cycling phenomena (e.g. generator) or fatigue issues (e.g. runner, mechanical parts)
4.2.2 Lack of O&M & Spares
A review of selected data has been undertaken to assess the typical operation and maintenance (O&M)
cost of hydroelectric projects in North America. These expenditures can vary widely, depending on a
variety of factors including location, capacity factor, generation strategy, manned versus unmanned
station, type of plant (reservoir or run-of-river), annual production (MWh), number of Starts & Stops,
etc. Typical O&M costs as a function of station capacity were described using the following power
functions based on North America experience.
Benchmark Function - Annual O&M Cost (2009 USD) = 105,600 x Installed Capacity (MW) 0.64743
Best Practices Function - Annual O&M Cost (2009 USD) = 58,100 x Installed Capacity (MW) 0.64743
Annual O&M for a 100 MW generating station would typically be $2.1 million as a benchmark value and
$1.2 million as a best practices value, a reduction of 55%.
There is anecdotal evidence that such norms are not being met in many areas of Africa due to a lack of
resources and funds. This could lead to a significant reduction in unit availability as well as operating
Rehabilitation of Hydropower
12
problems that are manifested in earlier equipment failure than would normally be expected under a
“Normal” or “Best Practices” O&M scenario.
4.2.3 Reliability, Availability and Outages
Reliability and availability of power as well as scheduled outages versus forced outages are easily
confused.
In this report, reliability refers to the time a hydropower plant is ready to deliver power. That is;
Reliability = 8760 hours/year – hours of forced outage
Here forced outage refers to unplanned stops due to failing equipment, mismanagement etc.
Availability also takes into account scheduled outages (i.e. maintenance etc). This gives;
Availability = Reliability –hours of scheduled outage
Key parameters that influence outages are for example; plant factor, sediment inflow, storage capacity
of reservoir, load patterns etc.
Transmission capacities and the overall power mix in the grid impacts the overall situation, and might
also spill back to a power station and lead to forced outages.
Blackouts refer to forced outage, where brownout refers to loadshedding that can be planned or
happen automatically
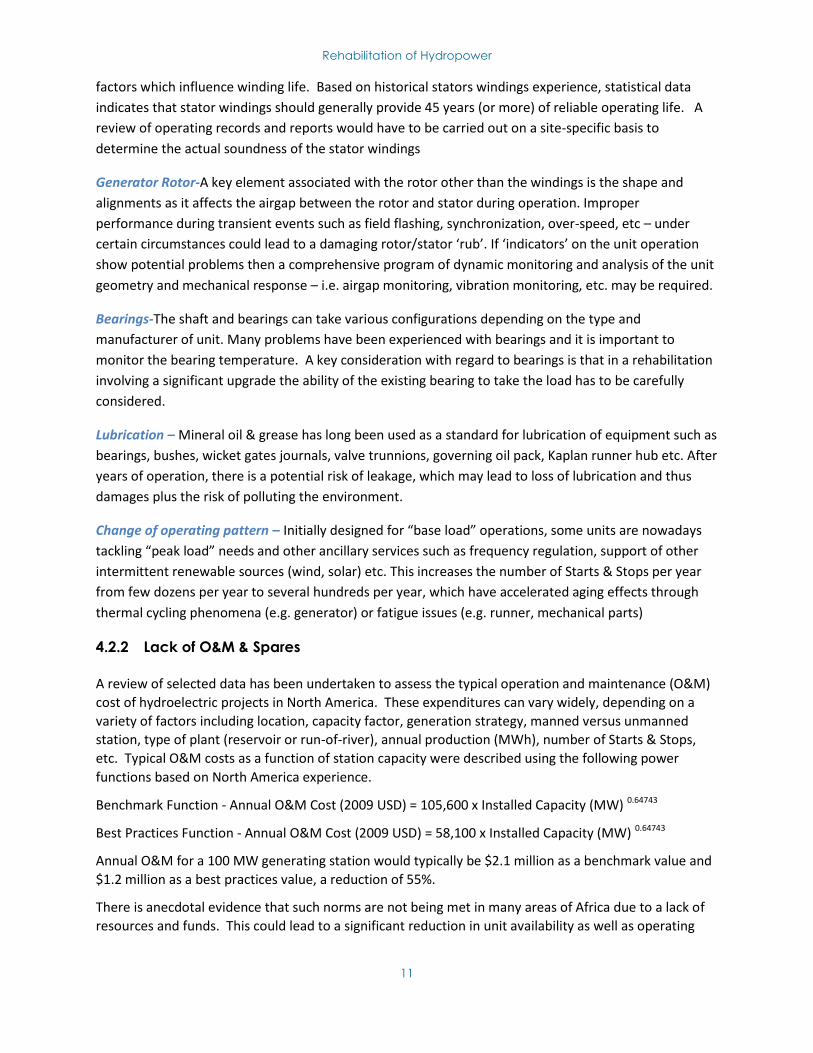
Table 4.2 Suggested classification for assessment of plant availability (due diligence).
Plant Availability Assessment
(hours/year) %
7000 or more A>80% Good
Between 7000 and 6000 68%<A>80% Poor
Less than 6000 A<68% Very Poor
4.3 Coarse Screening of Hydropower Station Data Bases
Given the obvious importance of age and its relative ease of determination, a coarse screening model
was developed for application to readily available hydropower station data bases. The following
sections outline the basis for the screening and an overview of the results with the details included in an
annex.
4.3.1 Objectives for Screening
The screening is intended to be used to carry out an initial assessment of the inventories of
hydroelectric stations to identify lists of potential candidate plants for rehabilitation. This could then be
further qualified through additional site-specific economic assessments using calculation procedures
similar to those outlined in Sections 5 and 6 of this report.
Rehabilitation of Hydropower
13
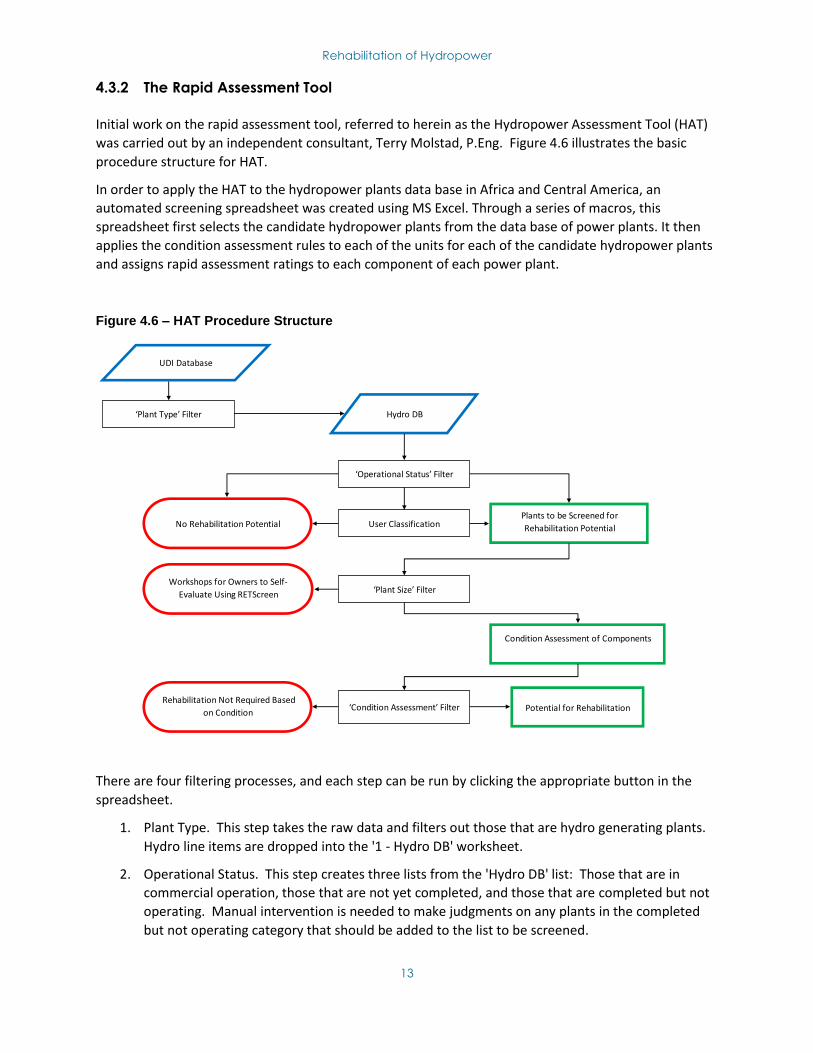
4.3.2 The Rapid Assessment Tool
Initial work on the rapid assessment tool, referred to herein as the Hydropower Assessment Tool (HAT)
was carried out by an independent consultant, Terry Molstad, P.Eng. Figure 4.6 illustrates the basic
procedure structure for HAT.
In order to apply the HAT to the hydropower plants data base in Africa and Central America, an
automated screening spreadsheet was created using MS Excel. Through a series of macros, this
spreadsheet first selects the candidate hydropower plants from the data base of power plants. It then
applies the condition assessment rules to each of the units for each of the candidate hydropower plants
and assigns rapid assessment ratings to each component of each power plant.
Figure 4.6 – HAT Procedure Structure
There are four filtering processes, and each step can be run by clicking the appropriate button in the
spreadsheet.
1. Plant Type. This step takes the raw data and filters out those that are hydro generating plants.
Hydro line items are dropped into the '1 - Hydro DB' worksheet.
2. Operational Status. This step creates three lists from the 'Hydro DB' list: Those that are in
commercial operation, those that are not yet completed, and those that are completed but not
operating. Manual intervention is needed to make judgments on any plants in the completed
but not operating category that should be added to the list to be screened.
Hydro DB
Plants to be Screened for
Rehabilitation PotentialNo Rehabilitation Potential
Rehabilitation Not Required Based
on Condition Potential for Rehabilitation
Workshops for Owners to Self-
Evaluate Using RETScreen
UDI Database
‘Plant Type’ Filter
‘Operational Status’ Filter
User Classification
‘Plant Size’ Filter
Condition Assessment of Components
‘Condition Assessment’ Filter
Rehabilitation of Hydropower
14
3. Plant Size. This step filters out those plants which are smaller than 10 MW. 10 MW was
selected as it was judged as being a lower limit on plant size which could be attractive for
International Financial Institution (IFI) funding. Other sources of funding would be more
commercially attractive for the smaller unit sizes. Those that are smaller are dropped into the '3
- RETScreen Workshops' worksheet. Those that are greater are dropped into the '3 - To
Condition Assessment' worksheet.
4. Condition Assessment. This step takes the line items from worksheet '3 - To Condition
Assessment' and creates an output sheet showing a rapid condition assessment of each
unit called '4 - Condition Assessment'. This step also establishes the opportunities for
turbine and turbine/generator upgrades.
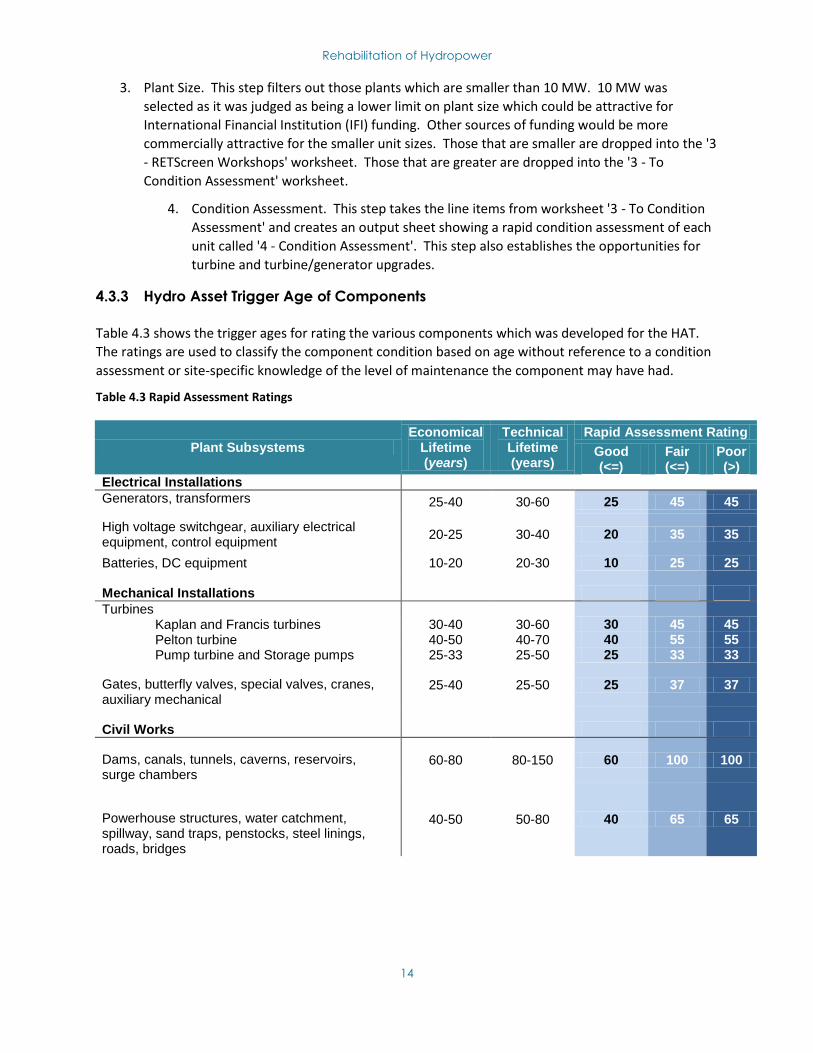
4.3.3 Hydro Asset Trigger Age of Components
Table 4.3 shows the trigger ages for rating the various components which was developed for the HAT.
The ratings are used to classify the component condition based on age without reference to a condition
assessment or site-specific knowledge of the level of maintenance the component may have had.
Table 4.3 Rapid Assessment Ratings
Plant Subsystems Economical
Lifetime (years)
Technical Lifetime (years)
Rapid Assessment Rating
Good (<=)
Fair (<=)
Poor (>)
Electrical Installations
Generators, transformers 25-40 30-60 25 45 45
High voltage switchgear, auxiliary electrical equipment, control equipment
20-25 30-40 20 35 35
Batteries, DC equipment 10-20 20-30 10 25 25
Mechanical Installations
Turbines
Kaplan and Francis turbines 30-40 30-60 30 45 45 Pelton turbine 40-50 40-70 40 55 55 Pump turbine and Storage pumps 25-33 25-50 25 33 33
Gates, butterfly valves, special valves, cranes, auxiliary mechanical
25-40 25-50 25 37 37
Civil Works
Dams, canals, tunnels, caverns, reservoirs, surge chambers
60-80 80-150 60 100 100
Powerhouse structures, water catchment, spillway, sand traps, penstocks, steel linings, roads, bridges
40-50 50-80 40 65 65
Rehabilitation of Hydropower
15
The trigger ages given in Table 4.3 are not universal to all regions of the world but are dependent on the
design and manufacture of the equipment, the O&M and the conditions under which the equipment
and structures have to operate. The trigger ages can be affected, among others, by the following
elements:
Original choice of configuration, quality of the major equipment and the care with which it was installed
Existence of a proper maintenance programme
Operational pattern (start & stop vs. base load)
Extreme operating conditions
Sediment load
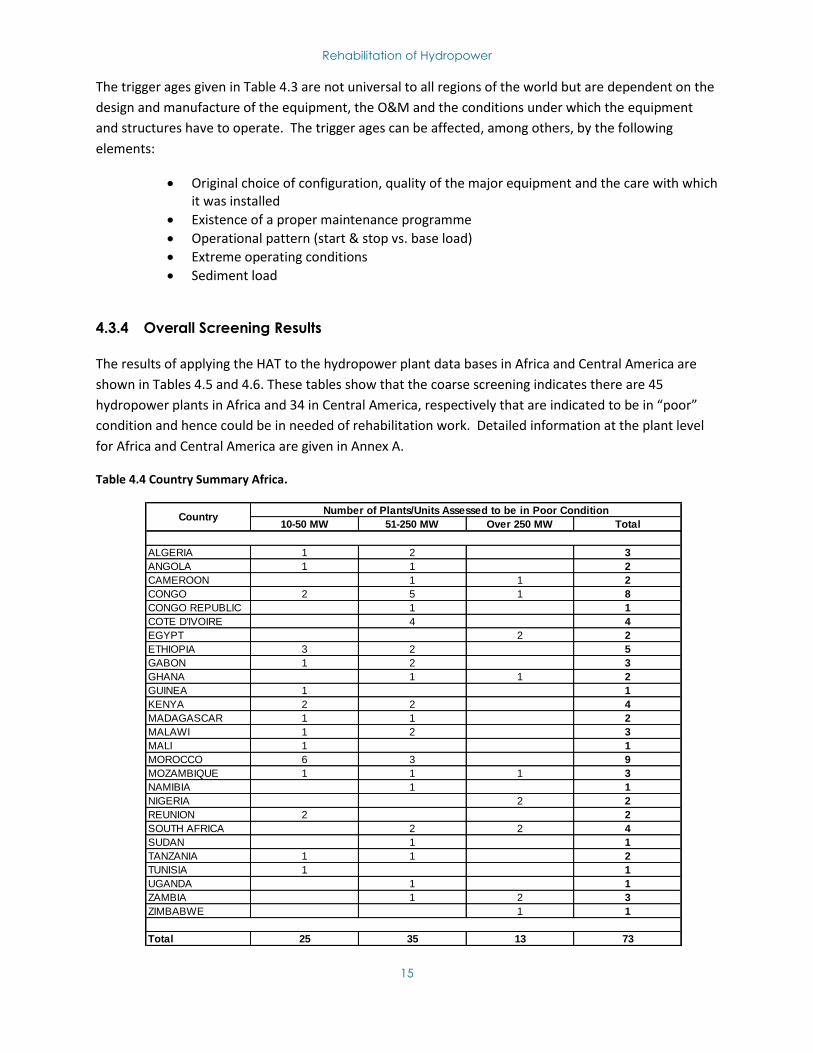
4.3.4 Overall Screening Results
The results of applying the HAT to the hydropower plant data bases in Africa and Central America are
shown in Tables 4.5 and 4.6. These tables show that the coarse screening indicates there are 45
hydropower plants in Africa and 34 in Central America, respectively that are indicated to be in “poor”
condition and hence could be in needed of rehabilitation work. Detailed information at the plant level
for Africa and Central America are given in Annex A.
Table 4.4 Country Summary Africa.
10-50 MW 51-250 MW Over 250 MW Total
ALGERIA 1 2 3
ANGOLA 1 1 2
CAMEROON 1 1 2
CONGO 2 5 1 8
CONGO REPUBLIC 1 1
COTE D'IVOIRE 4 4
EGYPT 2 2
ETHIOPIA 3 2 5
GABON 1 2 3
GHANA 1 1 2
GUINEA 1 1
KENYA 2 2 4
MADAGASCAR 1 1 2
MALAWI 1 2 3
MALI 1 1
MOROCCO 6 3 9
MOZAMBIQUE 1 1 1 3
NAMIBIA 1 1
NIGERIA 2 2
REUNION 2 2
SOUTH AFRICA 2 2 4
SUDAN 1 1
TANZANIA 1 1 2
TUNISIA 1 1
UGANDA 1 1
ZAMBIA 1 2 3
ZIMBABWE 1 1
Total 25 35 13 73
CountryNumber of Plants/Units Assessed to be in Poor Condition
Rehabilitation of Hydropower
16
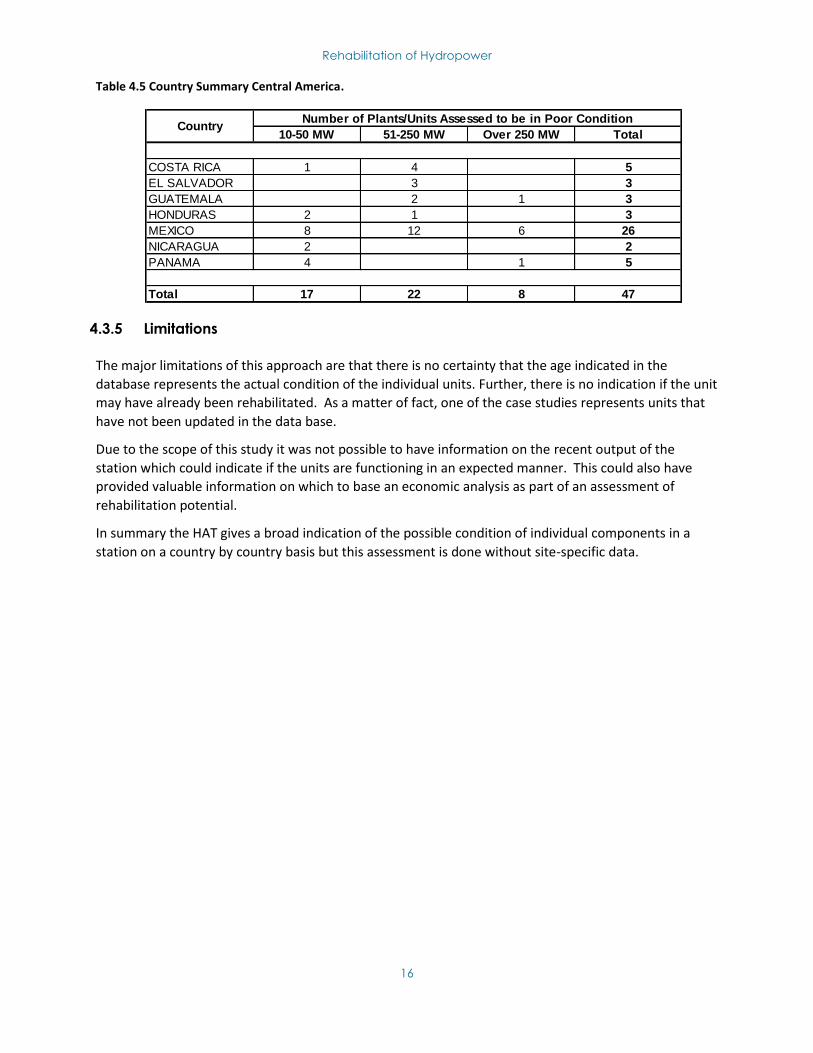
Table 4.5 Country Summary Central America.
4.3.5 Limitations
The major limitations of this approach are that there is no certainty that the age indicated in the
database represents the actual condition of the individual units. Further, there is no indication if the unit
may have already been rehabilitated. As a matter of fact, one of the case studies represents units that
have not been updated in the data base.
Due to the scope of this study it was not possible to have information on the recent output of the
station which could indicate if the units are functioning in an expected manner. This could also have
provided valuable information on which to base an economic analysis as part of an assessment of
rehabilitation potential.
In summary the HAT gives a broad indication of the possible condition of individual components in a
station on a country by country basis but this assessment is done without site-specific data.
10-50 MW 51-250 MW Over 250 MW Total
COSTA RICA 1 4 5
EL SALVADOR 3 3
GUATEMALA 2 1 3
HONDURAS 2 1 3
MEXICO 8 12 6 26
NICARAGUA 2 2
PANAMA 4 1 5
Total 17 22 8 47
CountryNumber of Plants/Units Assessed to be in Poor Condition
Rehabilitation of Hydropower
17
5 FEASIBILITY OF HYDROPOWER REHABILITATION
5.1 Approach to Rehabilitation Analysis
Typical rehabilitation analysis for hydroelectric generating stations balances the consequences of outage
against capital costs to manage long-term plant reliability at minimum cost. The type of rehabilitation
being considered in this assessment is concerned only with major electrical and mechanical equipment
and not with the civil aspects of the generating station. Civil works can be part of the upgrade as well.
Sometimes one will want to improve the waterway capacity to reduce losses or increase the discharge,
move the intake to increase head, reduce the sediment load entering the system or deal with dam
safety issues.
The impacts of upgrading components must be evaluated by its impact on the entire system. As for
Greenfield projects, any additional power must have a market (PPA or other) and capacity to reach that
market (transmission). Flow changes downstream may also affect other stakeholders, etc.
Typical tasks associated with rehabilitation analysis include:
A site visit to the powerhouse to inspect the generating unit preferably during a period of
regular maintenance.
Review of previous turbine / generator condition assessments and maintenance records and
interviews of plant maintenance personnel
Undertake condition assessment of equipment as this is an important part of rehabilitation
analysis. This information can be used to establish a representative, as opposed to physical age,
of the equipment.
Develop cost estimates and schedules for life extension and / or upgrade options
Develop efficiency curves for the current units as the units with life extension or upgraded
options based on parameters established from previous experience (Note that Section 2
provides a definition of the life extension and upgrade options as they apply to rehabilitation)
Finalize performance characteristics in terms of efficiency and capacity for possible life
extension / upgrade options
Quantify the cost streams associated with the various rehabilitation scenarios. It would be good
practice to: a) assume the lower end of physical condition ranges in cost estimation; and b)
assess fairly high (e.g. 10% or higher) physical contingencies where the client has not had
experience in rehabilitation and particularly if the unit has not been dismantled prior to cost
estimation (or if it is the first in a multi-unit rehabilitation).
Provide an economic analysis of the life extension / upgrade option and present the benefits
and costs of each.
5.2 Approach Applied to Regional Data Base
The current study examines the potential feasibility of rehabilitation for the fleet of generating units in
the African and Central American regions of the world that are part of plants with a total installed
capacity of over 10 MW. Therefore a simplified approach has been adopted since inspection, condition
Rehabilitation of Hydropower
18
assessments and maintenance and operating information was not available for the respective
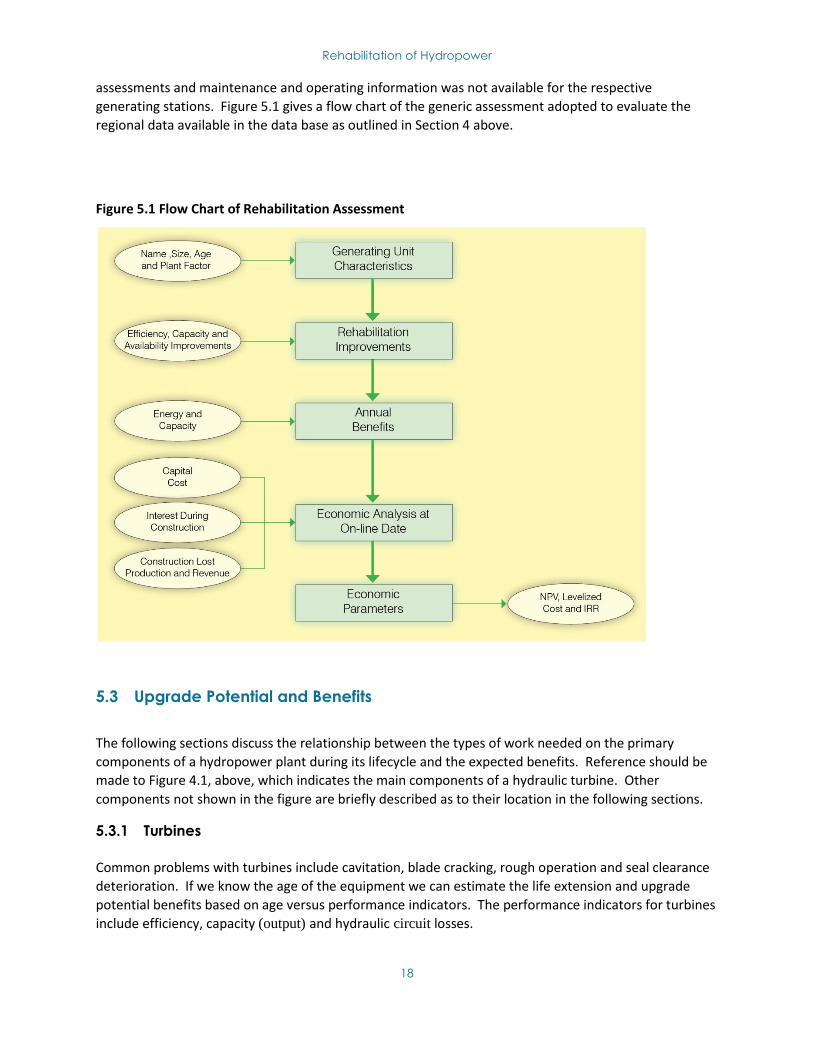
generating stations. Figure 5.1 gives a flow chart of the generic assessment adopted to evaluate the
regional data available in the data base as outlined in Section 4 above.
Figure 5.1 Flow Chart of Rehabilitation Assessment
5.3 Upgrade Potential and Benefits
The following sections discuss the relationship between the types of work needed on the primary
components of a hydropower plant during its lifecycle and the expected benefits. Reference should be
made to Figure 4.1, above, which indicates the main components of a hydraulic turbine. Other
components not shown in the figure are briefly described as to their location in the following sections.
5.3.1 Turbines
Common problems with turbines include cavitation, blade cracking, rough operation and seal clearance
deterioration. If we know the age of the equipment we can estimate the life extension and upgrade
potential benefits based on age versus performance indicators. The performance indicators for turbines
include efficiency, capacity (output) and hydraulic circuit losses.
Rehabilitation of Hydropower
19
Efficiency
Efficiency is the most important factor and upgrade potential can be broken out into three elements:
Technology improvement as demonstrated by higher efficiencies today than 50 years ago
Deterioration in efficiency due to age (wear and tear)
Changes in hydrological conditions or operations could lead to changes in the operating range
compared to initial design.
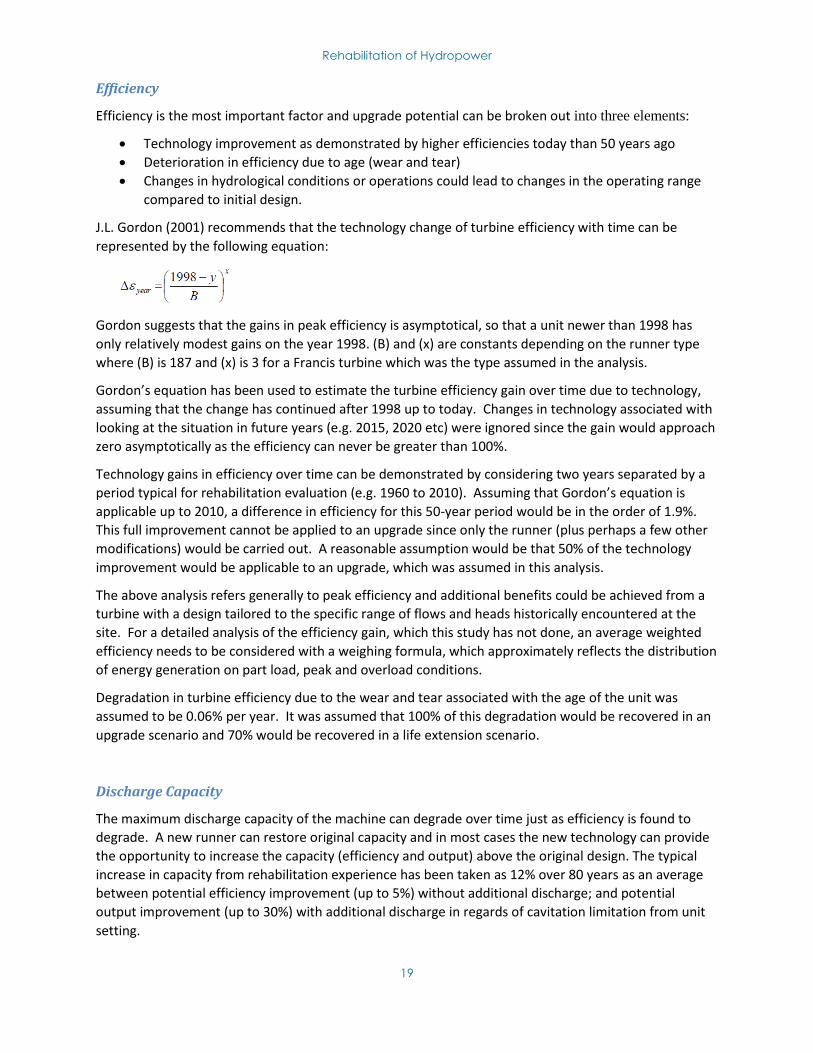
J.L. Gordon (2001) recommends that the technology change of turbine efficiency with time can be
represented by the following equation:
Gordon suggests that the gains in peak efficiency is asymptotical, so that a unit newer than 1998 has
only relatively modest gains on the year 1998. (B) and (x) are constants depending on the runner type
where (B) is 187 and (x) is 3 for a Francis turbine which was the type assumed in the analysis.
Gordon’s equation has been used to estimate the turbine efficiency gain over time due to technology,
assuming that the change has continued after 1998 up to today. Changes in technology associated with
looking at the situation in future years (e.g. 2015, 2020 etc) were ignored since the gain would approach
zero asymptotically as the efficiency can never be greater than 100%.
Technology gains in efficiency over time can be demonstrated by considering two years separated by a
period typical for rehabilitation evaluation (e.g. 1960 to 2010). Assuming that Gordon’s equation is
applicable up to 2010, a difference in efficiency for this 50-year period would be in the order of 1.9%.
This full improvement cannot be applied to an upgrade since only the runner (plus perhaps a few other
modifications) would be carried out. A reasonable assumption would be that 50% of the technology
improvement would be applicable to an upgrade, which was assumed in this analysis.
The above analysis refers generally to peak efficiency and additional benefits could be achieved from a
turbine with a design tailored to the specific range of flows and heads historically encountered at the
site. For a detailed analysis of the efficiency gain, which this study has not done, an average weighted
efficiency needs to be considered with a weighing formula, which approximately reflects the distribution
of energy generation on part load, peak and overload conditions.
Degradation in turbine efficiency due to the wear and tear associated with the age of the unit was
assumed to be 0.06% per year. It was assumed that 100% of this degradation would be recovered in an
upgrade scenario and 70% would be recovered in a life extension scenario.
Discharge Capacity
The maximum discharge capacity of the machine can degrade over time just as efficiency is found to
degrade. A new runner can restore original capacity and in most cases the new technology can provide
the opportunity to increase the capacity (efficiency and output) above the original design. The typical
increase in capacity from rehabilitation experience has been taken as 12% over 80 years as an average
between potential efficiency improvement (up to 5%) without additional discharge; and potential
output improvement (up to 30%) with additional discharge in regards of cavitation limitation from unit
setting.
Rehabilitation of Hydropower
20
An additional benefit of new hydraulic designs is that they are more adapted to pressure fluctuations,
resulting in an increased operational range. This applies especially to Francis turbines with older design.
Hydraulic Losses
Breakdown in losses between the various components (draft tube – runner – wicket gate) of the turbine
show that the runner accounts for only 35% to 40% of the losses in a hydraulic turbine. Therefore, if
only a runner is replaced then the impact is not as large as if the entire unit were replaced. The cost of
the unit replacement (upgrade and not life extension) is considerably higher as outlined in subsequent
sections of the report.
5.3.2 Generators
The key condition considerations for generators are stator windings, stator cores, rotors , exciters and
ventilation losses.
5.3.3 Stator Windings
Capacity - The major electric upgrade which is applied to generators is the rewinding of the stator.
Given the improvements in technology the required thickness of insulation is reduced in comparison
with the original insulation. Changes in technology could be expected to have a rough timeline on the
types of winding in use as outlined below:
1930 - 1955 - Soft installations – initially shellac-bonded mica splittings evolving into asphaltic-bonded
mica splitting. For windings pre-1955, a 15 % capacity (output) increase keeping the same dimensions, is
probably realizable with a switch to modern windings.
1955 – 1970 - Gradual introduction of synthetic resins – first polyester then epoxy, silicon and
polyurethane with progression from Class B to Class F insulation. For ~1955 - ~1970 capacity increases
of 7.5 to 10% are probably possible as true thin, ‘hard’ class F insulation was not generally applied.
1970 onwards - Virtually all stator windings use advanced polyester resin or epoxy resins in Class F
‘hard’ insulation systems. Post ~1970 minimal capacity gains are possible through refinements in
insulation thickness / voltage gradients / thermal transfer etc.
Efficiency - It should be noted that generator efficiency has not changed much over this time horizon.
The main improvement has been on the capacity size since modern insulation has allowed higher heat
levels and given more room for the copper windings. For this study a small increase in efficiency could
be anticipated due to newer technology and this has been assumed as a total of 0.5 % over the period
from 1930 to today.
5.3.4 Stator cores
New materials allow lower iron losses in stator core compared to the old generation of materials. The
increase in efficiency, which will result of the use of this new technology, has to be considered in case of
upgrade.
5.3.5 Rotors
The total replacement of a rotor is rare so the scope of work would be limited to the rehabilitation of
the pole windings and connections which would yield another 30 years of service. This has been
Rehabilitation of Hydropower
21
assumed as part of the additional cost which would extend the service life but it would not contribute to
an increase in output.
5.3.6 Exciters
Generators require a direct current to energize the magnetic field and this is normally obtained from the
exciter. Rehabilitation offers a chance for the existing exciters to be replaced with more adapted
excitation technology. This has been assumed as part of the additional cost which would extend the
service life but would not contribute to an increase in output.
Static Excitation: available for all voltage (up to thousands of amps), this technology allows quick time
response, high level features, such as PSS. Static excitation is best suited for medium to large hydro
schemes.
Brushless Excitation (rotating diodes): available for low voltage only (up to 40 or 50 Amps), this
technology is lower performing but requires less investment and maintenance (no carbon dust to clean
on a regular basis). Brushless excitation is best suited for small to medium hydro schemes.
5.3.7 Ventilation
The main target is to reduce the ventilation losses of the generator, thus improving the efficiency. The
challenge is to reduce the cooling air flow without increasing the active parts’ (stator and rotor
windings) temperatures. Such analysis can be applied to generators with old ventilation system concept.
More focus on medium/high speed generators ( >250rpm). Potential in efficiency improvement up to
0.3% can be expected. To achieve such results, it is mandatory to optimize key parameters such as
cooling air velocity at the outlet of the fan, relative speed of the air at rotor inlet, flow distribution, heat
transfer coefficients.
5.3.8 Oil Free Lubrication
Leakages of mineral oil and grease pollute the river and have an impact on irrigation, water supply,
aquatic life, fishing etc. To mitigate the potential risk, it is possible to upgrade the following components
with oil free lubrication:
Water lubricated bearings
Oil free Kaplan runner (water filled hub)
Self-lubricated bushings (Wicket gates, Kaplan blades, Valve journals or trunnions, Vane rollers)
Governing system with biodegradable and low toxic oil.
Rehabilitation of Hydropower
22
5.3.9 Step-Up Transformers
The majority of the failures can be traced to breakdown of insulation. The transformers would have to
be replaced to match the increase (upgrade not life extension) in output from the turbine and
generator. The efficiency gain would be small and has been neglected in this analysis.
5.3.10 Supporting Systems (Balance of Plant)
These components are highly impacted in term of availability & reliability rate when getting older.
Replacement of the supporting systems can normally be done as part of the life extension of the major
components. This has been assumed as part of the additional cost of the rehabilitation which would
extend the service life but would not contribute to an increase in output.
5.3.11 Overall Reliability
Restoring reliability (and availability) of energy is a key benefit of any life restoration or upgrade. In
assessing the feasibility of rehabilitation, the overall reliability and availability of the units has to be well
quantified as this will have a major affect on the economics of the project. At a certain stage in the life
of any installation as the availability decreases, "extension of life" becomes "prevention of death".
There will come a time, with no rehabilitation and capital investment in the replacement of
components, that the unit simply ceases working. Obviously, as that point is reached, particularly in
cash-starved developing countries, the economic attractiveness of rehabilitation will be very high since
(in the worst case scenario) an entire hydroelectric installation can be revitalized for the price of
rehabilitation.
Warning signs of future problems could include such things as rough operation caused by cavitation and
/ or sediment passage damage, lack of spare parts leading to repeated failures and reduced reliability as
well as availability and scavenging from units with more serious operational problems to keep better
units operating. These issues are very site specific and are not captured in the generic data bases that
were available for the African and Central American regions.
Availability can decrease particularly in developing countries where O&M budgets and spare parts
availability are significantly constrained in comparison to developed countries. For a hydropower plant
with a sufficient reservoir, typical reliability can reach 98% for well maintained equipment in developed
countries but typical values for developing countries are not well documented. In case of most run-of-
river schemes, maximum reliability is more in the range of 95%. Based experience, reliability easily drops
10 percentage points (i.e. 88% or 85%) for older equipment. In addition, the World Bank looked into
their experience and indicated that a global value for EEPCIO of 60-70% has been quoted. A lower value
of 75% reliability at 60 years was therefore examined in a sensitivity assessment.
See section 4.2.3 above for a more detailed explanation of Reliability, Availability and Outages.
Rehabilitation of Hydropower
23
5.4 Rehabilitation Scenarios
The following two scenarios were examined in the assessment: life extension and upgrade.
5.4.1 Life Extension
The benefits of life extension are limited to rehabilitating the turbine to close to the original equipment
specification. A clear limit on life extension is that it does not take advantage of changes in turbine
technology but seeks only to extend the operation of the units with more or less the same output that
was inherent in its original equipment. This is not true for the generators since a stator rewind would be
done with modern materials. Life extension would therefore typically include:
Generator and turbine dismantling
Generator stator rewind
Generator mechanical rehabilitation (generator, excitation)
Turbine rehabilitation (runner, seals, wicket gates, speed governor)
Unit auxiliaries rehabilitation
Turbine and generator reinstallation and testing
There is also the issue of the stator core and the generator poles; however these are uncertainties and
can be lumped in with the stator rewind.
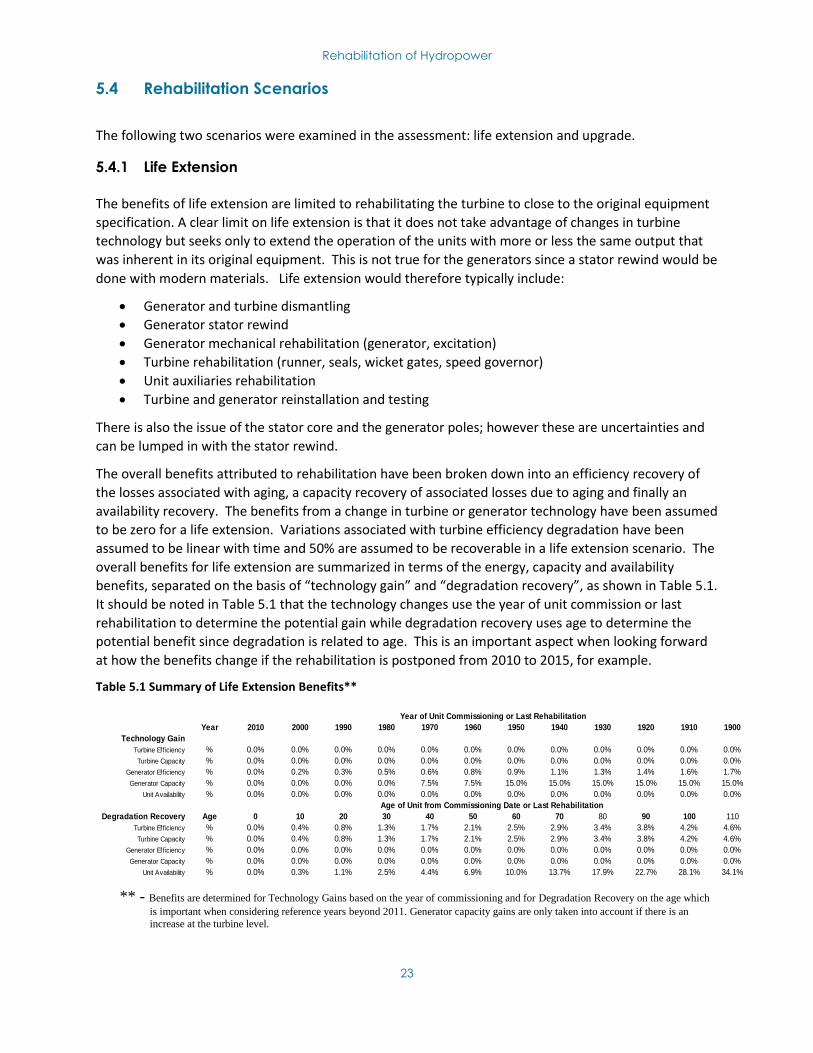
The overall benefits attributed to rehabilitation have been broken down into an efficiency recovery of
the losses associated with aging, a capacity recovery of associated losses due to aging and finally an
availability recovery. The benefits from a change in turbine or generator technology have been assumed
to be zero for a life extension. Variations associated with turbine efficiency degradation have been
assumed to be linear with time and 50% are assumed to be recoverable in a life extension scenario. The
overall benefits for life extension are summarized in terms of the energy, capacity and availability
benefits, separated on the basis of “technology gain” and “degradation recovery”, as shown in Table 5.1.
It should be noted in Table 5.1 that the technology changes use the year of unit commission or last
rehabilitation to determine the potential gain while degradation recovery uses age to determine the
potential benefit since degradation is related to age. This is an important aspect when looking forward
at how the benefits change if the rehabilitation is postponed from 2010 to 2015, for example.
Table 5.1 Summary of Life Extension Benefits**
Year 2010 2000 1990 1980 1970 1960 1950 1940 1930 1920 1910 1900
Technology Gain
Turbine Efficiency % 0.0% 0.0% 0.0% 0.0% 0.0% 0.0% 0.0% 0.0% 0.0% 0.0% 0.0% 0.0%
Turbine Capacity % 0.0% 0.0% 0.0% 0.0% 0.0% 0.0% 0.0% 0.0% 0.0% 0.0% 0.0% 0.0%
Generator Eff iciency % 0.0% 0.2% 0.3% 0.5% 0.6% 0.8% 0.9% 1.1% 1.3% 1.4% 1.6% 1.7%
Generator Capacity % 0.0% 0.0% 0.0% 0.0% 7.5% 7.5% 15.0% 15.0% 15.0% 15.0% 15.0% 15.0%
Unit Availability % 0.0% 0.0% 0.0% 0.0% 0.0% 0.0% 0.0% 0.0% 0.0% 0.0% 0.0% 0.0%
Degradation Recovery Age 0 10 20 30 40 50 60 70 80 90 100 110
Turbine Efficiency % 0.0% 0.4% 0.8% 1.3% 1.7% 2.1% 2.5% 2.9% 3.4% 3.8% 4.2% 4.6%
Turbine Capacity % 0.0% 0.4% 0.8% 1.3% 1.7% 2.1% 2.5% 2.9% 3.4% 3.8% 4.2% 4.6%
Generator Eff iciency % 0.0% 0.0% 0.0% 0.0% 0.0% 0.0% 0.0% 0.0% 0.0% 0.0% 0.0% 0.0%
Generator Capacity % 0.0% 0.0% 0.0% 0.0% 0.0% 0.0% 0.0% 0.0% 0.0% 0.0% 0.0% 0.0%
Unit Availability % 0.0% 0.3% 1.1% 2.5% 4.4% 6.9% 10.0% 13.7% 17.9% 22.7% 28.1% 34.1%
Year of Unit Commissioning or Last Rehabilitation
Age of Unit from Commissioning Date or Last Rehabilitation
** - Benefits are determined for Technology Gains based on the year of commissioning and for Degradation Recovery on the age which
is important when considering reference years beyond 2011. Generator capacity gains are only taken into account if there is an
increase at the turbine level.
Rehabilitation of Hydropower
24
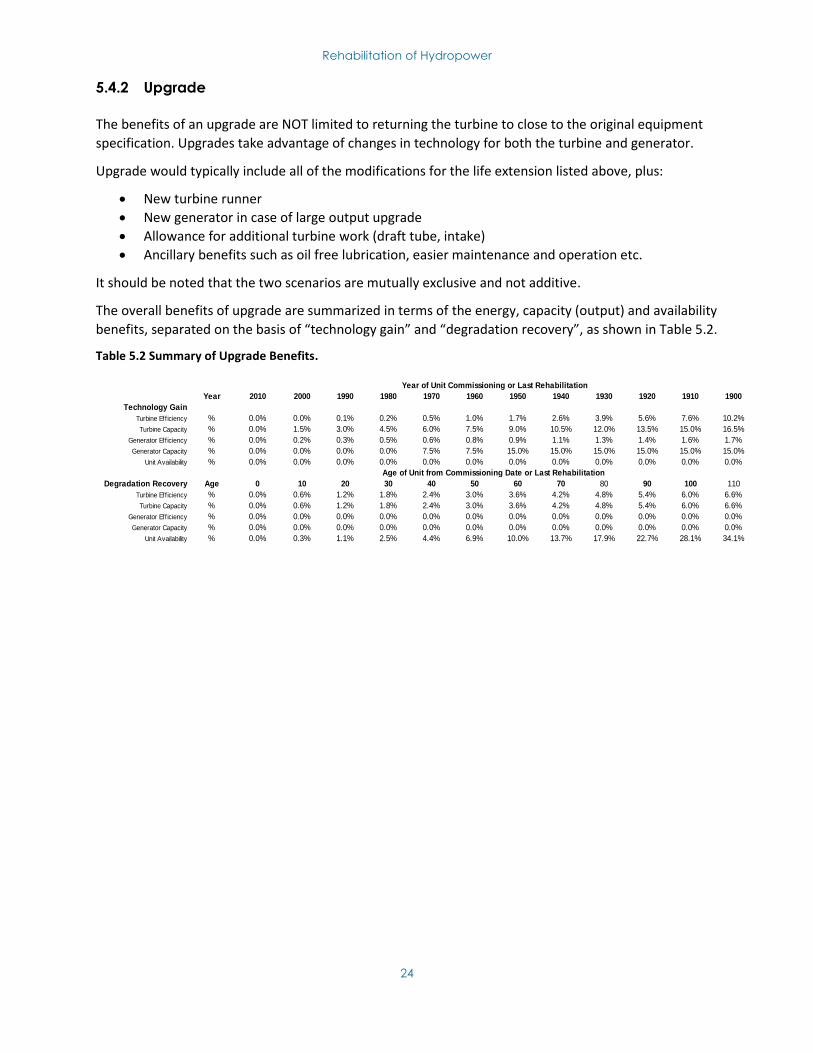
5.4.2 Upgrade
The benefits of an upgrade are NOT limited to returning the turbine to close to the original equipment
specification. Upgrades take advantage of changes in technology for both the turbine and generator.
Upgrade would typically include all of the modifications for the life extension listed above, plus:
New turbine runner
New generator in case of large output upgrade
Allowance for additional turbine work (draft tube, intake)
Ancillary benefits such as oil free lubrication, easier maintenance and operation etc.
It should be noted that the two scenarios are mutually exclusive and not additive.
The overall benefits of upgrade are summarized in terms of the energy, capacity (output) and availability
benefits, separated on the basis of “technology gain” and “degradation recovery”, as shown in Table 5.2.
Table 5.2 Summary of Upgrade Benefits.
Year 2010 2000 1990 1980 1970 1960 1950 1940 1930 1920 1910 1900
Technology Gain
Turbine Efficiency % 0.0% 0.0% 0.1% 0.2% 0.5% 1.0% 1.7% 2.6% 3.9% 5.6% 7.6% 10.2%
Turbine Capacity % 0.0% 1.5% 3.0% 4.5% 6.0% 7.5% 9.0% 10.5% 12.0% 13.5% 15.0% 16.5%
Generator Eff iciency % 0.0% 0.2% 0.3% 0.5% 0.6% 0.8% 0.9% 1.1% 1.3% 1.4% 1.6% 1.7%
Generator Capacity % 0.0% 0.0% 0.0% 0.0% 7.5% 7.5% 15.0% 15.0% 15.0% 15.0% 15.0% 15.0%
Unit Availability % 0.0% 0.0% 0.0% 0.0% 0.0% 0.0% 0.0% 0.0% 0.0% 0.0% 0.0% 0.0%
Degradation Recovery Age 0 10 20 30 40 50 60 70 80 90 100 110
Turbine Efficiency % 0.0% 0.6% 1.2% 1.8% 2.4% 3.0% 3.6% 4.2% 4.8% 5.4% 6.0% 6.6%
Turbine Capacity % 0.0% 0.6% 1.2% 1.8% 2.4% 3.0% 3.6% 4.2% 4.8% 5.4% 6.0% 6.6%
Generator Eff iciency % 0.0% 0.0% 0.0% 0.0% 0.0% 0.0% 0.0% 0.0% 0.0% 0.0% 0.0% 0.0%
Generator Capacity % 0.0% 0.0% 0.0% 0.0% 0.0% 0.0% 0.0% 0.0% 0.0% 0.0% 0.0% 0.0%
Unit Availability % 0.0% 0.3% 1.1% 2.5% 4.4% 6.9% 10.0% 13.7% 17.9% 22.7% 28.1% 34.1%
Year of Unit Commissioning or Last Rehabilitation
Age of Unit from Commissioning Date or Last Rehabilitation
Rehabilitation of Hydropower
25
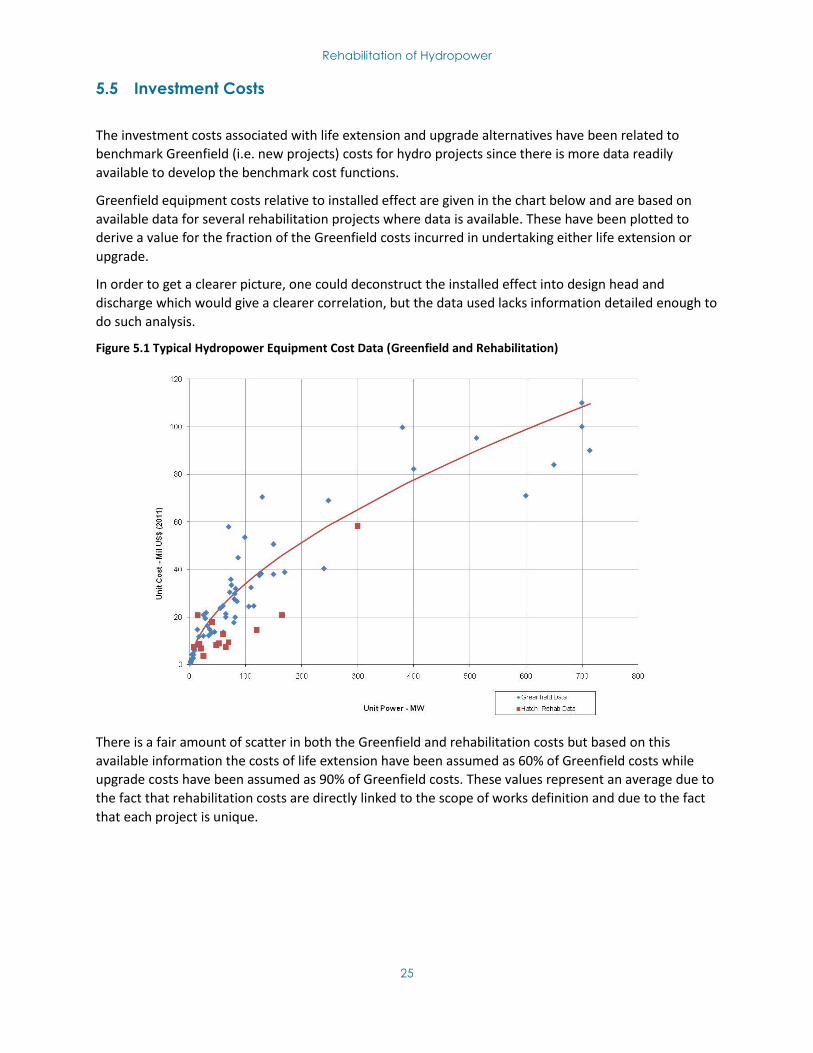
5.5 Investment Costs
The investment costs associated with life extension and upgrade alternatives have been related to
benchmark Greenfield (i.e. new projects) costs for hydro projects since there is more data readily
available to develop the benchmark cost functions.
Greenfield equipment costs relative to installed effect are given in the chart below and are based on
available data for several rehabilitation projects where data is available. These have been plotted to
derive a value for the fraction of the Greenfield costs incurred in undertaking either life extension or
upgrade.
In order to get a clearer picture, one could deconstruct the installed effect into design head and
discharge which would give a clearer correlation, but the data used lacks information detailed enough to
do such analysis.
Figure 5.1 Typical Hydropower Equipment Cost Data (Greenfield and Rehabilitation)
There is a fair amount of scatter in both the Greenfield and rehabilitation costs but based on this
available information the costs of life extension have been assumed as 60% of Greenfield costs while
upgrade costs have been assumed as 90% of Greenfield costs. These values represent an average due to
the fact that rehabilitation costs are directly linked to the scope of works definition and due to the fact
that each project is unique.
Rehabilitation of Hydropower
26
5.6 Economic Analysis
The information on the potential for unit rehabilitation was compiled into a MS Excel Spreadsheet which
includes the following key categories of parameter:
Station Location and Unit Characteristics
Rehabilitation Benefits at the On-line Date
Rehabilitation Costs at the On-line Date
Economic Indicators
Annex B gives more details on the economic analysis and provides the detailed results of the application
of the analysis for the two regions. Section 6 provides an overview of the results of the economic
analysis as it relates to the market analysis for rehabilitation.
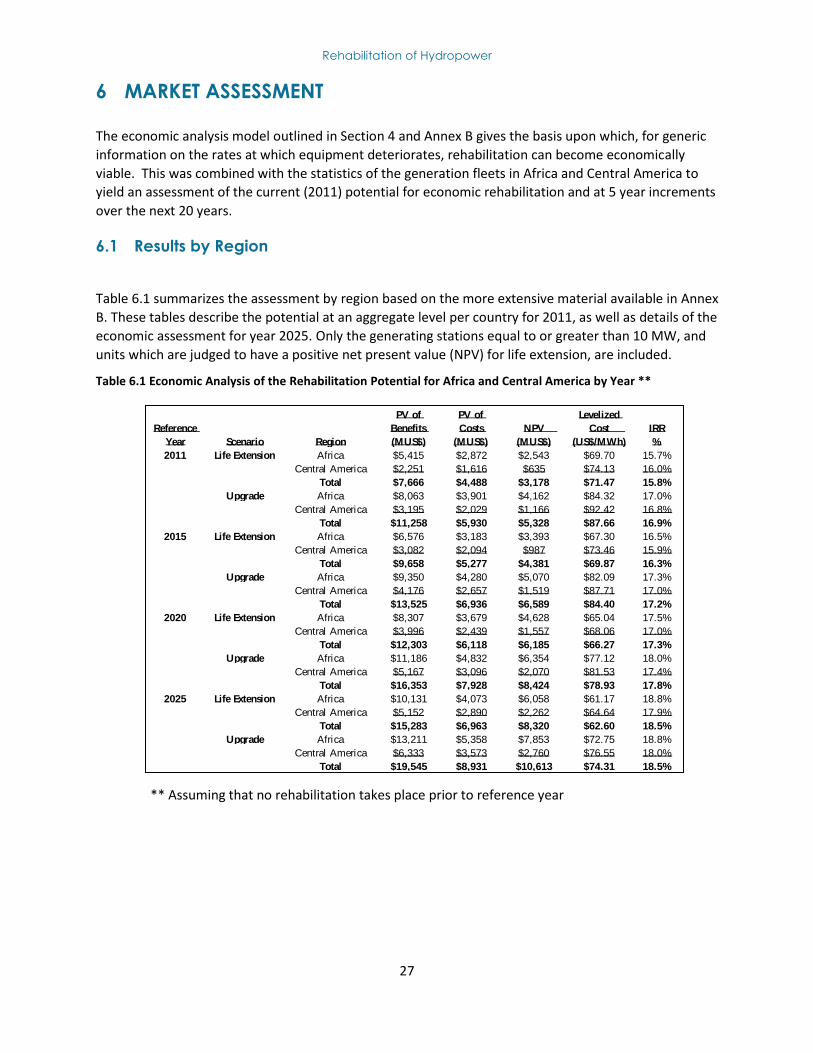
Rehabilitation of Hydropower
27
6 MARKET ASSESSMENT
The economic analysis model outlined in Section 4 and Annex B gives the basis upon which, for generic
information on the rates at which equipment deteriorates, rehabilitation can become economically
viable. This was combined with the statistics of the generation fleets in Africa and Central America to
yield an assessment of the current (2011) potential for economic rehabilitation and at 5 year increments
over the next 20 years.
6.1 Results by Region
Table 6.1 summarizes the assessment by region based on the more extensive material available in Annex
B. These tables describe the potential at an aggregate level per country for 2011, as well as details of the
economic assessment for year 2025. Only the generating stations equal to or greater than 10 MW, and
units which are judged to have a positive net present value (NPV) for life extension, are included.
Table 6.1 Economic Analysis of the Rehabilitation Potential for Africa and Central America by Year **
** Assuming that no rehabilitation takes place prior to reference year
Reference
Year Scenario Region
PV of
Benefits
(MUS$)
PV of
Costs
(MUS$)
NPV
(MUS$)
Levelized
Cost
(US$/MWh)
IRR
%
2011 Life Extension Africa $5,415 $2,872 $2,543 $69.70 15.7%
Central America $2,251 $1,616 $635 $74.13 16.0%
Total $7,666 $4,488 $3,178 $71.47 15.8%
Upgrade Africa $8,063 $3,901 $4,162 $84.32 17.0%
Central America $3,195 $2,029 $1,166 $92.42 16.8%
Total $11,258 $5,930 $5,328 $87.66 16.9%
2015 Life Extension Africa $6,576 $3,183 $3,393 $67.30 16.5%
Central America $3,082 $2,094 $987 $73.46 15.9%
Total $9,658 $5,277 $4,381 $69.87 16.3%
Upgrade Africa $9,350 $4,280 $5,070 $82.09 17.3%
Central America $4,176 $2,657 $1,519 $87.71 17.0%
Total $13,525 $6,936 $6,589 $84.40 17.2%
2020 Life Extension Africa $8,307 $3,679 $4,628 $65.04 17.5%
Central America $3,996 $2,439 $1,557 $68.06 17.0%
Total $12,303 $6,118 $6,185 $66.27 17.3%
Upgrade Africa $11,186 $4,832 $6,354 $77.12 18.0%
Central America $5,167 $3,096 $2,070 $81.53 17.4%
Total $16,353 $7,928 $8,424 $78.93 17.8%
2025 Life Extension Africa $10,131 $4,073 $6,058 $61.17 18.8%
Central America $5,152 $2,890 $2,262 $64.64 17.9%
Total $15,283 $6,963 $8,320 $62.60 18.5%
Upgrade Africa $13,211 $5,358 $7,853 $72.75 18.8%
Central America $6,333 $3,573 $2,760 $76.55 18.0%
Total $19,545 $8,931 $10,613 $74.31 18.5%
Rehabilitation of Hydropower
28
6.1.1 Life Extension Scenario
Reading the results of the simplified economic analysis presented in Table 6.1 one can see that a US$ 2.9
billion investment in Africa can unleash benefits of US$ 6.4 billion in present value through life
extension.
Similarly, as seen in table 6.2, similar results are given for Central America; investments of US$ 1.6 billion
yield benefits of US$ 2.3 billion.
6.1.2 Upgrade Scenario
Table 6.1 also show the comparable information for the upgrade scenario which, for Africa, shows a US$
3.9 billion investment producing present value benefits of US$ 8.1 billion.
Further one can see that for Central America, a US$ 2 billion of investments yields US$ 3.2 billion in
benefits.
6.1.3 Results at Other Reference Years
The above tables reflect the economic scenarios with a reference year of 2011 (current year). As we
move forward to other reference years, the amount of economic rehabilitation will grow. Table 6.1
gives the economic rehabilitation values at 5-year increments for the next 15 years.
A review of the table also indicates that the scope of the market for rehabilitation is substantial in the
two regions. The present value of the costs of undertaking the rehabilitation is currently estimated at
more than US$4 billion for life extension and more than US$5 billion for upgrade. It should be pointed
out, however, that this assumes that life extension and upgrades have not been carried out for any of
the projects. For many projects this may have already been done which would significantly affect the
market assessment. Further work could be done to identify which stations have been upgraded and
when, so that a revised assessment could be compiled. Figure 6.1 shows a graphical representation of
the variation of the NPV in the future assessment years.
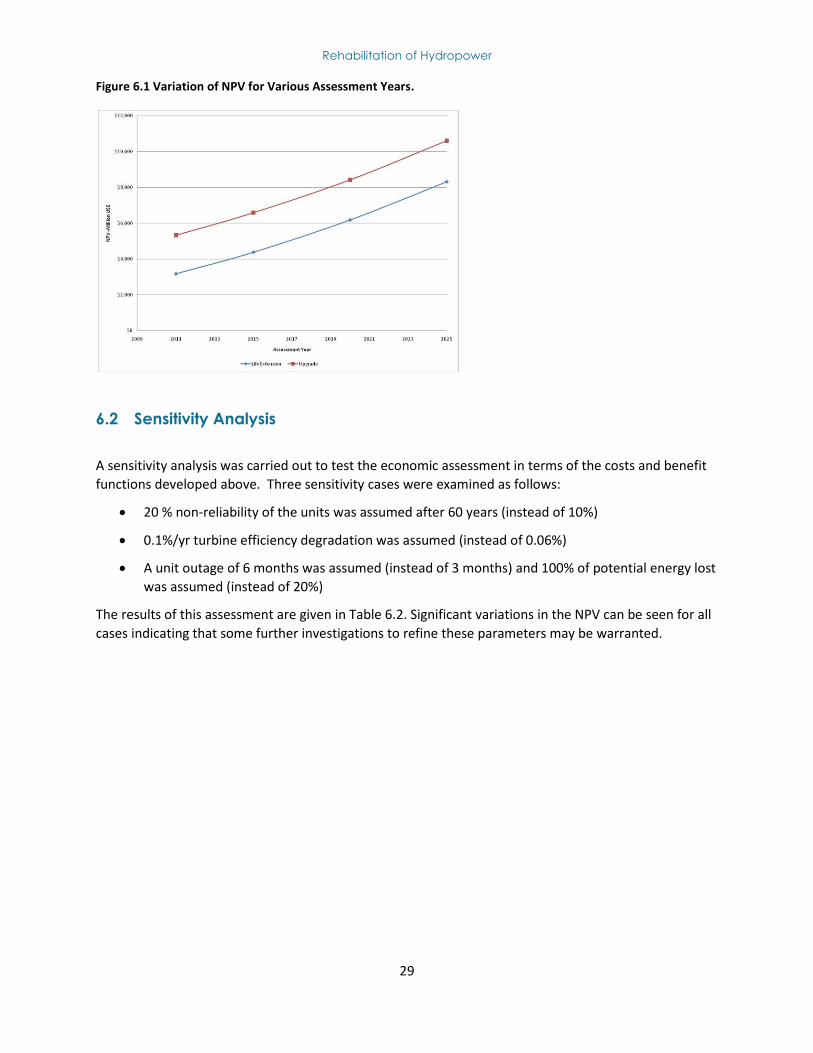
Rehabilitation of Hydropower
29
Figure 6.1 Variation of NPV for Various Assessment Years.
6.2 Sensitivity Analysis
A sensitivity analysis was carried out to test the economic assessment in terms of the costs and benefit
functions developed above. Three sensitivity cases were examined as follows:
20 % non-reliability of the units was assumed after 60 years (instead of 10%)
0.1%/yr turbine efficiency degradation was assumed (instead of 0.06%)
A unit outage of 6 months was assumed (instead of 3 months) and 100% of potential energy lost
was assumed (instead of 20%)
The results of this assessment are given in Table 6.2. Significant variations in the NPV can be seen for all
cases indicating that some further investigations to refine these parameters may be warranted.
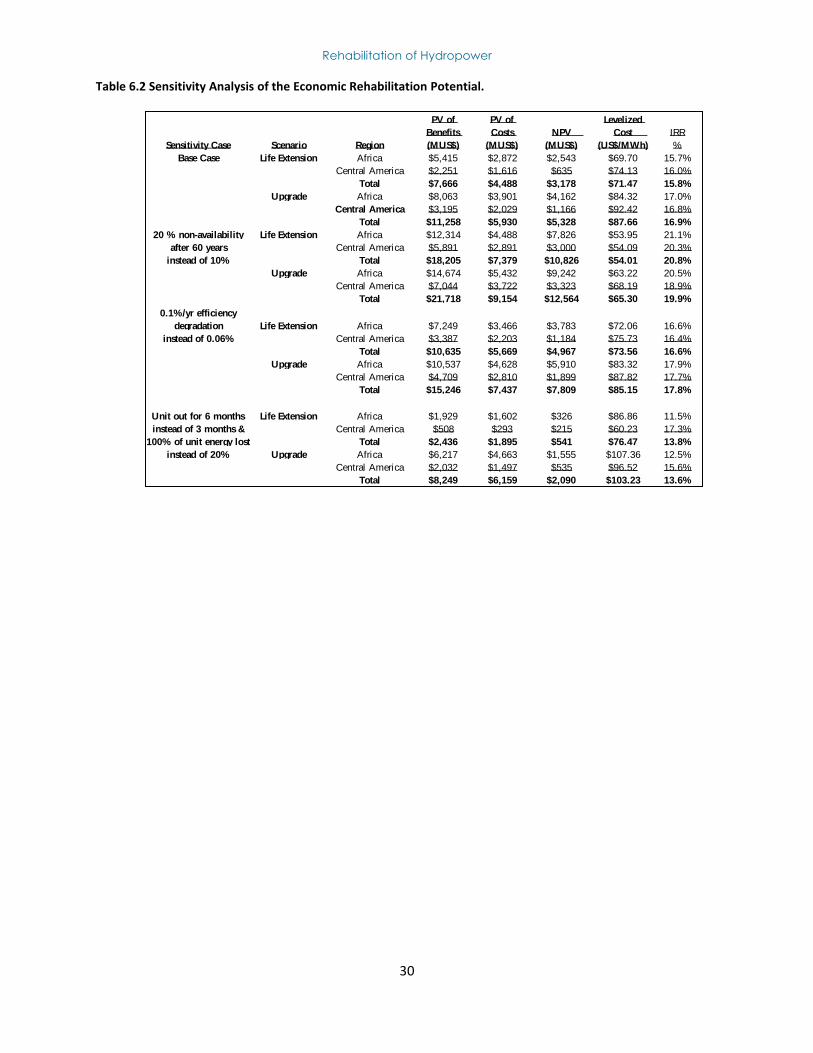
Rehabilitation of Hydropower
30
Table 6.2 Sensitivity Analysis of the Economic Rehabilitation Potential.
Sensitivity Case Scenario Region
PV of
Benefits
(MUS$)
PV of
Costs
(MUS$)
NPV
(MUS$)
Levelized
Cost
(US$/MWh)
IRR
%
Base Case Life Extension Africa $5,415 $2,872 $2,543 $69.70 15.7%
Central America $2,251 $1,616 $635 $74.13 16.0%
Total $7,666 $4,488 $3,178 $71.47 15.8%
Upgrade Africa $8,063 $3,901 $4,162 $84.32 17.0%
Central America $3,195 $2,029 $1,166 $92.42 16.8%
Total $11,258 $5,930 $5,328 $87.66 16.9%
20 % non-availability Life Extension Africa $12,314 $4,488 $7,826 $53.95 21.1%
after 60 years Central America $5,891 $2,891 $3,000 $54.09 20.3%
instead of 10% Total $18,205 $7,379 $10,826 $54.01 20.8%
Upgrade Africa $14,674 $5,432 $9,242 $63.22 20.5%
Central America $7,044 $3,722 $3,323 $68.19 18.9%
Total $21,718 $9,154 $12,564 $65.30 19.9%
0.1%/yr efficiency
degradation Life Extension Africa $7,249 $3,466 $3,783 $72.06 16.6%
instead of 0.06% Central America $3,387 $2,203 $1,184 $75.73 16.4%
Total $10,635 $5,669 $4,967 $73.56 16.6%
Upgrade Africa $10,537 $4,628 $5,910 $83.32 17.9%
Central America $4,709 $2,810 $1,899 $87.82 17.7%
Total $15,246 $7,437 $7,809 $85.15 17.8%
Unit out for 6 months Life Extension Africa $1,929 $1,602 $326 $86.86 11.5%
instead of 3 months & Central America $508 $293 $215 $60.23 17.3%
100% of unit energy lost Total $2,436 $1,895 $541 $76.47 13.8%
instead of 20% Upgrade Africa $6,217 $4,663 $1,555 $107.36 12.5%
Central America $2,032 $1,497 $535 $96.52 15.6%
Total $8,249 $6,159 $2,090 $103.23 13.6%
Rehabilitation of Hydropower
31
7 LESSONS DRAWN FROM REHABILITATION PROJECTS
This section provides a discussion of results of completed hydro plant rehabilitation projects. This is
based on the information collected during the study to date on 9 rehabilitation projects (which was
originally to be used to prepare case studies) and experience gained elsewhere working on hydro power
plant rehabilitation projects. This section is prepared on an anonymous basis and does not tie specific
information to specific projects. Information on lessons learned/pitfalls to avoid is also provided.
7.1 Background
This section discusses the rehabilitation projects that have been selected for the case studies. A sizeable
number of completed rehabilitation projects were put forward as candidates for case studies. A number
of meetings were held with Bank specialists and Bank staff engaged in ongoing internal discussions to
finalize the selections. As the first step in the preparation of the case studies, a template which is
referred to as the Case Study Information Sheet was prepared.
The main steps followed in the preparation of the case studies are as follows:
1. Collect detailed reports, worksheets and other documents for each project
2. As a desk study, complete the Case Study Information Sheet for each project to the extent
possible
The intent was to meet with the owner and/or others directly involved with as many of the projects as
possible to refine the data and understand the results of each project, especially any lessons learned
over the course of the project. It would not have been possible to extract this content by just analyzing
the available information. The information available to assess the projects generally comes from project
reports and other information that was provided by the clients. As such this information has been
treated as confidential and therefore specific references to projects are provided in an anonymous
manner in the sections below.
The available information varied from project to project. Some case studies had good information while
others were less well defined; however, all information was assessed in an effort to bring the maximum
value to the study.
7.2 Case Study Content
The purpose of the case studies is to indentify key barriers and constraints to rehabilitation projects, as
well as success factors. A better understanding of these factors will help in the design and preparation of
projects, and provide insight into both owner/operator and public responsibilities. Specific issues are
compared across case studies and aggregated into the synthesis report and guidance note. Table 7.1
provides an outline of the content of the case study questionnaire that was used to prepare the case
study information abstracted from the available references.
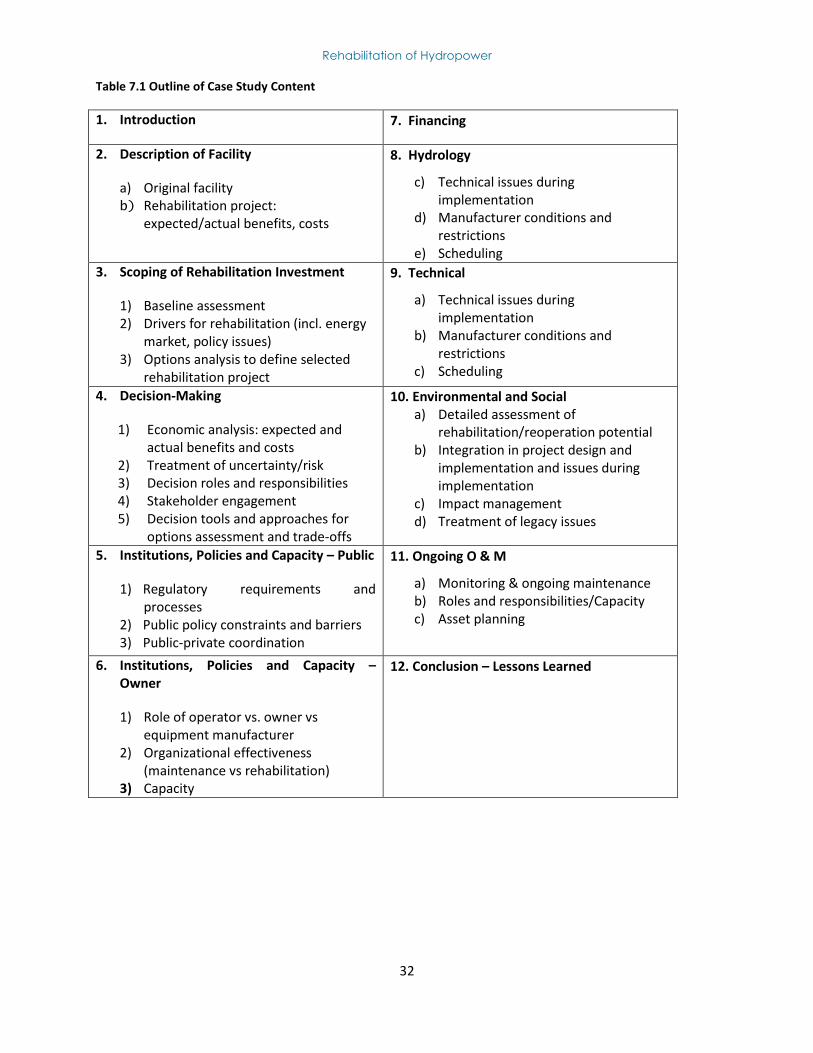
Rehabilitation of Hydropower
32
Table 7.1 Outline of Case Study Content
1. Introduction 7. Financing
2. Description of Facility
a) Original facility b) Rehabilitation project:
expected/actual benefits, costs
8. Hydrology
c) Technical issues during implementation
d) Manufacturer conditions and restrictions
e) Scheduling
3. Scoping of Rehabilitation Investment
1) Baseline assessment 2) Drivers for rehabilitation (incl. energy
market, policy issues) 3) Options analysis to define selected
rehabilitation project
9. Technical
a) Technical issues during implementation
b) Manufacturer conditions and restrictions
c) Scheduling
4. Decision-Making
1) Economic analysis: expected and actual benefits and costs
2) Treatment of uncertainty/risk 3) Decision roles and responsibilities 4) Stakeholder engagement 5) Decision tools and approaches for
options assessment and trade-offs
10. Environmental and Social a) Detailed assessment of
rehabilitation/reoperation potential b) Integration in project design and
implementation and issues during implementation
c) Impact management d) Treatment of legacy issues
5. Institutions, Policies and Capacity – Public
1) Regulatory requirements and processes
2) Public policy constraints and barriers 3) Public-private coordination
11. Ongoing O & M
a) Monitoring & ongoing maintenance b) Roles and responsibilities/Capacity c) Asset planning
6. Institutions, Policies and Capacity – Owner
1) Role of operator vs. owner vs equipment manufacturer
2) Organizational effectiveness (maintenance vs rehabilitation)
3) Capacity
12. Conclusion – Lessons Learned
Rehabilitation of Hydropower
33
7.3 Case Study Projects
The case studies contain some sensitive economic data and are therefore not mentioned by name. The
main drivers for the Case Study projects are as follows.
Project 1 – Main Project Drivers
Increase reliability and safety of operation, reduce maintenance and forced outages and extend equipment life
Improve turbine performance using modern state of the art technology and more efficient turbine runners to increase generation output
Rehabilitate the controls, metering, protection, and data logging in the powerhouse and control room.
Project 2 – Main Project Drivers
Increase energy and capacity at the facility with modern turbine runner designs
Inspect existing equipment and replace or repair all worn or damaged components in order to extend the life of the units for the next 20 to 30 years
Expansion with installation of an additional unit
Project 3 – Main Project Drivers
Increase energy at the facility through the increase in plant capacity, recognizing that flow in the river often exceeded the capacity of the original facility.
Upgrade of existing turbine and generator equipment including governors and turbine inlet valve with new generating units of similar configuration but significantly higher capacity of 20%
Replacement of the powerhouse controls
Installation of additional transformers to accommodate the increased power levels
Major modification to civil works to accommodate the increased discharge capacity
Project 4 – Main Project Drivers
Increase in revenue through added capacity that could utilize excess flow that was available for a significant portion of the year. There was also some added benefit to a modern turbine runner design with increased efficiency.
Project 5 – Main Project Drivers
Provide urgently needed least-cost capacity additions to the system power generation capacity
This was a project expansion and was not a classic rehabilitation project
Increase the safety of the dam and associated infrastructure
Project 6 – Main Project Drivers
Improvement of the reliability of the electric service and increase service coverage by rehabilitation, modernization and expansion of power generation, transmission, sub-transmission and distribution systems
Purchase equipment necessary for sedimentation control
Project 7 – Main Project Drivers
Expansion of a completed project in order to increase the generating capacity as part of the long-term plan for the development of hydroelectric resources
Rehabilitation of Hydropower
34
It was justified as a least cost project in the expansion sequence but was not really a rehabilitation project given the relatively young age
Project 8 – Main Project Drivers
Multiple hydroelectric facilities subject to larger than expected wear and tear of the generating units
Project 9 – Main Project Drivers
The World Bank provided assistance in restructuring the power sector, with rehabilitation of the supply system a first priority
Three major power stations were targeted for rehabilitation under the project
The project includes rehabilitating hydropower plants and distribution and transmission systems to improve technical efficiency and the quality and reliability of supply
7.4 Case Studies Results
The details of the results of the assessment are given in Annex C. A summary of the Lessons Learned
from these case studies is given in Section 9 – Conclusions of this report.
The lessons learned have been divided into technical, contractual and implementation, institutional and
financial as well as one section on barriers and incentives.
On the technical side, a central issue is that one needs to have competent staff, experienced consultants
and engagement with the technology providers in order to be on time, keep the budget and have a
successful operation after the rehabilitation is complete.
One of the main lessons regarding contractual matters and Implementation is that risk management is
essential. Risk management does not mean to pass all risks to suppliers and contractors, as this will drive
costs. During implementation it is important to be aware that the project might change related to
discoveries from dismantling units etc.
Institutional lessons are to gear up procurement capacity, preferably with support from experienced
engineers to ensure that complex procurement might be expedited timely. On the financial side, flexible
credit lines need to be in place to deal with findings during project implementation. Again this needs to
be linked to engineering competencies to be navigated timely and successfully.
Traditional economic assessment may not consider risk for rehabilitation, upgrades or replacement
schemes. However, in most cases risk-costs are an important factor in determining the need for
interventions. The consequent cost of failure can be an important factor in assessing and justifying the
rehabilitation of hydropower components.
A key consideration in rehabilitation is to economically optimize outage scheduling of the generating
units without compromising system operational constraints. In most rehabilitation projects it is prudent
to consider extension / expansion of existing hydropower capacity, as well as taking into consideration
dam safety issues.
Rehabilitation of Hydropower
35
8 HYDRO REHABILITATION PROJECTS - BARRIERS AND
INCENTIVES
8.1 Technical
8.1.1 Introduction to Failure Probability Concepts
In traditional maintenance practice no quantified consideration was given to risk of failure in order to
determine the need for major maintenance involving replacement of parts or subcomponents. Similarly,
capital expenditures, such as rehabilitation, upgrades or replacement schemes did not consider risks.
This was traditionally left to judgment. However, in most cases risk-costs are an important factor in
determining the need for interventions. In modern maintenance planning, risk considerations do play
some role, albeit mostly in a simplistic and often qualitative manner and without least cost
considerations.
Risk-costs and maintenance costs increase with advancing age, but if the capital investment in
rehabilitation can be safely deferred, then the present value of that investment is reduced. It is the
trade-off between reducing that present value by deferral, and increasing risk and its cost (and often
maintenance and outage costs) by the same deferral, which will justify the extent of rehabilitation and
its timing. Risk costs depend on the financial impact of having to repair a unit that has had a component
failure plus the loss of generation coupled with the changes of the failure occurring as outlined in the
section below.
Failure Rates for Hydropower Components It is well established that the risk of failure(s) of hydropower components, as in other components,
increases with time in a nonlinear manner. Failure analysis must consider the existence of different
failure modes, each of which will contribute to or result in replacement of the component.
The combined effect of all failure modes over time is expressed through a survival or retirement curve,
otherwise known as a failure-probability curve, shown in Figure 8.1.
Condition Assessment and Representative Age Condition assessments of equipment systems and components are an important part of life cycle
analysis. Fortunately, most utilities nowadays undertake such detailed condition assessments. The
economic risk-based methodology utilizes this information to establish a representative (as opposed to
physical) age of the component. This may be achieved directly from condition information (REMR6
method), or through the use of Health Indexing methods. It is the representative age that describes the
component in terms of its operating environment, maintenance history and manufacturing quality. This
age is therefore the starting age for life cycle management analysis.
6 Repair Evaluation Maintenance Rehabilitation, http://www.wes.army.mil/REMR/
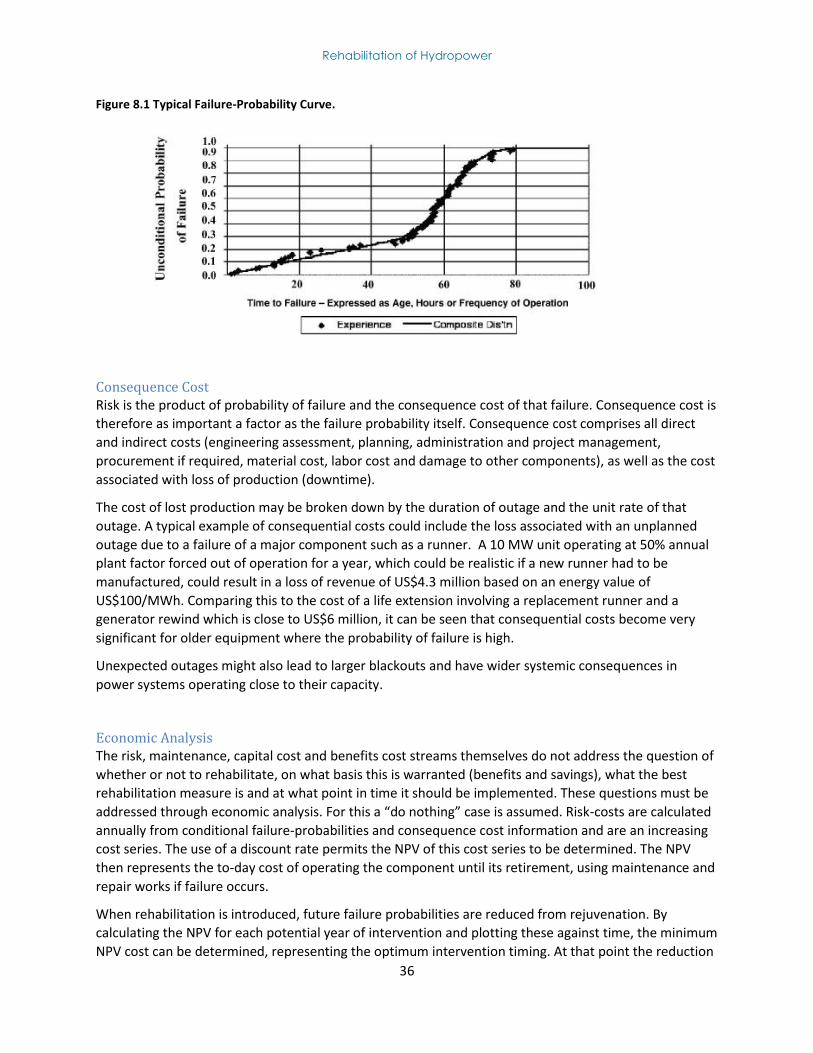
Rehabilitation of Hydropower
36
Figure 8.1 Typical Failure-Probability Curve.
Consequence Cost Risk is the product of probability of failure and the consequence cost of that failure. Consequence cost is
therefore as important a factor as the failure probability itself. Consequence cost comprises all direct
and indirect costs (engineering assessment, planning, administration and project management,
procurement if required, material cost, labor cost and damage to other components), as well as the cost
associated with loss of production (downtime).
The cost of lost production may be broken down by the duration of outage and the unit rate of that
outage. A typical example of consequential costs could include the loss associated with an unplanned
outage due to a failure of a major component such as a runner. A 10 MW unit operating at 50% annual
plant factor forced out of operation for a year, which could be realistic if a new runner had to be
manufactured, could result in a loss of revenue of US$4.3 million based on an energy value of
US$100/MWh. Comparing this to the cost of a life extension involving a replacement runner and a
generator rewind which is close to US$6 million, it can be seen that consequential costs become very
significant for older equipment where the probability of failure is high.
Unexpected outages might also lead to larger blackouts and have wider systemic consequences in
power systems operating close to their capacity.
Economic Analysis The risk, maintenance, capital cost and benefits cost streams themselves do not address the question of
whether or not to rehabilitate, on what basis this is warranted (benefits and savings), what the best
rehabilitation measure is and at what point in time it should be implemented. These questions must be
addressed through economic analysis. For this a “do nothing” case is assumed. Risk-costs are calculated
annually from conditional failure-probabilities and consequence cost information and are an increasing
cost series. The use of a discount rate permits the NPV of this cost series to be determined. The NPV
then represents the to-day cost of operating the component until its retirement, using maintenance and
repair works if failure occurs.
When rehabilitation is introduced, future failure probabilities are reduced from rejuvenation. By
calculating the NPV for each potential year of intervention and plotting these against time, the minimum
NPV cost can be determined, representing the optimum intervention timing. At that point the reduction
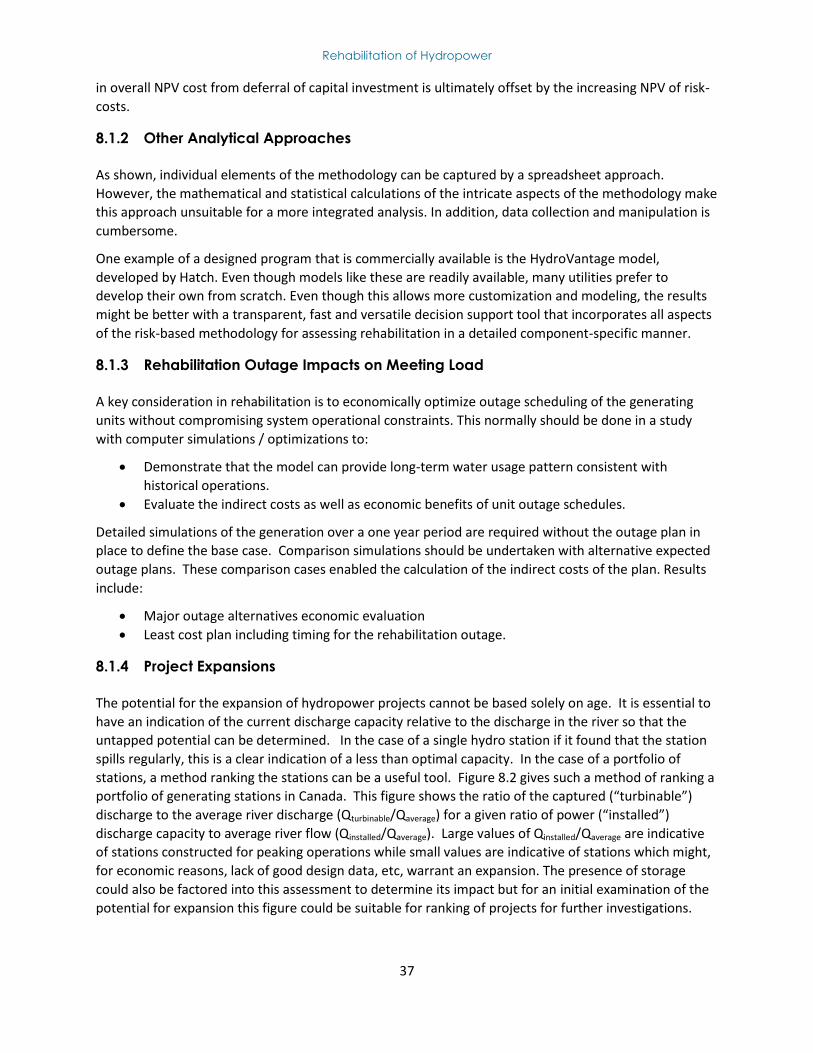
Rehabilitation of Hydropower
37
in overall NPV cost from deferral of capital investment is ultimately offset by the increasing NPV of risk-
costs.
8.1.2 Other Analytical Approaches
As shown, individual elements of the methodology can be captured by a spreadsheet approach.
However, the mathematical and statistical calculations of the intricate aspects of the methodology make
this approach unsuitable for a more integrated analysis. In addition, data collection and manipulation is
cumbersome.
One example of a designed program that is commercially available is the HydroVantage model,
developed by Hatch. Even though models like these are readily available, many utilities prefer to
develop their own from scratch. Even though this allows more customization and modeling, the results
might be better with a transparent, fast and versatile decision support tool that incorporates all aspects
of the risk-based methodology for assessing rehabilitation in a detailed component-specific manner.
8.1.3 Rehabilitation Outage Impacts on Meeting Load
A key consideration in rehabilitation is to economically optimize outage scheduling of the generating
units without compromising system operational constraints. This normally should be done in a study
with computer simulations / optimizations to:
Demonstrate that the model can provide long-term water usage pattern consistent with
historical operations.
Evaluate the indirect costs as well as economic benefits of unit outage schedules.
Detailed simulations of the generation over a one year period are required without the outage plan in
place to define the base case. Comparison simulations should be undertaken with alternative expected
outage plans. These comparison cases enabled the calculation of the indirect costs of the plan. Results
include:
Major outage alternatives economic evaluation
Least cost plan including timing for the rehabilitation outage.
8.1.4 Project Expansions
The potential for the expansion of hydropower projects cannot be based solely on age. It is essential to
have an indication of the current discharge capacity relative to the discharge in the river so that the
untapped potential can be determined. In the case of a single hydro station if it found that the station
spills regularly, this is a clear indication of a less than optimal capacity. In the case of a portfolio of
stations, a method ranking the stations can be a useful tool. Figure 8.2 gives such a method of ranking a
portfolio of generating stations in Canada. This figure shows the ratio of the captured (“turbinable”)
discharge to the average river discharge (Qturbinable/Qaverage) for a given ratio of power (“installed”)
discharge capacity to average river flow (Qinstalled/Qaverage). Large values of Qinstalled/Qaverage are indicative
of stations constructed for peaking operations while small values are indicative of stations which might,
for economic reasons, lack of good design data, etc, warrant an expansion. The presence of storage
could also be factored into this assessment to determine its impact but for an initial examination of the
potential for expansion this figure could be suitable for ranking of projects for further investigations.
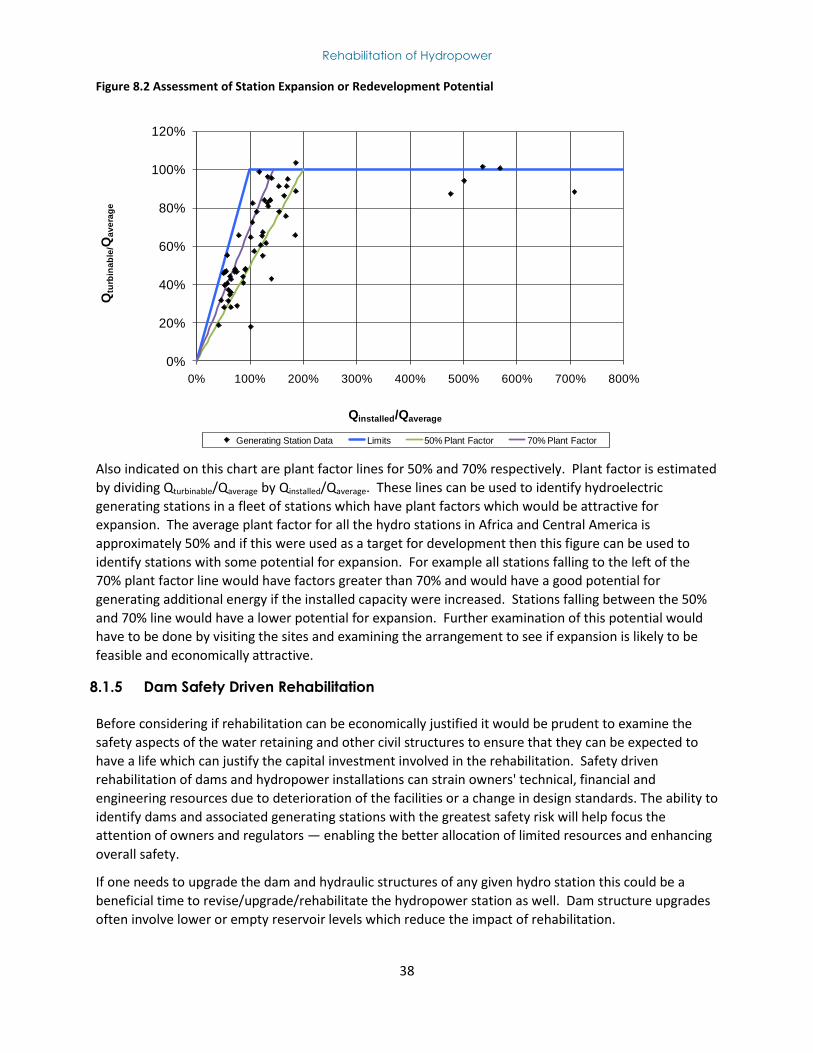
Rehabilitation of Hydropower
38
Figure 8.2 Assessment of Station Expansion or Redevelopment Potential
Also indicated on this chart are plant factor lines for 50% and 70% respectively. Plant factor is estimated
by dividing Qturbinable/Qaverage by Qinstalled/Qaverage. These lines can be used to identify hydroelectric
generating stations in a fleet of stations which have plant factors which would be attractive for
expansion. The average plant factor for all the hydro stations in Africa and Central America is
approximately 50% and if this were used as a target for development then this figure can be used to
identify stations with some potential for expansion. For example all stations falling to the left of the
70% plant factor line would have factors greater than 70% and would have a good potential for
generating additional energy if the installed capacity were increased. Stations falling between the 50%
and 70% line would have a lower potential for expansion. Further examination of this potential would
have to be done by visiting the sites and examining the arrangement to see if expansion is likely to be
feasible and economically attractive.
8.1.5 Dam Safety Driven Rehabilitation
Before considering if rehabilitation can be economically justified it would be prudent to examine the
safety aspects of the water retaining and other civil structures to ensure that they can be expected to
have a life which can justify the capital investment involved in the rehabilitation. Safety driven
rehabilitation of dams and hydropower installations can strain owners' technical, financial and
engineering resources due to deterioration of the facilities or a change in design standards. The ability to
identify dams and associated generating stations with the greatest safety risk will help focus the
attention of owners and regulators — enabling the better allocation of limited resources and enhancing
overall safety.
If one needs to upgrade the dam and hydraulic structures of any given hydro station this could be a
beneficial time to revise/upgrade/rehabilitate the hydropower station as well. Dam structure upgrades
often involve lower or empty reservoir levels which reduce the impact of rehabilitation.
0%
20%
40%
60%
80%
100%
120%
0% 100% 200% 300% 400% 500% 600% 700% 800%
Qtu
rbin
ab
le/Q
av
era
ge
Qinstalled/Qaverage
Generating Station Data Limits 50% Plant Factor 70% Plant Factor
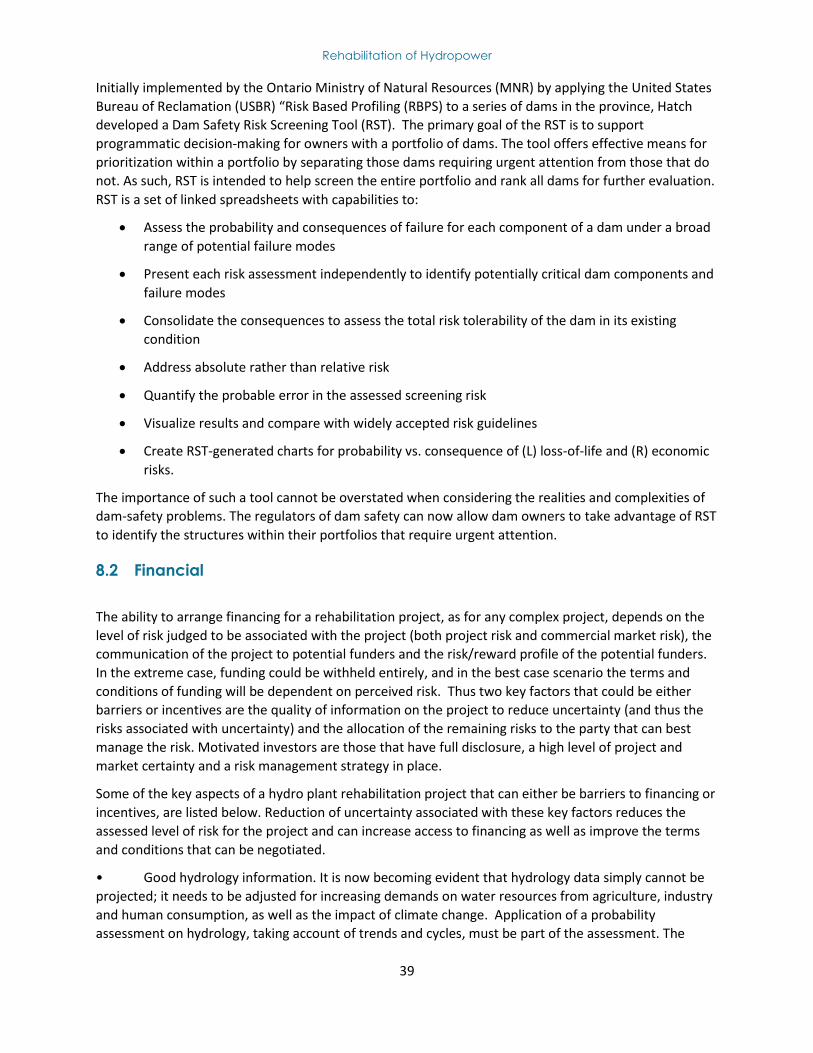
Rehabilitation of Hydropower
39
Initially implemented by the Ontario Ministry of Natural Resources (MNR) by applying the United States
Bureau of Reclamation (USBR) “Risk Based Profiling (RBPS) to a series of dams in the province, Hatch
developed a Dam Safety Risk Screening Tool (RST). The primary goal of the RST is to support
programmatic decision-making for owners with a portfolio of dams. The tool offers effective means for
prioritization within a portfolio by separating those dams requiring urgent attention from those that do
not. As such, RST is intended to help screen the entire portfolio and rank all dams for further evaluation.
RST is a set of linked spreadsheets with capabilities to:
Assess the probability and consequences of failure for each component of a dam under a broad
range of potential failure modes
Present each risk assessment independently to identify potentially critical dam components and
failure modes
Consolidate the consequences to assess the total risk tolerability of the dam in its existing
condition
Address absolute rather than relative risk
Quantify the probable error in the assessed screening risk
Visualize results and compare with widely accepted risk guidelines
Create RST-generated charts for probability vs. consequence of (L) loss-of-life and (R) economic
risks.
The importance of such a tool cannot be overstated when considering the realities and complexities of
dam-safety problems. The regulators of dam safety can now allow dam owners to take advantage of RST
to identify the structures within their portfolios that require urgent attention.
8.2 Financial
The ability to arrange financing for a rehabilitation project, as for any complex project, depends on the
level of risk judged to be associated with the project (both project risk and commercial market risk), the
communication of the project to potential funders and the risk/reward profile of the potential funders.
In the extreme case, funding could be withheld entirely, and in the best case scenario the terms and
conditions of funding will be dependent on perceived risk. Thus two key factors that could be either
barriers or incentives are the quality of information on the project to reduce uncertainty (and thus the
risks associated with uncertainty) and the allocation of the remaining risks to the party that can best
manage the risk. Motivated investors are those that have full disclosure, a high level of project and
market certainty and a risk management strategy in place.
Some of the key aspects of a hydro plant rehabilitation project that can either be barriers to financing or
incentives, are listed below. Reduction of uncertainty associated with these key factors reduces the
assessed level of risk for the project and can increase access to financing as well as improve the terms
and conditions that can be negotiated.
• Good hydrology information. It is now becoming evident that hydrology data simply cannot be
projected; it needs to be adjusted for increasing demands on water resources from agriculture, industry
and human consumption, as well as the impact of climate change. Application of a probability
assessment on hydrology, taking account of trends and cycles, must be part of the assessment. The

Rehabilitation of Hydropower
40
result could be changes in design to optimize plant value under the best estimate of future hydrology
and in particular the water likely to be available for power generation.
• Thorough geotechnical information where rehabilitation or expansion necessitates major new
civil works. It is noted that hydro plant rehabilitation generally does not encounter geotechnical
uncertainty when it is mainly electromechanical, as is the focus in much of this report.
• A Power Purchase Agreement (PPA) with a credit-worthy off taker. Financing is rarely available
today for merchant hydro plants.
• Environmental and socioeconomic impact assessment studies and licensing approvals as a
consequence of these studies. Expansions or even rehabilitations can trigger the application of today’s
much higher standards and to the extent the approvals processes can be completed or, at a minimum,
fully scoped, a major source of uncertainty can be removed or reduced.
• Optimization based on preliminary design to a stage to enable project scope to be set and
agreed to with key stakeholders.
• Preliminary engineering design and risk adjusted cost estimates.
• A competitive bidding process that is open, transparent and fair resulting in the best price/best
terms/best delivery team and the controls to ensure that what was promised is delivered and that
performance guarantees are in place and adhered to during the early operation of the plant.
• A thorough risk assessment with risks quantified and mitigation measures identified and risk
allocated to those parties best able to manage that risk.
With respect to the last point in the list above, a risk register is a convenient way to summarize the
findings of a risk review. For each risk area the register should indicate the relevant factors and indicate
the risk mitigation measures that are planned and how the project agreements would allocate the
residual risks to the stakeholders that are most capable of carrying these risks. The format of a typical
risk register is shown in Figure 8.1 below.
In a risk review workshop attended by primary stakeholders, the significant risk areas for the
rehabilitation project are identified and form the rows of the risk register. These could include
hydrology, regulatory/permitting, land access, transmission, geology, equipment procurement,
equipment performance, material supply, weather impacts, labor factors, design issues, contractor
performance, community support, the market and price for the output, replacement power, etc. The
columns of the register provide information on risk description, trigger, impact, likelihood, consequence
risk rating, risk management strategies/measures/controls, residual risk and possible further actions for
each of the risk areas. Diligent work to record and mitigate project risks using the risk register as a tool
can significantly reduce barriers to financing of a hydro plant rehabilitation project.
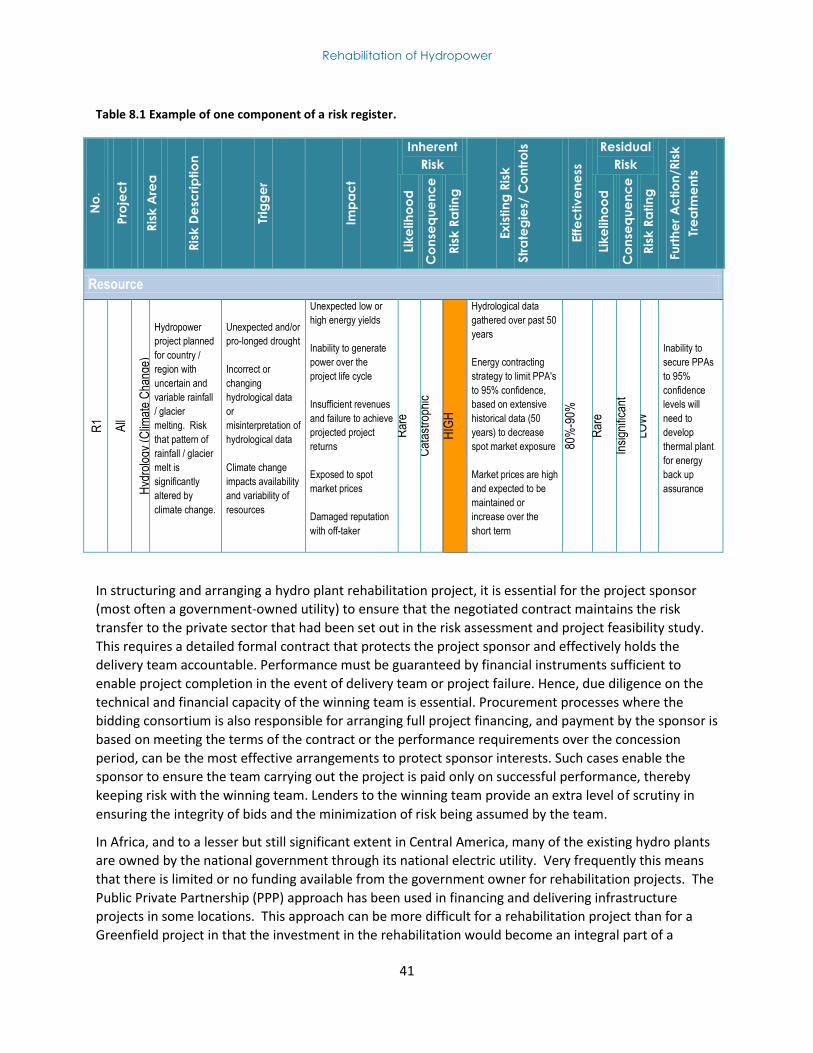
Rehabilitation of Hydropower
41
Table 8.1 Example of one component of a risk register.
No
.
Pro
jec
t
Ris
k A
rea
Ris
k D
esc
rip
tio
n
Trig
ge
r
Imp
ac
t
Inherent
Risk
Exis
tin
g R
isk
Str
ate
gie
s/ C
on
tro
ls
Effe
ctive
ne
ss
Residual
Risk
Fu
rth
er
Ac
tio
n/R
isk
Tre
atm
en
ts
Lik
elih
oo
d
Co
nse
qu
en
ce
Ris
k R
atin
g
Lik
elih
oo
d
Co
nse
qu
en
ce
Ris
k R
atin
g
Resource
R1
All
Hyd
rolo
gy (
Clim
ate
Cha
nge)
Hydropower
project planned
for country /
region with
uncertain and
variable rainfall
/ glacier
melting. Risk
that pattern of
rainfall / glacier
melt is
significantly
altered by
climate change.
Unexpected and/or
pro-longed drought
Incorrect or
changing
hydrological data
or
misinterpretation of
hydrological data
Climate change
impacts availability
and variability of
resources
Unexpected low or
high energy yields
Inability to generate
power over the
project life cycle
Insufficient revenues
and failure to achieve
projected project
returns
Exposed to spot
market prices
Damaged reputation
with off-taker
Rar
e
Cat
astr
ophi
c
HIG
H
Hydrological data
gathered over past 50
years
Energy contracting
strategy to limit PPA's
to 95% confidence,
based on extensive
historical data (50
years) to decrease
spot market exposure
Market prices are high
and expected to be
maintained or
increase over the
short term
80%
-90%
Rar
e
Insi
gnifi
cant
LOW
Inability to
secure PPAs
to 95%
confidence
levels will
need to
develop
thermal plant
for energy
back up
assurance
In structuring and arranging a hydro plant rehabilitation project, it is essential for the project sponsor
(most often a government-owned utility) to ensure that the negotiated contract maintains the risk
transfer to the private sector that had been set out in the risk assessment and project feasibility study.
This requires a detailed formal contract that protects the project sponsor and effectively holds the
delivery team accountable. Performance must be guaranteed by financial instruments sufficient to
enable project completion in the event of delivery team or project failure. Hence, due diligence on the
technical and financial capacity of the winning team is essential. Procurement processes where the
bidding consortium is also responsible for arranging full project financing, and payment by the sponsor is
based on meeting the terms of the contract or the performance requirements over the concession
period, can be the most effective arrangements to protect sponsor interests. Such cases enable the
sponsor to ensure the team carrying out the project is paid only on successful performance, thereby
keeping risk with the winning team. Lenders to the winning team provide an extra level of scrutiny in
ensuring the integrity of bids and the minimization of risk being assumed by the team.
In Africa, and to a lesser but still significant extent in Central America, many of the existing hydro plants
are owned by the national government through its national electric utility. Very frequently this means
that there is limited or no funding available from the government owner for rehabilitation projects. The
Public Private Partnership (PPP) approach has been used in financing and delivering infrastructure
projects in some locations. This approach can be more difficult for a rehabilitation project than for a
Greenfield project in that the investment in the rehabilitation would become an integral part of a

Rehabilitation of Hydropower
42
government owned asset. It is expected that in many cases the government would not be willing to
privatize the existing hydropower services. In this case, a possible approach would be to pledge an
appropriate portion of the rehabilitated plant’s output to the private sector investor on a long-term
basis in return for the investment. This method could prove particularly attractive when the
rehabilitation would either allow the plant to return to operation or increase the output and reliability
of supply to such an extent that both the government and the private sector investor would benefit.
Private sector mining companies needing access to incremental electricity supplies for large new
mining/mineral processing projects would be an example of possible investors under this model. In this
case, the private sector partner might also have responsibility for operation and maintenance of the
entire plant over the concession period to ensure that reliability is maintained, and returned in good
condition to the government utility at the end of the concession period.
Financial risk coverage instruments are available from the World Bank and IFC and may be necessary in
countries without robust financial institutions, power distribution utilities that lack adequate credit
ratings to satisfy project investors or constitute political risk where investors may need supplementary
guarantees from international financial institutions.
Rehabilitation of Hydropower
43
8.3 Institutional, Environmental and Social
8.3.1 Opportunities and Incentives
A rehabilitation project provides opportunities for capacity building, training, environmental
rehabilitation and compensation, and the opportunity to develop social programs aimed at affected
populations. These are often relatively low cost and effective programs that provide for long term
benefits to the communities and the environment. Funds for this type of project can be included in
financing from various sources such as multilateral institutions and commercial banks. In Brazil for
example, the national economic development bank (BNDES) will loan additional funds to be allocated to
environmental or social improvement programs as an incentive for obtaining future financing at
preferential rates. The amount is equivalent to 1-2% of the total project financing and cannot be used to
meet the environmental regulatory requirements of the project and must meet certain conditions, such
as generate local employment. These funds are available at lower rates and do not necessarily have to
be spent on programs directly related to the project but can be used to alleviate legacy issues or address
any other capacity, education, environmental or social needs.
A rehabilitation project also offers the opportunity to address any unforeseen environmental and social
impacts due to the project that resulted from constructing the original plant.
8.3.2 Weak Institutional Capacity
As many of the existing hydro plants in Africa and to a lesser extent in South America, are owned by
government utilities, the availability of skilled resources within the government agencies and authorities
to manage project implementation and to shepherd projects through the approval stages is likely to be a
barrier in some cases. Weak institutional capacity of relevant agencies combined with civil unrest, war
and disaster has led to significant neglect of infrastructure maintenance in many African countries.
However, differences in governance, private sector involvement, level of economic activity, conditions
of peace and stability, and electricity demand, factors which are often inter-related, will significantly
affect infrastructure spending among countries and a range of institutional capacity and infrastructure
maintenance needs exist throughout the continent.
Typical institutional weaknesses that can hinder infrastructure project implementation include:
Lack of institutional coordination.
Lack of or weak communication mechanisms among different administration levels.
Centralization of decision-making and lack, or little flow, of information resulting in decisions
not reflecting actual needs.
8.3.3 Weak Private Sector
In many countries in Africa, the private sector is weak (and/or few private players exist) because of
bureaucratic and policy obstacles. The cost of doing business in Africa can be 20 to 40% above other
Rehabilitation of Hydropower
44
regions due to high regulatory costs, unsecured land property rights, unfair competition from well-
connected companies, ineffective judiciary systems, policy uncertainty, and corruption.
8.3.4 Regulatory Changes
On the environmental side, in many countries approval processes and approval criteria may have
changed significantly since the project was first constructed. Depending on the regulations that apply
this could make it more difficult for a rehab project to receive approval even if the environmental
impacts could be shown to be minimal or non-existent.
Expansions or even rehabilitations can trigger the application of today’s much higher standards and to
the extent the approvals processes can be completed or, at a minimum, fully scoped, a major source of
uncertainty can be removed or reduced. Depending on the source of funding one will have to apply the
World Bank Safeguards7, the Equator Principles8, IFC’s performance standards9 etc. to evaluate impacts
and devise potential mitigation/adaptation measures. These may apply for expansions or upgrades alike
depending on their separate criteria.
8.3.5 Changes in Watershed
Significant changes in watersheds upstream of hydro works can happen over time, especially with the
long life cycles of most infrastructure. For example, in countries where economic development has
encouraged the expansion of agriculture, deforestation to make place for crop land has led to increased
sediment transport in rivers. This can lead to an increase in the sedimentation rate of reservoirs,
decreasing live storage and affecting equipment and generation. Dredging reservoirs regularly can
increase operating costs significantly and add to the complexity of operating a power plant with limited
resources.
The settling of population and communities around reservoir shorelines or downstream of a
hydropower plant along the river may constrain rehabilitation projects that wish to realign the
management of water resources to meet market opportunities or demand, limiting the amount of
peaking operations and water level fluctuation that the river system can absorb without significant
environmental and social effects. Public support for this type of project can prove more difficult if
legacy issues are already present.
7 www.worldbank.org/safeguards
8 http://www.equator-principles.com/
9 www.ifc.org/performancestandards
Rehabilitation of Hydropower
45
9 CONCLUSIONS
9.1 Hydropower Assets Tool
A spreadsheet-based hydropower assets tool (HAT) was applied to two regional inventories of hydroelectric generating station data and a summary was prepared outlining stations and units assessed to be in good, fair and poor condition. The assessments carried out by the HAT are based on the age of the assets measured from the initial date of commissioning. The trigger ages used for this assessment may not reflect the particular conditions in all regions of the world and should be verified with actual experience.
By applying the tool to the two regions, 120 potential projects were located in two limited regions; continental Africa and Central America and Mexico.
In Africa, a total of 73 plants were indicated to have economic rehabilitation potential. Of these 25 are plants with a capacity of less than 50 MW but more than 10 MW, 35 plants between 51 and 250 MW and 13 plants of greater than 250 MW.
In Central America a total of 47 plants were identified. Seventeen were plants under 50 MW but over 10 MW, 22 plants between 51 and 250 MW and 8 plants over 250 MW.
9.2 Market Analysis of Hydropower Rehabilitation
Building on the results from the HAT, a spreadsheet model was developed which applied to the two regional inventories, was used to arrive at an assessment of the potential market for hydropower rehabilitation. Rehabilitation being considered in this assessment is concerned only with major electrical and mechanical equipment and not the civil aspects of the dams, waterways, station, etc. The model was based on typical benefits to be gained from rehabilitation in terms of efficiency, capacity and availability. A life extension scenario involving like-for-like replacement of the turbine runner and an upgrade scenario involving modern day improvements to the runner were examined.
The application of the economic analysis to the inventories gave an order of magnitude estimate of the value of the cost for economic rehabilitation projects in 2011 to be in excess of US$ 4 billion for the life extension scenario and greater than US$ 5 billion for the upgrade scenario. The total net present value of benefits is estimated at US$ 3 billion and US$ 5 billion respectively for the two scenarios. The net present values of benefits are estimated to increase to US$ 8 and US$ 10 billion, respectively, by 2025 assuming that no rehabilitation is undertaken in the intervening time.
If the rehabilitation is deferred, the net benefits and IRR increase as indicated above however one can expect availability and reliability of the power production to drop. Thus, from a system capability perspective it is quite likely that there is a shortfall in the energy production and the risks and costs of inaction should be considered in terms of alternatives which could be used to meet the energy requirements. The current analysis uses typical energy values that one might expect but it does not go into the detail of examining alternative sources of supply which is a project specific study. Another consideration is the uncertainty of financing which could exist if the project is postponed. This analysis does, however, provide the scale of the economics of rehabilitation which was the objective of this part of the study.
Rehabilitation of Hydropower
46
This market analysis for hydropower plant rehabilitation has two limitations: (i) there is no consideration of the actual condition of the individual units; and (ii) there is no consideration if the units have already been rehabilitated as this information was not available.
9.3 Lessons Learned from Rehabilitation Case Studies
Several historical rehabilitation and extension projects were reviewed with the objective of identifying
“Lessons Learned” to assist in the future planning and execution of hydropower rehabilitation projects.
Nine case studies that were reviewed indicated the following main Lessons Learned. The lessons have
been used to generate a generic ORAF (Operational Risk Assessment Framework) that is attached in
appendix D. Even though some of these factors seem obvious in retrospect, they are nonetheless
important and might easily be missed related to the complex issues of a rehabilitation project.
9.3.1 Technical
Turbine and generator efficiency tests to verify pre- and post- equipment performance are essential as units may be performing worse than originally anticipated.
Where possible, testing of a single unit upgrade performance prior to undertaking the remainder of the unit upgrades is recommended as this can lead to changes in the designs for subsequent units to maximize benefits. Homologous testing and CFD can be considered.
The life extension option which only recovers historical efficiency and availability degradation may be significantly less economic than the upgrade option involving installation of more efficient and higher capacity equipment associated with modern technology.
Owners / operators of the station should be involved with the manufacturers to the maximum extent possible in both the design and implementation of the rehabilitation in order to increase knowledge transfer, the performance of the unit and reduce costs.
Well defined and clearly limited rehabilitation objectives and specifications will avoid conflicts on scope of rehabilitation work during the project execution phase.
Issues such as sediment transport and its effect on equipment should not be underestimated or treated lightly in the design stage.
9.3.2 Contractual / Implementation
It is not beneficial from a financial or project implementation perspective to pass all risks associated with uncertainties on equipment condition to the contractor during the bid/proposal stage.
Careful management of materials, workers, equipment and logistics / work schedules is essential to minimizing problems at site and preventing or minimizing site schedule delays and cost overruns.
Hydropower rehabilitation projects are susceptible to changes and timely mid-term reviews are important to update methodologies and work schedules.
While extension / expansion projects can be impacted by low load growth, one of the advantages of rehabilitation projects is that they are unlikely to suffer the same effect as the increment in output is smaller.
Rehabilitation of Hydropower
47
Attention should be paid to the risks related to possible delays caused by the project approvals, as well as delays during preparation and holding of procurement tender.
A primary task during the project implementation is to identify deviations from what was planned and to initiate activities to ensure that appropriate approvals are obtained prior to proceeding with any deviations.
9.3.3 Institutional / Financial
Hydropower projects in general and rehabilitation in particular has complex procurement procedures. For clients that have poor procurement capacity and experience with these types of projects, their capacity should be improved prior to commencement of the works in order to avoid delays caused by poor procurement decisions.
The project can provide workers with excellent training through close cooperation with the contractors. Furthermore, early cooperation with local authorities might build required competencies locally that reduce the costs and complications of importing workers.
Due to the restricted time available for completion of the rehabilitation, a focus on team work and team building are imperative to successful project implementation.
Rehabilitation projects require more flexible financial solutions to reflect findings during project implementation. This requires complex financing arrangements that need financial and engineering expertise to be navigated timely and successfully.
In most successful projects, the affected stakeholders have been involved at an early stage as their experiences and requirements can affect the project, even for smaller rehabilitation projects.
Review of project cost estimates by an independent consultant helps to ensure that the estimates are reasonable and up to date and increases the accuracy, minimizing cost overruns or under runs.
Technical and engineering skills, strong project ownership and commitment to results as well as accountability on the side of the project owner are critical success factors.
Rehabilitation of Hydropower
48
9.3.4 Rehabilitation Projects - Barriers and Incentives
Traditional economic assessment may not consider risk for rehabilitation, upgrades or replacement schemes. However, in most cases risk-costs are an important factor in determining the need for interventions. Risk of failure(s) of hydropower components increases with time in a nonlinear manner as a failure-probability curve. The consequent cost of failure can be an important factor in assessing and justifying the rehabilitation of hydropower components.
A key consideration in rehabilitation is to economically optimize outage scheduling of the generating units without compromising system operational constraints.
Extension / expansion of existing hydropower projects require a detailed examination of the hydrology, power demand and civil costs to assess a project’s overall economic value. The current study does not deal with extensions / expansions in any material way.
A rehabilitation project allows for non-structural optimization and adaptation to changes in the natural hydrology, re-optimization of cascade releases, updating operational rules etc.
It is prudent to examine the safety aspects of the water retaining and other civil structures to ensure that they can be expected to have a life which can justify the capital investment involved in the rehabilitation.
The ability to arrange financing for a rehabilitation project depends on the level of risk judged to be associated with the project, the communication of the project to potential funders and the risk appetite of the potential funders that express interest in the project.
The length of time required to complete IFI funding arrangements for investment in hydro rehabilitation projects and the terms and conditions of such funding has been seen by some owners as a limitation on the attractiveness of this funding.
As many of the existing hydro plants are owned by government utilities the availability of skilled resources to shepherd projects through the approval stages and to manage project implementation is likely to be a barrier in some cases.
Rehabilitation of Hydropower
49
REFERENCES
International Electrotechnical Commission (IEC), Hydraulic turbines, storage pumps and pump-turbines –
Rehabilitation and performance improvement, IEC 62256, Edition 1.0, 2008
BP, Statistical Review of World Energy 2011,
http://www.bp.com/sectionbodycopy.do?categoryId=7500&contentId=7068481 accessed 6/14/2011.
Welte, May 2008, Deterioration and Maintenance Models for Components in Hydropower Plants, NTNU,
Trondheim, Norway
World Bank, December 2004, Framework for Policy and Decision-Making on Dam and Hydro Plant
Rehabilitation and Uprating.
http://intresources.worldbank.org/INTHYDPOW/Resources/PaperWB_EDF.pdf accessed 6/10/2011.
World Bank, 2006, The Financing of Water Infrastructure: A Review of Case Studies,
http://www.worldbank.org/water accessed 2/2/2011
Rehabilitation of Hydropower
1
ANNEXES

Rehabilitation of Hydropower
2
Annex A
– Hydropower Asset Tool (HAT)
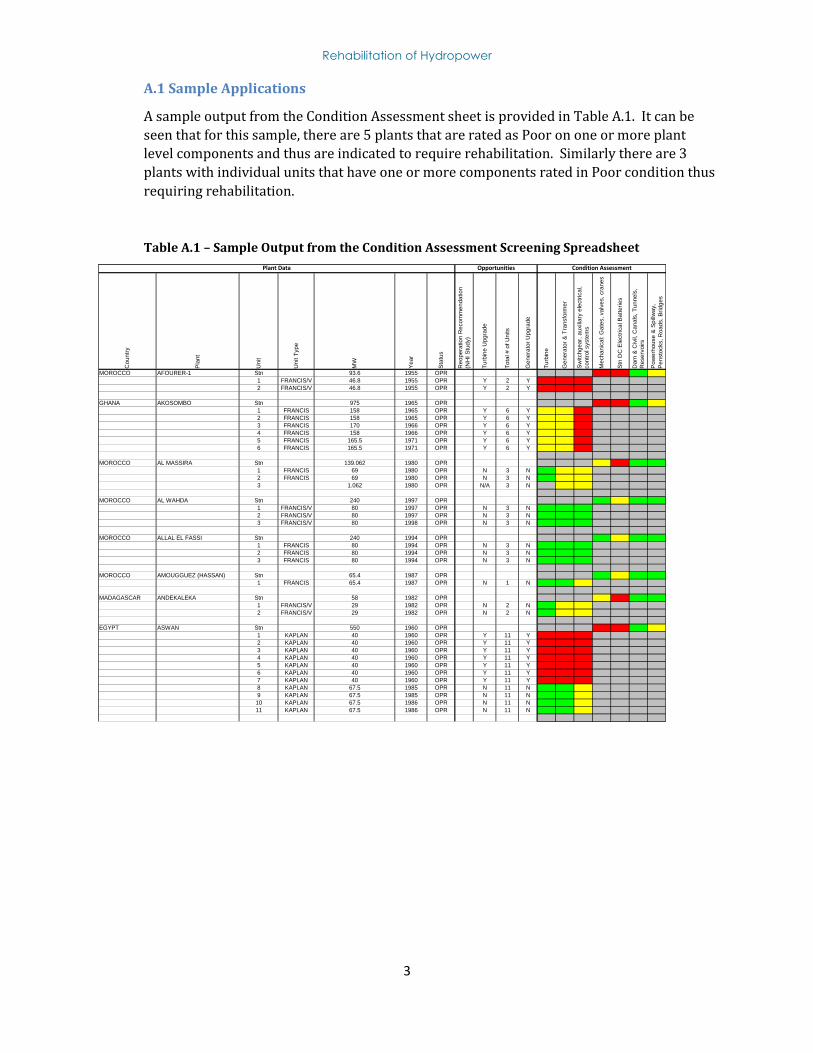
Rehabilitation of Hydropower
3
A.1 Sample Applications
A sample output from the Condition Assessment sheet is provided in Table A.1. It can be
seen that for this sample, there are 5 plants that are rated as Poor on one or more plant
level components and thus are indicated to require rehabilitation. Similarly there are 3
plants with individual units that have one or more components rated in Poor condition thus
requiring rehabilitation.
Table A.1 – Sample Output from the Condition Assessment Screening Spreadsheet
Countr
y
Pla
nt
Unit
Unit T
ype
MW
Year
Sta
tus
Reopera
tion R
ecom
mendation
(NH
I S
tudy)
Turb
ine U
pgra
de
Tota
l # o
f U
nits
Genera
tor
Upgra
de
Turb
ine
Genera
tor
& T
ransfo
rmer
Sw
itchgear,
auxili
ary
ele
ctr
ical,
contr
ol syste
ms
Mechanic
al: G
ate
s, valv
es, cra
nes
Stn
DC
Ele
ctr
ical B
atteries
Dam
& C
ivil,
Canals
, T
unnels
,
Reserv
oirs
Pow
erh
ouse &
Spill
way,
Pensto
cks, R
oads, B
ridges
MOROCCO AFOURER-1 Stn 93.6 1955 OPR N/A N/A N/A 54 54 54 54
1 FRANCIS/V 46.8 1955 OPR Y 2 Y 54 54 54 N/A N/A N/A N/A
2 FRANCIS/V 46.8 1955 OPR Y 2 Y 54 54 54 N/A N/A N/A N/A
N/A 2009 2009 N/A N/A N/A N/A
GHANA AKOSOMBO Stn 975 1965 OPR N/A N/A N/A 44 44 44 44
1 FRANCIS 158 1965 OPR Y 6 Y 44 44 44 N/A N/A N/A N/A
2 FRANCIS 158 1965 OPR Y 6 Y 44 44 44 N/A N/A N/A N/A
3 FRANCIS 170 1966 OPR Y 6 Y 43 43 43 N/A N/A N/A N/A
4 FRANCIS 158 1966 OPR Y 6 Y 43 43 43 N/A N/A N/A N/A
5 FRANCIS 165.5 1971 OPR Y 6 Y 38 38 38 N/A N/A N/A N/A
6 FRANCIS 165.5 1971 OPR Y 6 Y 38 38 38 N/A N/A N/A N/A
N/A 2009 2009 N/A N/A N/A N/A
MOROCCO AL MASSIRA Stn 139.062 1980 OPR N/A N/A N/A 29 29 29 29
1 FRANCIS 69 1980 OPR N 3 N 29 29 29 N/A N/A N/A N/A
2 FRANCIS 69 1980 OPR N 3 N 29 29 29 N/A N/A N/A N/A
3 1.062 1980 OPR N/A 3 N N/A 29 29 N/A N/A N/A N/A
N/A 2009 2009 N/A N/A N/A N/A
MOROCCO AL WAHDA Stn 240 1997 OPR N/A N/A N/A 12 12 12 12
1 FRANCIS/V 80 1997 OPR N 3 N 12 12 12 N/A N/A N/A N/A
2 FRANCIS/V 80 1997 OPR N 3 N 12 12 12 N/A N/A N/A N/A
3 FRANCIS/V 80 1998 OPR N 3 N 11 11 11 N/A N/A N/A N/A
N/A 2009 2009 N/A N/A N/A N/A
MOROCCO ALLAL EL FASSI Stn 240 1994 OPR N/A N/A N/A 15 15 15 15
1 FRANCIS 80 1994 OPR N 3 N 15 15 15 N/A N/A N/A N/A
2 FRANCIS 80 1994 OPR N 3 N 15 15 15 N/A N/A N/A N/A
3 FRANCIS 80 1994 OPR N 3 N 15 15 15 N/A N/A N/A N/A
N/A 2009 2009 N/A N/A N/A N/A
MOROCCO AMOUGGUEZ (HASSAN) Stn 65.4 1987 OPR N/A N/A N/A 22 22 22 22
1 FRANCIS 65.4 1987 OPR N 1 N 22 22 22 N/A N/A N/A N/A
N/A 2009 2009 N/A N/A N/A N/A
MADAGASCAR ANDEKALEKA Stn 58 1982 OPR N/A N/A N/A 27 27 27 27
1 FRANCIS/V 29 1982 OPR N 2 N 27 27 27 N/A N/A N/A N/A
2 FRANCIS/V 29 1982 OPR N 2 N 27 27 27 N/A N/A N/A N/A
N/A 2009 2009 N/A N/A N/A N/A
EGYPT ASWAN Stn 550 1960 OPR N/A N/A N/A 49 49 49 49
1 KAPLAN 40 1960 OPR Y 11 Y 49 49 49 N/A N/A N/A N/A
2 KAPLAN 40 1960 OPR Y 11 Y 49 49 49 N/A N/A N/A N/A
3 KAPLAN 40 1960 OPR Y 11 Y 49 49 49 N/A N/A N/A N/A
4 KAPLAN 40 1960 OPR Y 11 Y 49 49 49 N/A N/A N/A N/A
5 KAPLAN 40 1960 OPR Y 11 Y 49 49 49 N/A N/A N/A N/A
6 KAPLAN 40 1960 OPR Y 11 Y 49 49 49 N/A N/A N/A N/A
7 KAPLAN 40 1960 OPR Y 11 Y 49 49 49 N/A N/A N/A N/A
8 KAPLAN 67.5 1985 OPR N 11 N 24 24 24 N/A N/A N/A N/A
9 KAPLAN 67.5 1985 OPR N 11 N 24 24 24 N/A N/A N/A N/A
10 KAPLAN 67.5 1986 OPR N 11 N 23 23 23 N/A N/A N/A N/A
11 KAPLAN 67.5 1986 OPR N 11 N 23 23 23 N/A N/A N/A N/A
N/A 2009 2009 N/A N/A N/A N/A
Plant Data Opportunities Condition Assessment

Rehabilitation of Hydropower
1
Annex B
– Economic Assessment Model
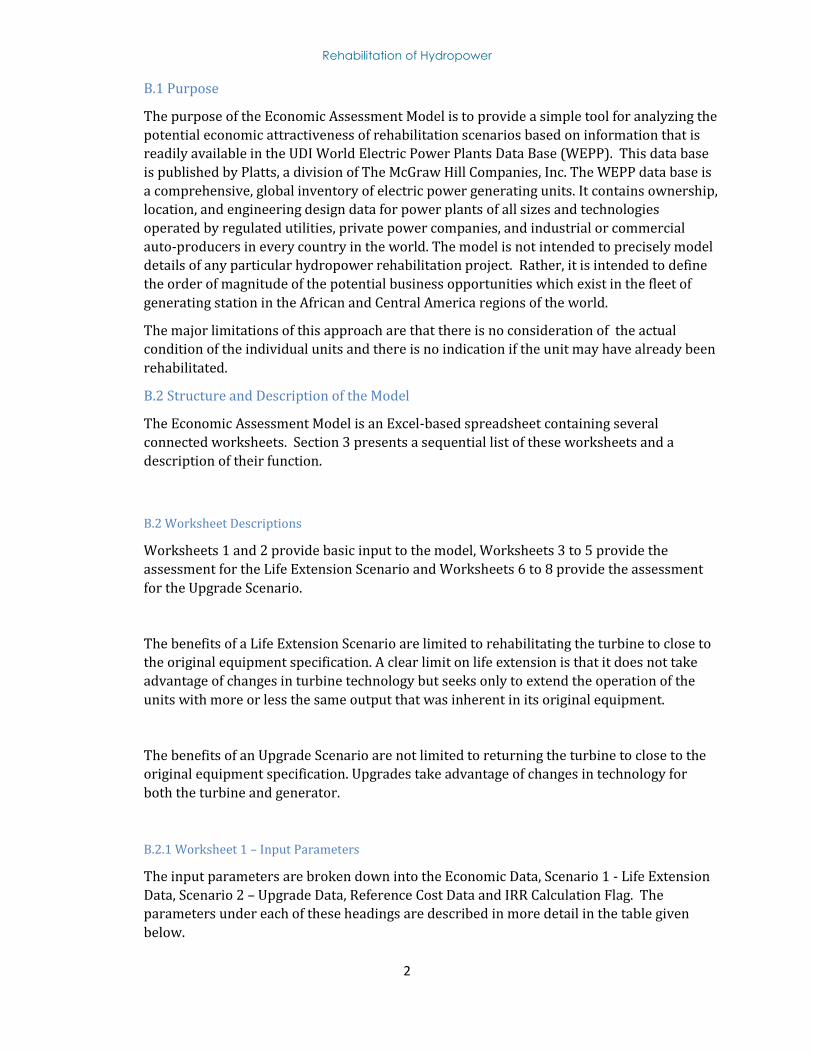
Rehabilitation of Hydropower
2
B.1 Purpose
The purpose of the Economic Assessment Model is to provide a simple tool for analyzing the
potential economic attractiveness of rehabilitation scenarios based on information that is
readily available in the UDI World Electric Power Plants Data Base (WEPP). This data base
is published by Platts, a division of The McGraw Hill Companies, Inc. The WEPP data base is
a comprehensive, global inventory of electric power generating units. It contains ownership,
location, and engineering design data for power plants of all sizes and technologies
operated by regulated utilities, private power companies, and industrial or commercial
auto-producers in every country in the world. The model is not intended to precisely model
details of any particular hydropower rehabilitation project. Rather, it is intended to define
the order of magnitude of the potential business opportunities which exist in the fleet of
generating station in the African and Central America regions of the world.
The major limitations of this approach are that there is no consideration of the actual
condition of the individual units and there is no indication if the unit may have already been
rehabilitated.
B.2 Structure and Description of the Model
The Economic Assessment Model is an Excel-based spreadsheet containing several
connected worksheets. Section 3 presents a sequential list of these worksheets and a
description of their function.
B.2 Worksheet Descriptions
Worksheets 1 and 2 provide basic input to the model, Worksheets 3 to 5 provide the
assessment for the Life Extension Scenario and Worksheets 6 to 8 provide the assessment
for the Upgrade Scenario.
The benefits of a Life Extension Scenario are limited to rehabilitating the turbine to close to
the original equipment specification. A clear limit on life extension is that it does not take
advantage of changes in turbine technology but seeks only to extend the operation of the
units with more or less the same output that was inherent in its original equipment.
The benefits of an Upgrade Scenario are not limited to returning the turbine to close to the
original equipment specification. Upgrades take advantage of changes in technology for
both the turbine and generator.
B.2.1 Worksheet 1 – Input Parameters
The input parameters are broken down into the Economic Data, Scenario 1 - Life Extension
Data, Scenario 2 – Upgrade Data, Reference Cost Data and IRR Calculation Flag. The
parameters under each of these headings are described in more detail in the table given
below.
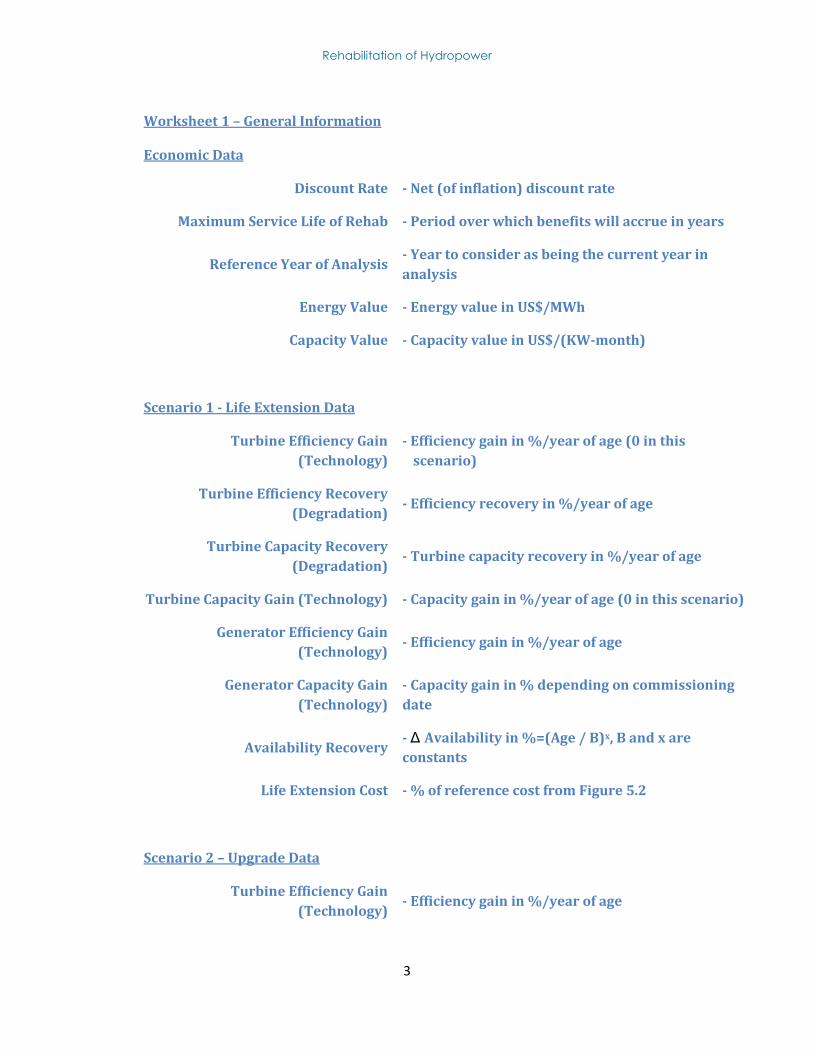
Rehabilitation of Hydropower
3
Worksheet 1 – General Information
Economic Data
Discount Rate - Net (of inflation) discount rate
Maximum Service Life of Rehab - Period over which benefits will accrue in years
Reference Year of Analysis - Year to consider as being the current year in
analysis
Energy Value - Energy value in US$/MWh
Capacity Value - Capacity value in US$/(KW-month)
Scenario 1 - Life Extension Data
Turbine Efficiency Gain
(Technology)
- Efficiency gain in %/year of age (0 in this
scenario)
Turbine Efficiency Recovery
(Degradation) - Efficiency recovery in %/year of age
Turbine Capacity Recovery
(Degradation) - Turbine capacity recovery in %/year of age
Turbine Capacity Gain (Technology) - Capacity gain in %/year of age (0 in this scenario)
Generator Efficiency Gain
(Technology) - Efficiency gain in %/year of age
Generator Capacity Gain
(Technology)
- Capacity gain in % depending on commissioning
date
Availability Recovery - Δ Availability in %=(Age / B)x, B and x are
constants
Life Extension Cost - % of reference cost from Figure 5.2
Scenario 2 – Upgrade Data
Turbine Efficiency Gain
(Technology) - Efficiency gain in %/year of age
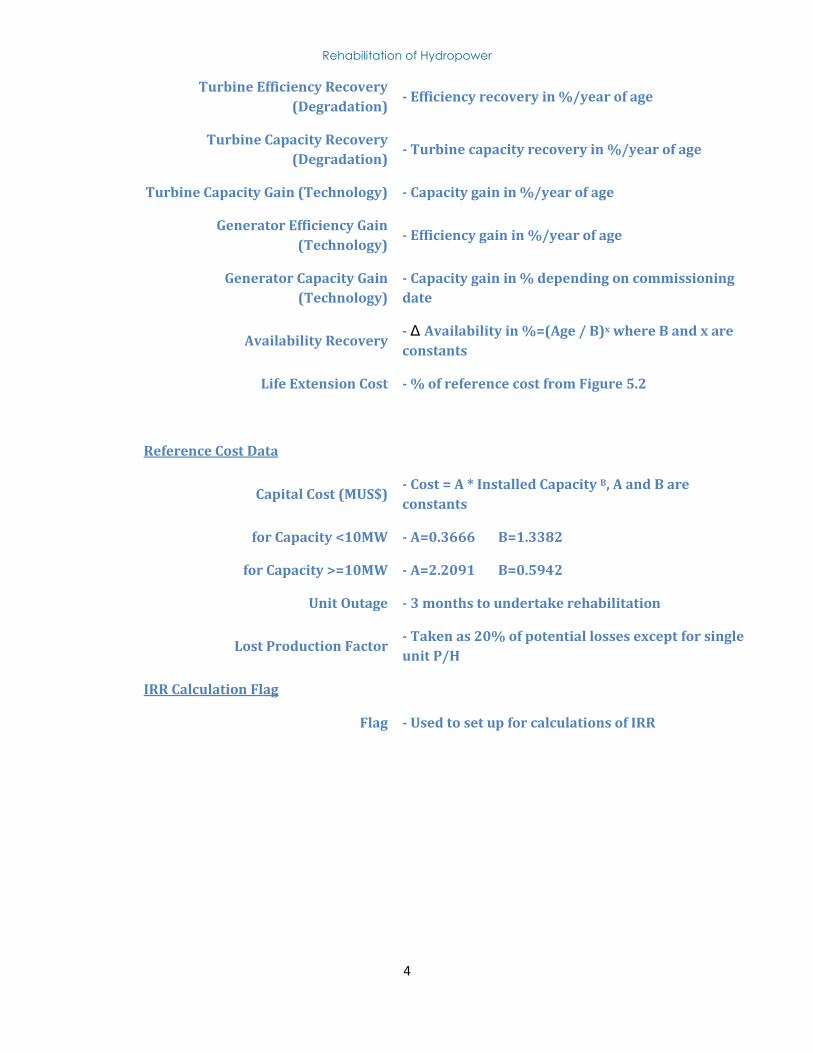
Rehabilitation of Hydropower
4
Turbine Efficiency Recovery
(Degradation) - Efficiency recovery in %/year of age
Turbine Capacity Recovery
(Degradation) - Turbine capacity recovery in %/year of age
Turbine Capacity Gain (Technology) - Capacity gain in %/year of age
Generator Efficiency Gain
(Technology) - Efficiency gain in %/year of age
Generator Capacity Gain
(Technology)
- Capacity gain in % depending on commissioning
date
Availability Recovery - Δ Availability in %=(Age / B)x where B and x are
constants
Life Extension Cost - % of reference cost from Figure 5.2
Reference Cost Data
Capital Cost (MUS$) - Cost = A * Installed Capacity B, A and B are
constants
for Capacity <10MW - A=0.3666 B=1.3382
for Capacity >=10MW - A=2.2091 B=0.5942
Unit Outage - 3 months to undertake rehabilitation
Lost Production Factor - Taken as 20% of potential losses except for single
unit P/H
IRR Calculation Flag
Flag - Used to set up for calculations of IRR
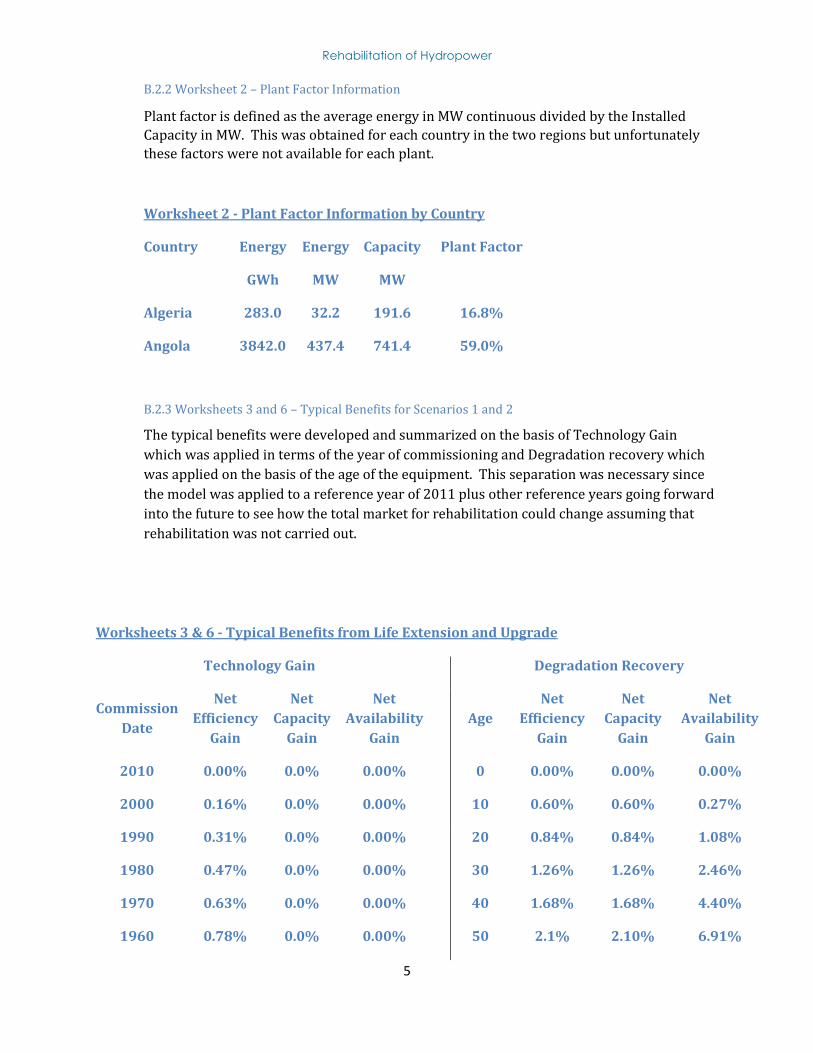
Rehabilitation of Hydropower
5
B.2.2 Worksheet 2 – Plant Factor Information
Plant factor is defined as the average energy in MW continuous divided by the Installed
Capacity in MW. This was obtained for each country in the two regions but unfortunately
these factors were not available for each plant.
Worksheet 2 - Plant Factor Information by Country
Country Energy Energy Capacity Plant Factor
GWh MW MW
Algeria 283.0 32.2 191.6 16.8%
Angola 3842.0 437.4 741.4 59.0%
B.2.3 Worksheets 3 and 6 – Typical Benefits for Scenarios 1 and 2
The typical benefits were developed and summarized on the basis of Technology Gain
which was applied in terms of the year of commissioning and Degradation recovery which
was applied on the basis of the age of the equipment. This separation was necessary since
the model was applied to a reference year of 2011 plus other reference years going forward
into the future to see how the total market for rehabilitation could change assuming that
rehabilitation was not carried out.
Worksheets 3 & 6 - Typical Benefits from Life Extension and Upgrade
Technology Gain
Degradation Recovery
Commission
Date
Net
Efficiency
Gain
Net
Capacity
Gain
Net
Availability
Gain
Age
Net
Efficiency
Gain
Net
Capacity
Gain
Net
Availability
Gain
2010 0.00% 0.0% 0.00%
0 0.00% 0.00% 0.00%
2000 0.16% 0.0% 0.00%
10 0.60% 0.60% 0.27%
1990 0.31% 0.0% 0.00%
20 0.84% 0.84% 1.08%
1980 0.47% 0.0% 0.00%
30 1.26% 1.26% 2.46%
1970 0.63% 0.0% 0.00%
40 1.68% 1.68% 4.40%
1960 0.78% 0.0% 0.00%
50 2.1% 2.10% 6.91%
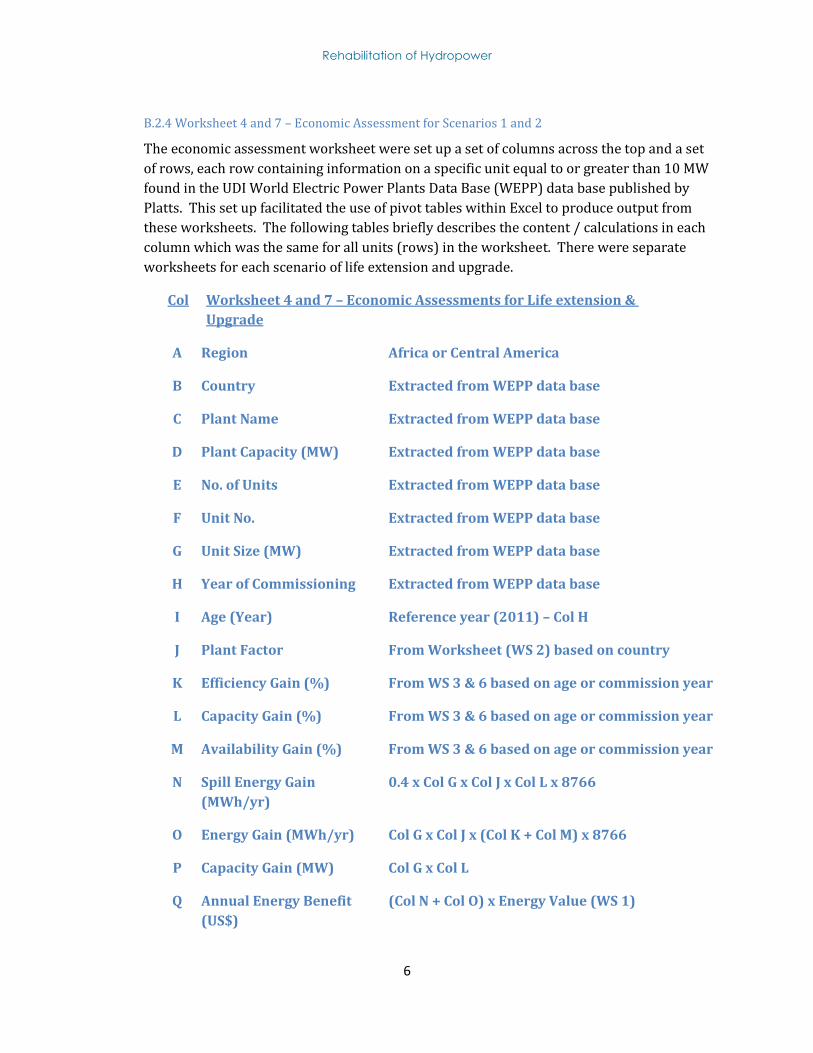
Rehabilitation of Hydropower
6
B.2.4 Worksheet 4 and 7 – Economic Assessment for Scenarios 1 and 2
The economic assessment worksheet were set up a set of columns across the top and a set
of rows, each row containing information on a specific unit equal to or greater than 10 MW
found in the UDI World Electric Power Plants Data Base (WEPP) data base published by
Platts. This set up facilitated the use of pivot tables within Excel to produce output from
these worksheets. The following tables briefly describes the content / calculations in each
column which was the same for all units (rows) in the worksheet. There were separate
worksheets for each scenario of life extension and upgrade.
Col Worksheet 4 and 7 – Economic Assessments for Life extension &
Upgrade
A Region Africa or Central America
B Country Extracted from WEPP data base
C Plant Name Extracted from WEPP data base
D Plant Capacity (MW) Extracted from WEPP data base
E No. of Units Extracted from WEPP data base
F Unit No. Extracted from WEPP data base
G Unit Size (MW) Extracted from WEPP data base
H Year of Commissioning Extracted from WEPP data base
I Age (Year) Reference year (2011) – Col H
J Plant Factor From Worksheet (WS 2) based on country
K Efficiency Gain (%) From WS 3 & 6 based on age or commission year
L Capacity Gain (%) From WS 3 & 6 based on age or commission year
M Availability Gain (%) From WS 3 & 6 based on age or commission year
N Spill Energy Gain
(MWh/yr)
0.4 x Col G x Col J x Col L x 8766
O Energy Gain (MWh/yr) Col G x Col J x (Col K + Col M) x 8766
P Capacity Gain (MW) Col G x Col L
Q Annual Energy Benefit
(US$)
(Col N + Col O) x Energy Value (WS 1)
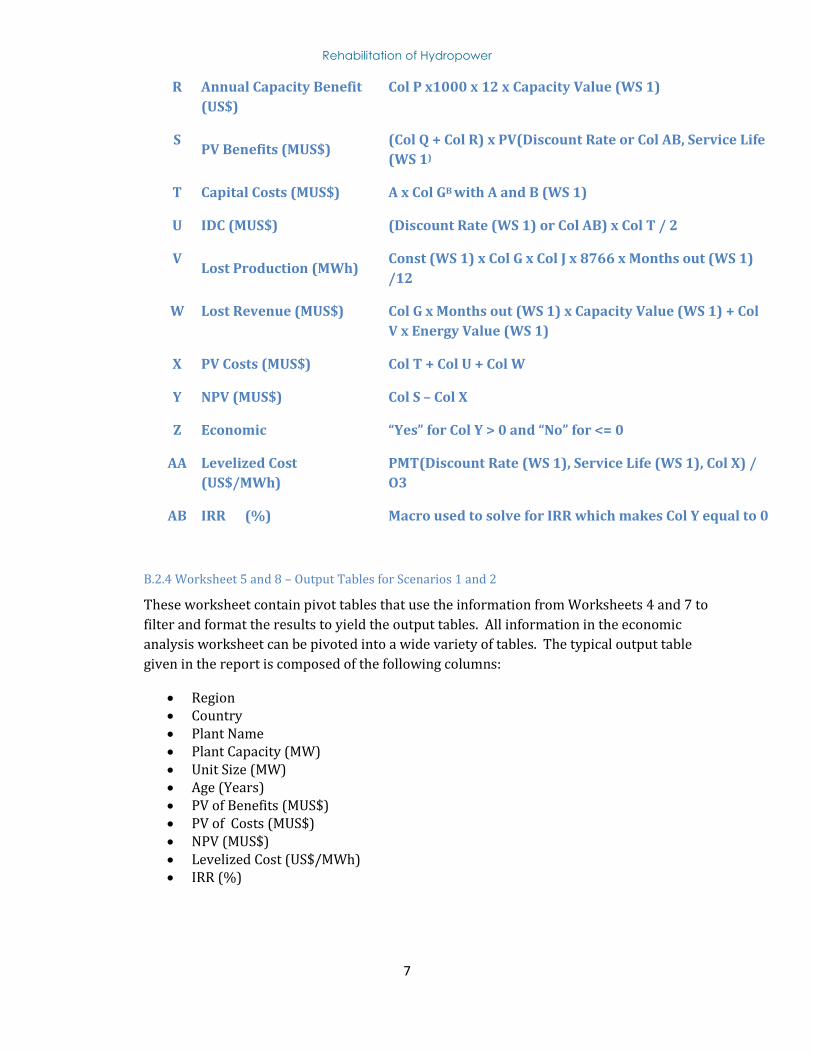
Rehabilitation of Hydropower
7
R Annual Capacity Benefit
(US$)
Col P x1000 x 12 x Capacity Value (WS 1)
S PV Benefits (MUS$)
(Col Q + Col R) x PV(Discount Rate or Col AB, Service Life
(WS 1)
T Capital Costs (MUS$) A x Col GB with A and B (WS 1)
U IDC (MUS$) (Discount Rate (WS 1) or Col AB) x Col T / 2
V Lost Production (MWh)
Const (WS 1) x Col G x Col J x 8766 x Months out (WS 1)
/12
W Lost Revenue (MUS$) Col G x Months out (WS 1) x Capacity Value (WS 1) + Col
V x Energy Value (WS 1)
X PV Costs (MUS$) Col T + Col U + Col W
Y NPV (MUS$) Col S – Col X
Z Economic “Yes” for Col Y > 0 and “No” for <= 0
AA Levelized Cost
(US$/MWh)
PMT(Discount Rate (WS 1), Service Life (WS 1), Col X) /
O3
AB IRR (%) Macro used to solve for IRR which makes Col Y equal to 0
B.2.4 Worksheet 5 and 8 – Output Tables for Scenarios 1 and 2
These worksheet contain pivot tables that use the information from Worksheets 4 and 7 to
filter and format the results to yield the output tables. All information in the economic
analysis worksheet can be pivoted into a wide variety of tables. The typical output table
given in the report is composed of the following columns:
Region Country Plant Name Plant Capacity (MW) Unit Size (MW) Age (Years) PV of Benefits (MUS$) PV of Costs (MUS$) NPV (MUS$) Levelized Cost (US$/MWh) IRR (%)
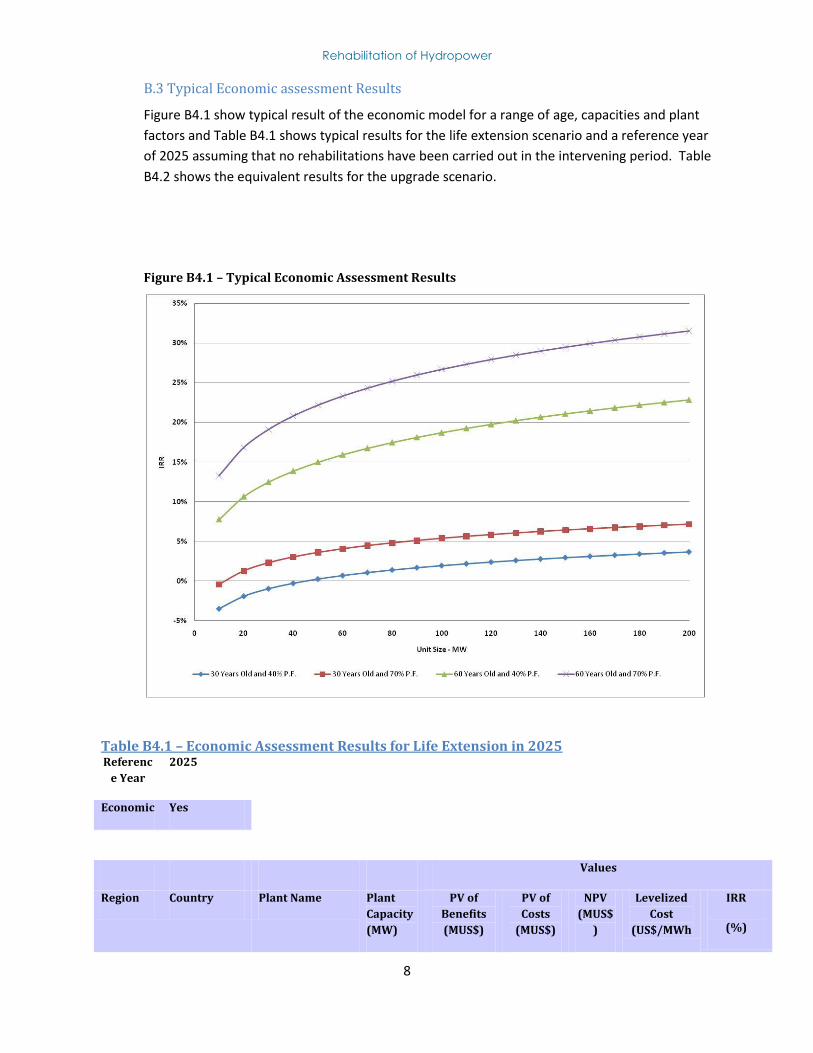
Rehabilitation of Hydropower
8
B.3 Typical Economic assessment Results
Figure B4.1 show typical result of the economic model for a range of age, capacities and plant
factors and Table B4.1 shows typical results for the life extension scenario and a reference year
of 2025 assuming that no rehabilitations have been carried out in the intervening period. Table
B4.2 shows the equivalent results for the upgrade scenario.
Figure B4.1 – Typical Economic Assessment Results
Table B4.1 – Economic Assessment Results for Life Extension in 2025
Referenc
e Year
2025
Economic Yes
Values
Region Country Plant Name Plant
Capacity
(MW)
PV of
Benefits
(MUS$)
PV of
Costs
(MUS$)
NPV
(MUS$
)
Levelized
Cost
(US$/MWh
IRR
(%)
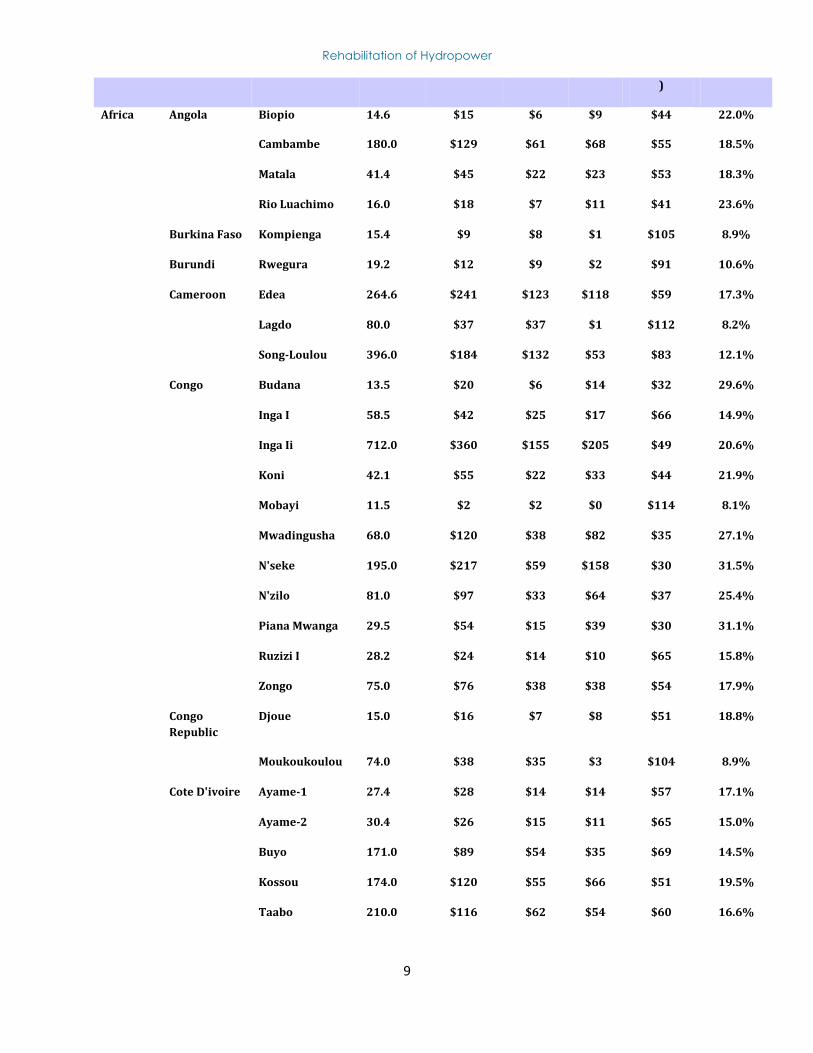
Rehabilitation of Hydropower
9
)
Africa Angola Biopio 14.6 $15 $6 $9 $44 22.0%
Cambambe 180.0 $129 $61 $68 $55 18.5%
Matala 41.4 $45 $22 $23 $53 18.3%
Rio Luachimo 16.0 $18 $7 $11 $41 23.6%
Burkina Faso Kompienga 15.4 $9 $8 $1 $105 8.9%
Burundi Rwegura 19.2 $12 $9 $2 $91 10.6%
Cameroon Edea 264.6 $241 $123 $118 $59 17.3%
Lagdo 80.0 $37 $37 $1 $112 8.2%
Song-Loulou 396.0 $184 $132 $53 $83 12.1%
Congo Budana 13.5 $20 $6 $14 $32 29.6%
Inga I 58.5 $42 $25 $17 $66 14.9%
Inga Ii 712.0 $360 $155 $205 $49 20.6%
Koni 42.1 $55 $22 $33 $44 21.9%
Mobayi 11.5 $2 $2 $0 $114 8.1%
Mwadingusha 68.0 $120 $38 $82 $35 27.1%
N'seke 195.0 $217 $59 $158 $30 31.5%
N'zilo 81.0 $97 $33 $64 $37 25.4%
Piana Mwanga 29.5 $54 $15 $39 $30 31.1%
Ruzizi I 28.2 $24 $14 $10 $65 15.8%
Zongo 75.0 $76 $38 $38 $54 17.9%
Congo
Republic
Djoue 15.0 $16 $7 $8 $51 18.8%
Moukoukoulou 74.0 $38 $35 $3 $104 8.9%
Cote D'ivoire Ayame-1 27.4 $28 $14 $14 $57 17.1%
Ayame-2 30.4 $26 $15 $11 $65 15.0%
Buyo 171.0 $89 $54 $35 $69 14.5%
Kossou 174.0 $120 $55 $66 $51 19.5%
Taabo 210.0 $116 $62 $54 $60 16.6%
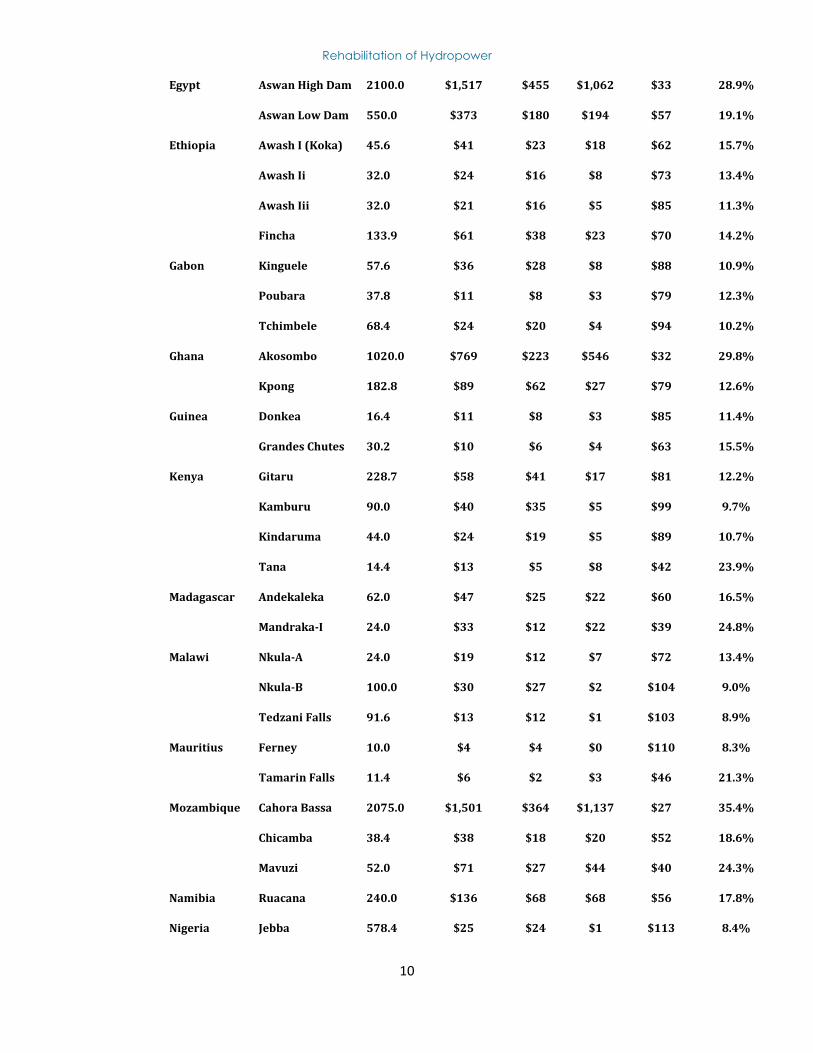
Rehabilitation of Hydropower
10
Egypt Aswan High Dam 2100.0 $1,517 $455 $1,062 $33 28.9%
Aswan Low Dam 550.0 $373 $180 $194 $57 19.1%
Ethiopia Awash I (Koka) 45.6 $41 $23 $18 $62 15.7%
Awash Ii 32.0 $24 $16 $8 $73 13.4%
Awash Iii 32.0 $21 $16 $5 $85 11.3%
Fincha 133.9 $61 $38 $23 $70 14.2%
Gabon Kinguele 57.6 $36 $28 $8 $88 10.9%
Poubara 37.8 $11 $8 $3 $79 12.3%
Tchimbele 68.4 $24 $20 $4 $94 10.2%
Ghana Akosombo 1020.0 $769 $223 $546 $32 29.8%
Kpong 182.8 $89 $62 $27 $79 12.6%
Guinea Donkea 16.4 $11 $8 $3 $85 11.4%
Grandes Chutes 30.2 $10 $6 $4 $63 15.5%
Kenya Gitaru 228.7 $58 $41 $17 $81 12.2%
Kamburu 90.0 $40 $35 $5 $99 9.7%
Kindaruma 44.0 $24 $19 $5 $89 10.7%
Tana 14.4 $13 $5 $8 $42 23.9%
Madagascar Andekaleka 62.0 $47 $25 $22 $60 16.5%
Mandraka-I 24.0 $33 $12 $22 $39 24.8%
Malawi Nkula-A 24.0 $19 $12 $7 $72 13.4%
Nkula-B 100.0 $30 $27 $2 $104 9.0%
Tedzani Falls 91.6 $13 $12 $1 $103 8.9%
Mauritius Ferney 10.0 $4 $4 $0 $110 8.3%
Tamarin Falls 11.4 $6 $2 $3 $46 21.3%
Mozambique Cahora Bassa 2075.0 $1,501 $364 $1,137 $27 35.4%
Chicamba 38.4 $38 $18 $20 $52 18.6%
Mavuzi 52.0 $71 $27 $44 $40 24.3%
Namibia Ruacana 240.0 $136 $68 $68 $56 17.8%
Nigeria Jebba 578.4 $25 $24 $1 $113 8.4%
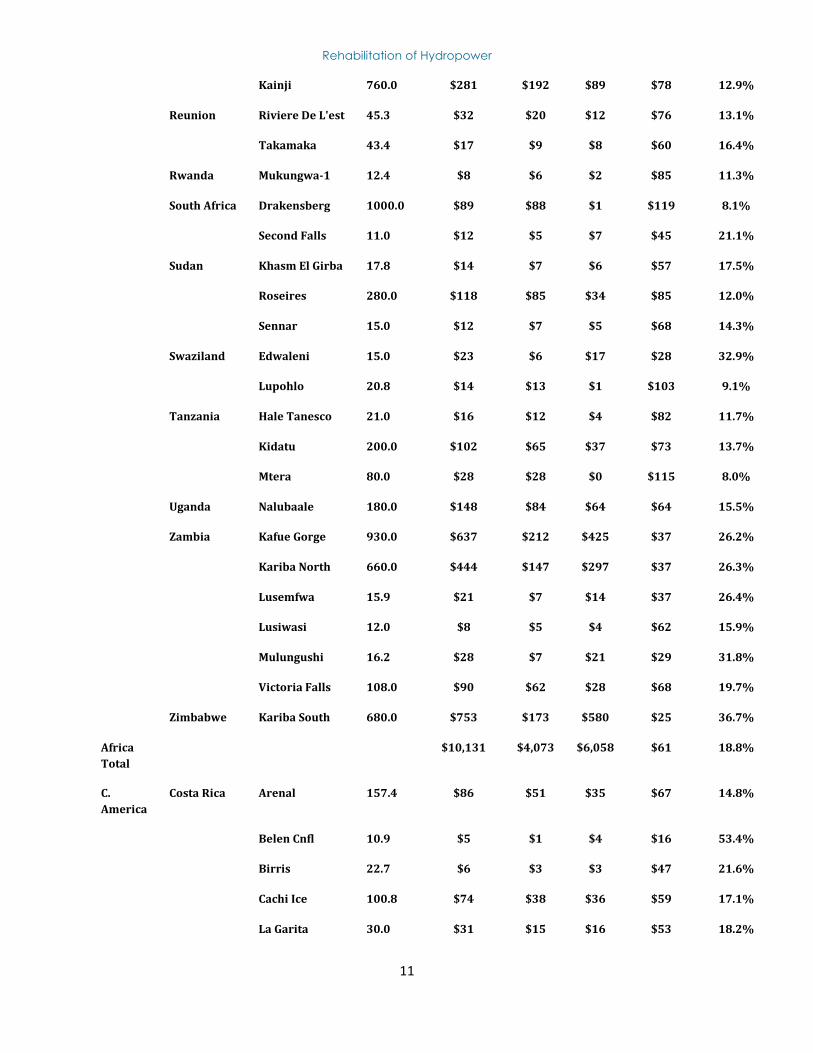
Rehabilitation of Hydropower
11
Kainji 760.0 $281 $192 $89 $78 12.9%
Reunion Riviere De L'est 45.3 $32 $20 $12 $76 13.1%
Takamaka 43.4 $17 $9 $8 $60 16.4%
Rwanda Mukungwa-1 12.4 $8 $6 $2 $85 11.3%
South Africa Drakensberg 1000.0 $89 $88 $1 $119 8.1%
Second Falls 11.0 $12 $5 $7 $45 21.1%
Sudan Khasm El Girba 17.8 $14 $7 $6 $57 17.5%
Roseires 280.0 $118 $85 $34 $85 12.0%
Sennar 15.0 $12 $7 $5 $68 14.3%
Swaziland Edwaleni 15.0 $23 $6 $17 $28 32.9%
Lupohlo 20.8 $14 $13 $1 $103 9.1%
Tanzania Hale Tanesco 21.0 $16 $12 $4 $82 11.7%
Kidatu 200.0 $102 $65 $37 $73 13.7%
Mtera 80.0 $28 $28 $0 $115 8.0%
Uganda Nalubaale 180.0 $148 $84 $64 $64 15.5%
Zambia Kafue Gorge 930.0 $637 $212 $425 $37 26.2%
Kariba North 660.0 $444 $147 $297 $37 26.3%
Lusemfwa 15.9 $21 $7 $14 $37 26.4%
Lusiwasi 12.0 $8 $5 $4 $62 15.9%
Mulungushi 16.2 $28 $7 $21 $29 31.8%
Victoria Falls 108.0 $90 $62 $28 $68 19.7%
Zimbabwe Kariba South 680.0 $753 $173 $580 $25 36.7%
Africa
Total
$10,131 $4,073 $6,058 $61 18.8%
C.
America
Costa Rica Arenal 157.4 $86 $51 $35 $67 14.8%
Belen Cnfl 10.9 $5 $1 $4 $16 53.4%
Birris 22.7 $6 $3 $3 $47 21.6%
Cachi Ice 100.8 $74 $38 $36 $59 17.1%
La Garita 30.0 $31 $15 $16 $53 18.2%
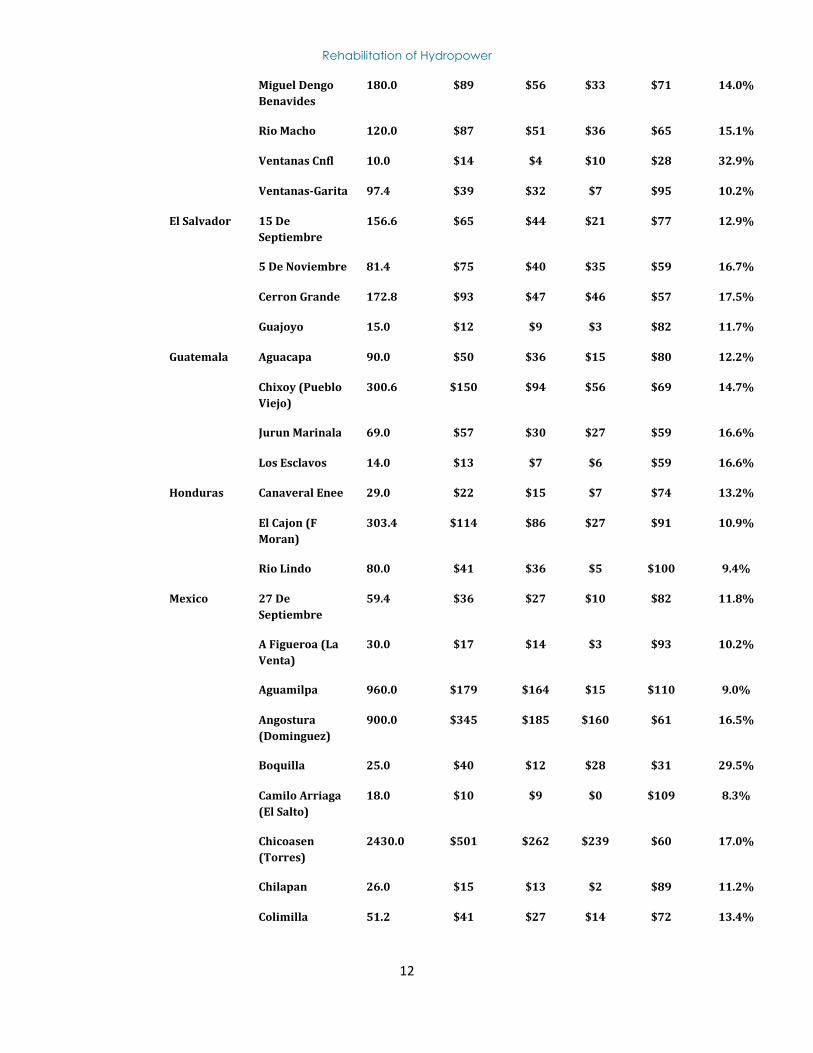
Rehabilitation of Hydropower
12
Miguel Dengo
Benavides
180.0 $89 $56 $33 $71 14.0%
Rio Macho 120.0 $87 $51 $36 $65 15.1%
Ventanas Cnfl 10.0 $14 $4 $10 $28 32.9%
Ventanas-Garita 97.4 $39 $32 $7 $95 10.2%
El Salvador 15 De
Septiembre
156.6 $65 $44 $21 $77 12.9%
5 De Noviembre 81.4 $75 $40 $35 $59 16.7%
Cerron Grande 172.8 $93 $47 $46 $57 17.5%
Guajoyo 15.0 $12 $9 $3 $82 11.7%
Guatemala Aguacapa 90.0 $50 $36 $15 $80 12.2%
Chixoy (Pueblo
Viejo)
300.6 $150 $94 $56 $69 14.7%
Jurun Marinala 69.0 $57 $30 $27 $59 16.6%
Los Esclavos 14.0 $13 $7 $6 $59 16.6%
Honduras Canaveral Enee 29.0 $22 $15 $7 $74 13.2%
El Cajon (F
Moran)
303.4 $114 $86 $27 $91 10.9%
Rio Lindo 80.0 $41 $36 $5 $100 9.4%
Mexico 27 De
Septiembre
59.4 $36 $27 $10 $82 11.8%
A Figueroa (La
Venta)
30.0 $17 $14 $3 $93 10.2%
Aguamilpa 960.0 $179 $164 $15 $110 9.0%
Angostura
(Dominguez)
900.0 $345 $185 $160 $61 16.5%
Boquilla 25.0 $40 $12 $28 $31 29.5%
Camilo Arriaga
(El Salto)
18.0 $10 $9 $0 $109 8.3%
Chicoasen
(Torres)
2430.0 $501 $262 $239 $60 17.0%
Chilapan 26.0 $15 $13 $2 $89 11.2%
Colimilla 51.2 $41 $27 $14 $72 13.4%
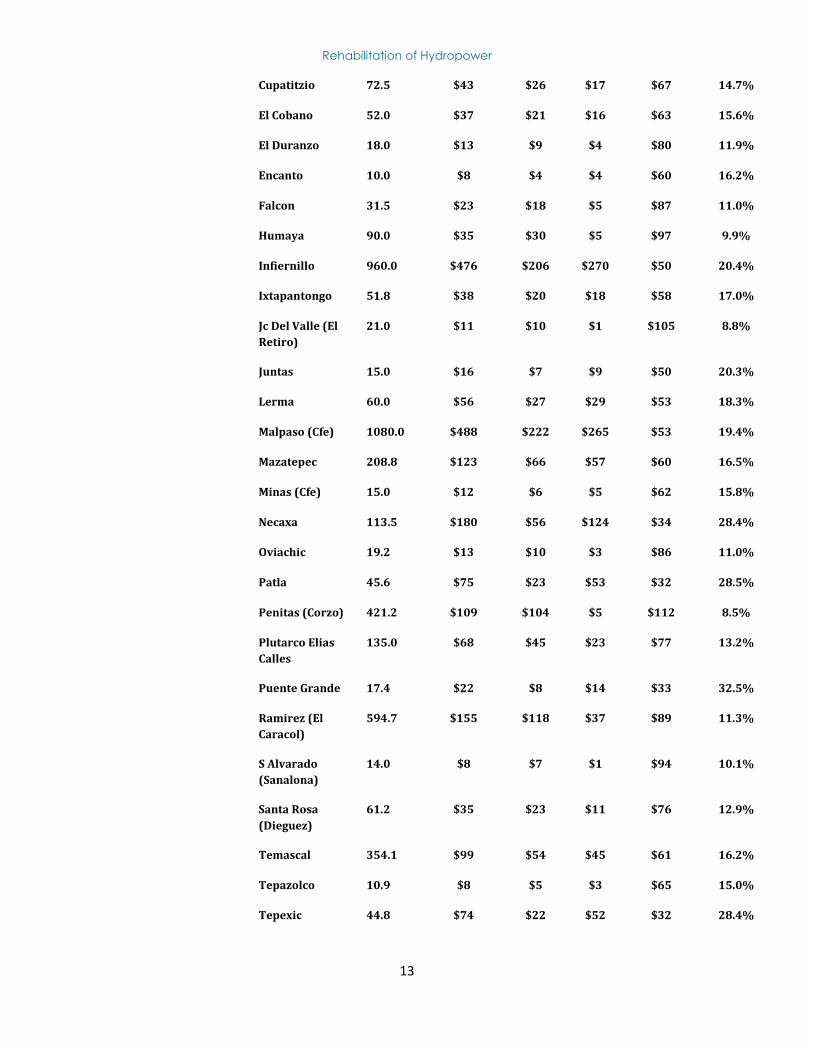
Rehabilitation of Hydropower
13
Cupatitzio 72.5 $43 $26 $17 $67 14.7%
El Cobano 52.0 $37 $21 $16 $63 15.6%
El Duranzo 18.0 $13 $9 $4 $80 11.9%
Encanto 10.0 $8 $4 $4 $60 16.2%
Falcon 31.5 $23 $18 $5 $87 11.0%
Humaya 90.0 $35 $30 $5 $97 9.9%
Infiernillo 960.0 $476 $206 $270 $50 20.4%
Ixtapantongo 51.8 $38 $20 $18 $58 17.0%
Jc Del Valle (El
Retiro)
21.0 $11 $10 $1 $105 8.8%
Juntas 15.0 $16 $7 $9 $50 20.3%
Lerma 60.0 $56 $27 $29 $53 18.3%
Malpaso (Cfe) 1080.0 $488 $222 $265 $53 19.4%
Mazatepec 208.8 $123 $66 $57 $60 16.5%
Minas (Cfe) 15.0 $12 $6 $5 $62 15.8%
Necaxa 113.5 $180 $56 $124 $34 28.4%
Oviachic 19.2 $13 $10 $3 $86 11.0%
Patla 45.6 $75 $23 $53 $32 28.5%
Penitas (Corzo) 421.2 $109 $104 $5 $112 8.5%
Plutarco Elias
Calles
135.0 $68 $45 $23 $77 13.2%
Puente Grande 17.4 $22 $8 $14 $33 32.5%
Ramirez (El
Caracol)
594.7 $155 $118 $37 $89 11.3%
S Alvarado
(Sanalona)
14.0 $8 $7 $1 $94 10.1%
Santa Rosa
(Dieguez)
61.2 $35 $23 $11 $76 12.9%
Temascal 354.1 $99 $54 $45 $61 16.2%
Tepazolco 10.9 $8 $5 $3 $65 15.0%
Tepexic 44.8 $74 $22 $52 $32 28.4%
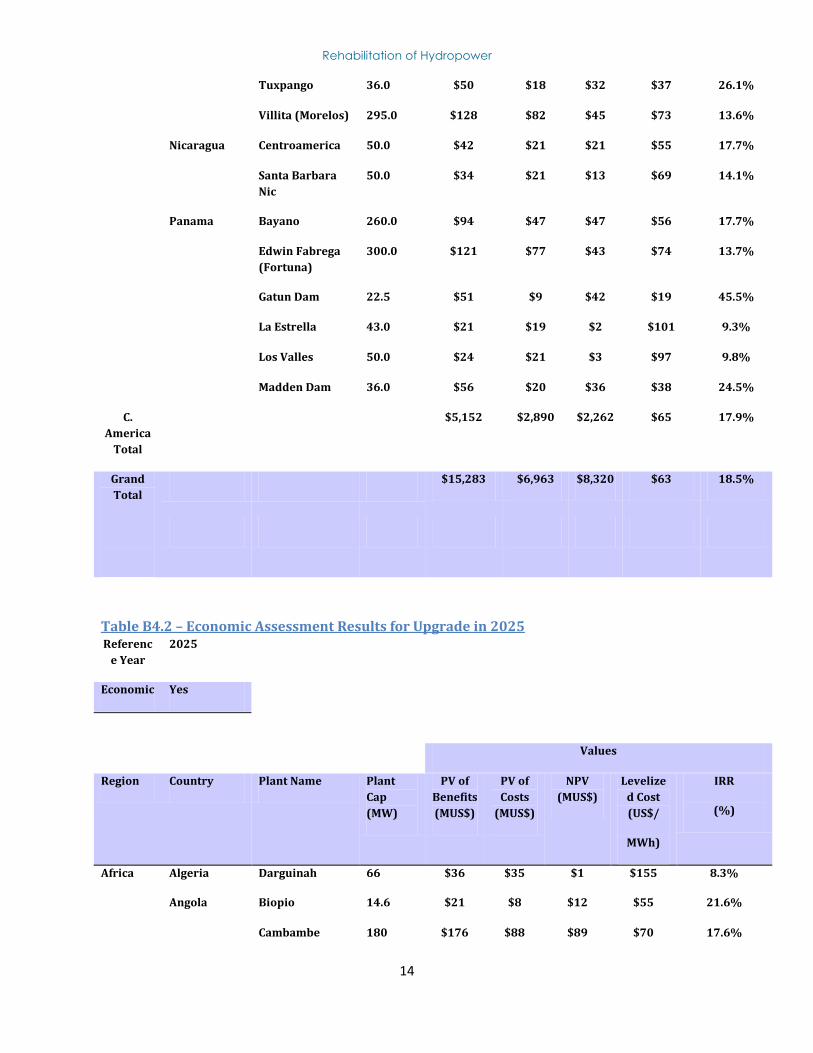
Rehabilitation of Hydropower
14
Tuxpango 36.0 $50 $18 $32 $37 26.1%
Villita (Morelos) 295.0 $128 $82 $45 $73 13.6%
Nicaragua Centroamerica 50.0 $42 $21 $21 $55 17.7%
Santa Barbara
Nic
50.0 $34 $21 $13 $69 14.1%
Panama Bayano 260.0 $94 $47 $47 $56 17.7%
Edwin Fabrega
(Fortuna)
300.0 $121 $77 $43 $74 13.7%
Gatun Dam 22.5 $51 $9 $42 $19 45.5%
La Estrella 43.0 $21 $19 $2 $101 9.3%
Los Valles 50.0 $24 $21 $3 $97 9.8%
Madden Dam 36.0 $56 $20 $36 $38 24.5%
C.
America
Total
$5,152 $2,890 $2,262 $65 17.9%
Grand
Total
$15,283 $6,963 $8,320 $63 18.5%
Table B4.2 – Economic Assessment Results for Upgrade in 2025
Referenc
e Year
2025
Economic Yes
Values
Region Country Plant Name Plant
Cap
(MW)
PV of
Benefits
(MUS$)
PV of
Costs
(MUS$)
NPV
(MUS$)
Levelize
d Cost
(US$/
MWh)
IRR
(%)
Africa Algeria Darguinah 66 $36 $35 $1 $155 8.3%
Angola Biopio 14.6 $21 $8 $12 $55 21.6%
Cambambe 180 $176 $88 $89 $70 17.6%
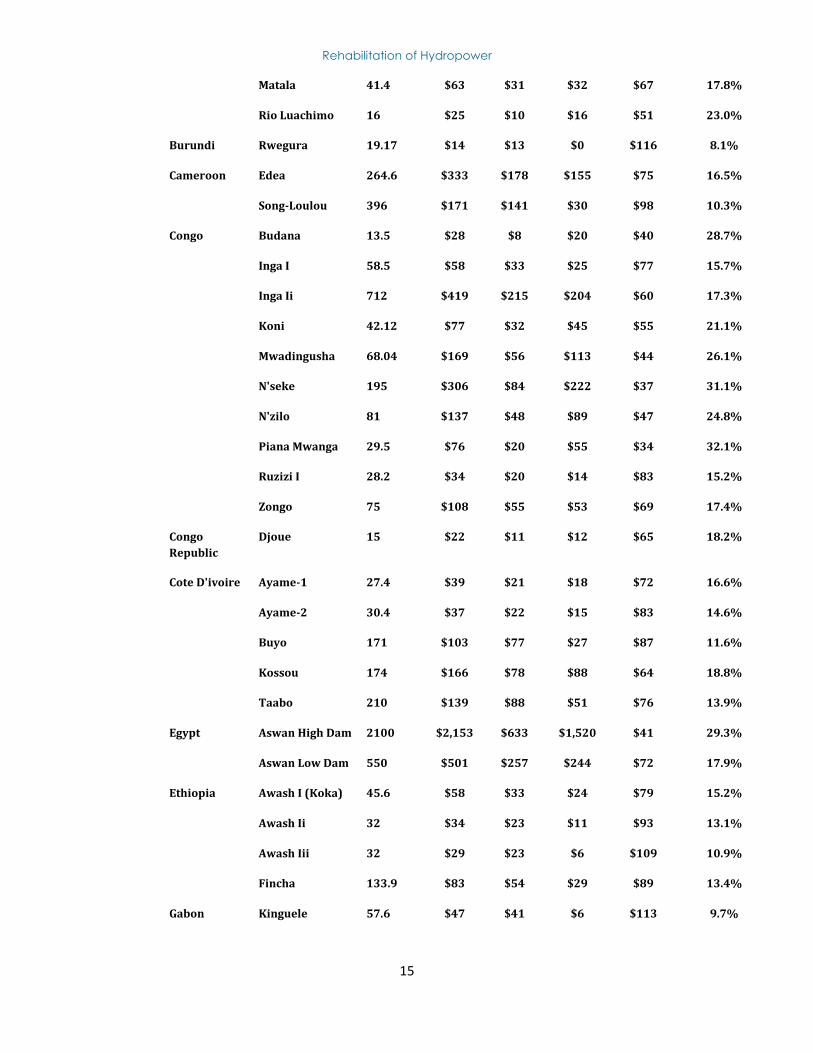
Rehabilitation of Hydropower
15
Matala 41.4 $63 $31 $32 $67 17.8%
Rio Luachimo 16 $25 $10 $16 $51 23.0%
Burundi Rwegura 19.17 $14 $13 $0 $116 8.1%
Cameroon Edea 264.6 $333 $178 $155 $75 16.5%
Song-Loulou 396 $171 $141 $30 $98 10.3%
Congo Budana 13.5 $28 $8 $20 $40 28.7%
Inga I 58.5 $58 $33 $25 $77 15.7%
Inga Ii 712 $419 $215 $204 $60 17.3%
Koni 42.12 $77 $32 $45 $55 21.1%
Mwadingusha 68.04 $169 $56 $113 $44 26.1%
N'seke 195 $306 $84 $222 $37 31.1%
N'zilo 81 $137 $48 $89 $47 24.8%
Piana Mwanga 29.5 $76 $20 $55 $34 32.1%
Ruzizi I 28.2 $34 $20 $14 $83 15.2%
Zongo 75 $108 $55 $53 $69 17.4%
Congo
Republic
Djoue 15 $22 $11 $12 $65 18.2%
Cote D'ivoire Ayame-1 27.4 $39 $21 $18 $72 16.6%
Ayame-2 30.4 $37 $22 $15 $83 14.6%
Buyo 171 $103 $77 $27 $87 11.6%
Kossou 174 $166 $78 $88 $64 18.8%
Taabo 210 $139 $88 $51 $76 13.9%
Egypt Aswan High Dam 2100 $2,153 $633 $1,520 $41 29.3%
Aswan Low Dam 550 $501 $257 $244 $72 17.9%
Ethiopia Awash I (Koka) 45.6 $58 $33 $24 $79 15.2%
Awash Ii 32 $34 $23 $11 $93 13.1%
Awash Iii 32 $29 $23 $6 $109 10.9%
Fincha 133.9 $83 $54 $29 $89 13.4%
Gabon Kinguele 57.6 $47 $41 $6 $113 9.7%
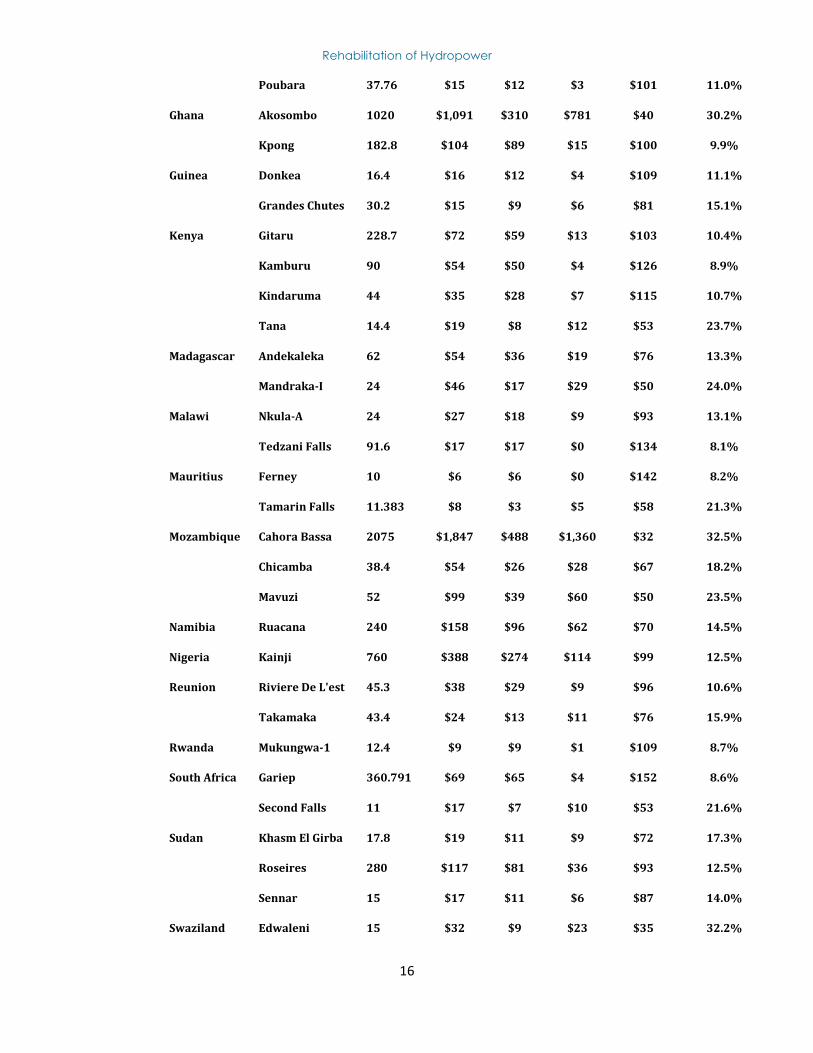
Rehabilitation of Hydropower
16
Poubara 37.76 $15 $12 $3 $101 11.0%
Ghana Akosombo 1020 $1,091 $310 $781 $40 30.2%
Kpong 182.8 $104 $89 $15 $100 9.9%
Guinea Donkea 16.4 $16 $12 $4 $109 11.1%
Grandes Chutes 30.2 $15 $9 $6 $81 15.1%
Kenya Gitaru 228.7 $72 $59 $13 $103 10.4%
Kamburu 90 $54 $50 $4 $126 8.9%
Kindaruma 44 $35 $28 $7 $115 10.7%
Tana 14.4 $19 $8 $12 $53 23.7%
Madagascar Andekaleka 62 $54 $36 $19 $76 13.3%
Mandraka-I 24 $46 $17 $29 $50 24.0%
Malawi Nkula-A 24 $27 $18 $9 $93 13.1%
Tedzani Falls 91.6 $17 $17 $0 $134 8.1%
Mauritius Ferney 10 $6 $6 $0 $142 8.2%
Tamarin Falls 11.383 $8 $3 $5 $58 21.3%
Mozambique Cahora Bassa 2075 $1,847 $488 $1,360 $32 32.5%
Chicamba 38.4 $54 $26 $28 $67 18.2%
Mavuzi 52 $99 $39 $60 $50 23.5%
Namibia Ruacana 240 $158 $96 $62 $70 14.5%
Nigeria Kainji 760 $388 $274 $114 $99 12.5%
Reunion Riviere De L'est 45.3 $38 $29 $9 $96 10.6%
Takamaka 43.4 $24 $13 $11 $76 15.9%
Rwanda Mukungwa-1 12.4 $9 $9 $1 $109 8.7%
South Africa Gariep 360.791 $69 $65 $4 $152 8.6%
Second Falls 11 $17 $7 $10 $53 21.6%
Sudan Khasm El Girba 17.8 $19 $11 $9 $72 17.3%
Roseires 280 $117 $81 $36 $93 12.5%
Sennar 15 $17 $11 $6 $87 14.0%
Swaziland Edwaleni 15 $32 $9 $23 $35 32.2%
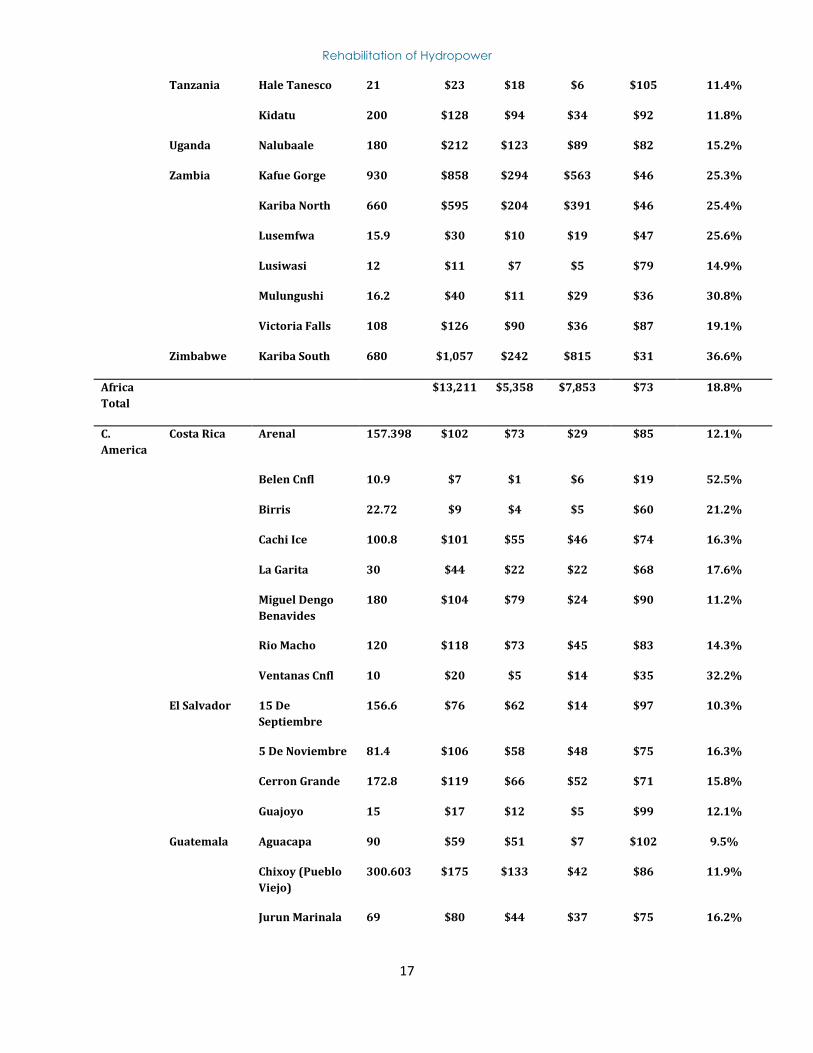
Rehabilitation of Hydropower
17
Tanzania Hale Tanesco 21 $23 $18 $6 $105 11.4%
Kidatu 200 $128 $94 $34 $92 11.8%
Uganda Nalubaale 180 $212 $123 $89 $82 15.2%
Zambia Kafue Gorge 930 $858 $294 $563 $46 25.3%
Kariba North 660 $595 $204 $391 $46 25.4%
Lusemfwa 15.9 $30 $10 $19 $47 25.6%
Lusiwasi 12 $11 $7 $5 $79 14.9%
Mulungushi 16.2 $40 $11 $29 $36 30.8%
Victoria Falls 108 $126 $90 $36 $87 19.1%
Zimbabwe Kariba South 680 $1,057 $242 $815 $31 36.6%
Africa
Total
$13,211 $5,358 $7,853 $73 18.8%
C.
America
Costa Rica Arenal 157.398 $102 $73 $29 $85 12.1%
Belen Cnfl 10.9 $7 $1 $6 $19 52.5%
Birris 22.72 $9 $4 $5 $60 21.2%
Cachi Ice 100.8 $101 $55 $46 $74 16.3%
La Garita 30 $44 $22 $22 $68 17.6%
Miguel Dengo
Benavides
180 $104 $79 $24 $90 11.2%
Rio Macho 120 $118 $73 $45 $83 14.3%
Ventanas Cnfl 10 $20 $5 $14 $35 32.2%
El Salvador 15 De
Septiembre
156.6 $76 $62 $14 $97 10.3%
5 De Noviembre 81.4 $106 $58 $48 $75 16.3%
Cerron Grande 172.8 $119 $66 $52 $71 15.8%
Guajoyo 15 $17 $12 $5 $99 12.1%
Guatemala Aguacapa 90 $59 $51 $7 $102 9.5%
Chixoy (Pueblo
Viejo)
300.603 $175 $133 $42 $86 11.9%
Jurun Marinala 69 $80 $44 $37 $75 16.2%
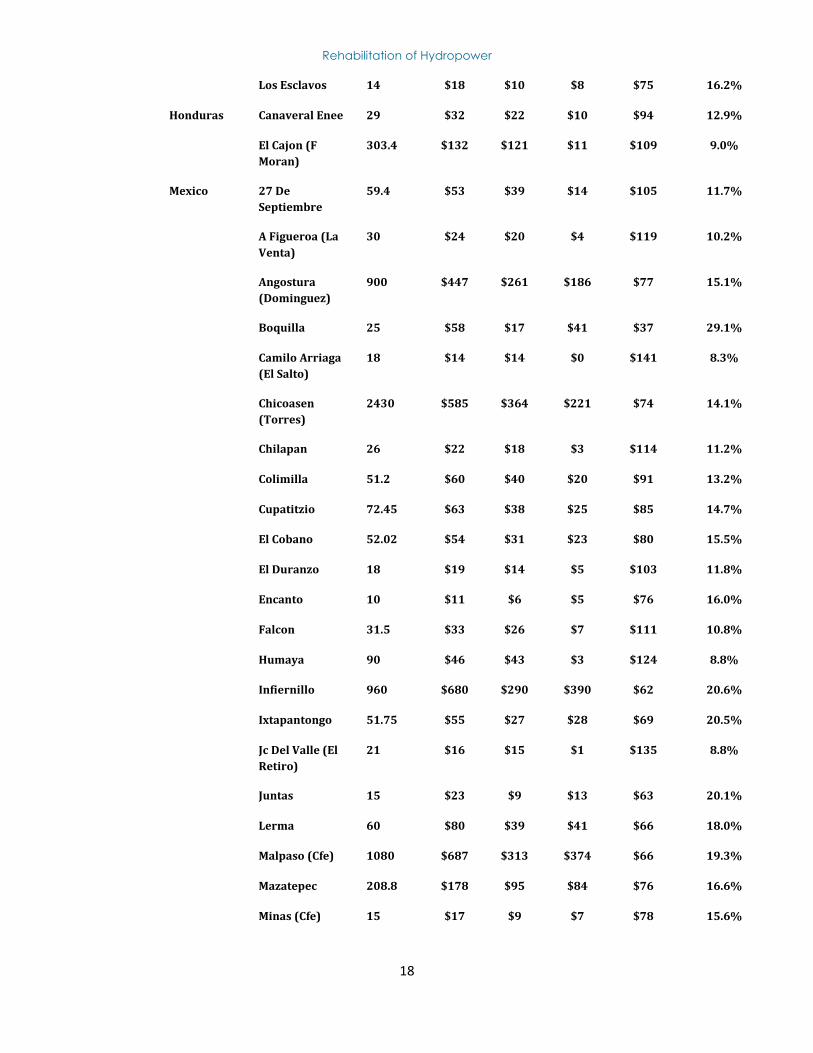
Rehabilitation of Hydropower
18
Los Esclavos 14 $18 $10 $8 $75 16.2%
Honduras Canaveral Enee 29 $32 $22 $10 $94 12.9%
El Cajon (F
Moran)
303.4 $132 $121 $11 $109 9.0%
Mexico 27 De
Septiembre
59.4 $53 $39 $14 $105 11.7%
A Figueroa (La
Venta)
30 $24 $20 $4 $119 10.2%
Angostura
(Dominguez)
900 $447 $261 $186 $77 15.1%
Boquilla 25 $58 $17 $41 $37 29.1%
Camilo Arriaga
(El Salto)
18 $14 $14 $0 $141 8.3%
Chicoasen
(Torres)
2430 $585 $364 $221 $74 14.1%
Chilapan 26 $22 $18 $3 $114 11.2%
Colimilla 51.2 $60 $40 $20 $91 13.2%
Cupatitzio 72.45 $63 $38 $25 $85 14.7%
El Cobano 52.02 $54 $31 $23 $80 15.5%
El Duranzo 18 $19 $14 $5 $103 11.8%
Encanto 10 $11 $6 $5 $76 16.0%
Falcon 31.5 $33 $26 $7 $111 10.8%
Humaya 90 $46 $43 $3 $124 8.8%
Infiernillo 960 $680 $290 $390 $62 20.6%
Ixtapantongo 51.75 $55 $27 $28 $69 20.5%
Jc Del Valle (El
Retiro)
21 $16 $15 $1 $135 8.8%
Juntas 15 $23 $9 $13 $63 20.1%
Lerma 60 $80 $39 $41 $66 18.0%
Malpaso (Cfe) 1080 $687 $313 $374 $66 19.3%
Mazatepec 208.8 $178 $95 $84 $76 16.6%
Minas (Cfe) 15 $17 $9 $7 $78 15.6%
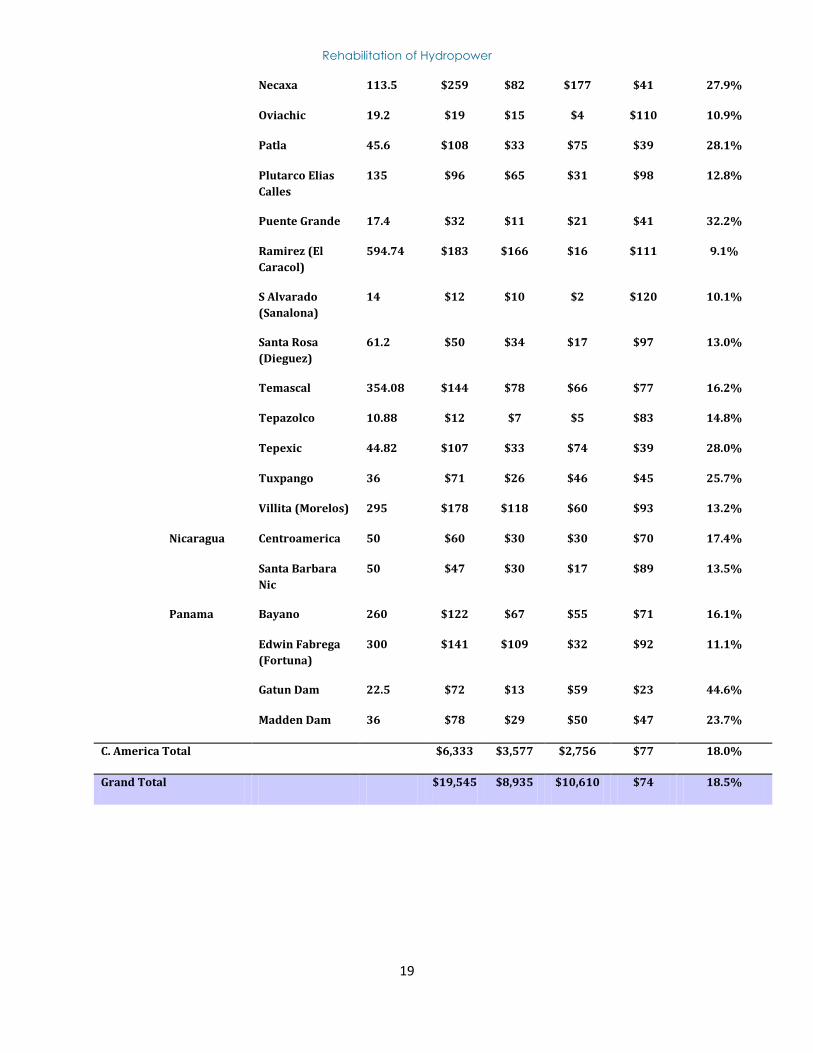
Rehabilitation of Hydropower
19
Necaxa 113.5 $259 $82 $177 $41 27.9%
Oviachic 19.2 $19 $15 $4 $110 10.9%
Patla 45.6 $108 $33 $75 $39 28.1%
Plutarco Elias
Calles
135 $96 $65 $31 $98 12.8%
Puente Grande 17.4 $32 $11 $21 $41 32.2%
Ramirez (El
Caracol)
594.74 $183 $166 $16 $111 9.1%
S Alvarado
(Sanalona)
14 $12 $10 $2 $120 10.1%
Santa Rosa
(Dieguez)
61.2 $50 $34 $17 $97 13.0%
Temascal 354.08 $144 $78 $66 $77 16.2%
Tepazolco 10.88 $12 $7 $5 $83 14.8%
Tepexic 44.82 $107 $33 $74 $39 28.0%
Tuxpango 36 $71 $26 $46 $45 25.7%
Villita (Morelos) 295 $178 $118 $60 $93 13.2%
Nicaragua Centroamerica 50 $60 $30 $30 $70 17.4%
Santa Barbara
Nic
50 $47 $30 $17 $89 13.5%
Panama Bayano 260 $122 $67 $55 $71 16.1%
Edwin Fabrega
(Fortuna)
300 $141 $109 $32 $92 11.1%
Gatun Dam 22.5 $72 $13 $59 $23 44.6%
Madden Dam 36 $78 $29 $50 $47 23.7%
C. America Total $6,333 $3,577 $2,756 $77 18.0%
Grand Total $19,545 $8,935 $10,610 $74 18.5%

Rehabilitation of Hydropower
20
Annex C
– Summary of Assessment of Case Studies
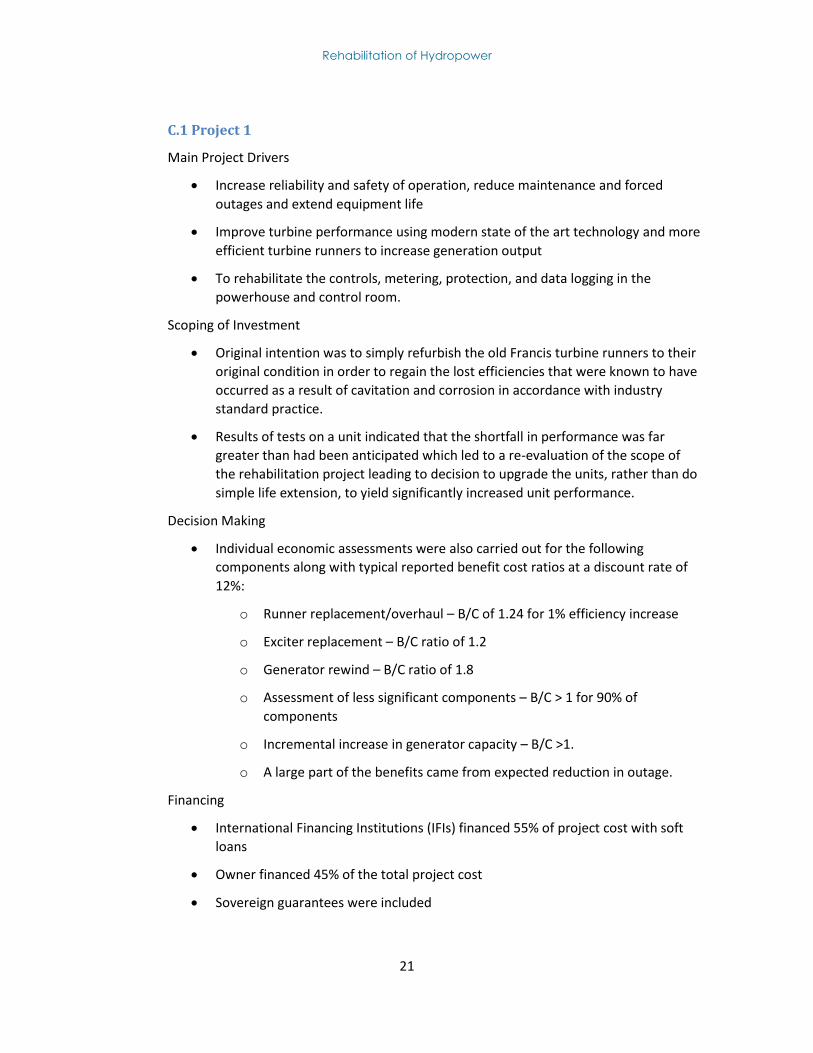
Rehabilitation of Hydropower
21
C.1 Project 1
Main Project Drivers
Increase reliability and safety of operation, reduce maintenance and forced
outages and extend equipment life
Improve turbine performance using modern state of the art technology and more
efficient turbine runners to increase generation output
To rehabilitate the controls, metering, protection, and data logging in the
powerhouse and control room.
Scoping of Investment
Original intention was to simply refurbish the old Francis turbine runners to their
original condition in order to regain the lost efficiencies that were known to have
occurred as a result of cavitation and corrosion in accordance with industry
standard practice.
Results of tests on a unit indicated that the shortfall in performance was far
greater than had been anticipated which led to a re-evaluation of the scope of
the rehabilitation project leading to decision to upgrade the units, rather than do
simple life extension, to yield significantly increased unit performance.
Decision Making
Individual economic assessments were also carried out for the following
components along with typical reported benefit cost ratios at a discount rate of
12%:
o Runner replacement/overhaul – B/C of 1.24 for 1% efficiency increase
o Exciter replacement – B/C ratio of 1.2
o Generator rewind – B/C ratio of 1.8
o Assessment of less significant components – B/C > 1 for 90% of
components
o Incremental increase in generator capacity – B/C >1.
o A large part of the benefits came from expected reduction in outage.
Financing
International Financing Institutions (IFIs) financed 55% of project cost with soft
loans
Owner financed 45% of the total project cost
Sovereign guarantees were included
Rehabilitation of Hydropower
22
Project Execution
Separate contract packages were included for each major component.
Contract packages included supply and installation
Owner had his own engineer to provide Engineer Procure and Construction
Management (EPCM) type services and suppliers did most of the detailed design
There were cost overruns due to the need to renegotiate the construction
contract to re-scope the project to reflect doing an upgrade instead of a life
extension.
Environmental / Social
Oil containment facilities added in event of a fire involving unit transformers
Construction activities provided some work and training for local workers
Benefits from project continue to provide funds for resettled population from
original construction
Lessons Learned
Turbine and generator efficiency tests to verify pre- and post- equipment
performance are essential as units may be performing worse than originally
anticipated
Owners / operators of the station should be involved to the maximum extent
possible in both the design and implementation of the rehabilitation, since they
have the most practical knowledgeable of the behaviour of the river at the
project site from year to year and season to season, and they will be left with the
completed project and the need to show that the project has achieved the
projected results.
Life extension option which only recovers historical efficiency and availability
degradation may be significantly less economic than the option involving upgrade
to more efficient and higher capacity equipment associated with modern
technology
Effective management of equipment and parts supply from foreign sources
especially tools, equipment and materials with storage issues requires special
attention
Complex financing arrangement can require considerable effort from Owner’s
team
Team work and team building very important to foster friendly and harmonious
environment amongst the workers and supervisors
Rehabilitation of Hydropower
23
Project can provide workers with excellent training through close cooperation
with the contractors.
C.2 Project 2
Main Project Drivers
Increase energy and capacity at the facility with modern turbine runner designs
Inspect existing equipment and replace or repair all worn or damaged
components in order to extend the life of the units for the next 20 to 30 years
Expansion with installation of an additional unit
Scoping of Investment
Efficiency tests by the Original Equipment Manufacturer (OEM) showed turbine
efficiency much lower than expected. Corrosion of turbine parts needed
refurbishing by welding at the runner blades and guide vanes. This together with
the problems of corrosion led to a decision to upgrade the units.
Decision Making
A consultant was retained to asses the expansion upgrade project including a
financial analysis
The general conclusions reached with regard to project viability indicated a pre-
project EIRR of greater than 30%
An independent analysis of the financial model was carried out by the Lender’s
Engineer.
Financing
Initially an IFI was involved in the financing
Commercial financing was then used for implementation with the intent to
refinance with permanent financing later.
Project Execution
The partnership of turbine manufacturer and generator manufacturer was the
EPC contractor for the rehabilitation work and for installation of an additional
generating unit
A consulting engineer was the Owner’s representative and provided a specialist
on-site to review the work completed by the EPC Contractor as well as provided
assistance on an on-request basis
No information was available on cost overruns.
Rehabilitation of Hydropower
24
Environmental / Social
Upgrading of the existing units and the installation of an additional unit was
judged to have minimal impact on the long term water regime downstream of
the plant
Construction impacts were identified as vehicular traffic, water turbidity and
potential contamination by solid waste and mitigation measures were identified
during the construction phase.
Lessons Learned
Turbine performance guarantees based on model tests are quite satisfactory;
however the Owner should, if possible, retain the option of performing site tests
if the installation performance is suspect
A well defined rehabilitation specification will avoid conflicts on scope of
rehabilitation work during the project execution phase.
It is not beneficial to pass all risks associated with uncertainties on equipment
condition to the contractor during the bid/proposal stage.
Appropriate and fair risk sharing is important and optional pricing for areas
where condition is unknown may be beneficial.
C.3 Project 3
Main Project Drivers
Increase energy at the facility through the increase in plant capacity, recognizing
that flow in the river often exceeded the capacity of the original facility.
Upgrade of existing turbine and generator equipment including governors and
turbine inlet valve with new generating units of similar configuration but
significantly higher capacity of 20%
Replacement of the powerhouse controls
Installation of additional transformers to accommodate the increased power
levels
Major modification to civil works to accommodate the increased discharge
capacity.
Scoping of Investment
Rehabilitation of Hydropower
25
Decision to increase capacity was made at the time of privatisation of the
generating facilities and the new plant owners committed to increased capacity
as part of the plant purchase agreement.
Decision Making
A financial analysis was performed but information on the results was not
available.
Financing
Information on project financing was not available.
Project Execution
The turbine and generator equipment manufacturer was the EPC contractor for
the generating equipment rehabilitation work
Separate contracts were implemented for the civil works, the intake gate
equipment and the guard valve rehabilitation
A consulting engineer was appointed as Owner’s Representative and provided a
specialist on-site to review the work completed by the contractors as well as
provided assistance on an on-request basis
There were no major cost overruns on the project but there was a claim by the
EPC contractor which was settled primarily by negotiation.
Environmental / Social
No major environmental or social issues arose during the project and since the
development was located in a fairly isolated area, the there was no significant
concern about changes in flows and water levels as a result of the project.
Legacy environmental issue for the project include sediment and waste from
upstream cities accumulating in the reservoir. The owner in partnership with the
community has instituted several programs that have resulted in measurable
reductions in erosion, sedimentation and waste.
Lessons Learned
Owners must ensure they have a clear understanding of the requirements on
how their unit(s) must perform on the transmission grid and these must be
adequately passed on to the equipment supplier and equipment contractor.
Otherwise electrical interconnection requirements can impact substantial
completion date, which in turn impacted bonus/penalty payments. This
rehabilitation project resulted from a commitment made by a new owner who
may not have been informed on all the grid code requirements or there were
gaps in the procedures that only came to light after the new owner took control.

Rehabilitation of Hydropower
26
Issues such as sediment transport and its effect on equipment should not be
underestimated or treated lightly in the design stage.
Contractors need to effectively research a project and understand how the work
is to be executed and the number of personnel required to undertake the work
before commencing and contract conditions should be changed such that
contractors carry the financial risk of not correctly estimating their costs of
meeting schedule.
C.4 Project 4
Main Project Drivers
Increase in revenue through added capacity that could utilize excess flow that
was available for a significant portion of the year. There was also some added
benefit to a modern turbine runner design with increased efficiency.
Scoping of Investment
Baseline assessment was the calculation of annual generation with the existing
units. The turbine performance curves from the original turbine manufacturers
were used for the calculation.
Studies were made on expanding the facility by constructing a second
powerhouse. However increasing the capacity of the existing units was generally
the more cost effective alternative.
Decision Making
A financial analysis was performed. The analysis incorporated the following
critical information: capital costs, energy and capacity benefits, energy prices,
discount and escalation parameters.
As the project was internally financed, decisions were made based on the
projected revenue for the project.
Financing
The project was corporate financed.
Risk was assessed and minimized through careful project planning and including
suitable warrantees and performance guarantees in the various equipment
supply contracts.
Project Execution
Rehabilitation of Hydropower
27
Equipment design and supply was through multiple contracts with equipment
manufacturers
There was a separate contract for equipment off-site mechanical rehabilitation
and installation was by the operator.
The Owner retained the services of his own engineer, independent of the
contractor
Cost overruns were generally minimal (<10% of the total project estimate) and
were due to unforeseen rehabilitation work that became evident once the
project was underway
Claims were settled through negotiations.
Environmental / Social
Small positive fisheries benefit in that with larger discharges through the
turbines, reduced spill limited dissolved gases in the tailrace
Limited long term changes to operating regime.
Lessons Learned
Careful planning of project and site activities is essential to minimizing problems
at site and preventing or minimizing site schedule delays
Where possible, testing of a single unit upgrade performance prior to
undertaking the remainder of the unit upgrades is recommended as this can lead
to changes in the designs for subsequent units to maximize benefits.
C.5 Project 5
Main Project Drivers
Provide urgently needed least-cost capacity additions to the system power
generation capacity
This was a project expansion and was not a classic rehabilitation project
Increase the safety of the dam and associated infrastructure.
Scoping of Investment
Current project had condition issues which required the consideration of an
extension to the existing station.
Studies were carried out on the feasibility of the expansion of the existing
generating station. studies considered several alternative configurations and
sizes of the extension.
Decision Making

Rehabilitation of Hydropower
28
Economic rate of return was calculated for the broad project including extension
and transmission and distribution development
Post-project EIRR was estimated to be 13.7%, compared to a pre-project
estimate of 16.5.
Change in the EIRR attributed to a delay in completion and the high level of
system losses which was not reduced over the implementation period as
planned.
Financing
IFIs and bilateral financing met the majority of the project costs
Owner financed local costs.
Project Execution
Separate contracts were awarded for civil works and electromechanical
equipment
A consultant was retained to provide EPCM services
Weather related delays led to claims and cost overruns because of damage to
transportation routes which were settled through arbitration.
Environmental / Social
Environmental and social issues were raised in response to the implementation of the project and these were assessed in broad terms of provided other benefits to mitigate impacts.
Lessons Learned
It is more efficient to initiate and implement measures to improve institutional and financial performance in advance of major new investments
Procurement capacity should be built prior to commencement of implementation in order to avoid delays caused by poor procurement decisions
Timely mid-term reviews are important in infrastructure projects with long implementation periods
Risks should not just be assessed as to sensitivities of IRR to costs going up or the development period being extended a standard period, but they should be better tailored to contingency scenarios developed specifically for the project at hand
C.6 Project 6
Main Project Drivers
Rehabilitation of Hydropower
29
Improvement of the reliability of the electric service and increase service coverage by rehabilitation, modernization and expansion of power generation, transmission, sub-transmission and distribution systems
Purchase equipment necessary for sedimentation control.
Scoping of Investment
Feasibility studies were completed to assess the best strategies for the rehabilitation, modernization and expansion of the power generation by several generating stations.
This assessment did not result in a recommendation to proceed with all options under consideration
Decision Making
Separate economic analyses were undertaken for the modernization and rehabilitation of the hydroelectric stations and the expansion of one of the stations with an additional unit was judged to be uneconomic by the government although there was no indication of the reason for this decision.
Pre-project EIRR for all components of the project was estimated at approximately 25% and post-project was estimated at 27%
Financing
IFIs financed approximately 60% of project cost
Eximbanks financed approximately 20%
Local funds covered the remainder.
Project Execution
Multiple contracts were implemented for the various components of the project
The Owner hired an Engineering Consultant to provide EPCM services during the Contract period
The portion dealing with the rehabilitation and expansion of the hydroelectric projects was 8% over budget
Rehabilitation and/or upgrade increased annual generation by 18% and extended the life by at least 20 years.
Environmental / Social
There were no negative social or environmental impacts expected from project
activities, because most components involve modernization of existing
equipment.
Lessons Learned
Project succeeded because objectives were an integral part of a broader program of sector reforms
Well defined objectives and components led to a successful project
Commitment and ownership shown by the entities in charge assured the success of the project.
Rehabilitation of Hydropower
30
Dialogue with the affected stakeholders was an important element that assured the success of the project
IFI financing requires careful attention to following the appropriate procedures to ensure that delays or cancellation of funding do not result
Outside pressure of NGO's can result in cancellation of what would be an otherwise viable component of the project
IFI’s should discuss the conditions for the use of funds with the borrower, and/or should not finance components where other less restrictive sources of funds are available.
C.7 Project 7
Main Project Drivers
Expansion of a completed project in order to increase the generating capacity as part of the long-term plan for the development of hydroelectric resources.
It was justified as a least cost project in the expansion sequence but was not really a rehabilitation project given the relatively young age.
Scoping of Investment
It was expected that the existing units would not have been subject to any major rehabilitation prior to the commencement of the extension project
Decision Making
An economic assessment was carried out for the project and a post-project economic rate of return was estimated as 6.6%
This low EIRR resulted from slower than anticipated demand growth
Financing
IFI and other sources financed virtually the entire project.
Project Execution
A civil contractor was hired to perform the plant expansion.
The equipment manufacturer’s supplied, installed and commissioned major equipment
Consultants were retained for engineering design, studies, supervision of works, and training
The overall actual costs were very close to the estimate, despite considerable inflation during the implementation period and various revisions to the works
The most significant overrun was in interest during construction due to a longer than originally planned implementation period.
Environmental / Social
There were legacy issues from the original construction of the project
The project expansion had no identified impacts in the available documentation
Rehabilitation of Hydropower
31
Special preventative measures needed to be implemented to prevent the start or
spread of diseases among workers and the nature of these measures were
indicated in the bidding document.
Lessons Learned
Slower than anticipated growth likely resulted in the investment many years before the project was required
There are also other cases where Greenfield developments have not been able to
recover the investment in the initial period of operation due to lower than
projected demand sometimes resulting from the increase in electricity prices
needed to cover the costs of the new development.
While extension / expansion projects such as this case study can be impacted by
low load growth, one of the advantages of rehabilitation projects is that they are
unlikely to suffer the same effect as the increment in output is smaller and a
large part of the increased output is recovery of degradation and not additional
generation. Project expansions have not been dealt with in the current study.
In cases where, a project in one country depends on a market in a neighbouring country, every effort should be made to secure the market as much as possible and the residual risk should be assessed before the project is allowed to proceed.
The need to ensure adequate geotechnical investigation.
Review of project cost estimates by an independent consultant helps to ensure the reasonableness of these estimates and mitigates the size of actual cost overruns or under runs
A committee of experts for periodic examination of the dam is very desirable, and in a situation where major problems are experienced, the required attention can be immediately given.
C.8 Project 8
Main Project Drivers
Multiple hydroelectric facilities subject to larger than expected wear and tear of the generating units
Scoping of Investment
Scale of rehabilitation critically depended on funding availability and scope was reduced to compensate.
Decision Making
An economic evaluation, based on incremental costs and benefits, was performed for each subcomponent and then aggregated for the two main components and the project as a whole.
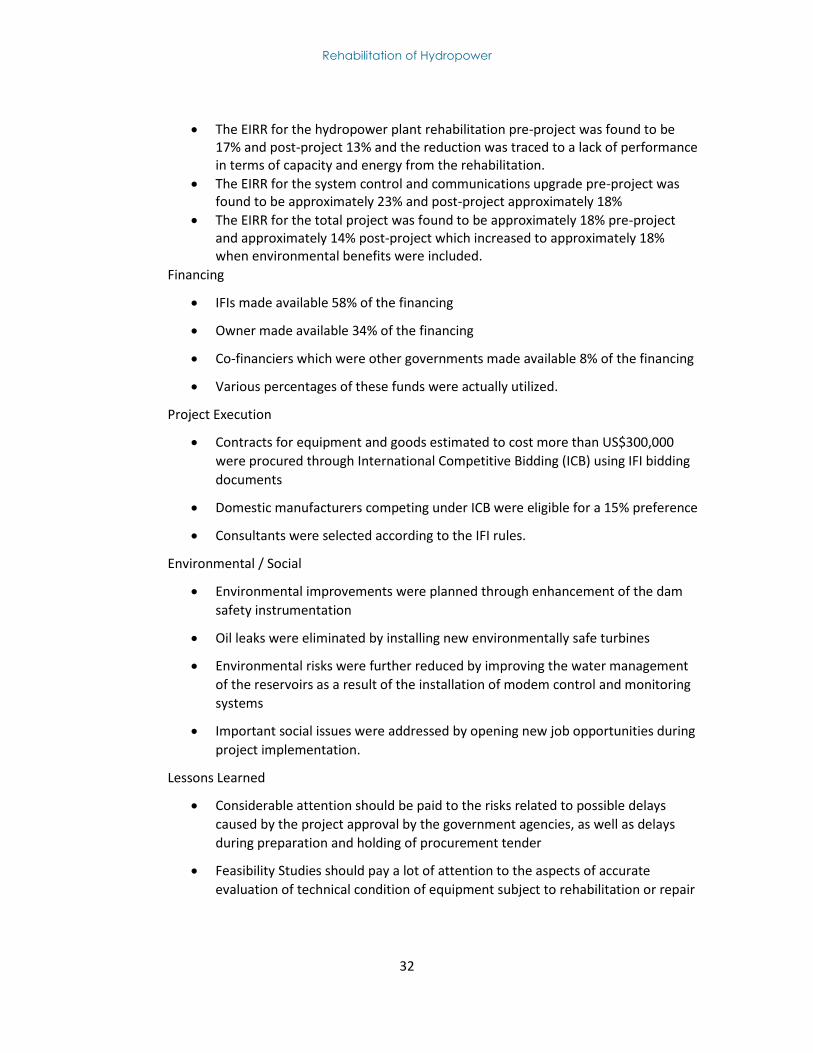
Rehabilitation of Hydropower
32
The EIRR for the hydropower plant rehabilitation pre-project was found to be 17% and post-project 13% and the reduction was traced to a lack of performance in terms of capacity and energy from the rehabilitation.
The EIRR for the system control and communications upgrade pre-project was found to be approximately 23% and post-project approximately 18%
The EIRR for the total project was found to be approximately 18% pre-project and approximately 14% post-project which increased to approximately 18% when environmental benefits were included.
Financing
IFIs made available 58% of the financing
Owner made available 34% of the financing
Co-financiers which were other governments made available 8% of the financing
Various percentages of these funds were actually utilized.
Project Execution
Contracts for equipment and goods estimated to cost more than US$300,000
were procured through International Competitive Bidding (ICB) using IFI bidding
documents
Domestic manufacturers competing under ICB were eligible for a 15% preference
Consultants were selected according to the IFI rules.
Environmental / Social
Environmental improvements were planned through enhancement of the dam
safety instrumentation
Oil leaks were eliminated by installing new environmentally safe turbines
Environmental risks were further reduced by improving the water management
of the reservoirs as a result of the installation of modem control and monitoring
systems
Important social issues were addressed by opening new job opportunities during
project implementation.
Lessons Learned
Considerable attention should be paid to the risks related to possible delays
caused by the project approval by the government agencies, as well as delays
during preparation and holding of procurement tender
Feasibility Studies should pay a lot of attention to the aspects of accurate
evaluation of technical condition of equipment subject to rehabilitation or repair
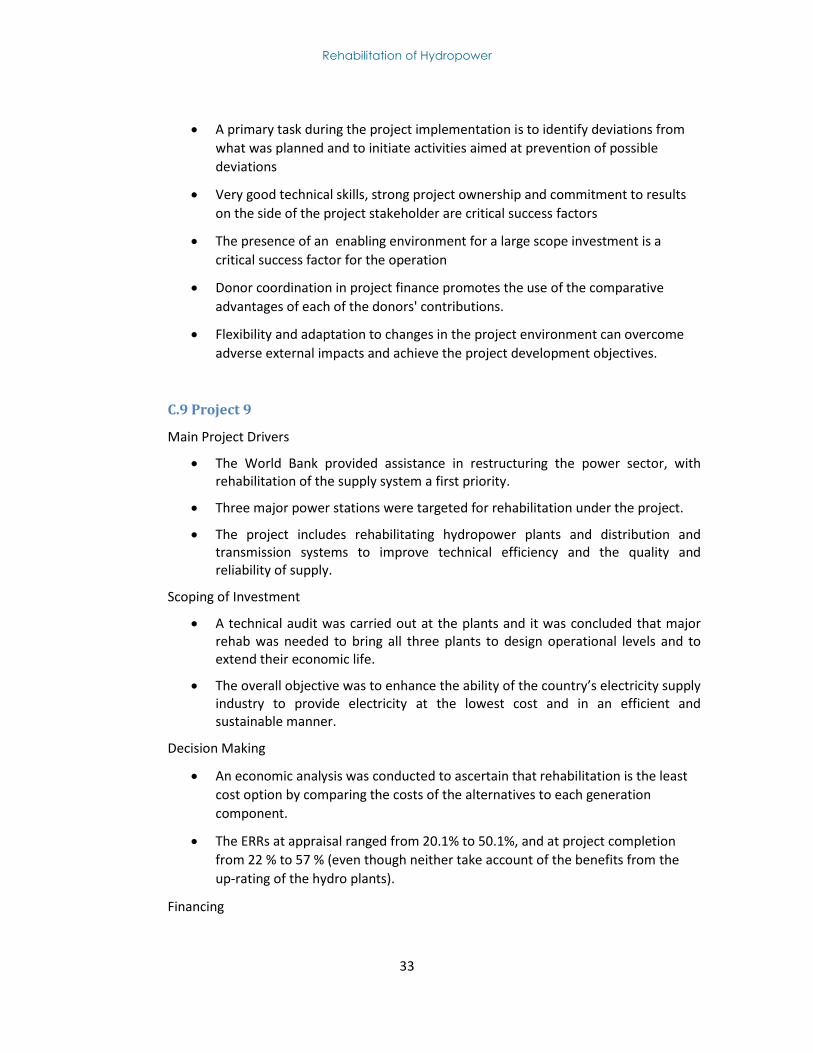
Rehabilitation of Hydropower
33
A primary task during the project implementation is to identify deviations from
what was planned and to initiate activities aimed at prevention of possible
deviations
Very good technical skills, strong project ownership and commitment to results
on the side of the project stakeholder are critical success factors
The presence of an enabling environment for a large scope investment is a
critical success factor for the operation
Donor coordination in project finance promotes the use of the comparative
advantages of each of the donors' contributions.
Flexibility and adaptation to changes in the project environment can overcome
adverse external impacts and achieve the project development objectives.
C.9 Project 9
Main Project Drivers
The World Bank provided assistance in restructuring the power sector, with rehabilitation of the supply system a first priority.
Three major power stations were targeted for rehabilitation under the project.
The project includes rehabilitating hydropower plants and distribution and transmission systems to improve technical efficiency and the quality and reliability of supply.
Scoping of Investment
A technical audit was carried out at the plants and it was concluded that major rehab was needed to bring all three plants to design operational levels and to extend their economic life.
The overall objective was to enhance the ability of the country’s electricity supply industry to provide electricity at the lowest cost and in an efficient and sustainable manner.
Decision Making
An economic analysis was conducted to ascertain that rehabilitation is the least
cost option by comparing the costs of the alternatives to each generation
component.
The ERRs at appraisal ranged from 20.1% to 50.1%, and at project completion
from 22 % to 57 % (even though neither take account of the benefits from the
up-rating of the hydro plants).
Financing
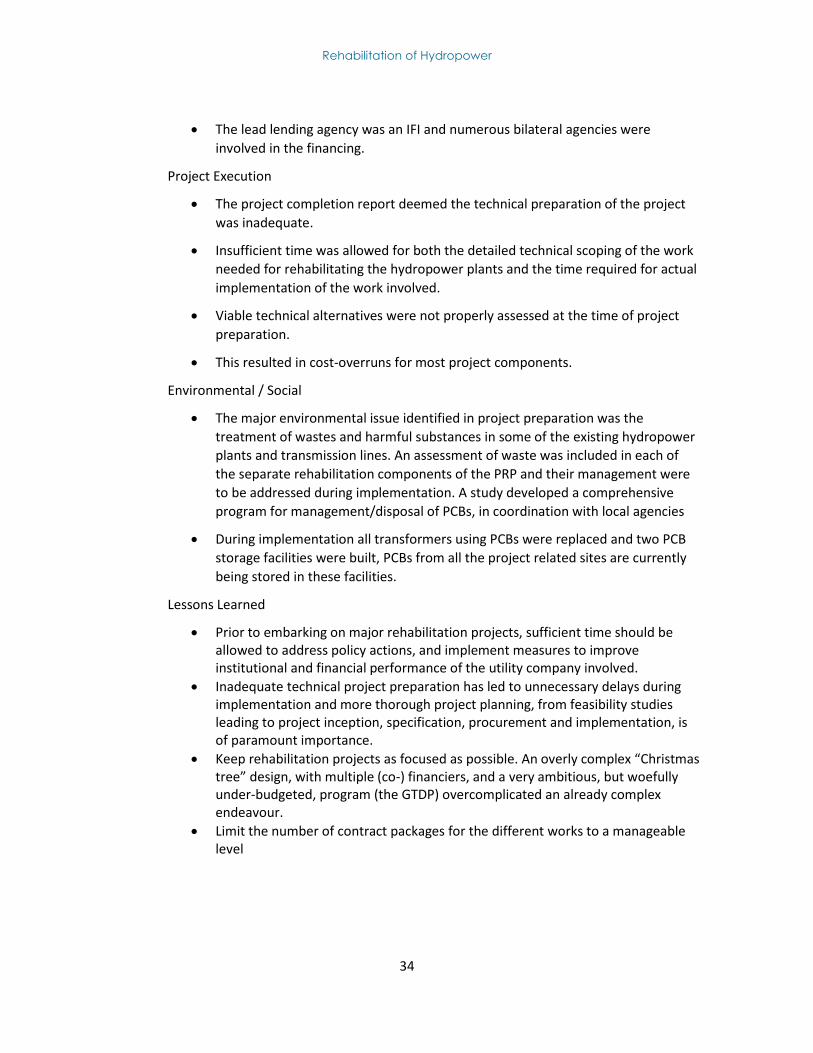
Rehabilitation of Hydropower
34
The lead lending agency was an IFI and numerous bilateral agencies were
involved in the financing.
Project Execution
The project completion report deemed the technical preparation of the project
was inadequate.
Insufficient time was allowed for both the detailed technical scoping of the work
needed for rehabilitating the hydropower plants and the time required for actual
implementation of the work involved.
Viable technical alternatives were not properly assessed at the time of project
preparation.
This resulted in cost-overruns for most project components.
Environmental / Social
The major environmental issue identified in project preparation was the
treatment of wastes and harmful substances in some of the existing hydropower
plants and transmission lines. An assessment of waste was included in each of
the separate rehabilitation components of the PRP and their management were
to be addressed during implementation. A study developed a comprehensive
program for management/disposal of PCBs, in coordination with local agencies
During implementation all transformers using PCBs were replaced and two PCB
storage facilities were built, PCBs from all the project related sites are currently
being stored in these facilities.
Lessons Learned
Prior to embarking on major rehabilitation projects, sufficient time should be allowed to address policy actions, and implement measures to improve institutional and financial performance of the utility company involved.
Inadequate technical project preparation has led to unnecessary delays during implementation and more thorough project planning, from feasibility studies leading to project inception, specification, procurement and implementation, is of paramount importance.
Keep rehabilitation projects as focused as possible. An overly complex “Christmas tree” design, with multiple (co-) financiers, and a very ambitious, but woefully under-budgeted, program (the GTDP) overcomplicated an already complex endeavour.
Limit the number of contract packages for the different works to a manageable level

Rehabilitation of Hydropower
35
Annex D
- Operational Risk Assessment Framework (ORAF)
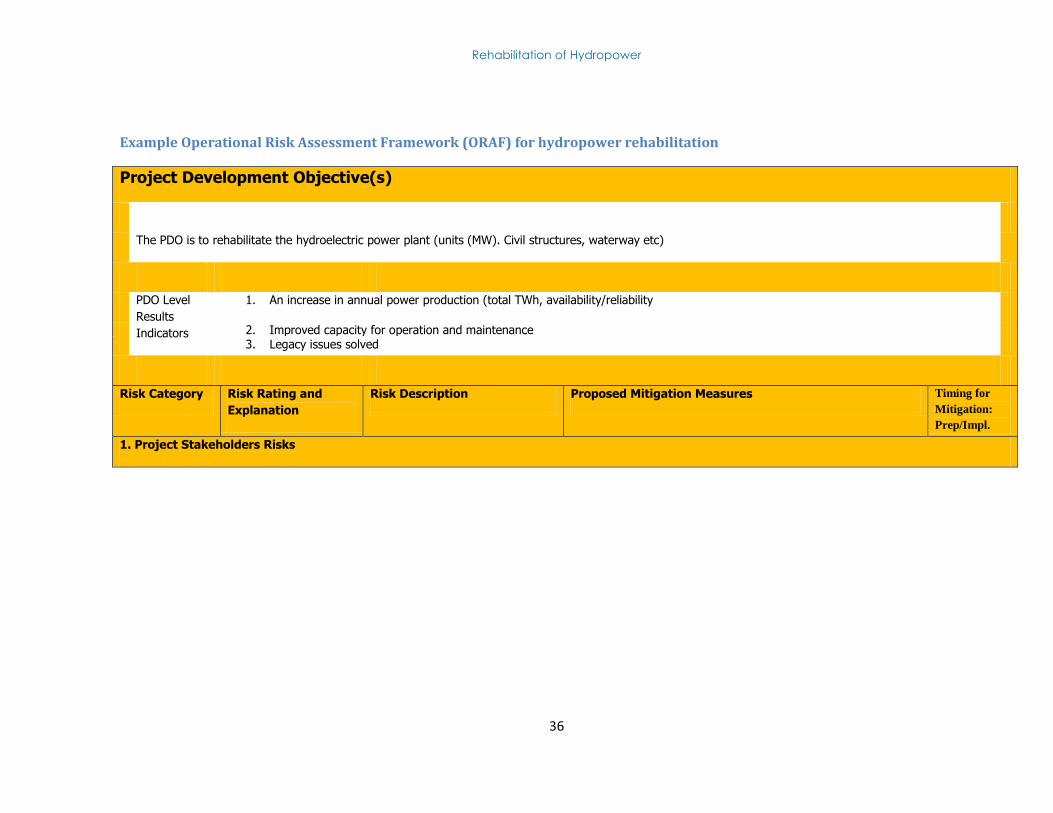
Rehabilitation of Hydropower
36
Example Operational Risk Assessment Framework (ORAF) for hydropower rehabilitation
Project Development Objective(s)
The PDO is to rehabilitate the hydroelectric power plant (units (MW). Civil structures, waterway etc)
PDO Level
Results
Indicators
1. An increase in annual power production (total TWh, availability/reliability
2. Improved capacity for operation and maintenance 3. Legacy issues solved
Risk Category Risk Rating and
Explanation
Risk Description Proposed Mitigation Measures Timing for
Mitigation:
Prep/Impl.
1. Project Stakeholders Risks
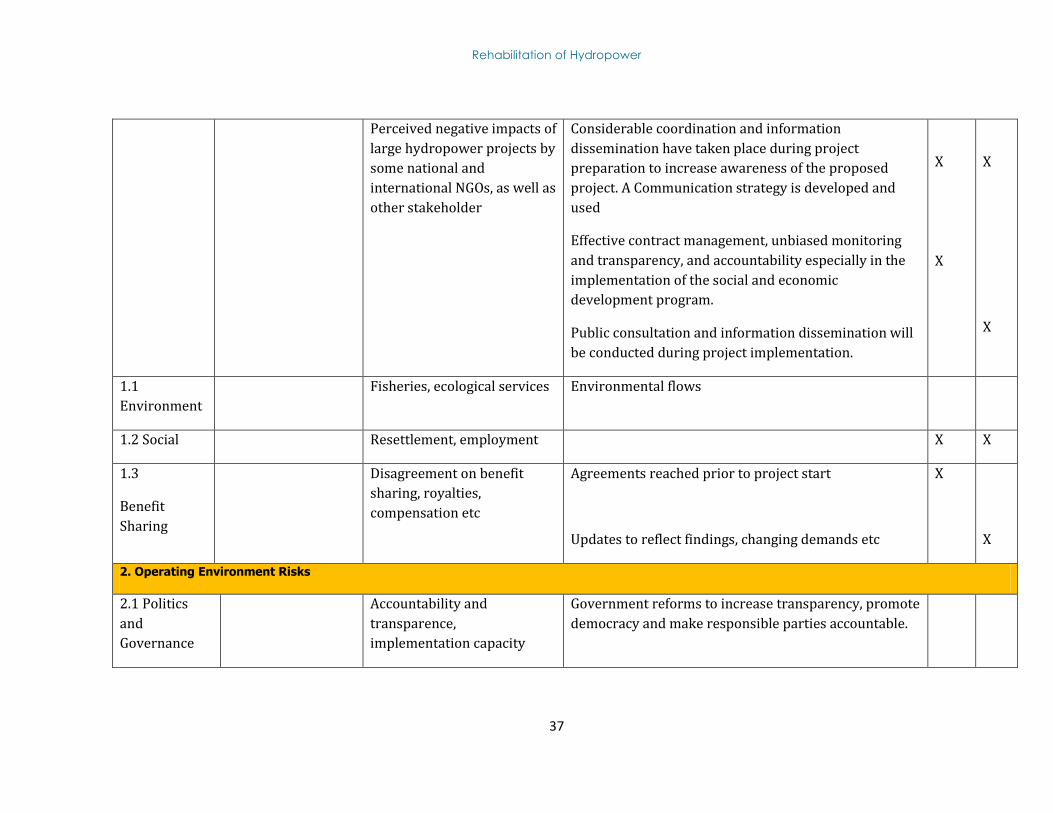
Rehabilitation of Hydropower
37
Perceived negative impacts of
large hydropower projects by
some national and
international NGOs, as well as
other stakeholder
Considerable coordination and information
dissemination have taken place during project
preparation to increase awareness of the proposed
project. A Communication strategy is developed and
used
Effective contract management, unbiased monitoring
and transparency, and accountability especially in the
implementation of the social and economic
development program.
Public consultation and information dissemination will
be conducted during project implementation.
X
X
X
X
1.1
Environment
Fisheries, ecological services Environmental flows
1.2 Social Resettlement, employment X X
1.3
Benefit
Sharing
Disagreement on benefit
sharing, royalties,
compensation etc
Agreements reached prior to project start
Updates to reflect findings, changing demands etc
X
X
2. Operating Environment Risks
2.1 Politics
and
Governance
Accountability and
transparence,
implementation capacity
Government reforms to increase transparency, promote
democracy and make responsible parties accountable.
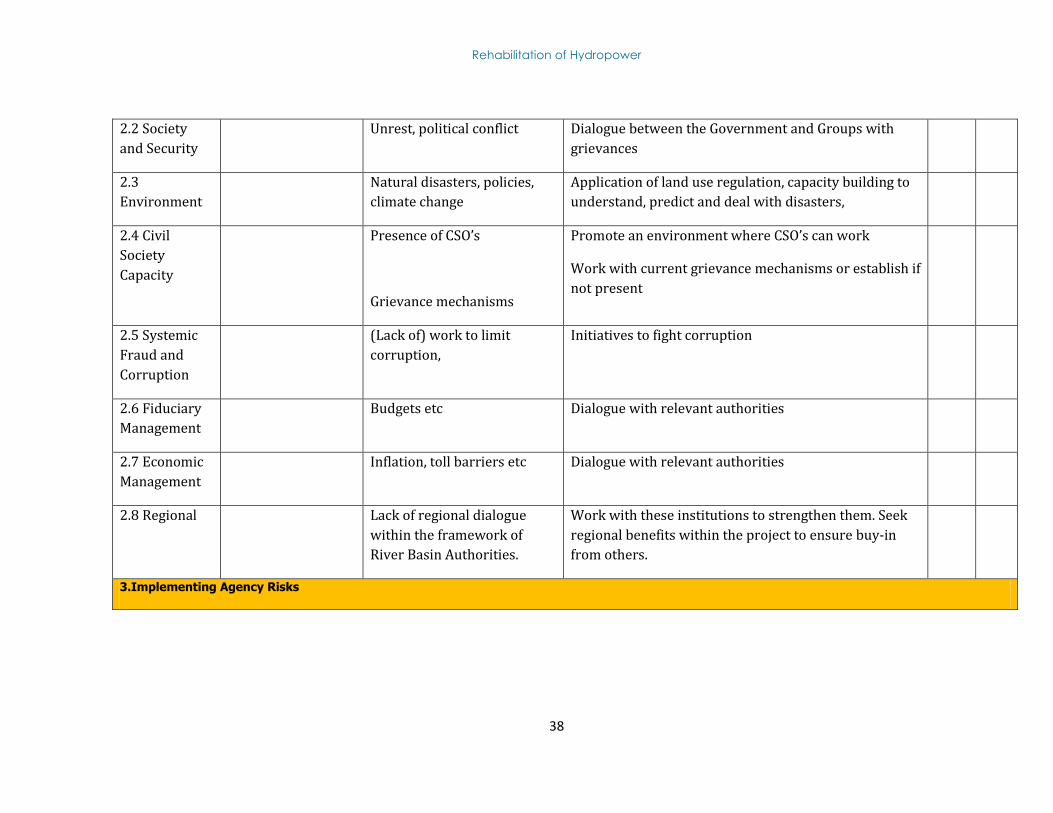
Rehabilitation of Hydropower
38
2.2 Society
and Security
Unrest, political conflict Dialogue between the Government and Groups with
grievances
2.3
Environment
Natural disasters, policies,
climate change
Application of land use regulation, capacity building to
understand, predict and deal with disasters,
2.4 Civil
Society
Capacity
Presence of CSO’s
Grievance mechanisms
Promote an environment where CSO’s can work
Work with current grievance mechanisms or establish if
not present
2.5 Systemic
Fraud and
Corruption
(Lack of) work to limit
corruption,
Initiatives to fight corruption
2.6 Fiduciary
Management
Budgets etc Dialogue with relevant authorities
2.7 Economic
Management
Inflation, toll barriers etc Dialogue with relevant authorities
2.8 Regional Lack of regional dialogue
within the framework of
River Basin Authorities.
Work with these institutions to strengthen them. Seek
regional benefits within the project to ensure buy-in
from others.
3.Implementing Agency Risks
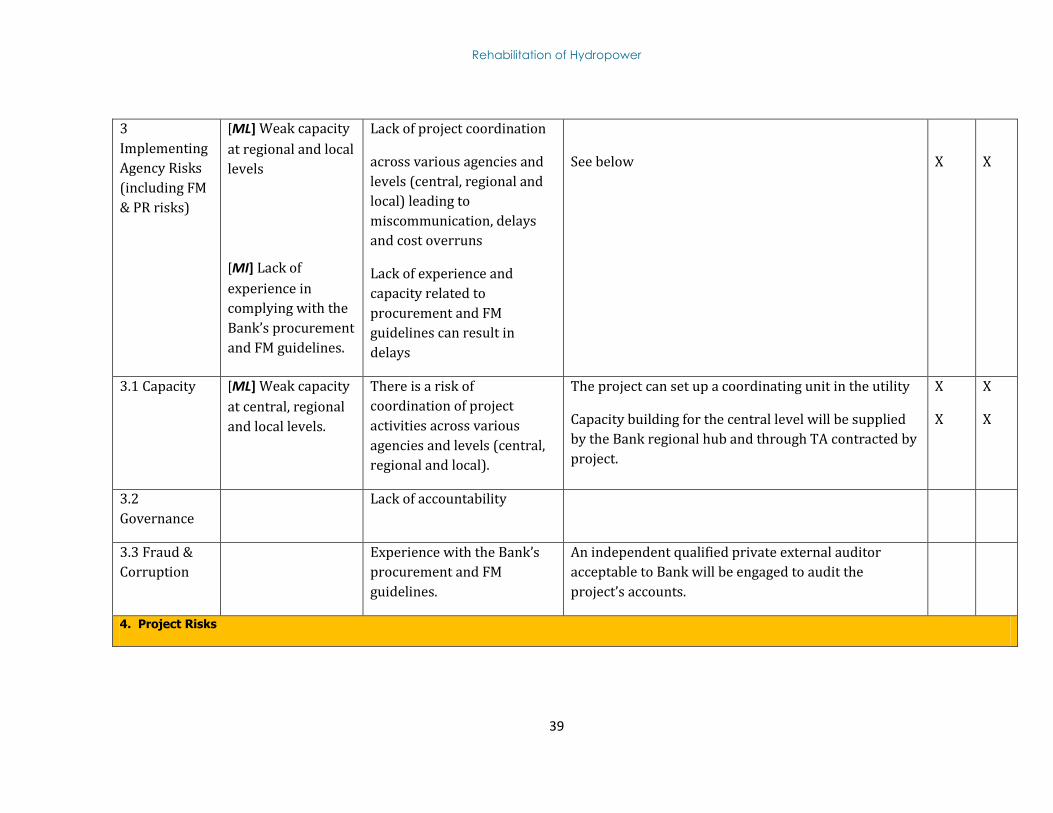
Rehabilitation of Hydropower
39
3
Implementing
Agency Risks
(including FM
& PR risks)
[ML] Weak capacity
at regional and local
levels
[MI] Lack of
experience in
complying with the
Bank’s procurement
and FM guidelines.
Lack of project coordination
across various agencies and
levels (central, regional and
local) leading to
miscommunication, delays
and cost overruns
Lack of experience and
capacity related to
procurement and FM
guidelines can result in
delays
See below
X
X
3.1 Capacity [ML] Weak capacity
at central, regional
and local levels.
There is a risk of
coordination of project
activities across various
agencies and levels (central,
regional and local).
The project can set up a coordinating unit in the utility
Capacity building for the central level will be supplied
by the Bank regional hub and through TA contracted by
project.
X
X
X
X
3.2
Governance
Lack of accountability
3.3 Fraud &
Corruption
Experience with the Bank’s
procurement and FM
guidelines.
An independent qualified private external auditor
acceptable to Bank will be engaged to audit the
project’s accounts.
4. Project Risks
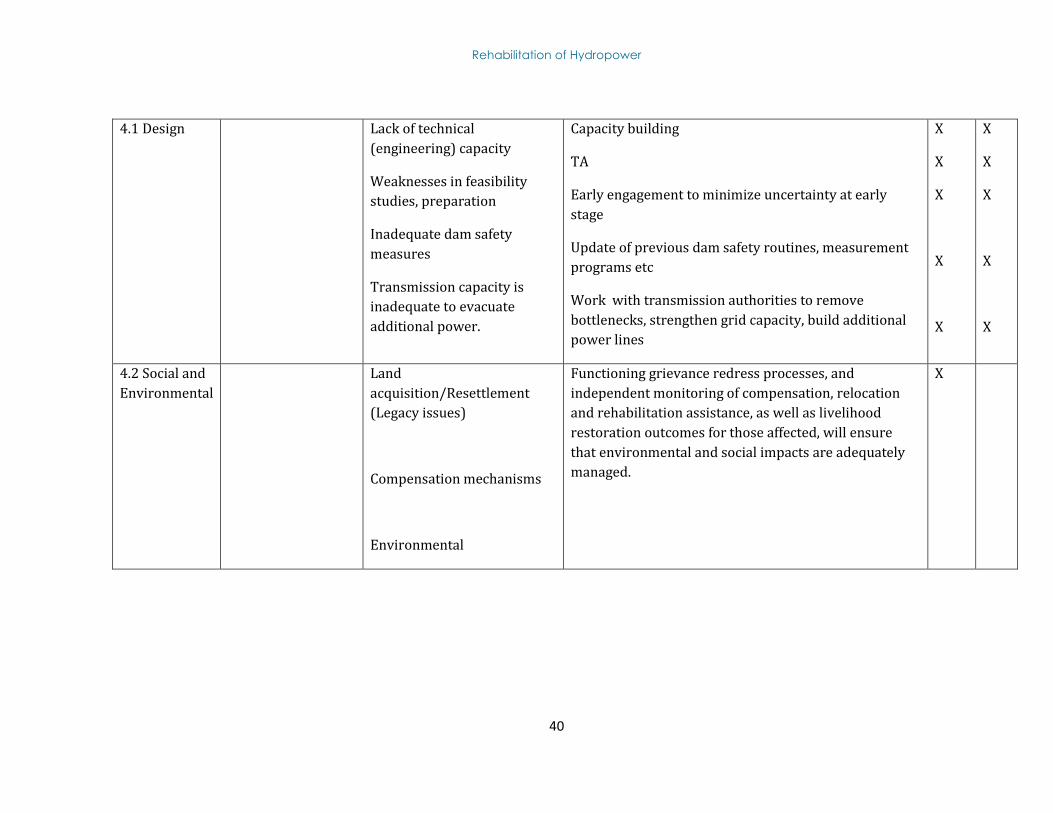
Rehabilitation of Hydropower
40
4.1 Design Lack of technical
(engineering) capacity
Weaknesses in feasibility
studies, preparation
Inadequate dam safety
measures
Transmission capacity is
inadequate to evacuate
additional power.
Capacity building
TA
Early engagement to minimize uncertainty at early
stage
Update of previous dam safety routines, measurement
programs etc
Work with transmission authorities to remove
bottlenecks, strengthen grid capacity, build additional
power lines
X
X
X
X
X
X
X
X
X
X
4.2 Social and
Environmental
Land
acquisition/Resettlement
(Legacy issues)
Compensation mechanisms
Environmental
Functioning grievance redress processes, and
independent monitoring of compensation, relocation
and rehabilitation assistance, as well as livelihood
restoration outcomes for those affected, will ensure
that environmental and social impacts are adequately
managed.
X
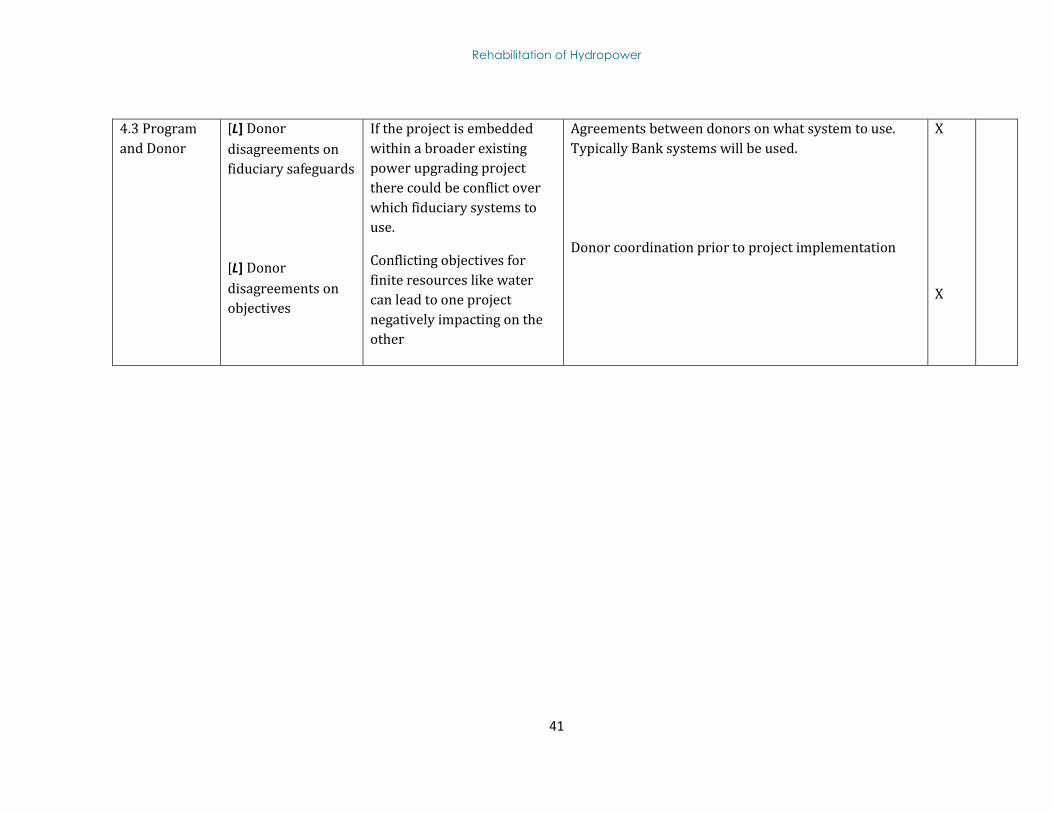
Rehabilitation of Hydropower
41
4.3 Program
and Donor
[L] Donor
disagreements on
fiduciary safeguards
[L] Donor
disagreements on
objectives
If the project is embedded
within a broader existing
power upgrading project
there could be conflict over
which fiduciary systems to
use.
Conflicting objectives for
finite resources like water
can lead to one project
negatively impacting on the
other
Agreements between donors on what system to use.
Typically Bank systems will be used.
Donor coordination prior to project implementation
X
X
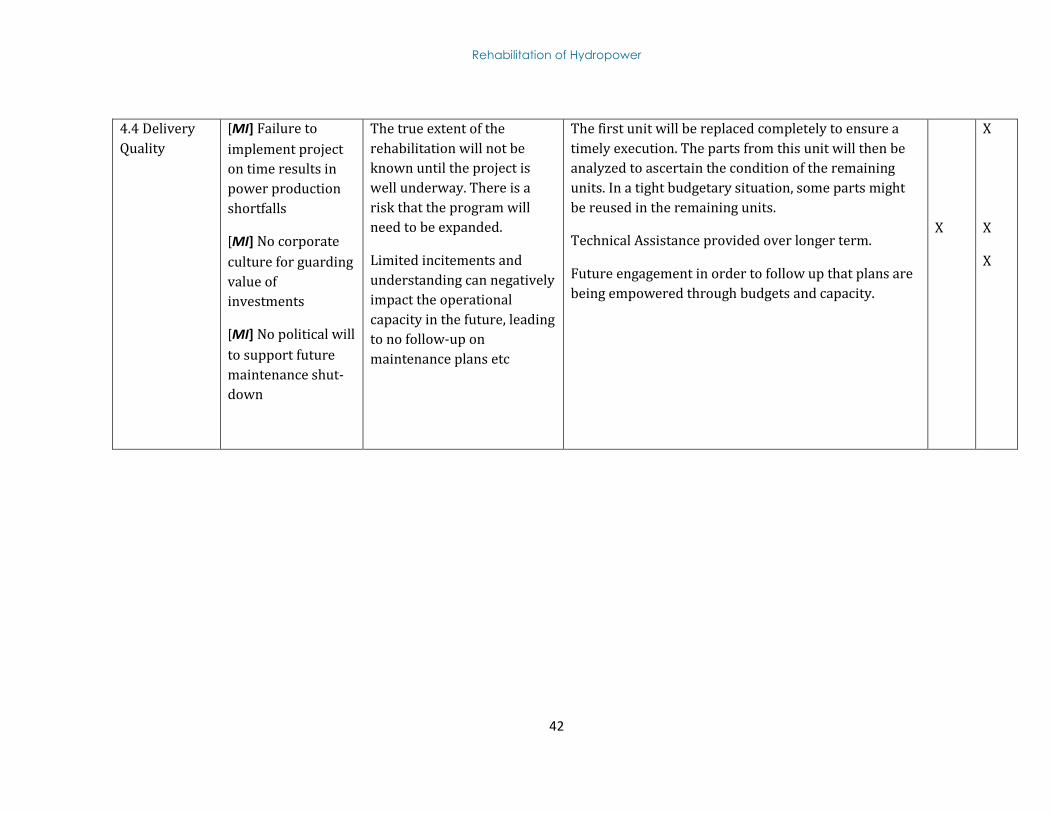
Rehabilitation of Hydropower
42
4.4 Delivery
Quality
[MI] Failure to
implement project
on time results in
power production
shortfalls
[MI] No corporate
culture for guarding
value of
investments
[MI] No political will
to support future
maintenance shut-
down
The true extent of the
rehabilitation will not be
known until the project is
well underway. There is a
risk that the program will
need to be expanded.
Limited incitements and
understanding can negatively
impact the operational
capacity in the future, leading
to no follow-up on
maintenance plans etc
The first unit will be replaced completely to ensure a
timely execution. The parts from this unit will then be
analyzed to ascertain the condition of the remaining
units. In a tight budgetary situation, some parts might
be reused in the remaining units.
Technical Assistance provided over longer term.
Future engagement in order to follow up that plans are
being empowered through budgets and capacity.
X
X
X
X
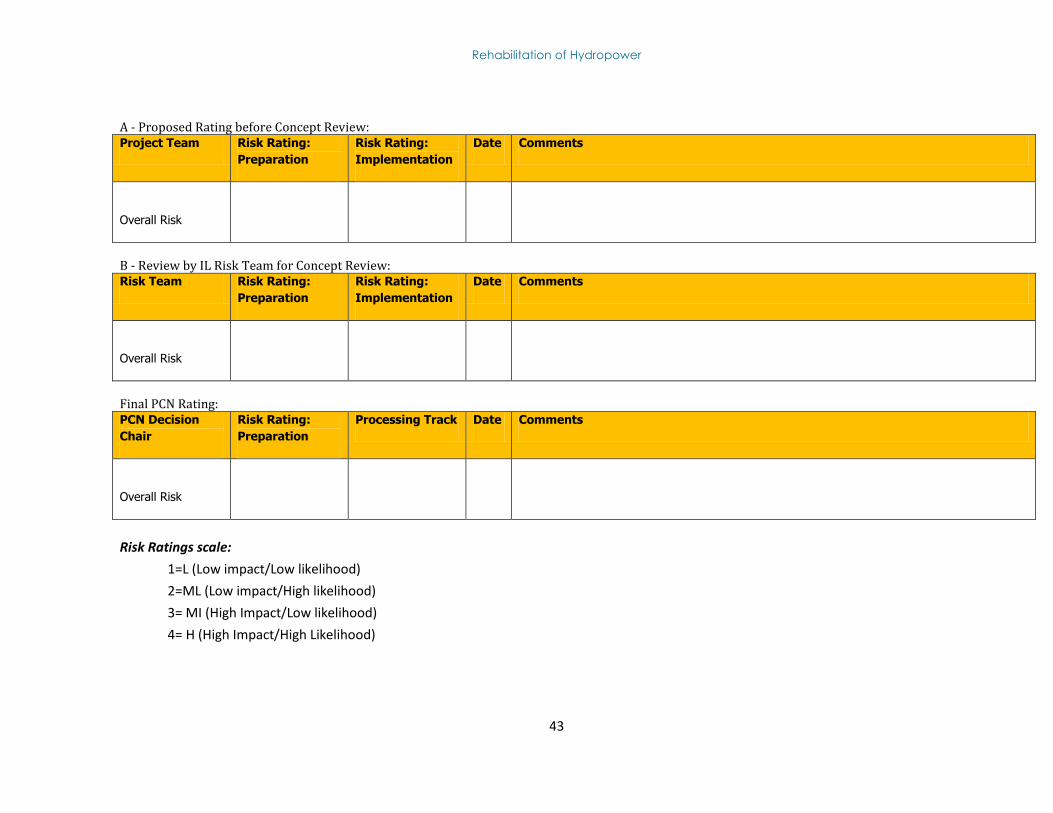
Rehabilitation of Hydropower
43
A ‐ Proposed Rating before Concept Review: Project Team Risk Rating:
Preparation
Risk Rating:
Implementation
Date Comments
Overall Risk
B ‐ Review by IL Risk Team for Concept Review: Risk Team Risk Rating:
Preparation
Risk Rating:
Implementation
Date Comments
Overall Risk
Final PCN Rating: PCN Decision
Chair
Risk Rating:
Preparation
Processing Track Date Comments
Overall Risk
Risk Ratings scale:
1=L (Low impact/Low likelihood)
2=ML (Low impact/High likelihood)
3= MI (High Impact/Low likelihood)
4= H (High Impact/High Likelihood)