regulation of gene expression in the mammalian eye and its relevance to eye disease todd scheetz et...
TRANSCRIPT
Regulation of gene expression in the mammalian eye and its relevance to eye disease
Todd Scheetz et al.Presented by John MC Ma
Aims
• To determine loci related to genes expressed in rat eye by expression quantitative trait loci (eQTL)
• To verify certain undescribed genes by r2 correlations on members of its gene groups
Background: QTL
• Quantitative trait locus
• Statistically links a certain genetic locus to a quantitative trait and seeks association– Phenotype QTL: The trait is a phenotype, eg
blood pressure, blood sucrose– Expression QTL: The trait is the expression of
a gene.
• Expression QTL is used in this paper
Methods: Choosing rat strains
• Several criteria– Highly inbred– Readily available– Completely genotyped– Diverse origins between strains– Phenotypically normal
• SR/JrHsd and SHRSP were chosen
Methods: Rat breeding and Genotyping
• SR/JrHsd males and SHRSP females were mated to produce F1; F1 was interbred to produce 120 F2.
• RNA was extracted from eye of 12-week-old F2 and is analyzed on Affymetrix Rat 230 Rat version 2 microarray
• Rats were genotyped using 399 sets of short tandem-repeat polymorphisms with PCR and gel electrophoresis
Methods: eQTL Analysis
• 18,976 eye-expressed probes out of the over 31,000 probe sets of the microarray was selected
• Expression of probe sets analyzed:– ANOVA for linkage;– Permutation test and q-value for multiple
testing correction;– Bonferroni correction for gene-level analysis
Results of eQTL
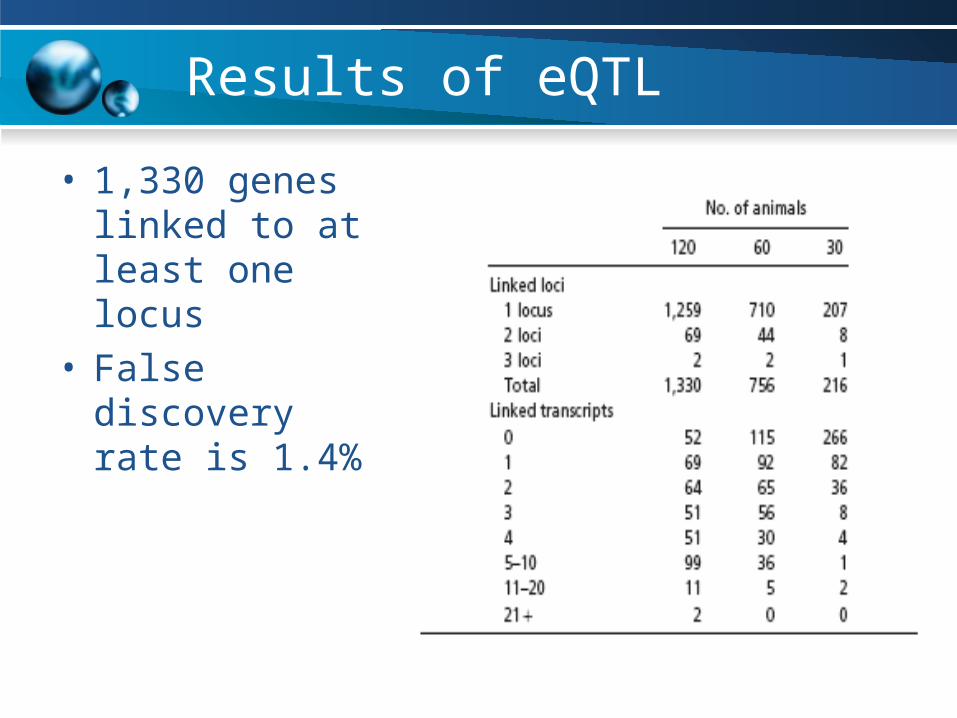
• 1,330 genes linked to at least one locus
• False discovery rate is 1.4%
Reading the dot plot (1)
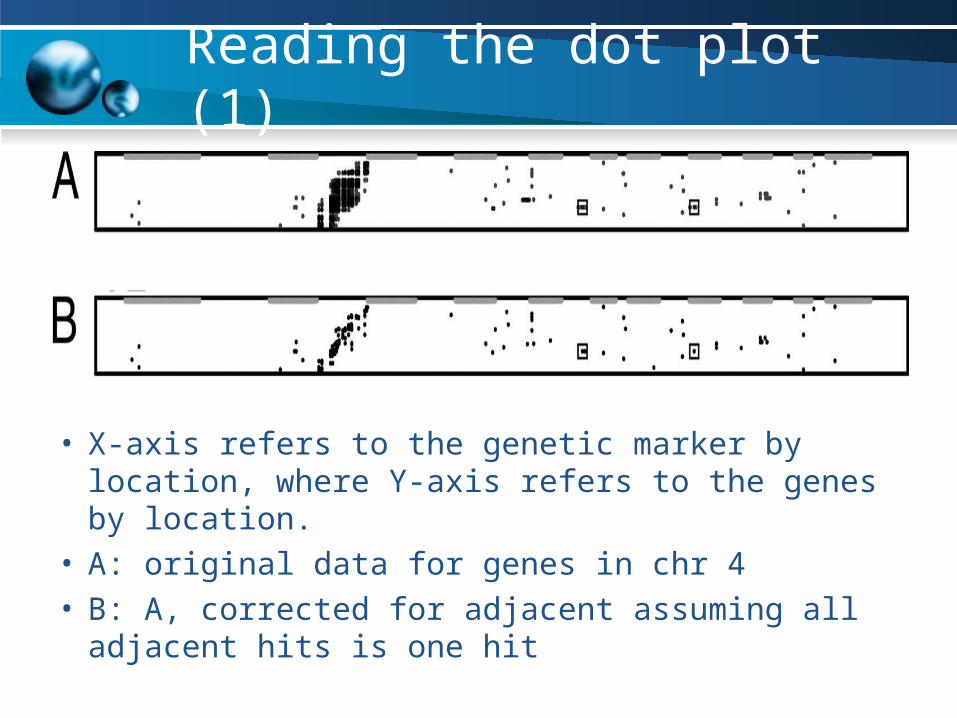
• X-axis refers to the genetic marker by location, where Y-axis refers to the genes by location.
• A: original data for genes in chr 4• B: A, corrected for adjacent assuming all
adjacent hits is one hit
Reading the dot plot (2)
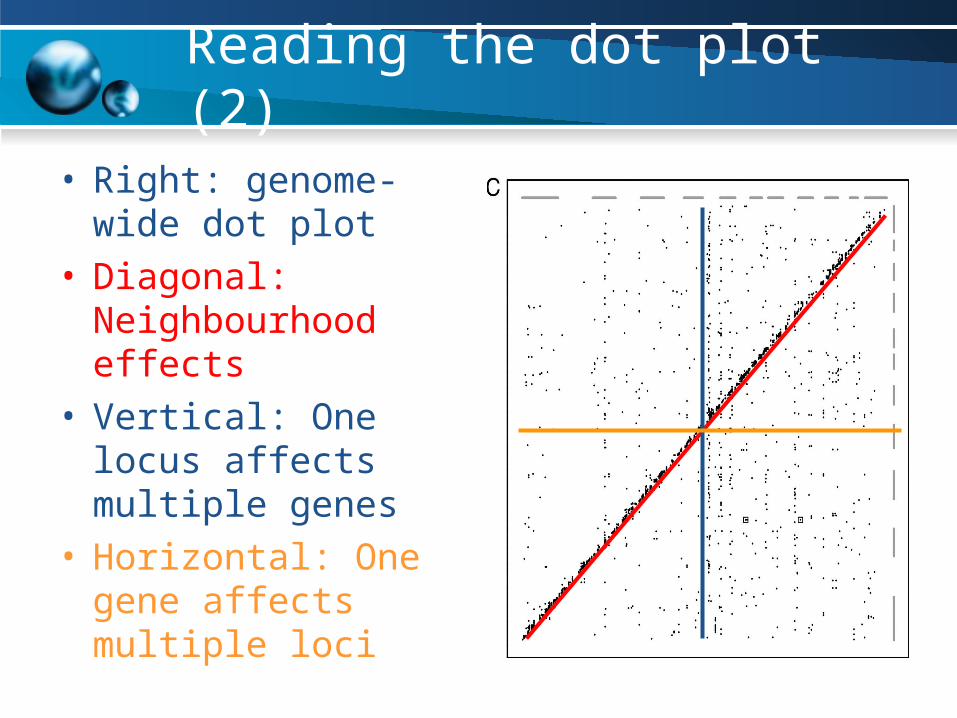
• Right: genome-wide dot plot
• Diagonal: Neighbourhood effects
• Vertical: One locus affects multiple genes
• Horizontal: One gene affects multiple loci
Neighbourhood effects
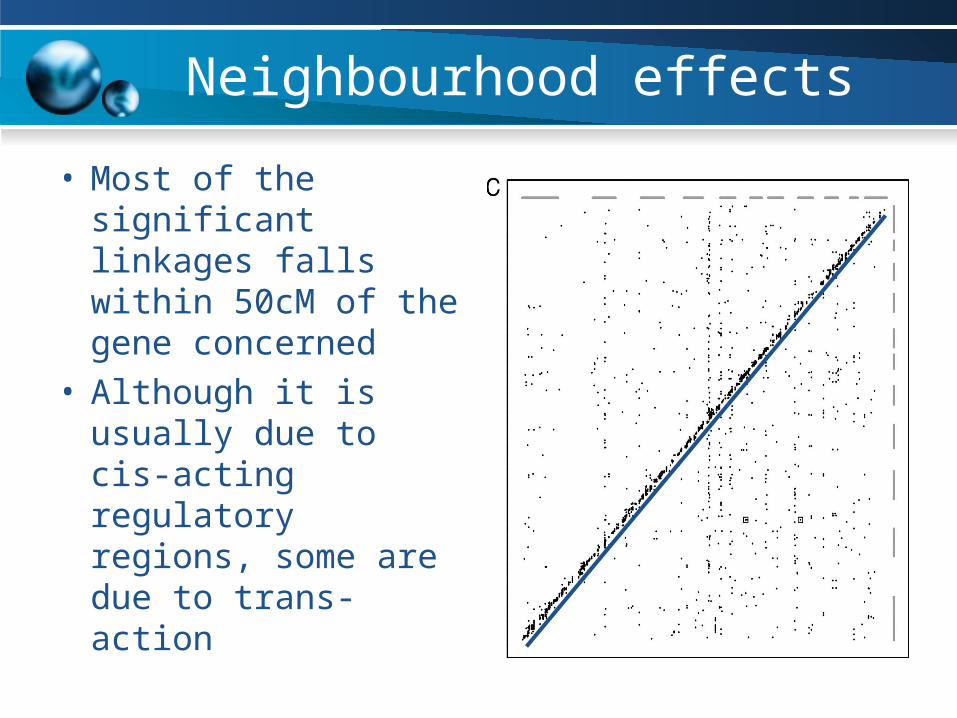
• Most of the significant linkages falls within 50cM of the gene concerned
• Although it is usually due to cis-acting regulatory regions, some are due to trans-action
Gene-linking locus
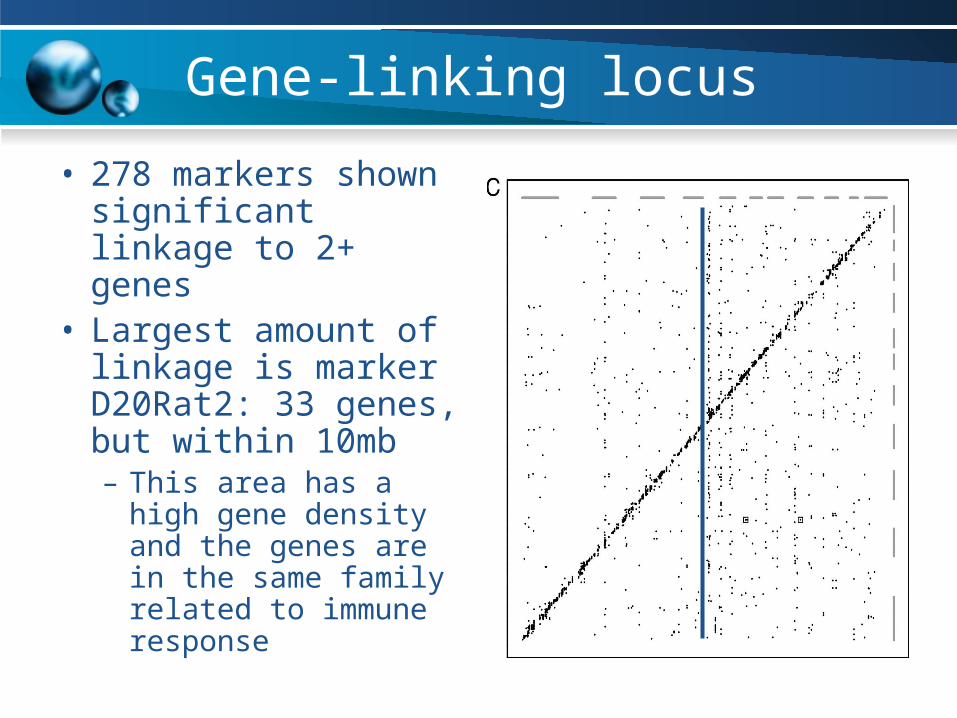
• 278 markers shown significant linkage to 2+ genes
• Largest amount of linkage is marker D20Rat2: 33 genes, but within 10mb– This area has a high
gene density and the genes are in the same family related to immune response
Gene-linking locus (2)
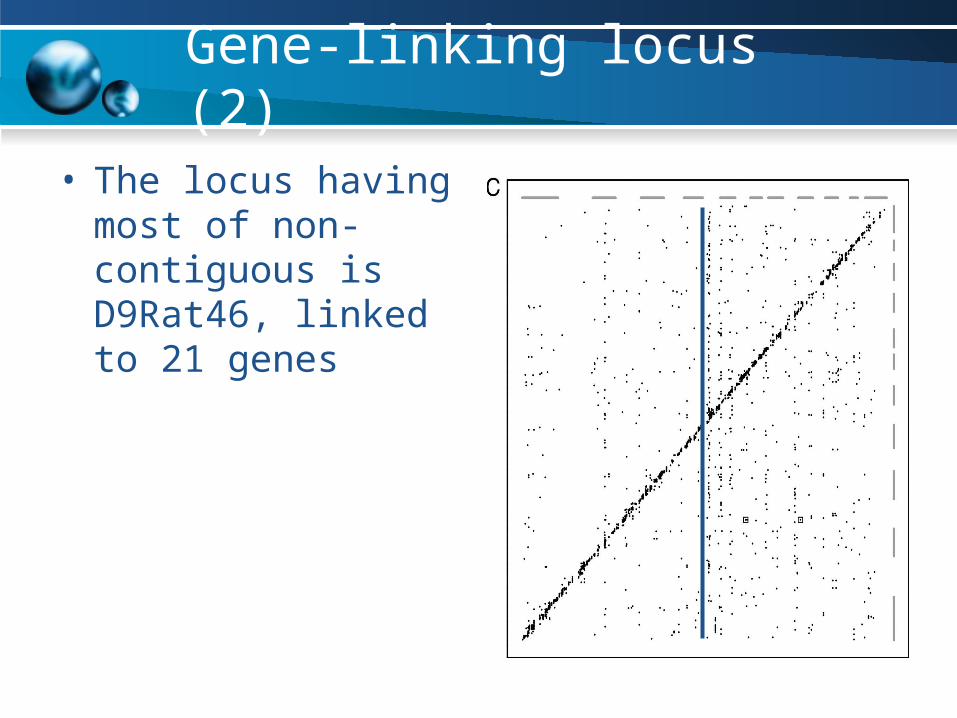
• The locus having most of non-contiguous is D9Rat46, linked to 21 genes
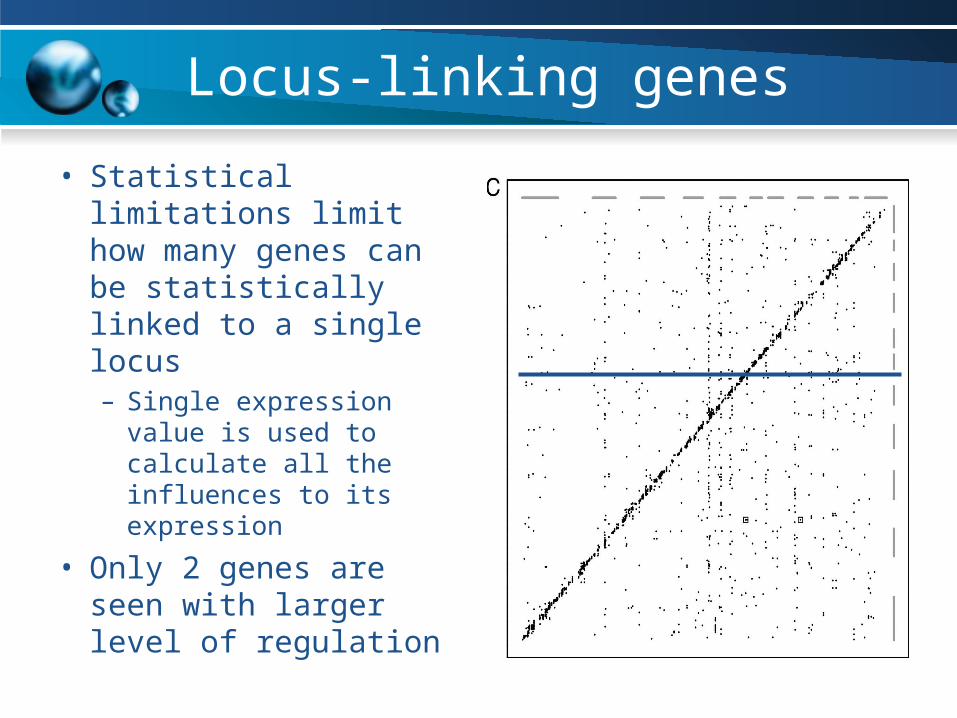
Locus-linking genes
• Statistical limitations limit how many genes can be statistically linked to a single locus– Single expression value
is used to calculate all the influences to its expression
• Only 2 genes are seen with larger level of regulation
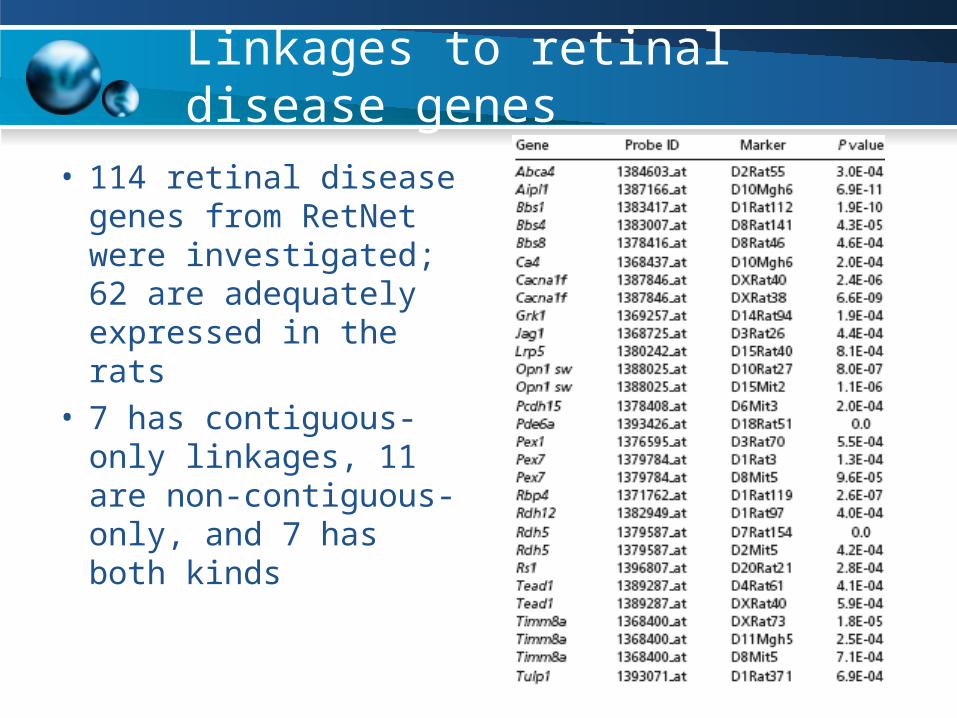
Linkages to retinal disease genes
• 114 retinal disease genes from RetNet were investigated; 62 are adequately expressed in the rats
• 7 has contiguous-only linkages, 11 are non-contiguous-only, and 7 has both kinds
Case of Abca4
• Example of contiguous-linkage-only gene
• Associated to Stargardt disease, an inheritable, juvenile kind of macular dystrophy
• Log odds score highest at marker closest to gene
• Sequencing shown the insertion of cREL promotion factor 6.6k upstream
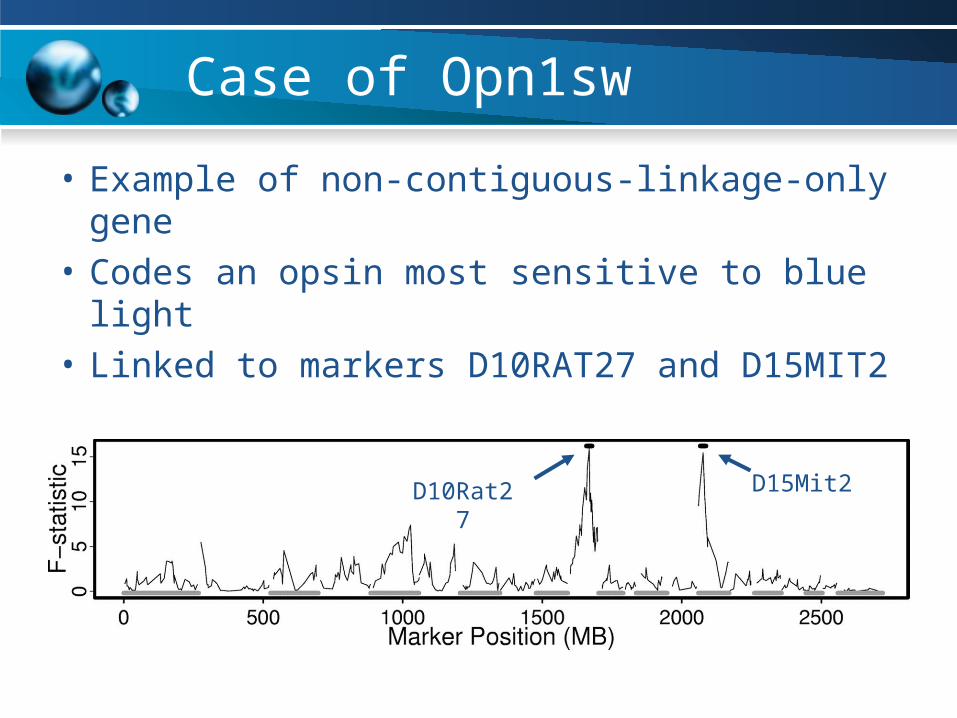
Case of Opn1sw
• Example of non-contiguous-linkage-only gene
• Codes an opsin most sensitive to blue light
• Linked to markers D10RAT27 and D15MIT2
D10Rat27 D15Mit2
Case of Opn1sw (Cont’d)
• D15MIT2 contains Thrb, known to determine fate of optic cones
• Sequencing found a mutation (Ser56Asn) that decreases expression of this gene by 30% if homozygous
Correlating gene expressions
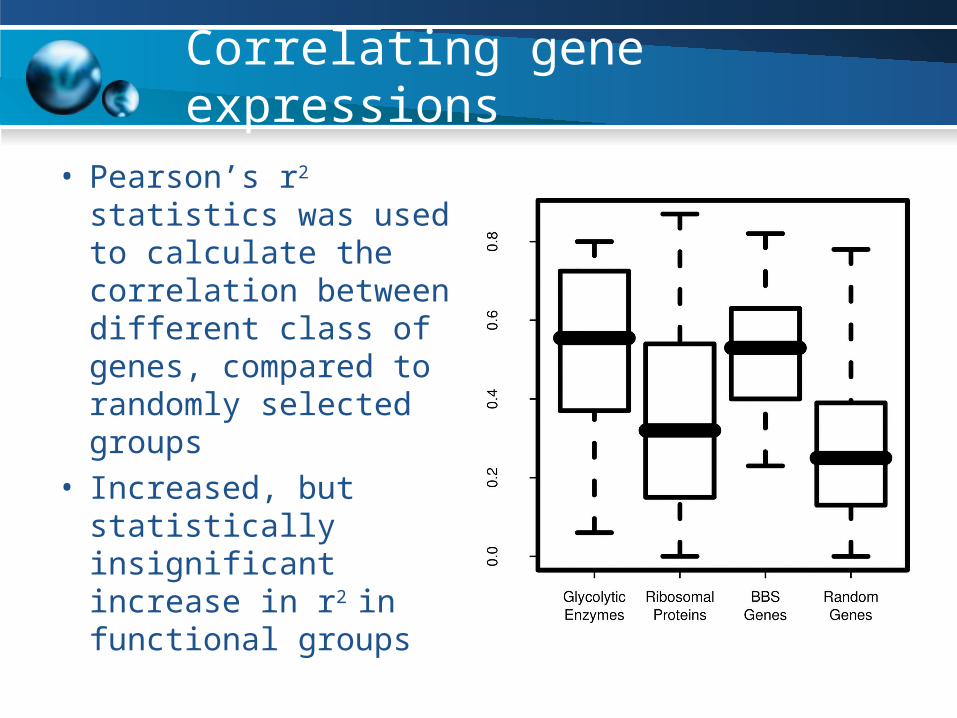
• Pearson’s r2 statistics was used to calculate the correlation between different class of genes, compared to randomly selected groups
• Increased, but statistically insignificant increase in r2 in functional groups
Correlating Bardet-Biedl Syndrome - Background
• Rare genetic disease that cause multiple syndromes like:– Retinitis pigmentosa– Obesity– Polydactyly
• Autosomal recessive
• Several genes have seen linkage, but they only account for about half of cases
Correlating Bardet-Biedl Syndrome
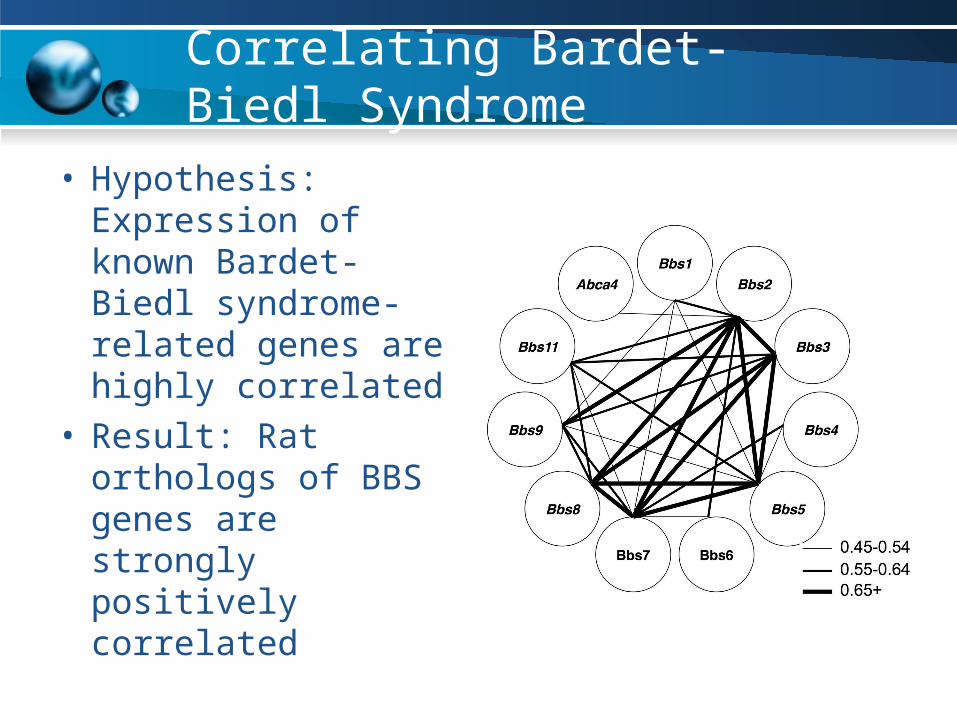
• Hypothesis: Expression of known Bardet-Biedl syndrome-related genes are highly correlated
• Result: Rat orthologs of BBS genes are strongly positively correlated
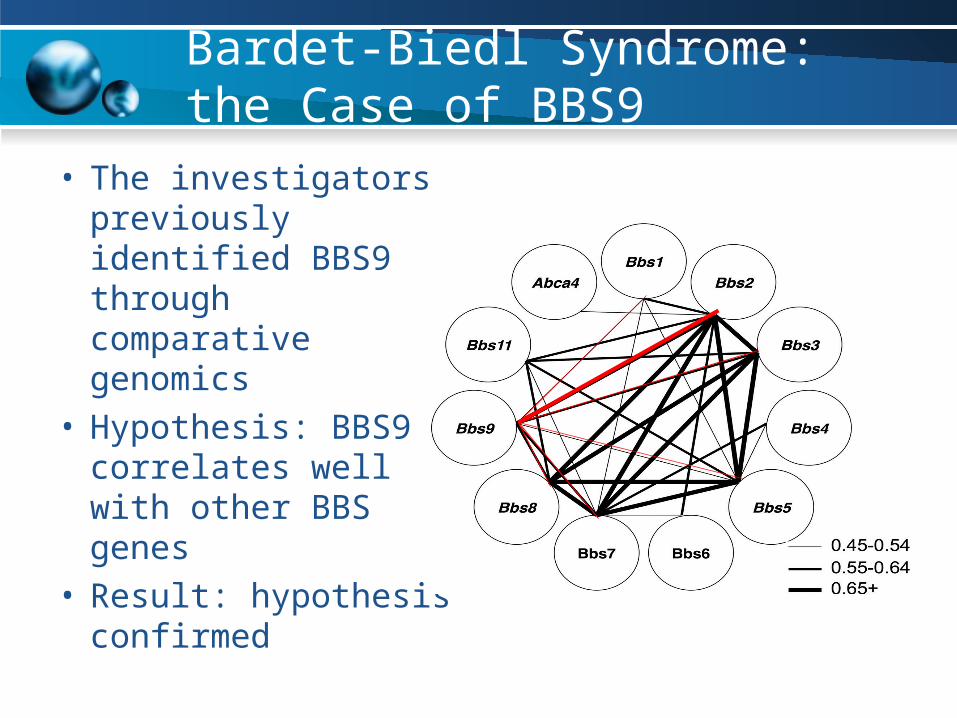
Bardet-Biedl Syndrome: the Case of BBS9
• The investigators previously identified BBS9 through comparative genomics
• Hypothesis: BBS9 correlates well with other BBS genes
• Result: hypothesis confirmed
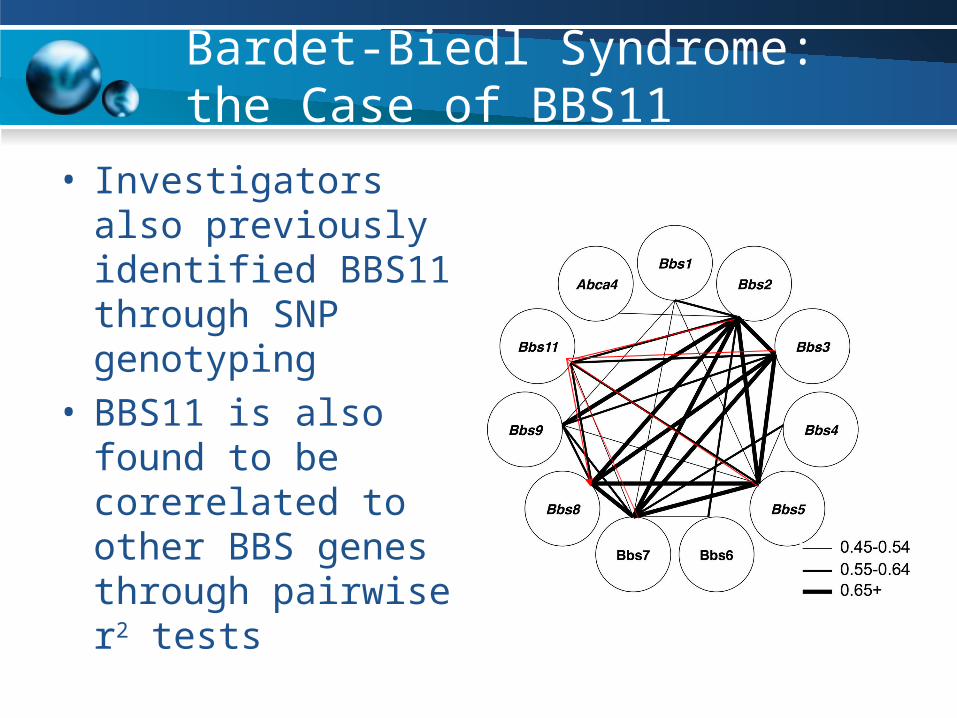
Bardet-Biedl Syndrome: the Case of BBS11
• Investigators also previously identified BBS11 through SNP genotyping
• BBS11 is also found to be corerelated to other BBS genes through pairwise r2 tests
Discussion
• Previous eQTL analyses has shown that gene regulation is more complex than expected
• In this investigation:– Changes in expression are can be traced to
inheritable factors– Multiple loci controls one gene
• Experience on Abca4 and Opn1sw shown eQTL is effective method for determining role of gene regulation in diseases
Discussion (Cont’d)
• Regulatory relativity: functionally related gene are expressionally related; genes that response to a change can be inferred to be functionally related
• In this paper, recombination between the genomes became the permutation
• RG is found plausible in research and useful in finding undescribed disease genes

End