regulation initiative discussion paper series...
TRANSCRIPT
Regulation Initiative Discussion Paper Series Number 48
Measuring the Efficiency of
Britain’s Privatised Train Operating Companies
Luisa Affuso* [email protected]
London Business School
Alvaro Angeriz
Department of Applied Economics University of Cambridge
Michael Pollitt Judge Institute of Management
University of Cambridge
1 February 2002
1

Abstract Twenty-five train operating companies (TOCs) were created between 1994-1997, as part of the restructuring process of the railway industry in Great Britain. The TOCs operate monopoly franchises for the provision of passenger rail services over certain routes - some of which continue to receive government subsidies. This paper investigates how the efficiency of these train operating companies has evolved over the period since privatisation using data envelopment analysis (DEA) and corrected ordinary least squares (COLS). Our data allows us to look at the evolution of relative efficiency and productivity through the privatisation and to perform second-stage regression analysis of the efficiency scores using safety, quality and environmental data. The analysis sheds some light on the successes and failures of the UK’s most controversial privatisation to date. Keywords: Railways, Comparative Efficiency, Data Envelopment Analysis, Corrected Ordinary Least Squares, Train Operating Companies, Privatisation * Corresponding author. This paper is based on research conducted while the first author was a Research Fellow at the Department of Applied Economics of the University of Cambridge. We are very grateful to Cambridge Econometrics and the Strategic Rail Authority for providing some of the data used for our analysis, to the participants to the Regulation Seminar at Cambridge and the 7th European Workshop on Efficiency and Productivity Analysis, David Newbery, Gian Carlo Scarsi, Jonathan Cowie and Jonathan Kohler for very helpful comments and suggestions, and to the ESRC for sponsoring this research, Grant No. R000237928. The usual disclaimer applies.
2

1. Introduction The widely held belief that government owned utilities tend to operate inefficiently, and constitute a burden on the public purse drove the last and most controversial privatisation in Britain: the Railways. This privatisation took place between 1994 and 1997. British Rail (BR), the state owned, vertically integrated national monopoly was radically restructured and separated into more than 100 successor companies which were privatised. As part of this process 25 train operating companies (TOCs) were created which leased rolling stock from the rolling stock companies (ROSCOs) and operated monopoly franchises for the provision of passenger rail services over certain routes. Two new regulatory bodies, the Office of the Rail Regulator (ORR) and the Office of Passenger Rail Franchising (OPRAF) were established. The ORR regulates the single track operator, Railtrack, while OPRAF (now the Strategic Rail Authority – SRA) regulates the TOCs. Under the privatisation many franchises continued to receive government subsidies for the provision of services. Although the subsidy bill was supposed to be declining over time - after an immediate post-privatisation surge - some problems became evident that have caused more, rather than less money necessary to be allocated to this industry by the government (see DETR, 2001). In October 2000 a major train crash led to a prolonged period of disruption on the rail network and much criticism of the original privatisation process. The debate continues on whether the industry should be further re-organised and perhaps partially re-integrated. This debate has given new impetus by the recent (October 2001) placing into administration of the privatised network operator, Railtrack. Horizontal and vertical separation of the former state monopoly were adopted in order to implement competition in the passenger rail services. This competition was originally expected to derive from the competitive process for the allocation of the franchises, i.e., ‘competition for the market’, and subsequently to become ‘competition in the market’ by allowing increasing degrees of open access operation over time. There are additional merits to unbundling and creating a large number of downstream operators. In a regulated industry, like the railway, the regulator has the hard task of ensuring that companies behave in a ‘competitive-like fashion’ even when they hold monopoly licences. The ability to reach this outcome rests on the amount and quality of information that the regulator – who is at an informational disadvantage - is able to extract. Having a larger number of downstream operators makes this task easier. By combining data from different operators, and comparing information on companies’ outputs and performance levels, it has been possible in other privatised industries to establish a comparative efficiency framework, within which the regulator can identify the relative abilities of the different operators. Establishing such framework is of great importance in the railways for two main reasons. First, because of the large public subsidy and with the need for the regulator to ensure that the taxpayers are getting ‘good value for money’. And second, because the regulator will have better information available when having to decide about renewal of franchises and consolidation of existing ones. This paper studies the evolution of the performance of the train operating companies from the time of privatisation until April 2000. In particular we examine comparative efficiency and productivity of the passenger operators TOCs. To the best of our knowledge this is the first study of comparative efficiency of the private railways in Britain. This investigation is based on a unique data set that was created for the purpose of this study. The data derive from many
3

different sources including company accounts, regulatory reports, specialised industry publications and information provided directly by the companies and industry experts. We use data envelopment analysis and corrected ordinary least squares to analyse our data. Our data set allows us to look at the evolution of relative efficiency and productivity through the privatisation and to perform second-stage regression analysis of the efficiency scores using safety, quality and environmental data. The analysis intends to shed some light on the successes and failures of the UK’s most criticised privatisation to date. This paper is organised as follows. Section 2 illustrates the background and lays out the hypotheses tested. Section 3 summarises the previous literature on railway efficiency. Section 4 describes the data and section 5 looks at the methodology adopted. Section 6 reports the results of the analysis, and section 7 concludes. 2. Background and Hypotheses According to some industry experts, British Rail operated its network on a “make-do, least-cost basis,” (Humphrey, 2001), it never developed the system in order to transform it into a proper standardised network. BR managers got around problems rather than solving them. A large number of operations were based on personal experience. Some claim (e.g. Dunwoody, 2001) that vertical separation has destroyed the ‘sense of ownership’ of people who used to work in the industry, and this has resulted in the poor performance experienced by the privatised industry to date. Fragmentation, it is has been claimed (Dunwoody, 2001), is the main cause of the alledged poor performance of passenger railways since privatisation. This leaves the main question still open as to what is the best structure for this industry. An economic interpretation of the facts suggests that the restructuring has eliminated that ‘ad-hoc’, personal management style, thus revealing the lack of a proper managerial system of the capital asset base, as well as (in some instances) of operations. While it is regrettable that the ownership feelings of Railways personnel have been lost, one should also objectively recognise that a modern railways system should not rely (neither exclusively nor primarily) on such feelings for a proper and efficient delivery of services. The privatisation and vertical separation of this industry have revealed (belatedly) pre-existing failures of the system (specifically the backlog of network investment). The current experience is one of a learning and reaction process. But is this learning process producing or going to produce positive results? Are productivity and efficiency improving in the British Railways system? Demand for passenger rail services is pro-cyclical and the last years have demonstrated that continued economic growth associated with government policies aimed at reducing motoring traffic for private usage can generate extremely high levels of demand. Demand for rail services has increased at an unprecedented and unpredicted rate of 6 p.a. from 1995 to 2000. This has put great pressure on the existing, historically under-funded, network. Given this background, and the additional restrictions (especially speed restrictions) imposed on the system following the rail accident at Hatfield it is perhaps not surprising that the passenger railway services have not produced a satisfactory performance. On the other hand, the performance of BR, ie., of pre-privatisation times, was renowned among rail users for being highly unsatisfactory. It is important to objectively examine and understand how post-
4

privatisation performance compares with British Rail’s performance, and to understand whether productivity and efficiency in the industry have been improving since privatisation. This study is going to test three main sets of hypotheses. Our first set of hypotheses concerns the effects of the privatisation on efficiency. The major driver behind the UK’s privatisation program was the desire to improve the efficiency of poorly performing state owned companies. We would expect that privatisation would improve the level of efficiency of train operating companies in line with the general findings from studies of privatisation around the world (see Megginson and Netter, 2001). We might additionally expect that the competitive process and the diffusion of best practice might reduce the dispersion of efficiencies between the TOCs. However we recognise that the scope for this to happen is limited by dispersion in rolling stock and track infrastructure quality. Our second set of hypotheses examine the determinants of efficiency for the TOCs. The TOCs are not a homogeneous set of companies producing identical products with the same technology and environmental factors. We might expect that efficiency is at least partially a function of the operating environment of the train operating companies – companies operating long distance routes might for instance enjoy economies of scale relative to companies operating in low customer density regions. We might also expect that the considerable variation among TOCs in the age of the rolling stock used might influence operating costs and output and hence efficiency (Affuso and Newbery, 2000 and Dunwoody, 2001). Further it may be the case that the subsidy environment of individual TOCs may be having some influence on its efficiency. Lower levels of subsidy may reduce the scope for inefficiency or indicate the competitiveness of the franchise and hence be associated with higher levels of efficiency post-privatisation. Indeed, Obeng and Sakano (2000) looking at urban public transport systems and Oum and Yu (1994) looking at a sample of international railway systems find subsidies negatively correlated with efficiency. Our final set of hypotheses focuses on the relationship between safety and service quality and efficiency. It has been suggested, especially following the October 2000 Hatfield crash, that safety and service quality have been compromised in the privatised network. This implies the hypothesis that there is a negative relationship between efficiency and these variables at the individual TOC level. However it may be that variations in performance are explained by some of the environmental factors mentioned in the previous paragraph. A more positive view would be that efficiency, safety and quality of service are all the outcome of superior management and that they are complements rather than substitutes. 3. Literature Review
This section outlines some selected empirical studies from the vast literature on productivity and efficiency measures applied to railway companies or systems. Following Oum et al. (1999) these works can be grouped in two broad strands, namely ‘Index Numbers’ and ‘Econometric methods’, based on the type of techniques employed.
On the one hand, Index Number procedures reflect the relationship between outputs and inputs without the application of any estimation technique. Thretheway et al. (1997), for instance, compute single factor productivity indices and the multilateral TFP indices for two Canadian railway companies in the period 1956-91. However, the method presents its own shortcomings. Illustrative of these are the results presented for sensitivity analysis, showing the TFP growth to be sensitive to the underlying assumptions and calculation procedures. Finally, in an attempt to decompose the sources of productivity gains, the TFP index is regressed on a number of factors. The results indicate that the TFP growth is explained by the 5

increase in the volume of freight and passengers, and the same occurs with higher average freight hauls. On the contrary, for a given number of passenger miles, increasing the length of passenger trips has a negative effect in productivity growth records.
Secondly, data envelopment analysis (DEA) is one of the most commonly used of the Index Number methods. It computes non-parametric efficiency frontier functions and efficiency scores by the application of linear programs. Following this line of research, Oum et al. (1994) compare the performances of a panel of 19 OECD railway systems over the 1979/89 period. Subsequently, the links between exogenous factors and efficiency are investigated by applying a Tobit model. Then, the resulting scores are controlled for the effect of market characteristics, and other operating and institutional aspects which managers are not able to control. The residuals of these models are considered by the authors as more adequate indicators of technical and management efficiency, while the DEA scores are seen as ‘gross’ efficiency indices. Having found a positive correlation between the managerial autonomy and the DEA scores, and a negative one between the latter and public subsidies, Oum et al.(1994) suggest that normal market mechanisms should be managed to improve companies’ cost recovery while subsidies could be used to improve services, and that productive efficiency might be enhanced by a regulatory framework providing greater freedom for managerial decision making.
More recently, Cowie (1999) compares the performance of public and private railway companies in Switzerland. By applying DEA analysis to each of the groups, the technical efficiency is decomposed in managerial and organisational efficiency scores. It is shown that while management appears to be very efficient between the private companies (achieving 95% as the mean of the scores), the difference among both groups accounts for almost all the gap between technical efficiency records, leaving an almost null organisational efficiency score. The author, then, hypothesises that as organisational restrictions affecting public companies are not uniform across the country the results may be reflecting a less efficient behaviour in most of public companies, primarily due to the more restrictive environment that affects them.
Finally, Cantos et al. (1999) provide another interesting example of DEA application to a panel of 17 European rail-systems in the period 1970/95. The long time period allows for the isolation of the technological advances from the changes in the productivity levels. These technological enhancements are revealed to be the determinant of most increases in productivity records. The achievements are concentrated in the period 1987-95, following the restructuring of the activity consisting of differentiating business lines or areas in most of the companies. It is during that period that British Railways (BR) accomplished the highest TFP growth rate of the sample and the second average efficiency change. As a result, its position is improved reverting inefficient initial scores into one of the most efficient ones. Next, the sources of these changes are analysed by estimating Tobit models. The efficiency scores are discovered to be positively correlated with passengers per train and tonnes per train, with the degree of management autonomy and financial autonomy, and also with the percentage of electrified tracks.
As a second category of procedures, Econometric methods can account for the randomness in the company’s behaviour. They identify changes in productivity or productive efficiency by the estimation of production or cost functions. However, the need for an a priori imposition of the frontier functional form and of the distribution of the error term is regarded as the most important disadvantage of this technique in relation to the non-parametric methods.
6

In order to deal with the multiple output characteristic of the railways market the cost function approach is the most commonly used in this kind of literature. Caves et al. (1980a), for instance, in a path breaking study of US and Canadian railroad companies in the period 1956/74 estimate a productivity index through a two-step method. In the first one, a variable cost function is estimated; then, partial cost elasticities are computed and used in a second step in order to compute the productivity increments. By proceeding in this way they obtain significantly lower results than the ones obtained with conventional weights. In subsequent work, the application of this methodology to the study of the TFP growth in both countries during the same period, leads these authors to conclude that Canadian companies perform better with higher TFP growth, especially during the sixties, when they operated under a more deregulated environment than in the US [Caves et al. (1981a)].
These procedures, known as ‘average function estimation techniques’, are widely used in the railway productivity literature.1 Nevertheless, critics of these methodologies highlight that the estimation of scale economies and technological change can only be computed from frontier functions. This allows for possible inefficient behaviours by explicitly incorporating an inefficiency term in the perturbation component of the model. Frontiers are, then, considered deterministic or stochastic in accordance to the assumptions made about the error term in the model.
Perelman and Pestieau (1988) is a starting point for this kind of applications to the railway systems. In this study, the deterministic approach is applied to the estimation of a production frontier function for 197 companies of 19 countries in 1970-83. For this purpose, they use corrected ordinary least squares (COLS), a method that consists of shifting the constant in the OLS estimation, by subtracting the residual with the highest value. Intending to isolate the inefficiency measures from factors that are not under the managers’ control, a number of environmental variables are included in the function. In a similar fashion, Deprins and Simar (1989) estimate a production function by COLS and also by Non-Linear Least Squares and Maximum Likelihood with a Weibull distribution of the inefficient component. They also use a similar sample revealing important exogenous effects as determinants of companies’ performances, except for the case of BR. This company, they maintain, doesn’t benefit itself from the ‘extremely’ favourable environmental conditions that it used to enjoy, showing a steadily deteriorating path for efficiency in the period.
Interestingly, panel data techniques are applied by Jha and Sing (1994) to eight Indian zonal railway systems from 1966/67 to 1988/89. Within Estimation, GLS and Amended Hausman Taylor Efficient IV Estimation are applied to the estimation of a production deterministic frontier using two outputs (freight kms. and passenger kms.) obtaining stable efficiency increments over time regardless of the variables and estimation procedures considered.
While the deterministic approach labels all the deviation from the frontier as inefficiency, stochastic frontiers allow for the consideration of noise or measurement errors. Kumbhakar (1989) constitutes one of the earliest applications of this approach to railways’ systems. Using panel data on 42 U.S. Class 1 railroads he estimates input- and firm-specific allocative inefficiency together with technical inefficiency.
Cantos et al. (2000) estimate a stochastic cost frontier function for 15 European companies in 1970-90. In this exercise BR results to be one of the five most efficient companies in the period. The sources of the efficiency performances are then explained by Tobit estimations
7
1 Andrikopoulos et al. (1998), Caves et al. (1980b and 1981b), De Borger (1991), Filippini et al. (1992), Friedlander et al. (1993), Gathon et al. (1989), Wilson (1997).

obtaining similar results to the ones reported by Oum et al. (1994), being managerial and financial autonomy, and the intensity in the usage of the network the sources of enhancement of the levels of efficiency, whereas an increase in the number of passengers per train would have a negative impact on efficiency.
Gathon and Pestieau (1995) constitute another attempt to decompose efficiency records into a managerial and a regulatory component. The authors apply a two-stage stochastic frontier analysis to 19 European countries in the period 1961/88. In the first step they estimate a translog production function, adding a time variable to the conventional inputs, in order to reflect the displacement of the production function over time due to technical progress. In the second step the residuals are corrected by taking into account differences in autonomy degrees, three indices of which and an aggregated one are constructed from a survey aimed at evaluating the relations between public authorities and railways’ management. The result is that both levels and rankings obtained change considerably from the original gross efficiency scores, with BR as the second most efficient company in managerial efficiency scores and in regulatory ones.
Tsionas and Christopoulos (1999) and Christopoulos, Loizides and Tsionas (2000) apply stochastic frontiers to European rail-systems in the period (1969-92). The model presented in the first article allows for simultaneous estimation of firm specific and time varying technical inefficiencies, and of the technological change. They proceed by using an index of disembodied technical change in a translog production function adding variables in an attempt to control for exogenous effects.2 Britain is shown to be the third most efficient system in the whole period, whereas the inefficiencies can be attributed to higher freight loads and the length of trip while the higher electrification, the longer length of load and the greater passenger load enhance the levels of efficiency. Christopoulos et al. (2000) instead, basically provide estimates of technical inefficiencies due to each input by country and over time. The Input-Specific-Technical-Efficiency Specification and the Overall-Technical-Efficiency Specification Model are tested against each other and the first is proved to be superior. With all their specific scores above 96%, France, Britain, Netherlands and Germany are the most efficient systems. Next, in an attempt to control for exogenous factors they estimate the specific scores of the less efficient countries using the Beta distribution, finding that the electrification and the average length of haul have always a positive effect on these regardless of the input used in the calculation.
Finally, Coelli and Perelman (1999) represent railway production technology with input- and output-distance functions for the first time in this literature. This approach allows for the consideration of multiple-output and multiple-input technologies without using the required behavioural assumptions needed for the aggregation. Empirical evidence is presented for input and output oriented functions, resulting from the application of three methods. First, they construct a parametric frontier using linear programming methods (PLP); then they apply DEA and finally COLS. This sample consists of 17 European railways in the period 1988-93. It is observed that COLS provides good fits, rejecting the hypothesis of constant return to scale. PLP results in higher mean scores but without large differences between these and the ones obtained with other methods. This result is confirmed by a quite strong correlation of efficiency scores between the two parametrical methods and significant ones between DEA and the parametric methods. Also very similar parameters are estimated with some differences due to the greater influence that the more efficient observations have upon the shape of the PLP frontier. Final efficiency estimates are built by constructing geometric averages of the
8
2 For us: they do so because they criticise the method in two stages by saying that it provides biased estimation in both steps because in the first step the method assumes that exogenous variables doesn’t affect efficiency scores.

three measures for each datapoint. The choice of the orientation of the frontier does not seem to affect the results very much, with Britain and Netherlands appearing as the most efficient systems.3
We summarise the variables used to specify the production technology in the 25 previous studies cited above in Tables 1 and 2. Table 1 summarises the frequency with which variables appear as inputs or outputs in the 25 studies. Labour is used as an input in all of the studies while passenger kms (or miles) and freight tonne miles are the most popular outputs. Table 2 summarises the use of environmental variables. Here electrification and capacity utilisation variables (such as average trip length) are popular variables. To summarise the studies we have examined, we suggest that even when different databases and techniques are adopted in order to measure technical efficiency of the railway sector and its determinants some common patterns emerge. First of all, the production technology is usually characterised by the combination of labour, energy and a fixed input, while the multi-product characteristic of the industry outcome is considered depending on the methodology applied. On the one hand, it may be represented by an aggregation of different freight and passenger service measures, especially if production functions are to be estimated; on the other hand, cost function estimations, DEA analysis and Distance Function estimations allow for the consideration of these variables separately. Finally, even when the quality of the services is reckoned as an important characteristic of the industry’s outcome, companies’ performances are never compared according to this feature because of the lack of reliable measures. On the contrary, several environmental factors are used to control for possible effects that are not under managers’ control. First, electrification rates are considered in order to control for energy cost saving services, showing a consistently positive correlation with efficiency scores across the studies. The same occurs in the presence of market signals such as incentives for managers’ strategies, which are identified by manager’s autonomy variables and by the financial independence of the companies. The efficiency scores computed with passenger miles as the industry outcome seem to be positively correlated to the passenger load and negatively correlated to the length of the trip, revealing trains travelling below passenger capacity; whereas the contrary occurs when train miles is the measure for the output. There appear to be no conclusive results from studies of the efficiency of freight services. Finally, regarding the results, BR appeared to have had a very important improvement in efficiency records especially since the second half of the 1980s, being one of the most efficient rail-systems in almost all the studies considering this period.
4. Data Our database covers the period 1994/95 to 1999/2000, and consists of a panel of yearly data for all 25 passenger franchisees from the year 1996/97 onwards, while BR data describe the industry’s behaviour in the two previous years. Tables 3 and 4 report the evolution of the industry’s performance as reflected by its main variables. The first two variables in Table 3 capture the amount of the services provided measured by the industry’s capacity availability, indicated by the variable Train Miles, and by the level of services actually consumed, which is measured by the variable Passenger Miles. Train miles
9
3 Other two interesting examples of comparative results are Loizides et al. (1995) which applies DEA and Stochastic Frontier Analysis to the estimation of the total factor productivity growth of the Greek Railway Organization; and, Cowie et al. (1996) which, on the one hand, applies DEA, COLS and two original approaches presenting a critical view on the conventional ones; and, on the other hand, compares their results with other works suggesting that, as a precise efficiency measure is not possible, these methodologies’ outcomes should be considered just as rough indices of performance.

represent capacity provision by the TOCs in support of their service provision requirements as franchisees. Passenger miles represent the TOCs’ success in attracting passengers. As it can be seen, both variables show a steady increase in the period under study. The sources for this information are BR’s Accounts and OPRAF’s Annual Reports. The second two variables in Table 3 capture the quality of the services provided. As this is considered to have been negatively affected by British railway privatisation it is important to include this in our analysis. We do this by constructing Punctuality and Safety indices. These are constructed by means of punctuality measures from BR and OPRAF and information about SPADs (Signals Passed at Danger), provided by the Health and Safety Executive, normalised by Train Miles.4 The higher the index value, the better the quality performance of the industry.5 The overall figures show that the industry has made a continuous improvement in the provision of safe services while there has been erratic performance regarding the punctuality figures following an initial improvement.6 Two groups of variables were used to determine the inputs of the industry in Table 4. First, Labour Costs and Other Operative Expenditures provide the total costs of the productive process. The figures, collected from BR and TOCs’ accounts, show that the mentioned increase in the services was provided with a 13% less in the total expenditures, achieved with an almost 20% of savings in Labour Costs and a decrease of more than 10% in Other Expenditures. Second, the number of employees and the total amount of locomotives, coaches and other units used in the production process provide physical measures of the inputs employed. The variable Employees is built from the companies’ accounts, whereas the series of ‘BR and Coaching Stock’ books provide information regarding the Rolling Stock. Both variables show a differentiated behaviour. While the latter doesn’t decrease, especially because of a slight increment registered after privatisation, the amount of employees by almost 20%, a similar proportion to the decrease in the labour cost. We also have information on a number of other variables which may be important determinants of costs and provide data for second stage analysis of efficiency scores and quality variables. We list these below (the data sources are in Appendix 1): Contract Length Remaining is the number of years remaining to the end of the franchise contract. This may be important because it affects the willingness of the TOCs to invest in cost reduction. Incentives is the amount of incentive payments obtained from (or paid to) the regulator. This rewards the provision of punctual and reliable services as well as for the supply of enough capacity as committed in the franchise contract.
4 We recognise the weaknesses of using SPAD data as an indicator of safety: in particular that they are only one aspect of safety on the network (deaths or accidents are other indicators) and that they may be the fault of Railtrack rather than the TOC. However they are available at the TOC level and are non-zero for every company in every year of our sample. 5 , while Punctuality Index = Percentage of trains arriving on time ⋅1000Safety Index = 1000 - 50 ⋅SPADs
Train miles.
10
6 The two other widely reported measures of quality are reliability and passengers in excess of capacity (PIXC). Reliability measures the percentage of scheduled trains arriving at their destinations. We do not use this index because it shows remarkably little variation over time or by TOC. Average reliability was 98.8 in 1993/4 and 98.8 in 1999/00. PIXC measures the amount of overcrowding on trains on the London commuter lines only and there is no data for the BR period. This ratio (of number of excess passengers divided by total passengers, averaged over the AM and PM peaks) increases from 2.07% to 3.6% between 1995/6 and 1999/00. All figures provided by the SRA.

Dummy variables characterise the type of services supplied by assigning to each company 1 or 0 to the presence of significant commuter, regional, and intercity traffic. Age represents information about the average age of the rolling stock, where age is calculated using the year built. Regional GVA per capita is gross value added per head for the counties in which the corresponding TOC operates. Preston Difference captures the difference between actual and forecast subsidies committed in winning bids. This uses the figures presented by Preston et al. (2000) assessing excessive subsidy commitments by the regulator in the franchise contract (ExcSubCbyR). In order to compute the Subsidies in Excess Index (SubExcIn), this variable is normalised by the Operative Expenditure of the year 1997, according to the following formula:
. A negative variable indicates a lower than predicted level of subsidy which implies a competitive bidding process and/or the prospect of competition for the franchise when it is renewed and intervening pressure on the TOC to perform financially.
OpEx/ExcSubCbyRSubExcIn i,1997ii =
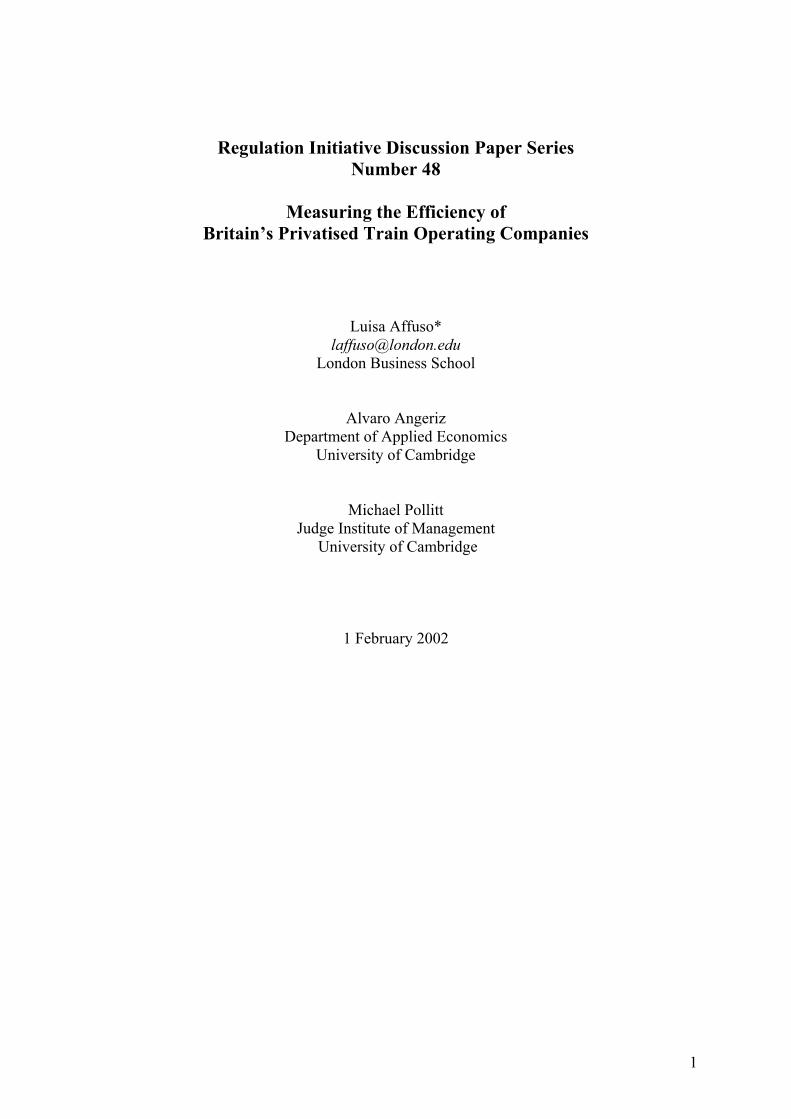
5. Methodology Following Coelli and Perelman (1999) we employ both DEA and input and output distance functions to calculate efficiency scores. We do this in order to provide 'methodology cross-checking' of efficiency scores using the non-parametric DEA technique and the parametric distance function technique. We use a data set consisting of the 25 train operating companies plus aggregated data for the whole industry. We have annual data from 1996-7 to 1999-00 for the 25 TOCs and 1994-95 to 1999-00 data for the whole industry. We pool this data to give a basic data set of 106 decision making units (DMUs) and use this sample to calculate efficiency scores. In pooling data over a six year period we are assuming that each TOC in every year can be compared. This is convenient because it allows us to increase the size of the comparator group from the reasonably small size of 25 within the DEA analysis. The implication of this is that we are assuming that there is no underlying technical progress in British train operation and that TOCs could have achieved their 1999/00 levels of operating efficiency in 1994/95 if they had been more ‘efficient’. This is not an unreasonable assumption given BR’s experience. Pollitt and Smith (2001) find that over the five years 1988/89 to 1992/93 BR experienced underlying productivity growth of –1% p.a and suggest that train operation exhibits near constant returns to scale. Given the long lead time on investment it is not unreasonable to assume that this situation might have continued to 1999/00. In calculating the efficiency scores in this way we are not separating out frontier shift effects (due to technical progress) and movements towards the frontier (due to catching-up) in our analysis. Thus changes in our efficiency scores from year to year include both of these effects. We note that a similar pooling approach is used by Coelli and Perelman (1999, p.333). Data envelopment analysis (following Farrell, 1957, and Fare and Lovell, 1978) involves using the actual data to identify an efficiency frontier and then measuring the distance of each DMU from this frontier. The methodology is illustrated in the Figure 1 (adapted from Coelli et al., 1998). The dots in Figure 1 represent DMUs plotted in input (x)-output (y) space. The unit R is the most technically efficient in terms of output per unit input. A frontier which assumes constant returns to scale (CRS) would be the ray passing through O and R. A frontier which assumes variable returns to scale (VRS) would use the bold VRS frontier defined by the line segments
11

joining actual firms. Considering an inefficient unit like P there are three ways one could measure the technical efficiency. First, one could use the ratio OP/OPOC or its equivalent APIC/AP to calculate the CRS DEA score. Second, one could use the ratio BP/BPOV to calulate the output oriented VRS DEA score, which measures the ratio by which unit costs could be reduced if output was optimised keeping input fixed. Third, one could calculate the ratio APIC/AP to calculate the input oriented VRS DEA score, which measures the ratio by which input could be reduced keeping output fixed. The input and output oriented DEA scores are not necessarily identical for VRS whereas they are under CRS. We calculate the technical efficiency scores using the Efficiency Measurement System (EMS) program by Holger Scheel7 and cross-checked with the DEAP program by Tim Coelli8 using combinations of our four outputs and four inputs. We follow Coelli and Perelman (1996 and 1999) in their use of parametric distance functions to derive the COLS efficiency scores. The basic input distance function models the efficiency score as:
ln DIi( )= α 0 + αm ⋅ ln ymi +12m =1
M
∑ ⋅ α mn ⋅ ln ymi ⋅ ln ynin=1
M
∑m=1
M
∑ + βk ⋅ ln xkik =1
K
∑ +
+12
⋅ βkl ⋅ ln xki ⋅ ln xli +l =1
K
∑k=1
K
∑ δ km ⋅ ln xki ⋅ ln ymim =1
M
∑k =1
K
∑ , i = 1, 2,..., N. 1( )
Where DIi is the efficiency score of the ith unit and is a function of K inputs and M outputs. Dividing through by one of inputs (denoted by subscript K) makes the function homogeneous of degree one. We do not include a time trend in (1) in order to maintain consistency with the DEA and to reflect the assumption that improvements in average efficiency over time are not a consequence of technological progress but of more efficient operation.
ln DIi xKi
= α0 + αm ⋅ lnymi +
12m=1
M
∑ ⋅ αmn ⋅ lnymi ⋅ln yni + βk ⋅ lnxki*
k=1
K
∑n=1
M
∑m=1
M
∑
+12
⋅ βkl ⋅ lnxki* ⋅ lnxli +
l =1
K
∑k=1
K
∑ δkm ⋅ ln xki* ⋅ ln ymi
m=1
M
∑k=1
K
∑ (2)
Where:
K
kk x
xx =*
Equation (2) may be rewritten as:
7 See EMS: Efficiency Measurement System User's Manual Version 1.3 2000-08-15, available at www.wiso.uni-dortmund.de/lsfg/or/scheel/ems
( ) )3()ln(),,,,(ln IiiKi
iki Dyx
xTLx −=− δβα
12
8 Version 2.1, currently available at http://www.une.edu.au/febl/EconStud/emet/deap.htm. See Coelli, Rao and Battese (1998) for details.

Equation (3) is estimated by OLS. The largest positive residual is then added to the intercept to get the COLS frontier. This residual is associated with the most efficient firm. Efficiency scores are then calculated as the exponent of the COLS residuals. Coelli and Perelman (1999) show that starting from equation (1) and dividing by one of the outputs instead of one of the inputs results in the estimation of:
( ) ( )4)ln(),,,,(ln OiiM
mMi Dxy
yTLy −=− δβα
Where -ln DOi is set equal to the error term and DOi is the output oriented distance function. The largest negative residual is then added to the intercept to give the COLS frontier. This residul again corresponds to the most efficient firm. The efficiency scores (greater than 1) are then recovered as the exponent of the COLS residuals. For ease of comparison we invert these scores so that they can be easily compared to the input oriented efficiency scores. Equation (1) represents the translog functional form for the distance function. The functional form is very flexible and the estimated parameters may not make much engineering sense. In our analysis we also restrict the estimated distance to be log linear in functional form. This implies that in equation (1) αmn=0, βkl=0 and δkm=0 for all mn, kl and km We also go on to test whether we can accept the restriction that the log linear functional form exhibits constant returns to scale. This implies homogeneity of degree -1 in inputs or in the input oriented case that the coefficients on the inputs sum to -1, i.e.:
α m = −1m =1
M
∑ We find that we accept this restriction for all the models we examine (however not for the output oriented case). We use four basic models based on our available outputs and inputs. These are listed in Table 5. In order to present easy to follow efficiency scores which take account of the possibility of both input reduction and output increase, different inputs and outputs and functional forms we attempt to produce composite measures of efficiency combining the above model specifications. For each model we calculate DEA scores using CRS and input and output oriented measures of VRS technical efficiency. In what follows we give the CRS score a double weight (to reflect the fact that it is actually two measures which are equal - input and output oriented) and add this to the two VRS measures. We then calculate a composite DEA efficiency score ADEA which is the average of the 16 efficiency measures. This is a crude way of simplifying our analysis in order to avoid over-reliance on one model specification. For the purposes of correlating safety and punctuality and efficiency we use an average of DEA scores based on the 8 efficiency scores for Model 2 and Model 4. The reason for this is to avoid the simultaneity that would arise if safety and punctuality were directly influencing both independent and dependent variables in the regression analysis.
13

We also calculate the COLS scores using input and output distance functions. For each of the four basic models in Table 5 we calculate an input oriented log linear score using CRS, an output oriented log linear score (not restricted to CRS), an input oriented translog score and an output oriented translog score. This gives 16 COLS scores which we average to give ACOLS. For the purposes of correlating safety and punctuality and efficiency we use an average of COLS scores based on the 8 efficiency scores for Model 2 and Model 4. ADEA and ACOLS allow us to analyse directly our first set of hypotheses about efficiency. We need to use regression analysis to analyse our second and third sets of hypotheses, utilising the data introduced in section 4. For simplicity, in the rest of this section we drop the DMU identifier for all variables but the efficiency score. In order to try to explain efficiency differences between TOCs we use the following Tobit regression (as the efficiency scores are censored at 1): Effi= f(cons, age_00, age2_00, Prestonperopex, dif0097gvapc, incentives_99, dintercities, deregionals, dcommuters, clrem_00) (5) Where: Effi= Efficiency score of TOC I in 2000 (either ADEA or ACOLS) cons=constant term age_00= average age of rolling stock in 2000 age2_00 = square of age_00 Prestonperopex = Preston difference (or excessive subsidy variable) dif0097gvapc = growth of regional value added per capita between 1997 and 2000 incentives_99 = incentive payments in 1999 dintercities = 1 for provider of intercity services, 0 otherwise deregionals = 1 for provider of regional services, 0 otherwise dcommuters = 1 for provider of commuter services, 0 otherwise clrem_00 = years of contract remaining in 2000 We next go on to analyse the relationship between efficiency, safety and punctuality. As we have just analysed efficiency as a function of environmental variables we cannot go on to analyse safety and punctuality as a function of those same variables and efficiency. We therefore settle for an examination of the hypothesis that safety and punctuality are correlated with efficiency. We do this by calculating Spearman rank correlation coefficients and testing whether the calculated coefficients are independent. We do this using statistical test described in Conover (1980, p.254). The rejection of this test suggests that there is a tendency for higher ranks of one of the variables to be associated with higher (or lower) ranks of the other variable. Each of the regressions is carried out separately for samples of the 25 TOCs in 2000. We also present results for the pooled TOCs for the four years 1996-97 to 1999-00. All regressions and statistical tests were estimated using STATA Version 7.09. 6. Results
14 9 STATA Version 7.0 by STATA Corporation, http://www.stata.com.

6.1 Privatisation and Efficiency Table 6 shows the ADEA and ACOLS efficiency scores by TOC by year. Appendix 2 reports the Model 1 estimated regression equations for reference. The ADEA and ACOLS scores are strongly correlated, with Pearson's and Spearman's correlation coefficient of 0.85. The evidence is that there is a steady and substantial improvement in efficiency from 1994-95 through to 1999-00. This result holds whether looking at the performance of average of the individual TOCs (Figure 2) or the performance of the aggregate of the whole industry (Figure 3). A test of the hypothesis that the average efficiency of the TOCs in 1999-00 is the same as in 1995-96 is rejected at the 1% level of significance. The individual efficiency measures within ADEA and ACOLS generally indicate steady and significant efficiency improvement. This is more true of scores based on Model 2 and Model 4 which exclude punctuality and safety and models which assume CRS. Figure 4 indicates limited evidence (ADEA standard deviation falls from 14 to 13 over four years) that restructuring has reduced dispersion of efficiency scores. This has come about because the minimum efficiency score has been rising, but the dispersion is remarkably constant. 6.2 Explaining TOC Efficiency Table 7 reports Tobit regressions which attempt to identify possible determinants of efficiency differences between the TOCs using the ADEAc5q12 and ACOLSc5q12 average scores. Age and Age squared, Preston's subsidy variable and the commuter dummy variable are significant explanatory variables (at the 5% level) with non-trivial parameter values. Age is not significant in the single year regressions but appears to be so in the pooled regressions. The Preston excessive subsidy variable is very significant (at 1%) and negative. This suggests that the more competitive the bid for the franchise (the less subsidy the TOC was prepared to accept) the better for efficiency. This is in line with the studies noted in section 3. Commuter lines seem to be at a particular disadvantage in terms of efficiency with significantly negative parameter values in all the regressions. In each case the regression analysis explains a large measure of the variation in efficiency scores. Interestingly the parameter on incentive payments (which might be expected to be positively correlated with efficiency) has the wrong sign and is not significant. 6.3 Safety, punctuality and efficiency Table 8 reports the correlations between safety, punctuality and efficiency. The full 4-year dataset shows that the null of no correlation can be rejected at 5% for the relationship between punctuality and safety – this suggests there is a negative trade-off between more punctual and safer trains. This would seem to confirm recent experience with the introduction of many more speed restrictions following the Hatfield Crash. Safety seems to be significantly postively related to efficiency for the full sample for the DEA measures. Punctuality is negatively correlated with efficiency but this is only significant at 11% for the DEA measures. The 2000 data confirms the negative punctuality and safety relationship but efficiency is not correlated with safety or punctuality. Overall there would seem to be no support for the claim that higher economic efficiency is associated with less safety and only very weak evidence that punctuality and efficiency are negatively correlated. 7. Conclusions This paper has attempted to analyse the efficiency record of the Britain’s Train Operating Companies since their privatisation using both DEA and COLS methodologies and second
15

stage analysis of the efficiency scores. We investigated three sets of hypotheses concerning efficiency. On the efficiency effects of privatisation we observe that privatisation has been associated with a significant improvement in average and whole industry TOC efficiency. This improvement in efficiency is largely driven by the large rise in output over the period and the impressive reduction in real operating costs. On the determinants of efficiency we observe that there is a trend improvement in efficiency but differences in efficiency between TOCs are associated with the age of the rolling stock, the type of network operated and the degree of competition for the franchise. On the relationship between safety, punctuality and efficiency we observe that differences in safety and punctuality appear to be weakly associated with differences in efficiency. In particular more economically efficient TOCs are safer. However safer TOCs are less punctual. While the rail crash of October 2000 and the recent placing into administration of the network operator have dented public confidence in the British railway system, the observed effects of privatisation are that there have been significant improvements in efficiency (taking safety and punctuality into account) and that the more competitive franchises are associated with higher economic efficiency, which in turn are safer. Although this positive assessment can be made we also need to point out that there is still room for considerable improvement in efficiency in absolute terms but that this improvement is constrained by individual TOCs network characteristics, capacity constraints and the age of available rolling stock. References Affuso, L., Masson , J. and Newbery, D. (2000), Comparing Investment on New Transport
Infrastructure: Roads vs. Railways? DAE Working Paper, No.0021. University of Cambridge.
Affuso, L. and Newbery, D.M. (2000), Investment, Reprocurement, and Franchise Contract Length in the British Railway Industry, Centre for Economic and Policy Research (CEPR) Discussion Paper, 2619.
Andrikopoulos, A. and Loizides, J. (1998), Cost Structure and Productivity Growth in
European Railway Systems”. Applied Economics, Vol. 30, 1625-39. Barnekov, C. and Kleit, A. (1990), “The Efficiency Effects of Railroad Deregulation in the
United States”, International Journal of Transport Economics, Vol. 17, No. 1, 21-36.
British Railways Board (1994/95), Annual Report and Accounts. British Railways Board (1995/96). Annual Report and Accounts.
16

British Railways Locomotives and Coaching Stock (1994 - 2000), Platform 5 Publishing Ltd., Sheffield, UK.
Cantos P.; Pastor, J. and Serrano, L (1999), “Productivity, Efficiency and Technical Change
in the European Railways: A Non-parametric Approach”. Transportation. Vol. 26, No. 4, 337-57.
Cantos, P. and Maudos, J. (2000), “Efficiency, Technical Change and Productivity in The
European Rail Sector: A Stochastic Frontier Approach”. International Journal of Transport Economics. Vol. 27 – No. 1, 55-76.
Caves, D. and Christensen, L. (1980, “The Relative Efficiency of Public and Private Firms in
a Competitive Environment: The Case of Canadian Railroads”. Journal of Political Economy, Vol. 88, No. 5, 958-76.
Caves, D.; Christensen, L. and Swanson, J. (1980), “Productivity in U.S. Railroads, 1955-74”.
Bell Journal of Economics, 11, 166-81. Caves, D.; Christensen, L. and Swanson, J. (1981a), “Economic Performance in Regulated
and Unregulated Environments: A Comparison of U.S. and Canadian Railroads”. The Quarterly Journal of Economics. Vol. 96, No. 4, 559-81.
Caves, D.; Christensen, L. and Swanson, J. (1981b), “Productivity Growth, Scale Economies
and Capacity Utilisation in U.S. Railroads, 1955-74”. American Economic Review, Vol. 71 – No. 5, 994-1002.
Christopoulos, D.; Loizides, J. and Tisonas, E. (2000), “Measuring Input-Specific Technical
Inefficiency in European Railways: A Panel Data Approach”. International Journal of Transport Economics, Vol. 27 – No. 2, 147-71.
Coelli, T. and Perelman, S. (1996), Efficiency measurement, multiple-output technologies and
distance Functions: with application to European Railways, CREPP Working Paper 96/05, University of Liege.
Coelli, T. and Perelman, S. (1999), “Theory and Methodology: A Comparison of Parametric
and Non-Parametric Distance Functions: With Application to European Railways”. European Journal of Operational Research, Vol. 117, 326-39.
Coelli, T.J., Prasada Rao, D.S., and Battese, G.E. (1998), An Introduction to Efficiency and
Productivity Analysis, Kluwer Academic Publishers, Boston. Conover, W.J. (1980), Practical Non-parametric Statistics, 2nd Edition, New York: John
Wiley. Cowie, J. (1999), “The Technical Efficiency of Public and Private Ownership in the Rail
Industry. The Case of Swiss Private Railways”. Journal of Transport Economics and Policy, Vol. 33, Part 3, 241-52.
Cowie, J. and Riddington, G. (1996), “Measuring the Efficiency of European Railways”.
Applied Economics, Vol. 28, 1027-35.
17

De Borger, B. (1991), “Hedonic Versus Homogeneous Output Specifications of Railroad Technology: Belgian Railroads 1950-1986”. Transport Research A. Vol 25A, No. 4, 227-38.
Department of Transport, Local Government and the Regions (2000), Ten Year Plan for
Transport, 2010, London: DETR.
Deprins, D. and Simar L. (1989), “Estimating Technical Inefficiencies With Correction For Environmental Conditions. With an application to railway companies”. Annals of Public and Co-operative Economics, 81-101.
Dunwoody,G.(2001). Safety and the Future of the Railways'. Paper presented at the
Conference 'Safe Growth of the Railways, The Waterfront Conference Company, London.
Fare, R. and K.Lovell, (1978), 'Measuring the Technical Efficiency of Production', Journal of
Economic Theory, Vol.19 (October), pp.150-162. Farrell, M.J. (1957), 'The Measurement of Productive Efficiency', Journal of the Royal
Statistical Society, Series A, Vol.120, pp.253-281. Filippini, M.; Maggi, R. (1992), “The Cost Structure of the Swiss Private Railways”.
International Journal of Transport Economic,. Vol. 19, No. 3, 307-327. Friedlaender, A.; Berndt, E.; Shaw-Er Wang Chiang, J.; Showalter, M.; Vellturo, C. (1993),
“Rail Costs and Capital Adjustments in a Quasi-Regulated Environment”. Journal of Transport Economics and Policy, 27, 131-52.
Gathon, H. and Perelman, S. (1989), “Etude Comparative des Performances des Societes de
Chemins de Fer”. Annals of Public and Co-operative Economy, Vol. 60, No. 1. 61-80.
Humphrey, D. (2001), Rolling Stock Procurement: Safety and Efficiency', Paper presented at the Conference 'Safe Growth of the Railway, The Waterfront Conference Company, London.
Jha, R. and Singh, S.P. (1994), Inter-Temporal and Cross-Section Variations in Technical
Efficiency in the Indian Railways”. International Journal of Transport Economics, Vol. 21; No. 1, 57-73.
Kumbhakar, S. (1988), “On the Estimation of Technical and Allocative Inefficiency Using
Frontier Functions: The Case of U.S. Class I Railroads”. International Economic Review. Vol. 29, No. 4, 727-43.
Loizides, I. and Giahalis, B. (1995), “The Performance of Public Enterprises: A Case of Study
of The Greek Railway Organisation”. International Journal of Transport Economics. Vol. 23, No. 3. 283-306.
Megginson, W.L. and Netter, J.M. (2001), ‘From State to Market: A Survey of Empirical
Studies on Privatisation’, Journal of Economic Literature, Vol.39, No.2, pp.321-389.
18

Obeng, K. and Sakano,R. (2000), “The Effects of Operating and Capital Subsidies on Total Factor Productivity: A Decomposition Approach”. Southern Economic Journal, 67(2), 381-97.
OPRAF (1996/97 – 1998/99), Annual Reports, London: Office of Passenger Rail Franchising. Oum, T., and Tretheway, M. and Waters, W. (1992), “Concepts, Methods and Purposes of
Productivity Measurement in Transportation”. Transportation Research A. Vol. 26 A. No. 6, 493-505.
Oum, T., and Waters II, W. and Yu, Ch. (1999), “A Survey of Productivity and Efficiency
Measurement in Rail Transport”. Journal of Transport Economics and Policy. Vol. 33, Part 1, 9-42.
Oum, T. and Yu, Ch. (1994), “Economic Efficiency of Railways and Implications for Public
Policy. A Comparative Study of the OECD Countries’ Railways”. Journal of Transport Economics and Policy, 28, 121-38.
Perelman, S. and Pestieau, P. (1988), “Technical Performance in Public Enterprises. A
comparative Study of Railways and Postal Services”. European Economic Review, Vol. 32, 432-441.
Pollitt, M.G. and Smith, A.J. (2001), The Restructuring and Privatisation of British Rail: was
it really that bad?, University of Cambridge, Department of Applied Economics Working Paper, No.0118.
Preston, J., Whelan, G.; Nash, C. and Wardman, M. (2000), “The Franchising of Passenger
Rail Services in Britain”. International Review of Applied Economics,Vol. 14, No. 1, 99-112.
SRA (2000/01), Annual Report, London: Strategic Rail Authority. SSRA (1999/00), Annual Report. London: Shadow Strategic Rail Authority. Tretheway, M., and Waters, W. and Fok, A. (1997), “The Total Factor Productivity of the
Canadian Railways, 1956-91”. Journal of Transport Economics and Policy, 93-113.
Tsionas, E., and Christopoulos, D. (1999), “Determinants of Technical Inefficiency in
European Railways: Simultaneous Estimation of Firm-Specific and Time-Varying Inefficiency”. Konjunkturpolitik, 45. Jg. H. 3, 240-56.
Thompson, L. and Fraser, J. (1993), “World Bank Survey of Railway Performance”.
Developing Railways, 5-13. Thompson, L., Wood, W., and Lures, F.(1991), “World Railway Performance”. Developing
Railways, 8-16. Wilson, W. (1997), “Cost Savings and Productivity in the Railroad Industry”. Journal of
Regulatory Economics, Vol. 11, 21-40.
19

Table 1. Production Technology Frequency of the studies using each factor (25 studies)10
Inputs Outputs Labour 25 Passenger km or miles 12 Energy 21 Freight tonnes kms 13 Materials and external services 11 Pass.+Freight kms. 5 Fixed stock (includes land, ways and structures)
10
Pass.+Freight-train kms (or miles) added or weighted
5
Equipment coaches and wagons 14 Pass.+Freight-wagon kms 1 Length of the network 6 Pass-train kms 2 Length of electrified network 1 Freight-train kms 2 Length of non-electrified network 1 Avg length of freight haul 3 Capital some include railstocks 6 Avg. length of passenger miles 3 Population density 1 % Coal and agricol. Tonnes 1
20 10 This table summarizes the work presented in 25 different articles.

Table 2. Production Technology. Frequency of the studies using each environmental variable (25 studies)
Exogenous effects % Electrified track 7 Degree of financial independency 3 Degree of management autonomy 3 Pass. Density: Pass.kms/total traffic 1 Pass. Train Density: Pass-train kms/total traffic 2 Freight Density 2 Freight Train Density: Freight-train kms/total 1 Pass. Density: Pass.kms/network size 2 Freight Density: freight kms/network size 2 Avg. length of freight haul 7 Avg. length of trip 7 Avg freight load per train 7 Avg Pass. load per train 7 % unit-train traffic 1 % of traffic carried by more than one carrier. 1 Density of network lines per km2 2 Mean number of tracks per line 2 Network size 3 Network structure distance between stations 1 Dummies for narrow gauges 1 Time variables 9 Regulatory Dummy 1
21

Table 3. Outputs of Passenger Rail Services in the Britain
Train Miles
Passenger Miles
Punctuality Index
Safety Index
(in millions) (in millions) 1995 222 17806 89600 869 1996 231 18154 89500 869 1997 229 19861 92500 889 1998 237 21291 92500 882 1999 249 22351 91500 903 2000 257 23914 91900 914 Table 4. Inputs of Passenger Rail Services in the Britain
Labour cost Other Expenditures
Employees Rolling Stock
(£m 1997 prices) (£m 1997 prices)
(no of units)
1995 1015 4260 46880 10791 1996 1011 4008 45689 10265 1997 905 3875 43935 10207 1998 864 3900 40229 10585 1999 841 3890 39139 10871 2000 827 3767 38705 11062
22
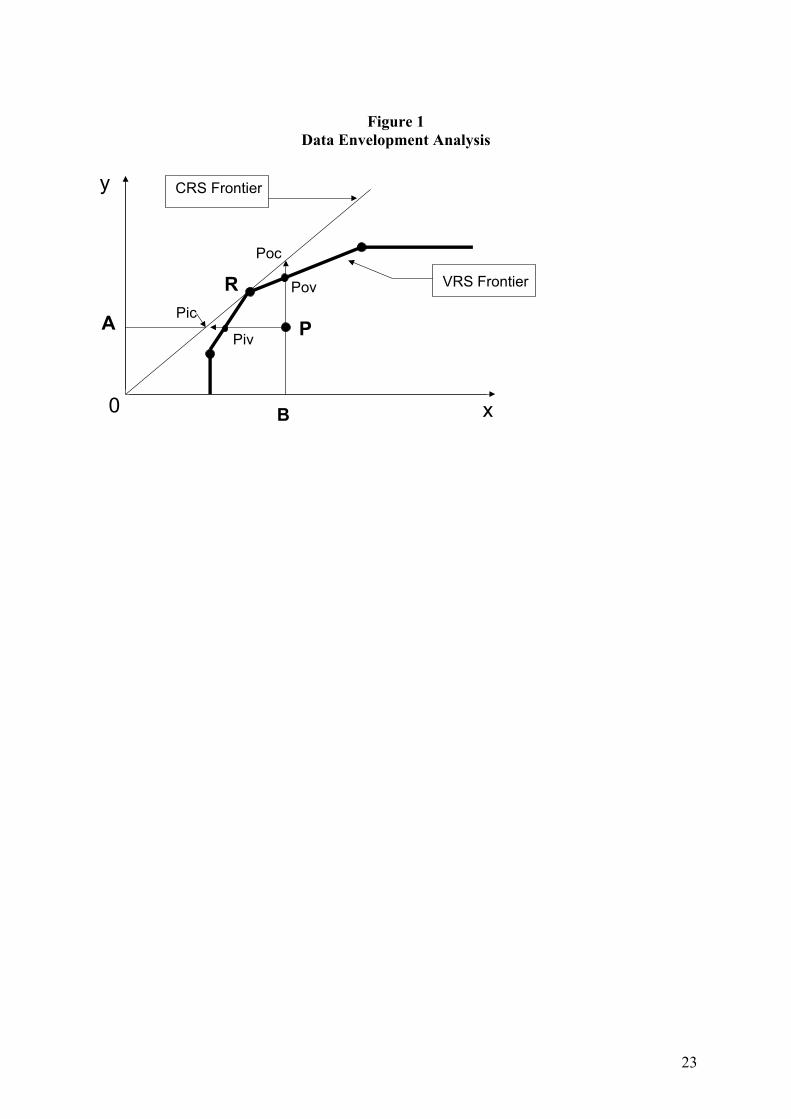
Figure 1
Data Envelopment Analysis
A
0
y
x
VRS Frontier
Pic
CRS Frontier
Piv P
R Pov
Poc
B
23

Table 5 - Basic Models Used Model 1 Model 2 Model 3 Model 4
Inputslabour expenditure X XOther expenditure X XEmployees X XTotal rolling stocks X XOutputsPM X X X XTM X X X XPunctuality X XSafety/TM X X
24

Table 6 Efficiency Scores
ADEA ACOLSANGLIA RAILWAYS 1997 0.668 0.686
1998 0.681 0.7011999 0.724 0.7262000 0.819 0.794
CARDIFF RAILWAY 1997 0.720 0.6661998 0.757 0.6751999 0.672 0.6182000 0.687 0.649
CENTRAL TRAINS 1997 0.786 0.6921998 0.827 0.7281999 0.879 0.7462000 0.947 0.816
CHILTERN RAILWAYS 1997 0.981 0.9141998 0.989 0.9151999 0.992 0.9402000 0.971 0.932
CONNEX SOUTH CENTRAL 1997 0.658 0.6401998 0.700 0.6671999 0.771 0.7182000 0.829 0.756
CONNEX SOUTH EASTERN 1997 0.642 0.6181998 0.674 0.6331999 0.706 0.6482000 0.758 0.683
CROSSCOUNTRY TRAINS 1997 0.961 0.7651998 0.990 0.7951999 0.993 0.8132000 1.000 0.776
GATWICK EXPRESS 1997 0.505 0.5881998 0.505 0.5791999 0.551 0.6122000 0.563 0.634
GREAT EASTERN 1997 0.710 0.6751998 0.760 0.6951999 0.793 0.7272000 0.866 0.775
25

Table 6 Efficiency Scores (cont)
ADEA ACOLSGREAT NORTH EASTERN 1997 0.850 0.674
1998 0.914 0.7011999 0.883 0.6822000 1.000 0.755
GREAT WESTERN 1997 0.653 0.5981998 0.676 0.6361999 0.720 0.6252000 0.765 0.637
ISLAND LINE 1997 0.860 0.6691998 0.897 0.6131999 0.926 0.6992000 0.928 0.722
LTS RAIL 1997 0.585 0.6401998 0.662 0.6741999 0.717 0.7052000 0.723 0.711
MERSEYRAIL ELECTRICS 1997 0.495 0.5671998 0.503 0.5761999 0.540 0.5832000 0.545 0.576
MIDLAND MAINLINE 1997 0.640 0.6161998 0.666 0.6471999 0.762 0.7142000 0.976 0.877
NORTH WESTERN TRAINS 1997 0.673 0.6181998 0.705 0.6411999 0.829 0.7142000 0.871 0.748
NORTHERN SPIRIT* 1997 0.851 0.7161998 0.901 0.7541999 0.934 0.7702000 0.963 0.803
SCOTRAIL 1997 0.695 0.6301998 0.775 0.6651999 0.795 0.6832000 0.841 0.716
26

Table 6 Efficiency Scores (cont)
ADEA ACOLSSILVERLINK 1997 0.670 0.686
1998 0.718 0.7211999 0.776 0.7572000 0.834 0.804
SOUTH WEST TRAINS 1997 0.798 0.7271998 0.816 0.7521999 0.818 0.7512000 0.849 0.780
THAMES TRAINS 1997 0.879 0.8301998 0.905 0.8391999 0.962 0.8832000 1.000 0.926
THAMESLINK 1997 0.975 0.8731998 0.985 0.9031999 1.000 0.9262000 0.922 0.858
WALES & WEST 1997 0.954 0.8311998 1.000 0.8641999 0.996 0.8602000 1.000 0.876
WEST ANGLIA GREAT NORTHERN 1997 0.733 0.7151998 0.788 0.7421999 0.835 0.7732000 0.864 0.790
WEST COAST TRAINS 1997 0.715 0.6061998 0.813 0.6531999 0.821 0.6642000 0.900 0.699
ADEA ACOLSTOTAL INDUSTRY 1995 0.698 0.622
1996 0.747 0.6581997 0.780 0.6791998 0.813 0.7121999 0.835 0.7262000 0.871 0.754
27

Figure 2 Privatisation and Efficiency: Average Efficiency
020406080
100
BR 1994/5 BR 1995/6 Average
1996/7
Average
1997/8
Average
1998/9
Average
1999/00
Effic
ienc
y sc
ores
ADEA ACOLS
28

Figure 3: Privatisation and Efficiency: Whole Industry
0
20
40
60
80
100
BR 1994/5 BR 1995/6 Industry
1996/7
Industry
1997/8
Industry
1998/9
Industry
1999/00
Effic
ienc
y sc
ores
ADEA ACOLS
29

Figure 4: Privatisation and Efficiency: Dispersion of Efficiency
Restructuring and Dispersion of Efficiency Scores (ADEA)
40
50
60
70
80
90
100
1996 1997 1998 1999 2000 2001
Effic
ienc
y Sc
ores
ANGLIA RAILW AYS CARDIFF RAILW AY CENTRAL TRAINS
CHILTERN RAILW AYS CONNEX SOUTH CENTRAL CONNEX SOUTH EASTERN
CROSSCOUNTRY TRAINS GATW ICK EXPRESS GREAT EASTERN
GREAT NORTH EASTERN RAILW AY GREAT W ESTERN ISLAND LINE
LTS RAIL M ERSEYRAIL ELECTRICS M IDLAND M AINLINE
NORTH W ESTERN TRAINS NORTHERN SPIRIT* SCOTRAIL
SILVERLINK SOUTH W EST TRAINS THAM ES TRAINS
THAM ESLINK W ALES & W EST W EST ANGLIA GREAT NORTHERN
W EST COAST TRAINS
30
Table 7: Explaining TOC Efficiency: Tobit Regression Analysis
100 DMUs 25 DMUsADEAc5q12 ACOLSc5q12 ADEAc5q12 ACOLSc5q12
Coef. t Coef. t Coef. t Coef. tAge -0.0435 -3.69*** -0.0400 -4.90*** -0.0389 -1.10 -0.0296 -1.27Age2 0.0009 2.55** 0.0009 3.80*** 0.0007 0.63 0.0006 0.81Excessive subsidy -0.0168 -4.88*** -0.0178 -7.56*** -0.0192 -2.46** -0.0173 -3.50***GVA per capita 0.0000 0.87 0.0000 4.18*** 0.0000 0.33 0.0000 2.34**Incentives -0.0002 -1.01 -0.0001 -1.23 -0.0005 -0.97 -0.0004 -1.06Dummy for intercities -0.0184 -0.48 -0.0572 -2.17** -0.0391 -0.51 -0.0702 -1.43Dummy for regionals 0.0363 1.27 0.0031 0.15 0.0694 1.03 0.0242 0.54Dummy for commuters -0.1304 -3.52*** -0.0909 -3.63*** -0.1640 -2.13** -0.1086 -2.27**Contract length remain 0.0000 -3.23*** 0.0000 -4.50** 0.0000 -0.71 0.0000 -1.76*Constant 1.4366 6.53*** 0.9863 6.52*** 1.8340 2.95*** 1.1179 3.03***
LR chi2(9) 62*** LR chi2(9) 94*** LR chi2(9) 14.8* LR chi2(9) 21.1** *** represents variables significative with a 1 % significance level. ** represents variables significative with a 5 % significance level. * represents variables significative with a 10 % significance level.
31

Table 8: Safety, Punctuality and Efficiency
Spearman coefficients Test of independence of the
All the years Pr > | t |
PunctualitySafety ADEAC5Q12ACOLSC5Q12 Punctuality Safety ADEAC5Q12ACOLSC5QPunctuality 1 Punctuality 0.00Safety -0.19 1 Safety 0.05 0.00ADEAC5Q12 -0.16 0.21 1 ADEAC5Q12 0.11 0.03 0.00ACOLSC5Q12-0.13 0.04 0.89 1 ACOLSC5Q12 0.21 0.69 0.00 0.00
Year 2000 Pr > | t |
PunctualitySafety ADEAC5Q12ACOLSC5Q12 Punctuality Safety ADEAC5Q12ACOLSC5QPunctuality 1.00 Punctuality 0.00Safety -0.45 1.00 Safety 0.02 0.00ADEAC5Q12 0.00 0.24 1.00 ADEAC5Q12 0.99 0.25 0.00ACOLSC5Q120.11 0.02 0.77 1.00 ACOLSC5Q12 0.60 0.93 0.00 0.00
32

Appendix 1: Data Sources
Train Miles OPRAF and SRA Annual Reports (1996/97 - 1999/2000).
BR Annual Reports (1994/95 - 1995/96) Passenger Miles OPRAF and SRA Annual Reports (1996/97 - 1999/2000).
BR Annual Reports (1994/95 - 1995/96) Punctuality OPRAF and SRA Annual Reports (1996/97 - 1999/2000).
BR Annual Reports (1994/95 - 1995/96) SPADs - Safety Health and Safety Executive (April 2000). SPAD Report. Labour Cost British Railways and Train Operating Companies Accounts
(1994/95 - 1999/2000) Operative Expenditures British Railways and Train Operating Companies Accounts
(1994/95 - 1999/2000) Employees British Railways and Train Operating Companies Accounts
(1994/95 - 1999/2000) Rolling Stock British Railways Locomotives and Coaching Stock (1994 -
2000). Contract Length Remaining
OPRAF and SRA Annual Reports (1996/97 - 1999/2000).
Incentives OPRAF and SRA Annual Reports (1996/97 - 1999/2000). Service supplied Expert Survey. Age British Railways Locomotives and Coaching Stock (1994 -
2000). Regional GVA per capita Cambridge Econometrics Consultants. Excessive subsidy Preston et al. (2000).
33

Appendix 2: COLS Distance Functions for Model 1
I N P U T O R I E N T ED
O U T P U T O R I E N T EDLoglinear function -
CRSTranslogfunction
Loglinearfunction
Translogfunction
Dep. Var. log(Distance)
Dep. Var. log(Distance)
Dep. Var. log(Distance)
Dep. Var. log(Distance)Coef. t Coef. t Coef. t Coef. t
ltm -0.48977 -10.94 ltm 2.6183 0.16 ltm -0.0083858 -0.72 ltm 1.4238 0.96lpm -1.5368 -39.25 lpm 1.3213 0.10 lpm 0.0372284 3.69 lpm -1.3667 -1.14lpun -0.17937 -1.32 lpunc 247.0257 1.23 lpunc 0.9150594 34.07 lpunc -22.0261 -4.57lsaf 0.13236 0.97 lsaf -12.0603 -0.12 lsaf 0.056098 2.35 lsaf 22.9690 5.65
ltm2 -1.0334 -4.71 ltm2 -0.0462 -0.79lpm2 -0.6565 -4.05 lpm2 1.5342 7.80lpunc2 -22.7605 -1.40 lpunc2 2.4579 6.43lsaf2 -0.3119 -0.20 lsaf2 0.6211 4.58ltmpm 1.6096 4.38 lpmltm -0.0208 -0.27ltmpunc -3.6625 -1.34 lpuncltm -0.6539 -3.82ltmsaf 4.5466 2.83 ltmlsaf 0.7672 4.48lpmpunc 1.3879 0.64 lpmlpunc -2.6039 -5.50lpmsaf -2.2710 -1.86 lpmlsaf -0.3513 -1.97lpuncsaf 3.5396 0.19 lpunclsaf -1.6579 -8.25
lothex 0.977466 11.83 lothex 16.1226 0.63 lothex -0.0163669 -0.74 lothex 1.5178 0.57llabc 0.022534 0.27 llabc -15.1226 -1.49 llabc -0.0121708 -0.85 llabc -0.6800 -0.50
lothex2 -0.5577 -1.46 lothex2 -0.3940 -2.49llabc2 -0.5577 -1.46 llabc2 0.1113 1.77lothexllabc
1.1153 1.46 lothexllabc
0.0069 0.10lothexltm -0.7331 -0.94 lothexltm 0.0834 0.92lothexlpm
0.6257 1.07 lothexlpm
-0.2280 -2.93lothexlpunc
-0.7437 -0.19 lothexlpunc
0.7597 2.57lothexlsaf -3.3214 -1.50 lothexlsaf -1.0711 -3.76llabcltm 0.7331 0.94 llabcltm 0.0353 0.53llabclpm
-0.6257 -1.07 llabclpm
0.0944 1.97llabclpunc
0.7437 0.19 llabclpunc
-0.0849 -0.54llabclsaf 3.3214 1.50 llabclsaf 0.1440 0.92
_cons -6.5633 -9.49 _cons -1396.1300 -1.06 _cons -10.72553 -32.88 _cons 40.4760 1.68AdjRsquared
0.8937 AdjRsquared
0.99 AdjRsquared
0.999 AdjRsquared
0.999F(4,101) 221 *** F(20,85) 450*** F(3,102) 45777*** F(20,85) 28867***
34