regresi linear sederhana pertemuan 01 matakuliah: i0174 – analisis regresi tahun: ganjil 2007/2008
TRANSCRIPT

Regresi Linear SederhanaPertemuan 01
Matakuliah : I0174 – Analisis RegresiTahun : Ganjil 2007/2008
Bina Nusantara
Regresi Linier Sederhana
Simple Linear Regression
Bina Nusantara
Materi• Types of Regression Models• Determining the Simple Linear Regression
Equation• Measures of Variation• Assumptions of Regression and Correlation• Residual Analysis • Measuring Autocorrelation• Inferences about the Slope
Bina Nusantara
Chapter Topics• Correlation - Measuring the Strength of the
Association• Estimation of Mean Values and Prediction of
Individual Values• Pitfalls in Regression and Ethical Issues
(continued)
Bina Nusantara
Purpose of Regression Analysis• Regression Analysis is Used Primarily to Model
Causality and Provide Prediction– Predict the values of a dependent (response) variable
based on values of at least one independent (explanatory) variable
– Explain the effect of the independent variables on the dependent variable
Bina Nusantara
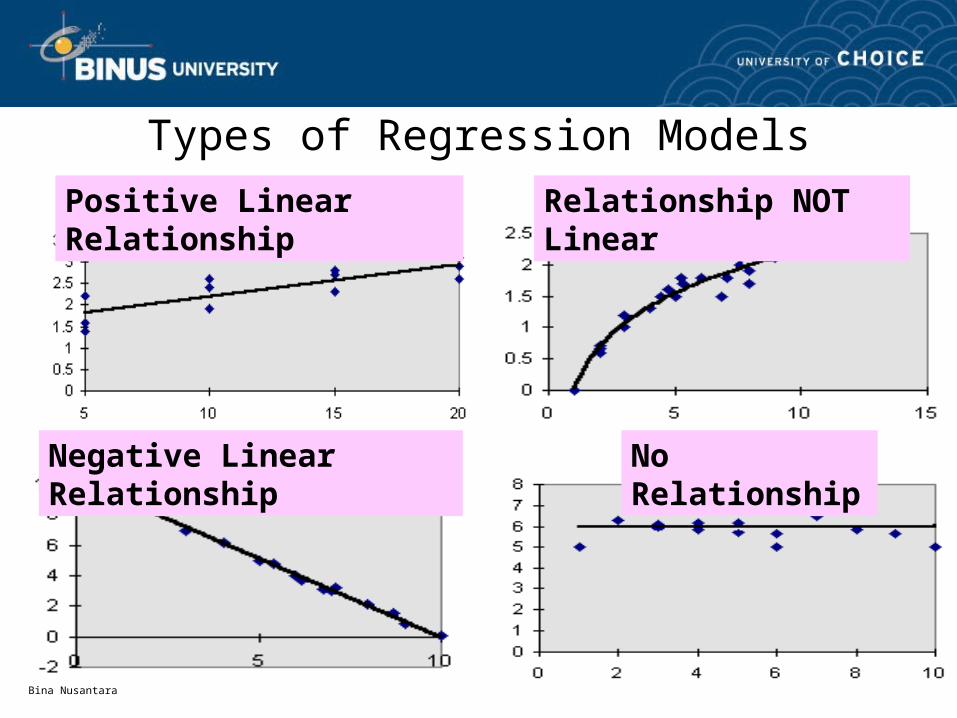
Types of Regression ModelsPositive Linear Relationship
Negative Linear Relationship
Relationship NOT Linear
No Relationship
Bina Nusantara
Simple Linear Regression Model
• Relationship between Variables is Described by a Linear Function
• The Change of One Variable Causes the Other Variable to Change
• A Dependency of One Variable on the Other
Bina Nusantara
PopulationRegressionLine (Conditional Mean)
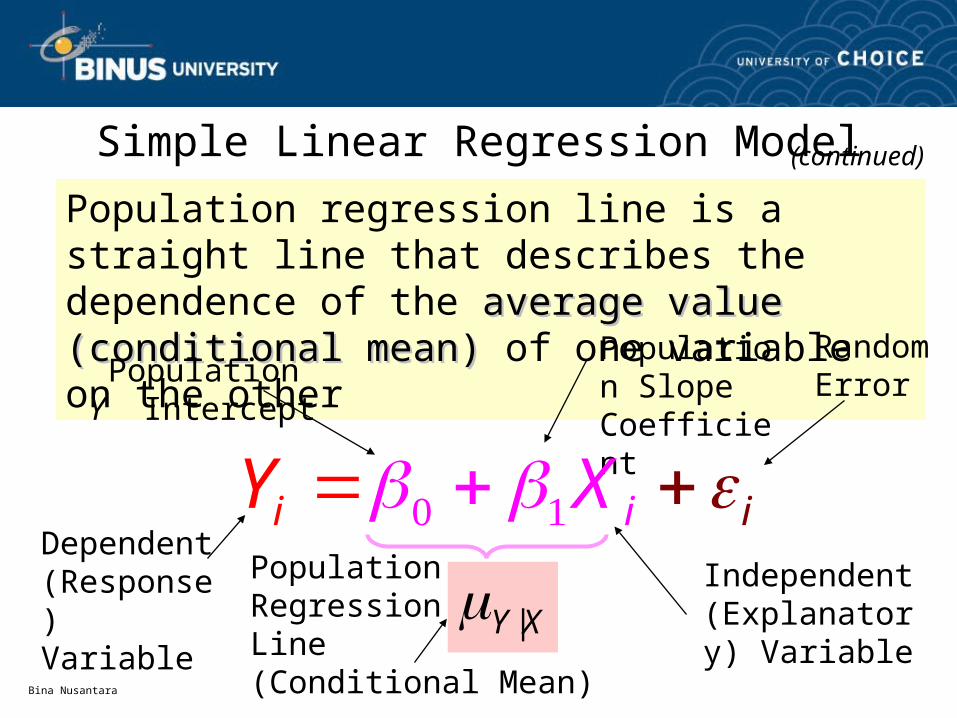
Simple Linear Regression Model
Population regression line is a straight line that describes the dependence of the average value (conditional mean)average value (conditional mean) of one variable on the other
Population Y Intercept
Population SlopeCoefficient
Random Error
Dependent (Response) Variable
Independent (Explanatory) Variable
ii iY X
|Y X
(continued)
Bina Nusantara
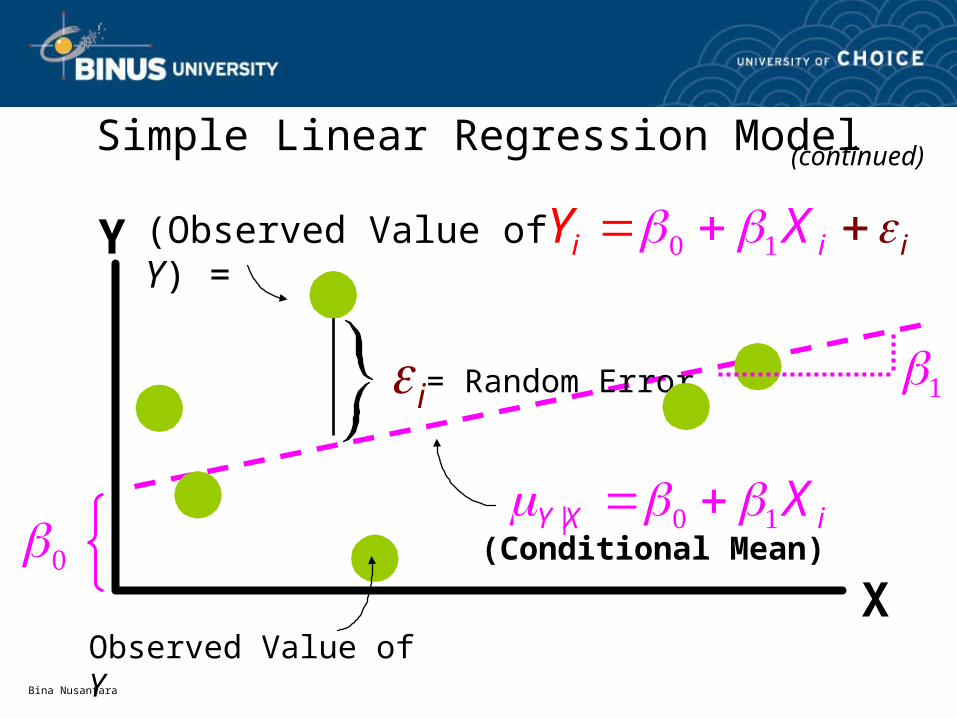
Simple Linear Regression Model(continued)
ii iY X
= Random Error
Y
X
(Observed Value of Y) =
Observed Value of Y
|Y X iX
i
(Conditional Mean)
Bina Nusantara
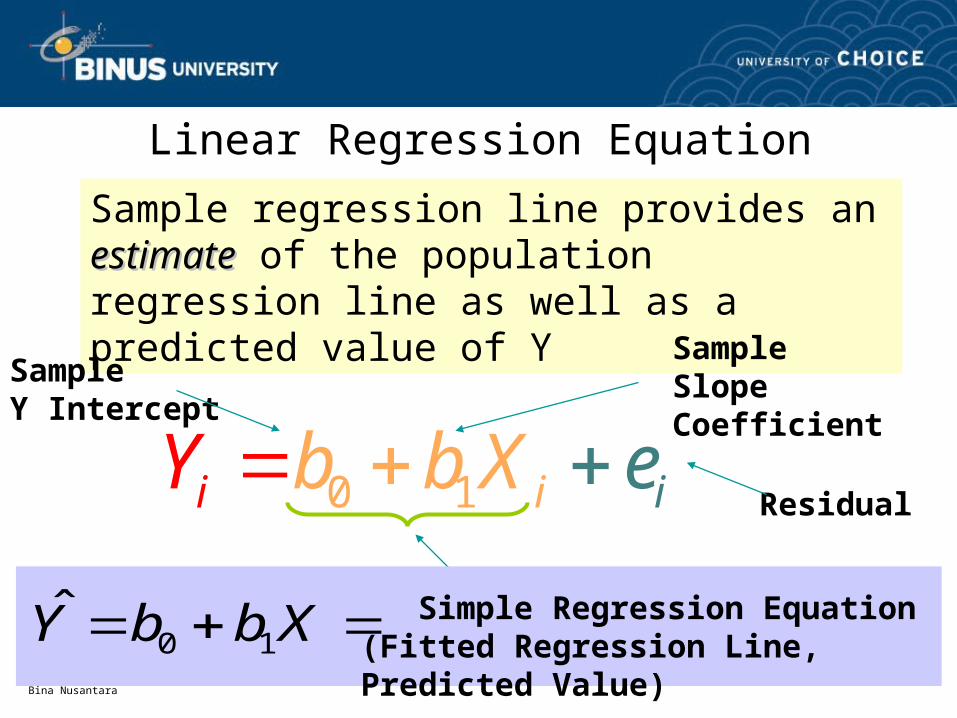
Sample regression line provides an estimateestimate of the population regression line as well as a predicted value of Y
Linear Regression Equation
Sample Y Intercept
SampleSlopeCoefficient
Residual0 1i iib bY X e
0 1Y b b X Simple Regression Equation (Fitted Regression Line, Predicted Value)
Bina Nusantara
Linear Regression Equation
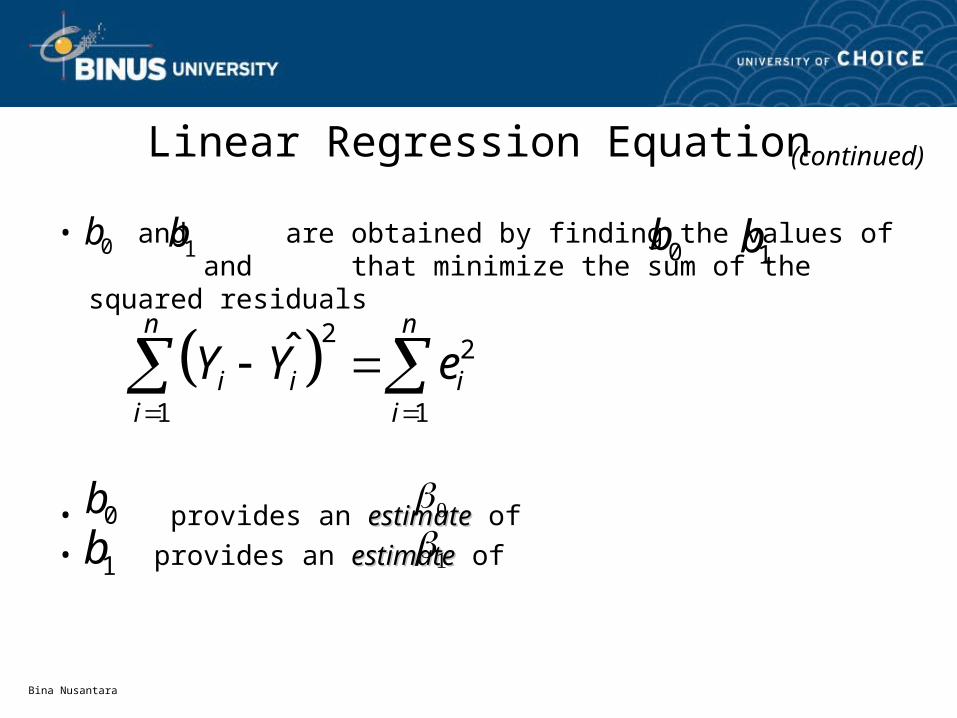
• and are obtained by finding the values of and that minimize the sum of the squared residuals
• provides an estimateestimate of • provides an estimateestimate of
0b 1b 0b 1b
0b
1b
(continued)
22
1 1
ˆn n
i i ii i
Y Y e
Bina Nusantara
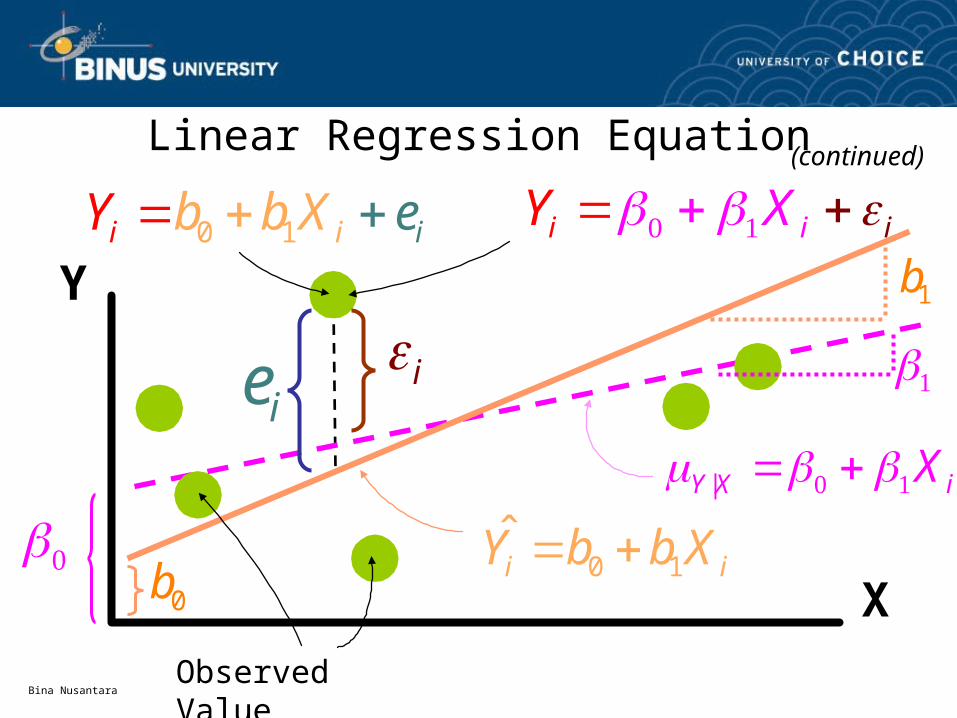
Linear Regression Equation (continued)
Y
XObserved Value
|Y X iX
i
ii iY X
0 1i iY b b X
ie
0 1i iib bY X e 1b
0b
Bina Nusantara
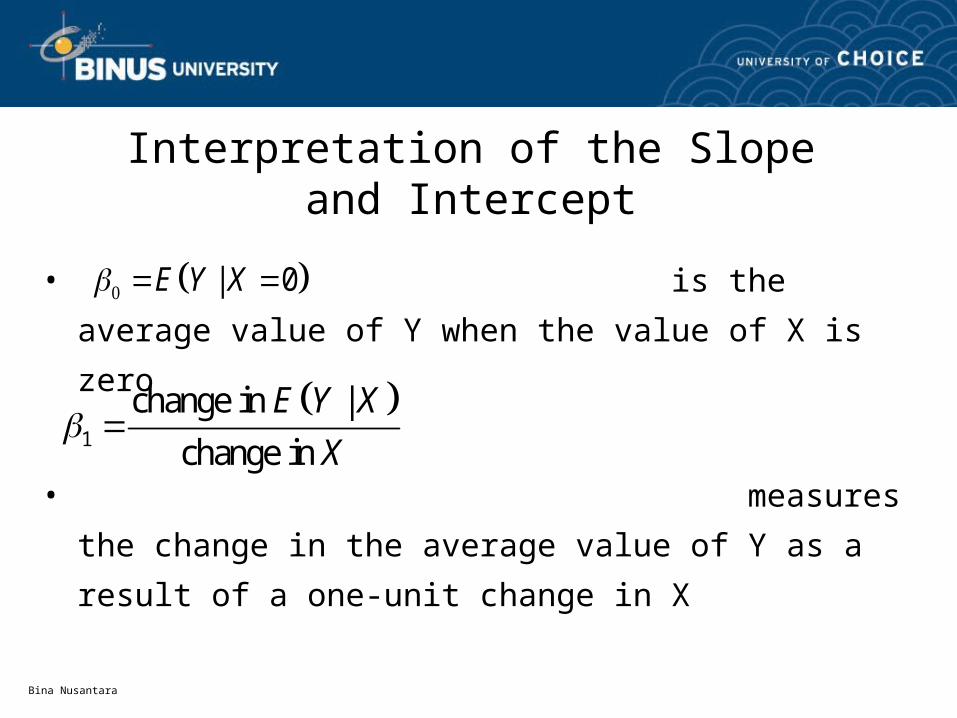
Interpretation of the Slopeand Intercept
• is the average value of Y
when the value of X is zero
• measures the change
in the average value of Y as a result of a one-unit
change in X
| 0E Y X
1
change in |
change in
E Y X
X
Bina Nusantara
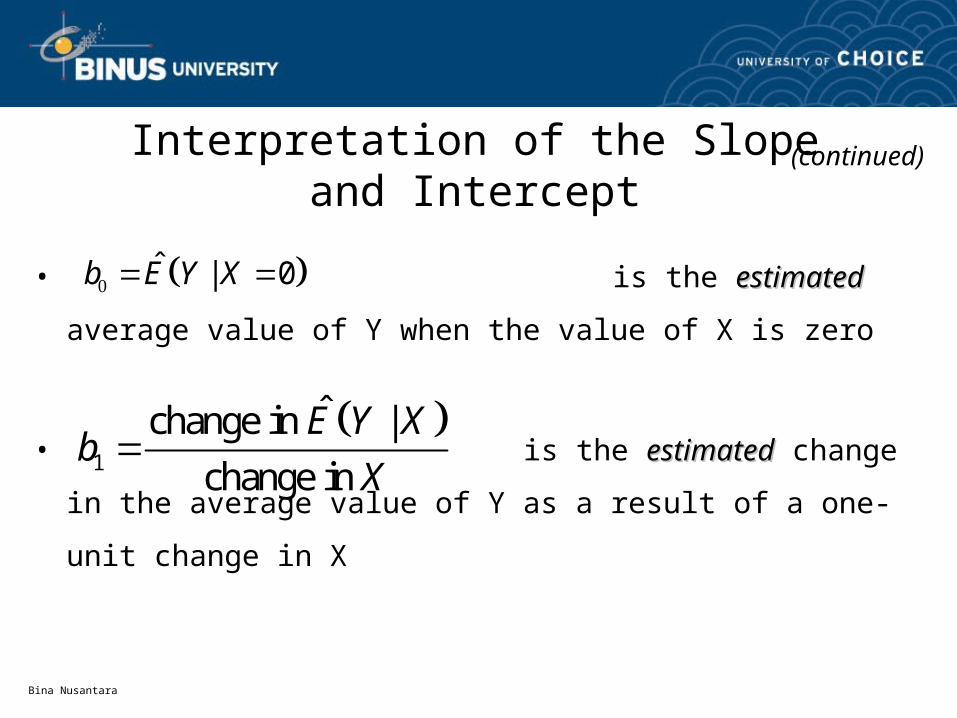
Interpretation of the Slopeand Intercept
• is the estimatedestimated average value of Y
when the value of X is zero
• is the estimatedestimated change
in the average value of Y as a result of a one-unit
change in X
(continued)
ˆ | 0b E Y X
1
ˆchange in |
change in
E Y Xb
X
Bina Nusantara
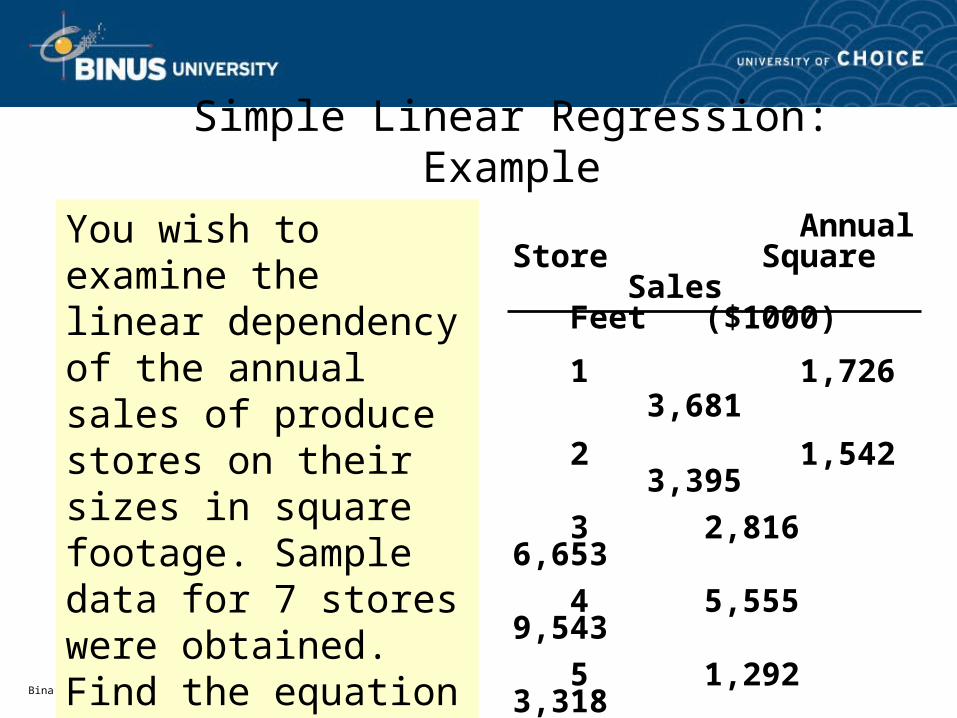
Simple Linear Regression: Example
You wish to examine the linear dependency of the annual sales of produce stores on their sizes in square footage. Sample data for 7 stores were obtained. Find the equation of the straight line that fits the data best.
Annual Store Square Sales
Feet ($1000)
1 1,726 3,681
2 1,542 3,395
3 2,816 6,653
4 5,555 9,543
5 1,292 3,318
6 2,208 5,563
7 1,313 3,760
Bina Nusantara
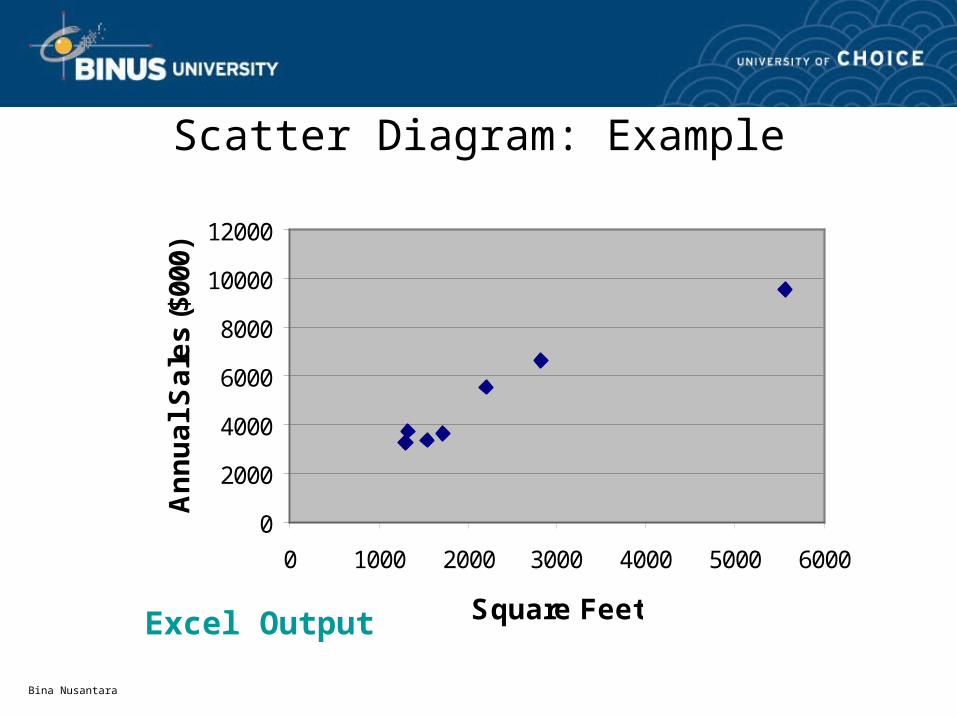
Scatter Diagram: Example
0
2000
4000
6000
8000
10000
12000
0 1000 2000 3000 4000 5000 6000
Square Feet
An
nu
al
Sa
les
($00
0)
Excel Output
Bina Nusantara
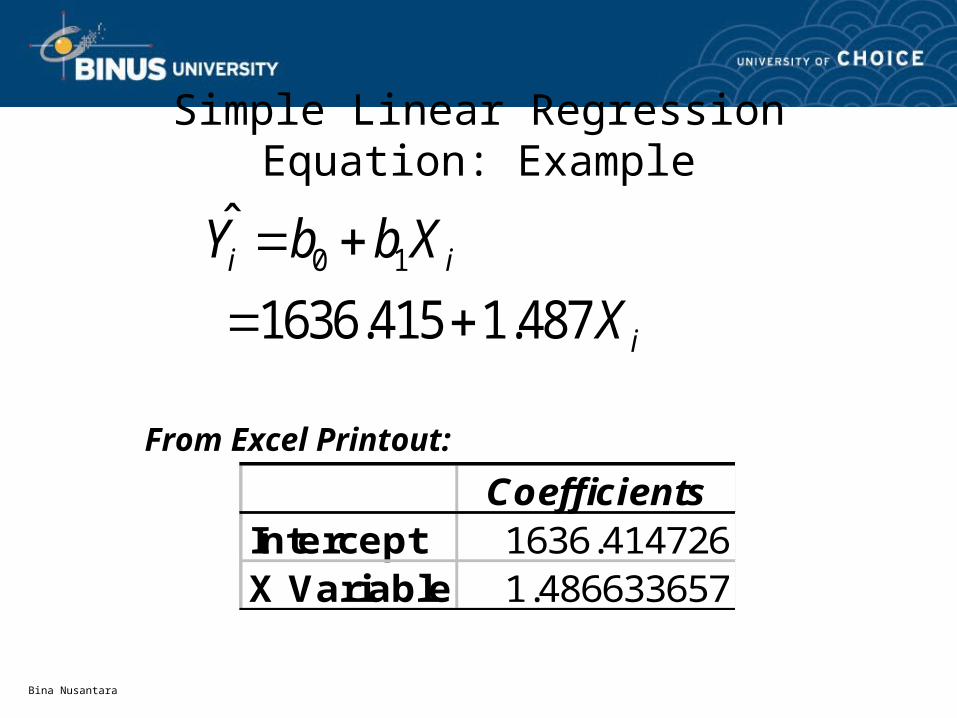
Simple Linear Regression Equation: Example
0 1ˆ
1636.415 1.487i i
i
Y b b X
X
From Excel Printout:
CoefficientsIntercept 1636.414726X Variable 1 1.486633657
Bina Nusantara
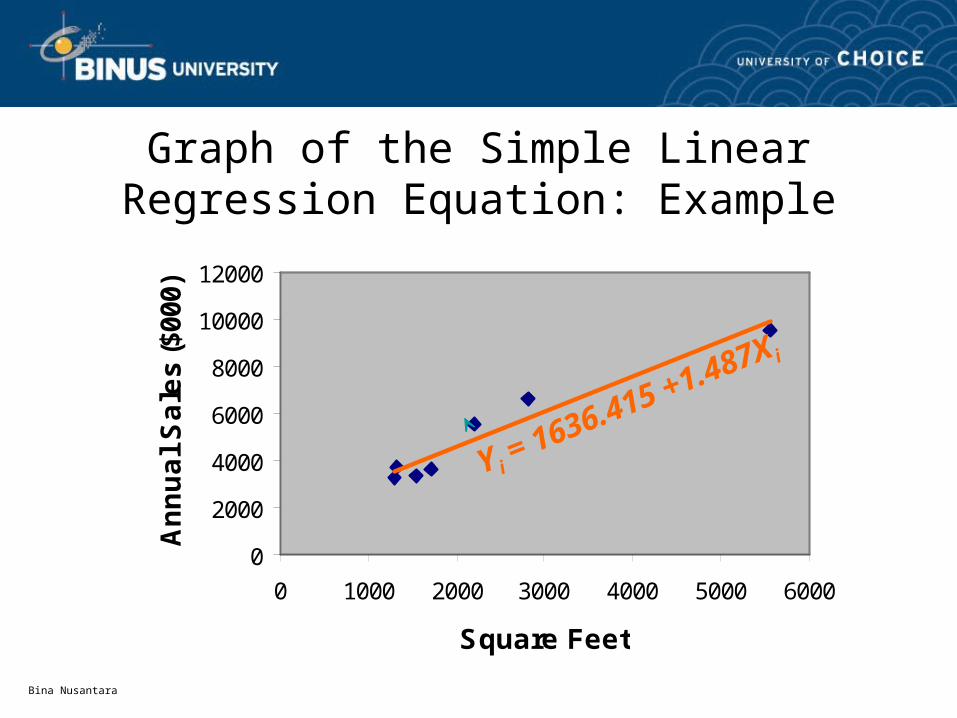
Graph of the Simple Linear Regression Equation: Example
0
2000
4000
6000
8000
10000
12000
0 1000 2000 3000 4000 5000 6000
Square Feet
An
nu
al
Sa
les
($00
0)
Y i = 1636.415 +1.487X i
Bina Nusantara
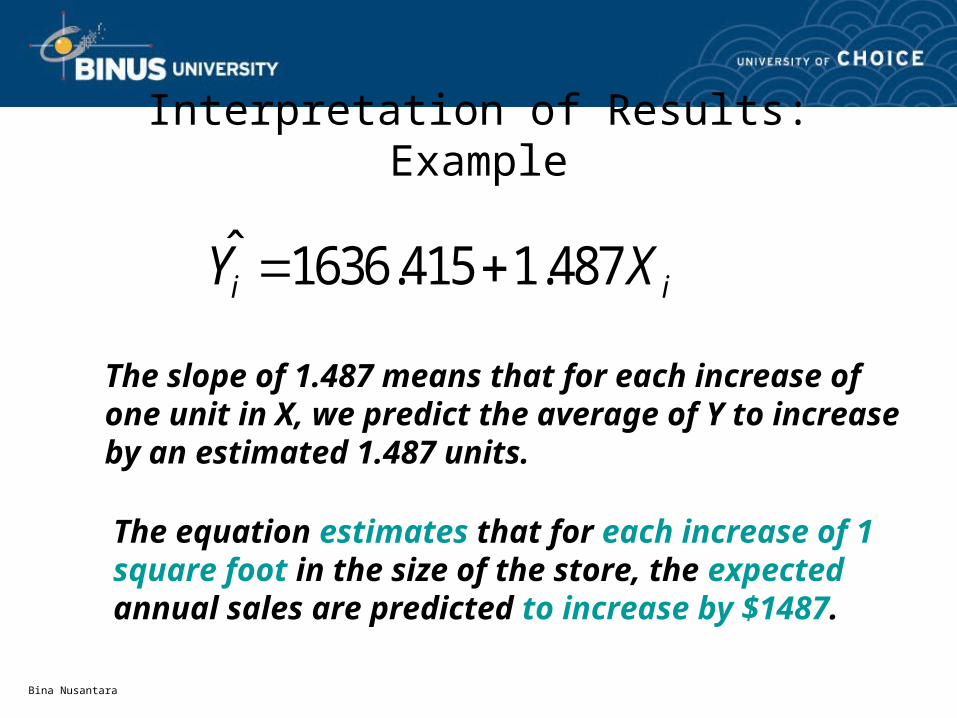
Interpretation of Results: Example
The slope of 1.487 means that for each increase of one unit in X, we predict the average of Y to increase by an estimated 1.487 units.
The equation estimates that for each increase of 1 square foot in the size of the store, the expected annual sales are predicted to increase by $1487.
ˆ 1636.415 1.487i iY X
Bina Nusantara
Chapter Summary• Introduced Types of Regression Models• Discussed Determining the Simple Linear
Regression Equation• Described Measures of Variation• Addressed Assumptions of Regression and
Correlation• Discussed Residual Analysis • Addressed Measuring Autocorrelation
Bina Nusantara
Chapter Summary• Described Inference about the Slope• Discussed Correlation - Measuring the Strength of
the Association • Addressed Estimation of Mean Values and
Prediction of Individual Values• Discussed Pitfalls in Regression and Ethical Issues
(continued)