regional wastewater services plan (rwsp) wastewater systems ... the regional wastewater services...
TRANSCRIPT

Regional Wastewater Services Plan (RWSP)
2013 Comprehensive Review
June 2014
King Street Center, KSC-NR-0512
201 South Jackson Street Seattle, WA 98104
http://dnr.metrokc.gov/wtd/

For comments or questions, contact: Pam Elardo, P.E., Division Director King County Wastewater Treatment Division 201 South Jackson Street KSC-NR-0512 Seattle, WA 98104-3856 206-477-4530 [email protected] This information is available in alternative formats on request at 206-477-5371 (voice) or 711 (TTY)
Contents
Executive Summary .................................................................................................................................. ES-1 Chapter 1 Introduction .............................................................................................................................. 1-1
King County’s Wastewater Treatment System ...................................................................................... 1-2
Regional Wastewater Services Plan ....................................................................................................... 1-4
Chapter 2 RWSP Achievements in 2007−2013 .......................................................................................... 2-1 RWSP Policies Implementation .............................................................................................................. 2-1
RWSP Capital Projects ............................................................................................................................ 2-2
Brightwater Treatment System .......................................................................................................... 2-3
Carnation Treatment Plant ................................................................................................................ 2-4
Conveyance System Improvement Projects ...................................................................................... 2-5
Reducing Infiltration and Inflow ........................................................................................................ 2-8
Protecting Our Waters Program ........................................................................................................ 2-9
Implementing the Sediment Management Plan .................................................................................. 2-14
Cleaning Up the Lower Duwamish Waterway Superfund Site ............................................................ 2-14
Creating Resources from Wastewater ................................................................................................. 2-15
Biosolids Recycling Program ............................................................................................................ 2-15
Energy Recovery and Efficiency Program ........................................................................................ 2-17
Reclaimed Water Program ............................................................................................................... 2-18
Protecting our Assets ........................................................................................................................... 2-20
Chapter 3 Financial Stewardship ............................................................................................................... 3-1 Establishing Annual Sewer Rate and Capacity Charge ........................................................................... 3-1
Residential Customer Equivalents ..................................................................................................... 3-2
Sewer Rate and Capacity Charge Projections .................................................................................... 3-4
Continuous Improvement Programs ..................................................................................................... 3-7
Productivity Initiative Pilot Program .................................................................................................. 3-7
Bright Ideas Program ......................................................................................................................... 3-8
Policy Guidance on Construction Fund and Emergency Reserves ......................................................... 3-8
Chapter 4 Forecasting Future Wastewater Treatment Plant Capacity Needs ........................................... 4-1 Summary ................................................................................................................................................ 4-1
Methodology .......................................................................................................................................... 4-2
Planning Assumptions ............................................................................................................................ 4-2
RWSP 2013 Comprehensive Review i

Contents
Population and Employment Forecasts ................................................................................................. 4-4
Average Wet Weather Flow Forecasts .................................................................................................. 4-7
Estimating Flow Factors for the Baseline Year ................................................................................... 4-7
Forecasting Future Flows ................................................................................................................... 4-8
Wasteload Forecasts ............................................................................................................................ 4-10
Estimating Loading Factors for the Baseline Year ............................................................................ 4-10
Forecasting Future Loadings ............................................................................................................ 4-10
Comparison of Future Flows, Loadings, and Capacities....................................................................... 4-12
Implications for Future Planning .......................................................................................................... 4-16
Chapter 5 Preparing for the Future ........................................................................................................... 5-1 Climate Change ...................................................................................................................................... 5-1
Regulatory Environment ........................................................................................................................ 5-2
Nutrient Removal ............................................................................................................................... 5-2
Source Control ................................................................................................................................... 5-3
Chemicals of Concern......................................................................................................................... 5-3
Other Topics ....................................................................................................................................... 5-3
Technology Trends ................................................................................................................................. 5-3
Decentralized Wastewater Systems .................................................................................................. 5-4
Nutrient Recovery .............................................................................................................................. 5-4
Energy Recovery ................................................................................................................................. 5-5
Indirect and Direct Potable Reuse ..................................................................................................... 5-5
Building Equity and Opportunity ........................................................................................................... 5-6
Chapter 6 Conclusions and Next Steps ...................................................................................................... 6-1 Conclusions ............................................................................................................................................ 6-1
Next Steps .............................................................................................................................................. 6-2
Appendix A. RWSP Policies Implementation in 2007−2013…………………………………………………………………A-1
Appendix B. Odor Prevention and Control Program……………………………………………………………………………B-1
Appendix C. Water Quality and Sediment Monitoring in 2013……………………………………………………………C-1
ii RWSP 2013 Comprehensive Review

Contents
Tables Table 3-1. Residential Customer Equivalents (1994–2013) ....................................................................... 3-3 Table 3-2. WTD Capacity Charge (2003−2014) .......................................................................................... 3-7 Table 4-1. Previous and Updated Planning Assumptions .......................................................................... 4-3 Table 4-2. Per-capita and Employee Flow Factors for 2010 ...................................................................... 4-8 Figures Figure 1-1. King County Wastewater Service Area and Facilities .............................................................. 1-3 Figure 1-2. Regional Wastewater Services Plan Projects and Service Areas (1999-2030) ........................ 1-5 Figure 2-1. Brightwater Treatment Plant ................................................................................................... 2-3 Figure 2-2. Brightwater Education and Community Center ...................................................................... 2-4 Figure 2-3. Carnation Treatment Plant ...................................................................................................... 2-5 Figure 2-4. Juanita Bay Pump Station ........................................................................................................ 2-6 Figure 2-5. Hidden Lake Pump Station ....................................................................................................... 2-6 Figure 2-6. Bellevue Pump Station ............................................................................................................. 2-6 Figure 2-7. Sources of Infiltration and Inflow ............................................................................................ 2-8 Figure 2-8. Location of the Puget Sound Beach CSO Control Projects .................................................... 2-11 Figure 2-9. King County’s Long-Term CSO Control Plan Projects ............................................................. 2-12 Figure 2-10. WTD’s 2012 Carbon Impact ................................................................................................. 2-17 Figure 3-1. Relationship Between the Monthly Sewer Rate and Capacity Charge .................................... 3-2 Figure 3-2. 2007 and 2013 Residential Customer Equivalent Forecasts (1993 to 2030) ........................... 3-4 Figure 3-3. Sewer Rate Projections with Inflation (2002–2014) ................................................................ 3-5 Figure 3-4. Sewer Rate Projections with Inflation (2002–2030) ................................................................ 3-5 Figure 3-5. Annual Capital Spending for the Wastewater Treatment Division (2000 to 2030) ................. 3-6 Figure 4-1. Previous and Current Population and Employment Projections for the WTD Service Area ... 4-4 Figure 4-2. King County’s Wastewater Treatment Service Areas .............................................................. 4-5 Figure 4-3. Previous (2004) and Current (2013) Population and Employment Forecasts For West Point
Service Area ............................................................................................................................ 4-6 Figure 4-4. Previous (2004) and Current (2013) Population and Employment Forecasts For South Plant
Service Area ............................................................................................................................ 4-6 Figure 4-5. Previous (2004) and Current (2013) Population and Employment Forecasts For Brightwater
Service Area ............................................................................................................................ 4-7 Figure 4-6. Regional Water Purveyor Predicted Water Usage Reductions from Water Conservation ..... 4-9 Figure 4-7. Historical and Forecasted Average Wet Weather Flow at West Point, South, and Brightwater
Treatment Plants, 1990−2060 .............................................................................................. 4-10 gure 4-8. Historical and Forecasted Average BOD load at Treatment Plants, 1990−2060 ...................... 4-11 Figure 4-9. Historical and Forecasted Average TSS load at Treatment Plants, 1990−2060 ..................... 4-12 Figure 4-10. Comparison of Actual and Forecast Solids Loadings with Systemwide Treatment Capacities,
1980−2060 ............................................................................................................................ 4-13 Figure 4-11. Actual and Forecast AWWF and Solids Loadings Compared to West Point Treatment Plant
Capacities, 1990−2060 ......................................................................................................... 4-14
RWSP 2013 Comprehensive Review iii

Contents
Figure 4-12. Actual and Forecast AWWF and Solids Loadings Compared to South Treatment Plant Capacities, 1990−2060 ............................................................................................................................. 4-15 Figure 4-13. Actual and Forecast AWWF and Solids Loadings Compared to Brightwater Treatment Plant Capacities, 2010−2060 ............................................................................................................................. 4-16 Figure 4-14. Historical and Projected Systemwide Average Wet Weather Flow .................................... 4-17
iv RWSP 2013 Comprehensive Review

Executive Summary
The Regional Wastewater Services Plan (RWSP) outlines important projects, programs, and policies for King County to implement through 2030 to continue to protect public health and water quality and ensure sufficient wastewater capacity to meet future growth. In adopting the RWSP in 1999, the Metropolitan King County Council recognized the importance of reviewing implementation of the RWSP and adopted specific RWSP reporting policies that call for regular reviews and reports.
The Wastewater Treatment Division (WTD) of the Department of Natural Resources and Parks (DNRP) has completed the RWSP 2013 Comprehensive Review as required by Ordinance 17232. The RWSP reporting policies were established through adoption of Ordinance 15384 and amended in 2012 through Ordinance 17480. A work plan for this review was approved by Motion 13758 in 2012. The review covers RWSP policy implementation from 2007 through 2013. This is the third comprehensive review report since adoption of the RWSP.
Implementation of the RWSP protects the region’s water quality, environment, and economy by providing dependable, high-quality wastewater treatment. One of the RWSP’s primary objectives under the treatment plant policies was construction of a new Brightwater Treatment Plant in south Snohomish County. The Brightwater Plant, which uses membrane bioreactor (MBR) technology, started full operations in 2012. The Brightwater Plant produces high-quality effluent and Class A reclaimed water that is used for irrigation in the Sammamish Valley. In 2008, the Carnation Treatment Plant was completed. The Carnation Plant also uses MBR technology and is designed to treat all wastewater to Class A reclaimed water standards for discharge to an enhanced wetland in the Chinook Bend Natural Area in the Snoqualmie River basin.
The RWSP 2013 comprehensive review included evaluating and updating future regional wastewater treatment capacity needs. The review confirmed the benefits of having a three-plant regional system (West, South and Brightwater treatment plants). Updated forecasts indicate that a full expansion at South Plant is unlikely to be needed in 2029 as previously projected, but may be needed in the 2030s. As the regional population has increased, treatment plant solids loadings have grown in proportion with population while average wet-weather flows decreased by 15 percent because of reduced water usage. These trends are likely to continue in the next few decades. WTD will conduct a study in 2015 to determine the most cost-effective methods to manage solids loading increases over time.
Actual population growth and water use rates could be more or less than projected. Of the factors that affect treatment plant capacity, climate change is expected to have a significant impact on future peak flows at treatment plants. WTD will continue to track factors and trends that affect treatment plant capacity needs, including climate change impacts over time, monitor flow data, and work with local agencies as they implement their land use and sewer plans.
In accordance with RWSP conveyance and infiltration/inflow (I/I) policies, WTD completed five conveyance system improvement (CSI) projects and one I/I reduction project between 2007 and 2013. These projects were designed to meet projected peak flow demands and the RWSP 20-year peak flow design standard. An update of the CSI plan, which will include a projection of future peak flows for the
RWSP 2013 Comprehensive Review ES-1

Executive Summary
treatment plants and future CSI projects, is scheduled for completion in 2015. Treatment plant capacity requirements may be adjusted when these projections are available.
The RWSP policies provide guidance to maximize the beneficial reuse of byproducts from wastewater treatment. WTD makes use of biosolids and digester gas from the solids treatment process and reclaimed water from the liquids treatment process. In 2007−2013, 100 percent of biosolids were used as a fertilizer and soil amendment in agriculture and forestry or as an ingredient in compost, the Waste-to-Energy cogeneration system at West Point Plant was completed and is now operational, and reclaimed water was produced and distributed from the Carnation and Brightwater plants. WTD continues to produce and use reclaimed water for treatment processes and irrigation at the West and South plants and provides additional reclaimed water to the City of Tukwila from South Plant.
WTD made significant progress from 2007 through 2013 to control combined sewer overflows (CSOs) to the Washington State standard of no more than one overflow per year on average at each CSO site. Construction began on four projects to control CSOs along Puget Sound beaches. Projects are under way or planned to control all remaining uncontrolled CSOs by 2030, under a consent decree with U.S. Department of Justice, U.S. Environmental Protection Agency, and Washington State Department of Ecology that was signed in 2013. CSO projects currently in design include the Georgetown Wet Weather Treatment Station, the Rainier Valley Wet Weather Storage project, and several green stormwater infrastructure projects that have the potential to reduce stormwater flows into the combined sewer system and reduce CSO project costs. King County is coordinating with the City of Seattle to identify cost savings and efficiencies and possible joint project opportunities to minimize impacts to communities and maximize water quality improvements.
Maintaining the region’s wastewater assets is a high priority for WTD. The objectives of the Asset Management Program are to manage the lifecycle of a facility or asset; deliver a level of service that meets regulatory requirements and ratepayer expectations; and fulfill WTD’s mission to protect public health and enhance the environment by treating and reclaiming water, recycling solids, and generating energy. WTD’s Strategic Asset Management Plan (SAMP) will be updated in 2015 and will include action plans to improve asset management practices using data collected and analyzed under the program.
WTD is committed to continuous improvement and strives to be a state-of the-art, energy-efficient, lean, continually improving agency. WTD completed a 10-year pilot Productivity Initiative Program in 2011 that generated nearly $84 million in savings for ratepayers. In 2011, WTD initiated a Bright Ideas Program that asks employees to identify efficiencies and cost saving measures in the division’s operations, which has generated over 550 ideas and is expected to save about $400,000 in 2014.
RWSP comprehensive review reporting policies call for the review of the effectiveness of policy implementation. Based on results of this review, policy amendments are not recommended at this time. However, this report will serve as a foundation for upcoming policy discussions with the Metropolitan Water Pollution Abatement Advisory Committee, Regional Water Quality Committee, and County Council regarding future recommended policy revisions and changes to guide the future of the regional wastewater system.
ES-2 RWSP 2013 Comprehensive Review

Chapter 1 Introduction
The Regional Wastewater Services Plan (RWSP) 2013 Comprehensive Review is presented in response to the RWSP reporting policies outlined in Ordinance 15384 and King County Code 28.86.165.1 Each chapter in this report describes a specific set of RWSP policies and how the policies were implemented in 2007–2013.
The major topics of each chapter are as follows:
• Chapter 2 summarizes RWSP implementation achievements made from 2007−2013. The chapter includes information on regional treatment and conveyance capital projects, infiltration and inflow (I/I), combined sewer overflow (CSO) control projects, and achievements made in implementing the County’s Sediment Management Plan, cleaning up the Lower Duwamish Waterway Superfund site, creating resources from wastewater, protecting the region’s wastewater assets, and implementing RWSP policies.
• Chapter 3 describes how annual sewer rates and capacity charges are established, provides sewer rate and capacity charge projections through 2030, and compares them to projections in previous RWSP comprehensive review reports. The chapter also describes programs implemented in 2007−2013 to increase efficiency and policy guidance on construction fund and emergency reserves.
• Chapter 4 summarizes future population and economic growth projections and the expected impact on the regional wastewater treatment system. It provides detail on the methodology and assumptions for developing projections and discusses the findings as they relate to future treatment plant capacity needs.
• Chapter 5 summarizes WTD activities under way to address emerging issues and priorities such as climate change, chemicals of emerging concern, increased use and demand for the byproducts of wastewater treatment, sustainable building, technology trends, regulations that are more stringent, and equity and social justice.
• Chapter 6 summarizes conclusions from the RWSP review and identifies next steps in continuing to implement the RWSP to protect the region’s water quality.
The remainder of this chapter describes King County’s wastewater treatment system and the RWSP.
1 RWSP annual reports and comprehensive reviews are available on the Web at http://dnr.metrokc.gov/wtd/rwsp/library.htm.
RWSP 2013 Comprehensive Review 1-1

Chapter 1. Introduction
King County’s Wastewater Treatment System King County protects water quality and public health in the central Puget Sound region by providing high-quality and effective treatment to wastewater collected from 17 cities, 16 local sewer utilities, and 1 Indian Tribe. The County's Wastewater Treatment Division (WTD) serves about 1.5 million people, including most urban areas of King County and parts of south Snohomish County and northeast Pierce County.
The wastewater system (Figure 1-1) includes three large regional treatment plants (the West Point Plant in the City of Seattle, the Brightwater Plant in south Snohomish County, and the South Plant in the City of Renton), one small treatment plant on Vashon Island, one community septic system (Beulah Park and Cove on Vashon Island), one reclaimed water treatment plant in the City of Carnation, four CSO treatment facilities (Alki, Carkeek, Mercer/Elliott West, and Henderson/Norfolk—all in the City of Seattle), over 360 miles of pipes, 19 regulator stations, 43 pump stations, and 38 CSO outfalls.
Visit WTD’s website for more information on projects and programs: http://www.kingcounty.gov/environment/wtd.aspx.
1-2 RWSP 2013 Comprehensive Review

Chapter1. Introduction
Figure 1-1. King County Wastewater Service Area and Facilities
RWSP 2013 Comprehensive Review 1-3

Chapter 1. Introduction
RWSP Comprehensive Review Reporting Policies
The policies below were established through adoption of Ordinance 15384, and amended in 2012 through Ordinance 17480. They guide the preparation of the RWSP comprehensive reviews.
B.1. Comprehensive regional wastewater services plan review. The executive shall submit a written report to council and RWQC that provides a comprehensive review of the RWSP. The report will review the following: a. assumptions on the rate and location of growth, the rate of septic conversions and the effectiveness of water conservation efforts; b. phasing and size of facilities; c. effectiveness of RWSP policies implementation, for infiltration and inflow reduction, water reuse, biosolids, CSO abatement, water quality protection, environmental mitigation and public involvement; and d. policy guidance for the construction fund and the emergency capital reserves.
2. The next comprehensive regional wastewater services plan review is due in June 2014. Subsequent reports will be prepared every three to five years as established by the council and RWQC following their review of the current report. The specific due date will be based upon the availability of necessary information, the completion of key milestones, and the time needed to collect and analyze data. The executive may recommend policy changes based on the findings of the report and other information from changing regulations, new technologies or emerging or relevant factors.
Regional Wastewater Services Plan In the 1990s, wastewater flow estimates based on projected population growth estimates in King County’s wastewater service area indicated that the regional wastewater treatment system would run out of capacity by 2010. To ensure the continuation of high-quality and effective wastewater treatment services in the future, the County carried out an intensive planning effort, involving numerous elected officials, representatives from local sewer agencies, organizations, and individuals from around the region. The RWSP resulted from this effort and was adopted by the Metropolitan King County Council in November 1999, by Ordinance 13680.
The RWSP outlines a number of important projects, programs, and policies for King County to implement through 2030 (Figure 1-2). It called for building a new Brightwater Treatment Plant to accommodate growth in the northern portion of the wastewater service area. The plan also called for improvements to the County’s regional conveyance system to meet the 20-year peak flow design standard and accommodate increased flows; improvements to reduce existing and future levels of I/I (clean groundwater and stormwater) into local collection systems; and improvements to control CSOs so that an average of no more than one untreated discharge occurs per year at each CSO site by 2030.2
The RWSP also identified the need to expand South Plant by 2029 to handle projected increased wastewater flows in the southern and eastern portions of the the wastewater service area.
2 The Washington State Department of Ecology and the United States Environmental Protection Agency entered into a consent decree with King County in July 2013 to ensure control of King County CSOs to one event per year at each CSO location by 2030.
1-4 RWSP 2013 Comprehensive Review

Chapter 1. Introduction
Figure 1-2. Regional Wastewater Services Plan Projects and Service Areas (1999-2030)
RWSP 2013 Comprehensive Review 1-5

Chapter 1. Introduction
1-6 RWSP 2013 Comprehensive Review

Chapter 1. Introduction
Ordinance 13680 was codified in the King County Code (KCC) as Chapter 28.86. Amendments to Ordinance 13680 and KCC Chapter 28.86 made during 2007−2013 are summarized below:
• Ordinance 17587 was adopted by the King County Council in May 2013 to amend CSO control policies to ensure they are consistent with the 2012 amended long-term CSO control plan that the Council approved through Ordinance 17413 and the consent decree that was signed in 2013.
• Ordinance 17492 was adopted by the King County Council in December 2012 to revise a financial policy addressing debt financing and borrowing.
• Ordinance 17480 was approved by the King County Council in December 2012 to amend RWSP reporting policies regarding construction fund and emergency reserves in RWSP comprehensive review reports; provide guidance for completion of the RWSP comprehensive review in June 2014; and delete the requirement for Brightwater monthly reports.
• Ordinance 16033 was approved by the King County Council in March 2008 to amend RWSP conveyance policies to provide guidance regarding field verifications and decennial flow monitoring; add a policy to update the CSI Program every five years; provide guidance on information to include in CSI Program updates; and added a policy to include evaluation of other demand management alternatives to meet identified conveyance needs
Appendix A discusses how each RWSP policy was implemented in 2007−2013. This report does not recommend policy amendments at this time, but does serve as a foundation for upcoming discussions with MWPAAC, RWQC and the Council on any proposed policy changes for the years ahead.
Visit the RWSP website for more information on this regional plan and to view the entire contents of the RWSP 2013 Comprehensive Review: http://www.kingcounty.gov/environment/wtd/Construction/planning/rwsp.aspx.
RWSP 2013 Comprehensive Review 1-7

Chapter 1. Introduction
1-8 RWSP 2013 Comprehensive Review
Chapter 2 RWSP Achievements in 2007−2013
This chapter summarizes RWSP implementation achievements made from 2007 through 2013. The chapter includes information on RWSP capital projects designed to provide needed regional treatment and conveyance capacity to meet population and employment growth, reduce infiltration and inflow (I/I), and meet the County’s commitment to control its combined sewer overflows (CSOs) by 2030. The chapter also summarizes achievements made in implementing the County’s Sediment Management Plan, cleaning up the Lower Duwamish Waterway Superfund site, creating resources from wastewater, protecting the region’s wastewater assets, and implementing RWSP policies.
RWSP Policies Implementation The RWSP policies are part of the King County Code Chapter 28.86. Appendix A includes each policy and summary information on how the policy was implemented in 2007−2013. The policies provide guidance on the following areas:
• Ensuring there is sufficient regional treatment and conveyance capacity to meet population and employment growth projections
• Reducing I/I into the regional conveyance system
• Achieving control of all the County’s CSOs by 2030
• Creating resources from the wastewater treatment process
• Protecting and monitoring water quality of the region’s water bodies
• Providing wastewater services in a cost-effective and environmentally responsible manner
• Planning comprehensively
• Being a good neighbor through controlling nuisance odors, engaging the public, and providing mitigation measures for environmental impacts from the construction and operation of wastewater facilities
• Financing, including setting sewer rates and capacity charges for the regional wastewater system
• Reporting on the progress of RWSP implementation
RWSP comprehensive review reporting policies call for the inclusion of information on the effectiveness of policy implementation and note that the County Executive may recommend policy changes based on the findings of the report and other information from changing regulations, new technologies, or emerging or relevant factors. Appendix A discusses how each policy was implemented in 2007−2013, and as a next step in the RWSP comprehensive review process, WTD will be working with MWPAAC’s
RWSP 2013 Comprehensive Review 2-1

Chapter 2. RWSP Achievements in 2007−2013
Engineering and Planning Subcommittee and the County Council’s Regional Water Quality Committee (RWQC) to discuss policy implementation and effectiveness and any recommendations for policy amendments. This report does not recommend policy amendments at this time, but does serve as a foundation for the upcoming discussions with MWPAAC and RWQC.
Several policy amendments were made during 2007−2013. They are summarized below and noted in Appendix A.
• Amendments to RWSP CSO control policies. In May 2013, the County Council approved Ordinance 17587, amending CSO control policies. The amendments ensure the policies are consistent with the 2012 amended long-term CSO control plan that the County Council approved through Ordinance 17413 and the Consent Decree that was signed in 2013.
• Amendments to RWSP financial policies. In December 2012, the County Council approved Ordinance 17492, revising a financial policy addressing debt financing and borrowing.
• Amendments to RWSP reporting policies. In December 2012, the County Council approved Ordinance 17480, amending RWSP reporting policies. The amendments included the following:
o Adding information on policy guidance for construction fund and emergency reserves in RWSP comprehensive review reports
o Providing guidance for the next RWSP comprehensive review to be completed in June 2014
o Deleting requirement for Brightwater monthly reports
• Amendments to RWSP conveyance policies. In March 2008, the County Council approved Ordinance 16033, amending RWSP conveyance policies. The amendments included the following:
o Added policy guidance to confirm assumptions and needs (field verifications, decennial flow monitoring)
o Added a policy to update the CSI Program every five years and provided guidance on information to include in CSI Program updates
o Added a policy to include evaluation of other demand management alternatives to meet identified conveyance needs
RWSP Capital Projects RWSP policies call for the County to ensure there is sufficient treatment plant and conveyance system capacity to meet population and employment growth through 2030. The policies provide guidance for facility sizing to accommodate population growth.
2-2 RWSP 2013 Comprehensive Review
Chapter 2. RWSP Achievements in 2007−2013
RWSP policies also call for the County to carry out projects to reduce the impact of I/I on the regional system’s capacity and to control CSOs to the Washington State standard of one untreated overflow from each CSO location per year based on a 20-year moving average.
This section provides information on the treatment plant, conveyance, I/I, and CSO control projects that were under way or completed in 2007−2013.
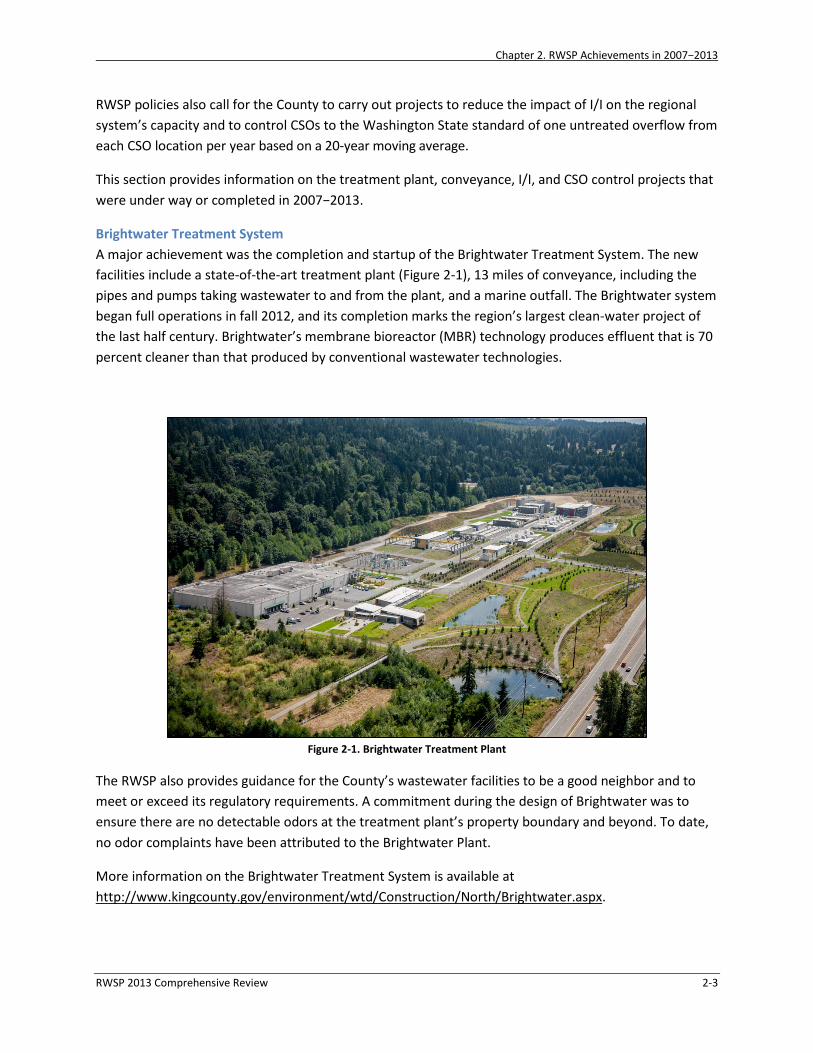
Brightwater Treatment System A major achievement was the completion and startup of the Brightwater Treatment System. The new facilities include a state-of-the-art treatment plant (Figure 2-1), 13 miles of conveyance, including the pipes and pumps taking wastewater to and from the plant, and a marine outfall. The Brightwater system began full operations in fall 2012, and its completion marks the region’s largest clean-water project of the last half century. Brightwater’s membrane bioreactor (MBR) technology produces effluent that is 70 percent cleaner than that produced by conventional wastewater technologies.
Figure 2-1. Brightwater Treatment Plant
The RWSP also provides guidance for the County’s wastewater facilities to be a good neighbor and to meet or exceed its regulatory requirements. A commitment during the design of Brightwater was to ensure there are no detectable odors at the treatment plant’s property boundary and beyond. To date, no odor complaints have been attributed to the Brightwater Plant.
More information on the Brightwater Treatment System is available at http://www.kingcounty.gov/environment/wtd/Construction/North/Brightwater.aspx.
RWSP 2013 Comprehensive Review 2-3

Chapter 2. RWSP Achievements in 2007−2013
Brightwater Education and Community Center The Brightwater Education and Community Center (Figure 2-2) opened in September 2011. The center features:
• 70 acres of public open space with three miles of walking trails and 40 acres of natural habitat
• A community center with meeting rooms available for public rental
• A clean water learning space featuring both indoor and outdoor settings
Figure 2-2. Brightwater Education and Community Center
During the Brightwater siting process, the public asked King County to include the center as part of treatment plant design to provide an asset to the host community. In the first year of operation, the center served approximately 4,000 4th-8th graders in school programs, 300 participants in family programs, and 150 teachers in professional development workshops.
More information on the Brightwater Education and Community Center is available at http://www.kingcounty.gov/environment/brightwater-center.aspx.
Carnation Treatment Plant In 2002, the King County Council amended the Comprehensive Water Pollution Abatement Plan and added the City of Carnation to the County’s wastewater service area. The City of Carnation decided to replace on-site septic systems with a new wastewater treatment facility and collection system to better protect public health and the environment, achieve the City’s comprehensive plan goals, and maintain and enhance community livability. The City designed and built the local wastewater collection system and contracted with King County to design, build, operate, and maintain a new treatment plant and associated discharge facilities.
The Carnation Treatment Plant (Figure 2-3) was completed in 2008. The plant uses MBR technology and is designed to treat wastewater to Class A reclaimed water standards. In March 2009, the plant started discharging its Class A reclaimed water to enhance a wetland in the Chinook Bend Natural Area. The plant has a dual discharge system. In addition to the wetland, an outfall discharges to the Snoqualmie
2-4 RWSP 2013 Comprehensive Review

Chapter 2. RWSP Achievements in 2007−2013
River only when required by a regulatory agency (such as when necessary to augment flows in the Snoqualmie River), in case of plant upset or failure of ultraviolet disinfection system, or during periods of scheduled maintenance.
More information on the Carnation Treatment Plant is available at http://www.kingcounty.gov/environment/wtd/About/System/Carnation.aspx.
Figure 2-3. Carnation Treatment Plant
Conveyance System Improvement Projects In accordance with RWSP policies, the Conveyance System Improvement (CSI) Program works to provide sufficient capacity in areas of the separated conveyance system to meet projected demands and the RWSP 20-year peak flow design standard. The 20-year peak flow design standard was adopted by the King County Council to serve as an objective measure for designing and building conveyance facilities intended to meet National Pollutant Discharge Elimination System (NPDES) permit requirements. A 20-year peak flow consists of both storm flow (I/I) and base flow (wastewater from homes and businesses). In setting this standard, the King County Executive and King County Council recognized that it is one of the most stringent standards in the nation and would require time to upgrade the conveyance system to meet this standard.
RWSP CSI Projects Completed in 2007-2013 The RWSP CSI projects that were completed during 2007 through 2013 are as follows:
• Juanita Bay Pump Station Replacement project (Figure 2-4). Construction of this project was completed in 2008. It replaced the aging 14.2-mgd (million gallons per day) Juanita Bay Pump Station with a 30.6-mgd pump station.
• Hidden Lake Pump Station and Sewer Improvement project (Figure 2-5). Construction of this project was completed in 2009.The project included building a new Hidden Lake Pump Station in the City of Shoreline, replacing approximately 12,000 feet of the Boeing Creek Trunk, and
RWSP 2013 Comprehensive Review 2-5

Chapter 2. RWSP Achievements in 2007−2013
building a 500,000-gallon underground storage facility in Boeing Creek Park. The new pump station has a pumping capacity of 6.8 mgd, an increase of 2.5 mgd over the replaced pump station’s capacity.
• Bellevue Pump Station Upgrade and Force Main Installation project (Figure 2-6). Construction of this project was completed in 2010. The project included construction of a new force main and replacement of an 8-mgd pump station. The refurbished pump station’s capacity is able to convey more than 13 mgd of wastewater from west and central Bellevue to the South Treatment Plant.
• Bellevue Influent Trunk Improvement project. Construction of this project was completed in 2012. The project included constructing a pipeline that parallels the Bellevue Influent Trunk to serve the rapidly growing downtown Bellevue area.
• Kent-Auburn Conveyance System Improvements project (Phase A). Construction on this project was completed in early 2014. The project included construction of two new pipelines, the Kent East Hill Diversion in Kent and the Stuck River Trunk in Auburn.
Figure 2-4. Juanita Bay Pump Station Figure 2-5. Hidden Lake Pump Station
Figure 2-6. Bellevue Pump Station
2-6 RWSP 2013 Comprehensive Review

Chapter 2. RWSP Achievements in 2007−2013
RWSP CSI Projects in Development in 2007-2013 CSI projects that are currently being developed are as follows:
• Sunset and Heathfield Pump Stations and Force Main Upgrade project. This project began predesign in 2013. The project will update the undersized Sunset and Heathfield pump stations and associated sewer force main in Bellevue. Originally constructed in 1965 (with upgrades in 1987), the pump stations have a system capacity of 18 mgd. The upgraded system will convey a peak flow of 30 mgd and will improve odor control. Construction is expected to begin in 2016. More information on the project is available at http://www.kingcounty.gov/environment/wtd/Construction/East/SunsetHeathfield.aspx.
• North Creek Interceptor project. This project will replace a main wastewater conveyance pipeline that serves parts of Bothell and unincorporated Snohomish County. The project includes construction of approximately 10,000 feet of new sewer line and connecting it to previously constructed pipe. This new pipeline ranges from 30 to 48 inches in diameter. Construction will take place in both the City of Bothell and unincorporated Snohomish County. Construction is expected to begin in 2014. More information on the project is available at http://www.kingcounty.gov/environment/wtd/Construction/North/NCI.aspx.
• North Lake Sammamish Flow Diversion project. Alternatives analysis is under way for this project. The project will divert wastewater flows from the North Lake Sammamish Basin to the Brightwater Treatment Plant to free up capacity in the East Side Interceptor. Construction is expected to begin in 2017. More information on the project is available at http://www.kingcounty.gov/environment/wtd/Construction/East/NLkSamFlowDiversion.aspx.
• North Mercer Island Interceptor and Enatai Interceptor Upgrade project. This project is just beginning; work on alternatives analysis is expected to begin in 2014. The project will increase the capacity of the existing North Mercer Island Interceptor and Enatai Interceptor to meet the RWSP design standard. The North Mercer Island and Enatai Interceptors serve areas in North Mercer Island, the southwest portion of Bellevue, and the Town of Beaux Arts Village. Construction is expected to begin in 2019. More information on the project is available at http://www.kingcounty.gov/environment/wtd/Construction/East/NMIEnatai.aspx.
• Lake Hills and Northwest Lake Sammamish Interceptor Upgrade project. This project will replace the existing Lake Hills Trunk and upgrade the Northwest Lake Sammamish Interceptor to meet the RWSP conveyance design standard. The existing gravity pipelines are about 4.5 miles long and are located in the City of Redmond. This project is just beginning; work on alternatives analysis is expected to begin in 2014.
Decennial Flow Monitoring As part of the CSI Program, the Decennial Flow Monitoring project began in 2009 and was completed in 2011. The project was carried out according to RWSP conveyance policies, which call for the Wastewater Treatment Division to conduct systemwide flow monitoring in the separated conveyance system every 10 years to correspond with the federal census. The project collected flow data over two wet seasons.
RWSP 2013 Comprehensive Review 2-7

Chapter 2. RWSP Achievements in 2007−2013
Data collected from 235 flow meter locations will inform the CSI Program update that is under way and is also available to local agencies for use in planning and designing their systems.
2015 CSI Program Update Work on the 2015 CSI Program update began in 2013. The last update was completed in 2007. RWSP policies call for regular program updates to verify, make adjustments to, or identify new conveyance system needs. WTD will continue working with the Engineering and Planning Subcommittee of the Metropolitan Water Pollution Abatement Advisory Committee (MWPAAC) and individual agencies to complete the program update. Activities to complete the update include the following:
• Analyzing and applying new flow data and population forecasts to produce an updated list of capacity needs and priorities
• Developing conceptual projects and planning-level cost estimates to meet capacity needs
• Prioritizing conceptual projects
More information on the CSI Program is available at http://www.kingcounty.gov/environment/wastewater/CSI.aspx.
Reducing Infiltration and Inflow I/I is water that enters the sewer system through cracked pipes, leaky manholes, or improperly connected storm drains, downspouts, and sump pumps (Figure 2-7). Most inflow comes from stormwater and most infiltration comes from groundwater. About 75 percent of the peak flow in the County’s separated conveyance system is from I/I; 95 percent originates in local systems, primarily from side sewers on private property.
Figure 2-7. Sources of Infiltration and Inflow
2-8 RWSP 2013 Comprehensive Review

Chapter 2. RWSP Achievements in 2007−2013
In 2007−2013, WTD continued to implement the Executive’s Recommended I/I Control Program that was approved by the King County Council through Motion 12292 in May 2006. Implementation focused on completing an initial I/I reduction project in the Skyway Water and Sewer District. The project reached substantial completion in March 2012. It included replacing side sewers serving 302 residential properties, over 90 manholes, and approximately 19,000 linear feet of 8-inch-diameter sewer main.
The purpose of the project was to determine whether and how it is possible to cost-effectively remove enough I/I from the regional conveyance system to delay, reduce, or eliminate a planned CSI project. The definition of cost-effectiveness focuses on regional benefit in terms of capital project costs. The project was developed in consultation with MWPAAC’s Engineering and Planning Subcommittee during the discussions that led to development of the recommended I/I Control Program.
One season of post-construction flow monitoring has been completed. Preliminary results indicate that the project resulted in reducing peak flow by about 19 percent, which is less than anticipated. Reasons for this result include the following: (1) properties may have had more sump pumps than anticipated, (2) fewer parcels than planned underwent complete rehabilitation because of increasingly difficult field conditions as work progressed into the wet season and more hardscape features than anticipated were present on individual properties, and (3) the area that contributes I/I to the sewer basin appears to have been larger than originally delineated. However, the Skyway initial I/I reduction project did provide benefits including delaying the need for storage. WTD intends to conduct another wet-season of post-construction flow monitoring to confirm or update the results of the project.
In accordance with the approved I/I Control Program, WTD will work with the Engineering and Planning Subcommittee of MWPAAC in 2015 to develop recommendations for long-term I/I reduction and control.
More information on the I/I Control Program is available at http://www.kingcounty.gov/environment/wastewater/II.aspx.
Protecting Our Waters Program WTD made significant progress in 2007−2013 to implement the County’s CSO Control Program, called Protecting Our Waters. CSOs are discharges of wastewater and stormwater from combined sewers into water bodies during heavy rainstorms when sewers are full. Combined sewers, which carry both wastewater and stormwater, exist in many parts of older cities across the nation, including Seattle. To protect treatment plants and avoid sewer backups into homes, businesses, and streets, combined sewers in Seattle sometimes overflow into nearby water bodies. Although the wastewater in CSOs is greatly diluted by stormwater, CSOs may be harmful to public health and aquatic life because they can carry chemicals and disease-causing pathogens. The County began its CSO control efforts in the late 1970s.
The County is committed to controlling all its CSO sites by 2030. About one-half of its 38 CSO sites are controlled. Projects are under way or planned to control the remaining uncontrolled CSOs.
A summary of the Protecting Our Waters Program’s achievements in 2007−2013 follows.
RWSP 2013 Comprehensive Review 2-9

Chapter 2. RWSP Achievements in 2007−2013
Control of Ballard CSO Control of the Ballard CSO was incorporated into the Ballard Siphon Replacement project’s design and construction. The project achieved substantial completion in 2013. The project included building a new 85-inch-diameter siphon pipe under Salmon Bay between the Ballard and Interbay areas of Seattle. The new pipe replaced two 36-inch-diameter wooden stave pipes that have served the Ballard community since the 1930s. The project may also result in reducing overflows at the 11th Ave NW CSO site.
Projects to Control CSOs along Puget Sound Beaches Construction began on four projects to control CSOs along Puget Sound Beaches (Figure 2-8):
• The North Beach CSO control project is building an underground storage tank in the rights-of-way in Northwest Blue Ridge Drive and Triton Drive Northwest in Seattle. The facility will store excess flows during large storms when the North Beach Pump Station reaches maximum capacity. Construction is expected to be complete in 2015. More information on the project is available at http://www.kingcounty.gov/environment/wtd/Construction/Seattle/NBeachCSOStorage.aspx.
• The South Magnolia CSO control project is building an underground storage tank adjacent to Smith Cove Park, south of the Magnolia Bridge in Seattle. The facility will store peak flows when the South Magnolia Trunk reaches maximum capacity. Construction is expected to be complete in 2015. More information on the project is available at http://www.kingcounty.gov/environment/wtd/Construction/Seattle/SMagnoliaCSOStorage.aspx
• The Murray CSO control project is building an underground storage tank beneath property across the street from Seattle’s Lowman Beach Park. The facility will store peak flows when the Murray Pump Station reaches maximum capacity. Construction is expected to complete in 2016. More information on the project is available at http://www.kingcounty.gov/environment/wtd/Construction/Seattle/MurrayCSOStorage.aspx.
• The Barton CSO control project is constructing roadside rain gardens, a type of green stormwater infrastructure (GSI) in the City of Seattle’s planting strips in the Sunrise Heights and Westwood neighborhoods. Street runoff will be diverted away from storm drains and into the vegetated swales. Once in the swales, the water will filter through soil to an underdrain, which will take the water to a deep well for slow infiltration underground. Construction is expected to be complete in 2015. More information on the project is available at http://www.kingcounty.gov/environment/wtd/Construction/Seattle/BartonCSO-GSI.aspx.
2-10 RWSP 2013 Comprehensive Review

Chapter 2. RWSP Achievements in 2007−2013
Figure 2-8. Location of the Puget Sound Beach CSO Control Projects
CSO Control Program Review and Plan Update In accordance with RWSP policies, the CSO Control Program review and plan update was completed in 2012. As a result, in September 2012, the County Council approved an amendment to the County’s long-term CSO control plan through Ordinance 17413. The plan includes nine projects to control the remaining 14 uncontrolled CSOs by 2030 (Figure 2-9). The U.S. Environmental Protection Agency (EPA) also approved the amended plan in 2013, and the plan is incorporated into the consent decree that the County entered into with the U.S. Department of Justice, EPA, and Washington State Department of Ecology (Ecology) in 2013. To date, the County is on schedule to meet all the milestones outlined in the consent decree.
RWSP 2013 Comprehensive Review 2-11

Chapter 2. RWSP Achievements in 2007−2013
Figure 2-9. King County’s Long-Term CSO Control Plan Projects
2-12 RWSP 2013 Comprehensive Review

Chapter 2. RWSP Achievements in 2007−2013
Work began on three projects outlined in the Council-approved CSO control plan: Georgetown Wet Weather Station to control the Brandon and South Michigan CSOs; Rainier Valley Wet Weather Storage to control the Hanford #1 CSO, and the Highland Park and South Park green stormwater infrastructure (GSI )project to help control the West Michigan and Terminal 115 CSOs.
• The Georgetown Wet Weather Treatment Station includes construction of a CSO wet-weather treatment station between the Brandon Street and South Michigan Street Regulator Stations, conveyance pipeline, and a new outfall structure to release the treated water into the Duwamish Waterway. When constructed, the station will have the capacity to treat up to 66 million gallons of combined rain and wastewater a day that would otherwise have discharged directly to the Duwamish without treatment during storm events. Construction is expected to begin in 2017. More information on the project is available at http://www.kingcounty.gov/environment/wtd/Construction/Seattle/BrandonMichiganCSO.aspx.
• The Rainier Valley Wet Weather Storage project will install a new sewer pipeline near the intersection of Rainier Avenue South and Martin Luther King Boulevard South in Seattle to divert flows to an existing pipe with extra capacity. Any excess flows from this area will be routed to a new storage tank at the intersection of South Hanford Street and South 27th Avenue. Construction is expected to begin in 2015. More information on the project is available at http://www.kingcounty.gov/environment/wtd/Construction/Seattle/HanfordCSO.aspx.
• The Highland Park and South Park GSI project is exploring the feasibility of reducing West Michigan and Terminal 115 CSOs using GSI or a combination of GSI and storage for sewer overflows. Based on street layouts and results of soils and groundwater testing, King County will discuss options for GSI with the community. GSI construction is expected to begin in 2016, and if needed, work on the storage pipe portion of the project would begin in 2019. More information on the project is available at http://www.kingcounty.gov/environment/wtd/Construction/Seattle/WMichT115CSO.aspx.
RainWise Rebate Program Rain gardens and cisterns can help control stormwater that enters the combined sewer system. Through a memorandum of agreement (MOA) with Seattle Public Utilities (SPU), WTD began offering opportunities for residents to participate in the RainWise Rebate Program where there are potential benefits to the County’s CSO control projects. The program pays for rain gardens and cisterns on private property in some parts of the city and was started by SPU in 2010. Since then, over 250 rain gardens and cisterns are now helping to control stormwater runoff and preventing CSOs. The MOA outlines the cost-sharing and other responsibilities of each agency. More information on the RainWise program is available at http://www.kingcounty.gov/environment/wastewater/CSO/BeRainwise.aspx.
Water Quality Assessment and Monitoring Study Work began in 2013 on the Water Quality Assessment and Monitoring Study (assessment) that was called for in Ordinance 17413. The purpose of the study is to examine how upcoming Protecting Our Waters projects can be sequenced and integrated to optimize the investment being made in these
RWSP 2013 Comprehensive Review 2-13

Chapter 2. RWSP Achievements in 2007−2013
projects. In September 2013, the County Council approved the study’s scope of work through Motion 13966. The assessment will examine local water quality issues near King County CSOs in Elliott Bay, Lake Union/Ship Canal, and the Duwamish River. Results from the assessment will be used to inform the next CSO Control Program review and plan update, which is due to regulators in 2018. The goals of the assessment are as follows:
• Provide information on how CSO control can work in conjunction with other water quality projects to maximize water quality improvements
• Identify opportunities to lower the cost of CSO control
• Identify technologies that could potentially improve water quality such as GSI
• Establish baseline conditions for mandatory post-construction monitoring of CSO control projects
More information on the assessment is available at http://www.kingcounty.gov/environment/wastewater/CSO/WQstudy.aspx.
Implementing the Sediment Management Plan As a part of RWSP implementation, WTD is carrying out a Sediment Management Plan (SMP) to remediate contaminated sediments near CSO outfalls. Most of the contamination occurred in the early to mid-1900s. The SMP addresses sediment contamination cleanups that are required under federal Comprehensive Environmental Response, Compensation, and Liability Act (Superfund) and state Model Toxic Control Act regulations. The SMP’s objectives are to repair potential environmental damage through a timely, efficient, and economical process. The following activities were carried out as part of implementing the SMP during 2007–2013:
• Completed cleanup of the former Denny Way CSO site off of Myrtle Edwards Park in Seattle and, in 2008, began monitoring sediment quality (to be completed in 2018)
• Improved modeling to predict deposition of contaminants around CSO outfalls
• Completed post-construction monitoring of the Diagonal/Duwamish cleanup site
• Conducted sampling of sediments in the East Duwamish Waterway Superfund site and as part of the East Waterway Group finalized the East Duwamish Waterway remedial investigation and completed a draft feasibility study. The East Waterway Group is a partnership between the City of Seattle, King County, and the Port of Seattle.
More information on the SMP is available at http://www.kingcounty.gov/environment/wastewater/SedimentManagement.aspx .
Cleaning Up the Lower Duwamish Waterway Superfund Site King County continues to work to improve water quality in the Lower Duwamish Waterway Superfund site through actions such as controlling CSOs, restoring habitat, capping and removing sediments, and controlling toxicants from industries and stormwater runoff. Since the 1960s, regional source control
2-14 RWSP 2013 Comprehensive Review

Chapter 2. RWSP Achievements in 2007−2013
efforts have reduced flows of industrial waste and sewage into the Lower Duwamish by 98 percent, or 27 billion gallons per year.
The County is also partnering with the City of Seattle, the Port of Seattle, and the Boeing Company as part of the Lower Duwamish Waterway Group (LDWG). The LDWG has been working with EPA and Ecology since 2001 to study contamination and determine the best and most effective alternatives to clean up the Lower Duwamish Waterway. During the 2007–2013 timeframe, the LDWG completed a remedial investigation and feasibility study for the Lower Duwamish Waterway Superfund Site and started a study to better understand who is eating contaminated seafood from the Duwamish River.
In 2013, EPA issued the Proposed Plan for the Lower Duwamish Waterway Superfund Site, which presents a Preferred Alternative to clean up contamination in the in-waterway portion of the Lower Duwamish Waterway Superfund site. EPA is expected to issue a Record of Decision in third quarter of 2014 to direct cleanup actions and long-term monitoring.
The County, in partnership with the LDWG, carried out engagement and outreach activities with interested industries, businesses, residents, and environmental and community groups throughout the efforts to develop the remedial investigation, the feasibility study, and on EPA’s proposed cleanup plan.
The process to allocate cleanup costs among potentially responsible parties, including King County, is under way.
In addition, WTD’s Lower Duwamish Waterway Green Grants Program began providing grant funding in 2011 for air or water quality improvement projects, environmental education, and community outreach efforts within the Duwamish River Valley. The funding supports projects that reduce air pollution, prevent CSOs, and prevent pollution from going into the Duwamish River. Past projects have included roadside rain gardens, outreach to businesses on how to implement best management practices to stop stormwater pollution, an art installation that measures air quality, and wetland restoration.
More information on the County’s efforts to clean up the Lower Duwamish Waterway is available at http://www.kingcounty.gov/environment/wastewater/Duwamish-waterway.aspx.
Creating Resources from Wastewater RWSP policies provide guidance on beneficial uses for byproducts from wastewater treatment—biosolids and digester gas from the solids treatment process and reclaimed water from the liquids treatment process. This section provides information on achievements made in 2007−2013 through WTD’s Biosolids Recycling Program, Energy Recovery and Efficiency Program, and Reclaimed Water Program.
Biosolids Recycling Program Biosolids are the nutrient-rich organic material produced by treating wastewater solids. After being processed and treated, biosolids are beneficially used as a fertilizer and soil amendment in agriculture and forestry or as an ingredient in compost. In 2007−2013, King County recycled 100 percent of its biosolids for these uses; the description of uses for 2007−2012 is provided in each year’s RWSP annual reports.
RWSP 2013 Comprehensive Review 2-15
Chapter 2. RWSP Achievements in 2007−2013
WTD launched the County’s biosolids brand, Loop®, in 2012. The development of the Loop brand is part of a long-term strategic goal to increase public support and strengthen demand for biosolids. More information on the benefits and uses of Loop is available at http://www.loopforyoursoil.com/.
In 2013, 115,801 wet tons of Loop biosolids were produced at the West Point, South, and Brightwater treatment plants, all of which were recycled and used beneficially as a nutrient-rich soil amendment for forestry and agricultural applications or was used to make compost. The sale of biosolids generated over $188,000 in fertilizer revenue from customers.
The biosolids were used as a fertilizer andsoil amendment for a variety of applications:
• About 6,800 acres of dryland wheat in Douglas County as part of the Boulder Park Soil Improvement Project
• About 2,600 acres of hops, orchards, and wheat at Natural Selection Farms in the Yakima Valley
• Over 600 acres of Douglas fir plantations on state forestlands and on Hancock’s Snoqualmie Forest as part of the Mountains to Sound Greenway Biosolids Forestry Program
Highlights of other achievements for the Biosolids Recycling Program in 2007−2013 are as follows:
• Construction of the West Point Digestion Improvement project was completed. The project will enhance the reliability of the West Point plant’s solids digestion system and reduce the risk of digester upsets under current and future solids loading conditions.
• Progress was made on a project at the West Point Plant to upgrade and replace the screening equipment that filters out trash and other debris. The project will meet the state’s biosolids management rule requiring significant removal of manufactured inerts (trash and plastics) from biosolids. Construction of the screening project is expected to be complete in late 2014.
• An analysis of alternative uses and market opportunities for biosolids was completed in 2009. The analysis provided cost-benefit information for land application, composting, and alternative energy production. The process confirmed that land application and composting of biosolids are the most cost-effective and reliable options at this time. The report on the alternative uses and market opportunities is available at http://www.kingcounty.gov/environment/wastewater/Biosolids/DocumentsLinks.aspx.
• GroCo compost, which is made with Loop is now “Declare” certified, which meets Living Building Challenge (LBC) standards. Declare offers LBC project teams a materials guide for product specification. LBC is the built environment's most rigorous sustainability performance standard. More information on the Declare label is available at http://www.declareproducts.com/.
Several research studies were conducted. Highlights from the studies are listed below.
• In 2008, WTD participated in a study through the Northwest Biosolids Management Association to quantify the carbon sequestration benefits of using biosolids and other organic residuals as a
2-16 RWSP 2013 Comprehensive Review

Chapter 2. RWSP Achievements in 2007−2013
soil amendment for land application. Results showed a significant increase in carbon stored in agricultural soils, indicating that use of biosolids as a soil amendment has the potential to reduce the carbon footprint while helping secure the sustainability of agriculture in the state. For example, the benefit of using Loop in 2012 offset over 42,000 tons of carbon dioxide equivalents, which is similar to taking 8,000 cars off the road that year (Figure 2-10). The results are similar for 2013. Because of investments in energy conservation, renewable energy production and carbon and nutrient recycling, the WTD is 70 percent of the way to being carbon-neutral in its operations.
Figure 2-10. WTD’s 2012 Carbon Impact
• In summer 2009, the County began collaborating on a carbon-sequestration demonstration project in a borrow pit at Island Center Forest on Vashon Island.3 Researchers are evaluating the ability of composted organic residuals (biosolids, food waste, and woody debris) to recover soil quality by capturing and storing carbon, improving soil health, and enhancing vegetation growth on this degraded site. Long-term monitoring in under way.
• In 2009, a biosolids research and demonstration garden was installed at South Treatment Plant. University of Washington scientists studied the safety of vegetables grown in a sandy loam soil mix and a biosolids compost soil mix. The research team noted that vegetables grown in the biosolids compost mix were deemed safe and the growth was considered lush.
More information on the County’s Biosolids Recycling Program is available at http://www.kingcounty.gov/environment/wastewater/Biosolids.aspx.
Energy Recovery and Efficiency Program RWSP policies call for the County to use digester gas, an energy-rich methane gas naturally produced as a byproduct of solids treatment, for energy and other beneficial purposes when it is cost-effective to do so. In addition, the County’s Strategic Climate Action Plan includes energy goals to implement energy efficiencies and increase renewable energy production.
3 A borrow pit is an area where material (usually soil, gravel or sand) has been dug for use at another location.
RWSP 2013 Comprehensive Review 2-17

Chapter 2. RWSP Achievements in 2007−2013
The South, West Point, and Brightwater treatment plants use digester gas to produce heat, electricity, and natural gas. At South Plant, digester gas that is not used for in-plant purposes is “scrubbed” to the quality required for pipeline natural gas and then sold to Puget Sound Energy.
A major achievement during 2007−2013 is the completion and startup of the Waste-to-Energy cogeneration system at the West Point Plant. The cogeneration system creates electricity from the facility’s digester gas and captures the heat generated from the influent pump engines. The system reduces West Point’s demand for electricity supplied from the power grid, and will provide a significant portion of West Point’s heat demand for most of the year. The cogeneration system, scheduled to be online in 2014, will produce about 18,000 megawatt hours (MWh) of “green” electricity each year. Seattle City Light will purchase power produced by the engines, including renewable energy credits. This partnership will help Seattle City Light achieve its 15 percent renewable energy goal by 2020 in accordance with Washington Initiative 937. The facility is expected to generate $1.4 million in annual revenue to WTD from the sale of green electricity.
Other achievements during 2007−2013 include:
• Replacement of blowers at the West Point and South plants with more efficient blowers.
• WTD’s energy team conducts energy audits on facilities that consume over 5,000 million British Thermal Units (MBtu) of annual energy. Results of the audits will inform future energy-efficiency capital projects.
• In 2012, a request for information was advertised inviting local developers and commercial owners to submit ideas for privately owned district energy systems that could extract and recover heat from WTD’s conveyance system.
More information on WTD’s energy program is available at http://www.kingcounty.gov/environment/wastewater/ResourceRecovery/Energy.aspx.
Reclaimed Water Program RWSP water reuse policies provide guidance to King County on the development and implementation of its Reclaimed Water Program. WTD has been safely producing and using reclaimed water since 1997.
Two major achievements in the Reclaimed Water Program occurred during 2007−2013 with the completion and startup of the Carnation and Brightwater treatment plants. Both facilities produce and distribute reclaimed water.
Reclaimed Water Planning Studies WTD participated in several reclaimed water planning studies during this timeframe. In 2007, WTD completed a preliminary analysis of reclaimed water options in the Green River Valley to answer questions raised by the Cities of Auburn, Covington, Kent, Renton, and Tukwila. Information from the study was incorporated into the reclaimed water comprehensive planning process that occurred in 2009–2012.
2-18 RWSP 2013 Comprehensive Review

Chapter 2. RWSP Achievements in 2007−2013
King County and the Covington Water District signed a memorandum of agreement in 2007 to jointly fund and pursue a phased approach to explore opportunities for reclaimed water development in the district’s service area. Results from this effort were incorporated into the reclaimed water comprehensive planning process, described below.
In 2008–2009, WTD worked with the SPU on Seattle’s economic analysis of the potential for providing reclaimed water from the Brightwater Treatment Plant to large irrigators and other potential users of nonpotable water in north Seattle. Information from this analysis was incorporated into the reclaimed water comprehensive planning process.
In 2009−2012, WTD initiated a reclaimed water comprehensive planning process to determine whether and how King County should expand its existing Reclaimed Water Program over the next 30 years. WTD worked closely with local water and sewer utilities throughout the process, and a database was developed on potential reclaimed water uses in the region. WTD developed and analyzed three conceptual strategies for reclaimed water satellite or skimming facilities to serve potential reclaimed water uses.
Reclaimed Water Production and Use in 2013 As part of RWSP annual reports, information is provided on reclaimed water used each year for in-plant or off-site purposes. Information for 2013 follows.
South Treatment Plant South Plant produced 81.7 million gallons (MG) of reclaimed water in 2013. The majority of the water was used at the plant for process water and landscape irrigation. If the reclaimed water were not available for these uses, WTD would have to use potable water, which would have increased the facility’s operational costs by $155,380 in 2013.
About 2.94 MG of reclaimed water was distributed and used off site by reclaimed water customers, including the City of Tukwila. The city uses reclaimed water for irrigation of the Starfire Sports Complex and wetland plants nursery, and for city public works uses such as street sweeping and sewer flushing.
West Point Treatment Plant The West Point Plant produced 189.2 MG of reclaimed water in 2013. All of the reclaimed water produced was used at the plant site for process water. If the reclaimed water were not available for these uses, WTD would have to use potable water for such applications, which would have increased the facility’s operational costs by $1,242,411 in 2013.
Carnation Treatment Plant In 2013, the Carnation Plant discharged 31.93 MG of reclaimed water to enhance a wetland in the County's Chinook Bend Natural Area.
Brightwater Treatment Plant About 30.2 MG of reclaimed water from the Brightwater Plant was distributed to the Brightwater Education and Community Center and the Willows Run Golf Course in 2013. The water was used for irrigation, toilets/urinals, and public art. In addition, 336 MG of reclaimed water was produced and used
RWSP 2013 Comprehensive Review 2-19

Chapter 2. RWSP Achievements in 2007−2013
for process water at the plant. If the reclaimed water were not available for these uses, WTD would have had to use potable water, which would have increased the facility’s operational costs by $1,802,235 in 2013.
Protecting our Assets It would cost more than $20 billion to build King County’s wastewater system from the ground up today, and the value of existing facilities is estimated at about $6 billion. RWSP policies provide guidance for an asset management program to maintain and repair equipment and facilities and to develop an asset management plan. In addition, the Council-approved scope of work (Motion 13758) for the 2013 RWSP comprehensive review report included adding information on assumptions regarding asset management and replacement.
Maintaining the region’s wastewater assets is a high priority for WTD. The division’s Asset Management Program oversees inspection of the regional treatment facilities and conveyance system, repairing and replacing aging facilities, and developing plans to address ongoing system issues. The primary objectives of the program are to manage the whole lifecycle of assets in a manner that minimizes the total costs of owning, maintaining, and operating them; deliver a level of service that meets regulatory requirements and ratepayer expectations; and fulfill WTD’s mission to protect public health and enhance the environment by treating and reclaiming water, recycling solids, and generating energy. WTD continues to update its asset management plans and practices. The assumptions, or principles, that guide WTD’s Asset Management Program are as follows:
• Applying the principle that proper management of the region’s wastewater assets is essential for public and environmental health and safety.
• Using Enterprise Asset Management (EAM) to standardize the management of assets across sections, facilities, business units, and geographical locations. EAM integrates techniques for control and optimization throughout asset lifecycles, including design, commissioning, operations, and replacement. Effective EAM allows WTD to do the following:
o Maximize return on assets
o Balance costs and risks
o Improve asset decision making
o Comply with required regulations
o Increase asset service responses and enhance efficiency
o Lower total cost of ownership
• Maintaining an accurate asset inventory is essential for a successful asset management program.
2-20 RWSP 2013 Comprehensive Review
Chapter 2. RWSP Achievements in 2007−2013
• Understanding criticality (the likelihood of failure [asset condition] and consequence of failure) is key to managing risk and fulfilling WTD’s mission.
• Continually assessing and confirming criticality of an asset to ensure efficient allocation of resources is of utmost importance and is an ongoing process.
• Ensuring good records management and ongoing tracking of asset performance provides for condition-based maintenance and better decision making about the needs and life of an asset
• Employing “Maintenance Best Practices” leads to better outcomes for facility operations and ratepayers:
o Improved asset utilization and performance
o Reduced capital cost
o Reduced asset-related operating costs
o Extended life of asset
These principles form the basis of WTD’s Strategic Asset Management Plan (SAMP) that was updated in 2010. Because asset management tools evolve over time and lessons learned on optimizing asset use is an ongoing process, WTD continues to update its SAMP; the next update is scheduled to be complete by the end of 2015.
WTD’s facilities inspection team performs regularly scheduled condition assessments on the conveyance system and facility structures. Results of the assessments and any rehabilitation recommendations are reported in a Facilities Inspection Annual Work Plan. As of 2012, WTD’s closed-circuit television (CCTV) crew has inspected a million lineal feet of pipe over 10 years.
In 2008, WTD completed a study on the vulnerability of major wastewater facilities to flooding from sea-level rise. As effects of climate change continue to grow, it is important to assess the potential for flooding at WTD’s facilities that are adjacent to tidally influenced water bodies. The study identified these facilities and their potential for flooding, considering the effects of both sea-level rise and storm surges, and then recommended the next steps in planning for this change. The study is available at http://www.kingcounty.gov/environment/wastewater/CSI/Library/SeaLevelRise.aspx.
Ongoing and future activities to continually improve how WTD protects its assets include the following:
• Develop a tracking system in the computerized maintenance management system (CMMS) to compile energy efficiency data to support asset refurbishment and replacement projects.
• Continue work to produce long-term capital restoration and replacement forecasts.
• Conduct a best practices assessment. WTD is reviewing other agencies’ best practices.
RWSP 2013 Comprehensive Review 2-21

Chapter 2. RWSP Achievements in 2007−2013
• Implement a resiliency and recovery. The program includes conducting a susceptibility review of the region’s wastewater facilities with respect to their vulnerability to damage in the event of a disaster, the potential extent of such damage, and ways to improve recoverability of affected facilities immediately after a disaster.
• Complete the SAMP update.
More information on WTD’s asset management activities are available at http://www.kingcounty.gov/environment/wtd/Construction/Assets.aspx.
2-22 RWSP 2013 Comprehensive Review

Chapter 3 Financial Stewardship
The RWSP financial policies guide the County on the long-term financing. The policies provide direction for establishing annual sewer rates and capacity charges, and for allocating wastewater system costs between existing and new customers. Appendix A provides information on how the RWSP financial policies were implemented in 2007−2013.
This chapter describes how annual sewer rates and capacity charges are established, gives sewer rate and capacity charge projections through 2030, and compares them to projections in previous RWSP comprehensive review reports. The chapter also describes programs implemented in 2007−2013 to increase efficiency and policy guidance on construction fund and emergency reserves.
Establishing Annual Sewer Rate and Capacity Charge The RWSP calls for existing customers to pay a monthly sewer rate to cover the portion of the existing and expanded system that serves them. New customers pay costs associated with the portion of the existing system that serves them and costs associated with expanding the system to serve future customers, in accordance with a fundamental principle of the RWSP that “growth pays for growth.”
The charges for new customers are collected through a combination of the monthly sewer rate and the capacity charge. The capacity charge is designed to provide a means by which the growth customers (new connections to the system) pay their equitable share of the cost of their service. The basic approach is to identify (allocate) the costs of serving each customer group and then design rates and the capacity charge so that each pay their equitable share.
At the request of the County Council’s Regional Water Quality Committee (RWQC), a Financial Policies Work Group (FPWG) was formed in 2009 to review the RWSP financial policies. The FPWG was comprised of staff representing MWPAAC, sewer districts, City of Seattle, City of Bellevue, the King County Executive, and the King County Council. The FPWG reviewed the capacity charge methodology in depth. Although the FPWG had lengthy discussions regarding how certain costs associated with growth are allocated either to existing customers or current growth customers (those connecting between 2003 and 2030), there was no consensus on changing any of the allocations used to calculate the capacity charge. The RWQC was briefed on the work of the FPWG during summer 2013. Based on the briefing, the capacity charge discussion at RWQC has been tabled for now.
Factors that affect the sewer rate and capacity charge include the number of Residential Customer Equivalents (RCEs), wastewater operating expenditures, capital program expenses, number of new connections, and debt financing. In addition, these charges are affected by the allocation of capital program costs between customers establishing new connections to the system and those with existing connections. Figure 3-1 illustrates the relationship between the monthly rate and the capacity charge.
3-1 RWSP 2013 Comprehensive Review

Chapter 3. Financial Stewardship
Figure 3-1. Relationship Between the Monthly Sewer Rate and Capacity Charge
Residential Customer Equivalents King County uses an RCE as the basic unit for charging local agencies for wastewater services. Agencies are charged one RCE for each single detached housing unit, regardless of size or water consumption. For multifamily dwellings and commercial and industrial establishments, agencies are charged on the basis of water consumption. For each 750 cubic feet of water per month consumed, the agency is charged for one RCE.
Local agencies employ a variety of means of allocating these costs to their customers. For example, in the City of Seattle, the charge for all customers—single-family, multifamily, commercial, and industrial—is based on water consumption. Other agencies charge per RCE.
Table 3-1 shows RCEs by category for 1994 to 2013. During this period, total RCEs increased by a little over 59,000 relative to 1994 levels or an average annual percentage growth of 0.45 percent. This aggregate change masks the underlying differences among the categories of customers. For example, from 1994 to 2013, single-family residential RCEs increased by 90,354, which was partially offset by a decline in commercial and multifamily RCEs of approximately 31,000. In addition, the recent recession dampened RCE growth during the 2009 to 2012 period, with a 0.4 percent decrease in 2009. The 2013 growth of 1.3 percent is seen as a bounce back from the recession-induced low growth period of 2009 through 2012. Figure 3-2 shows the comparison of RCE forecasts for 2007 and for 2013.
It is assumed that RCEs will continue to grow beyond 2013 levels, increasing at approximately 0.43 percent annually through 2030. The County continually monitors for changes in underlying assumptions and will adjust these projections accordingly.
The long-term forecast of RCEs is a trend projection intended to provide a conservative financial forecast (relatively low, steady growth) for the County’s wastewater utility to avoid underestimating sewer rates, especially in the near term. As such, it does not attempt to reflect swings in the business cycle or reflect
3-2 RWSP 2013 Comprehensive Review

Chapter 3. Financial Stewardship
the basis of capacity needs and timing. As recently shown, RCEs can be affected by short-term swings as the result of the economic climate.
Table 3-1. Residential Customer Equivalents (1994–2013)
Year Single Family Residential
% Change Commercial & Multifamily
% Change Total % Change
1994 296,757 1.3% 362,300 -0.4% 659,057 0.4%
1995 299,963 1.1% 367,828 1.5% 667,791 1.3%
1996 303,292 1.1% 367,894 0.0% 671,186 0.5%
1997 307,340 1.3% 371,514 1.0% 678,854 1.1%
1998 310,878 1.2% 376,426 1.3% 687,304 1.2%
1999 315,878 1.6% 378,219 0.5% 694,097 1.0%
2000 320,117 1.3% 376,705 -0.4% 696,822 0.4%
2001 325,125 1.6% 377,235 0.1% 702,360 0.8%
2002 329,265 1.3% 355,830 -5.7% 685,095 -2.5%
2003 334,555 1.6% 350,578 -1.5% 685,133 0.0%
2004 342,582 2.4% 345,327 -1.5% 687,909 0.4%
2005 349,535 2.0% 340,282 -1.5% 689,817 0.3%
2006 357,115 2.2% 333,819 -1.9% 690,934 0.2%
2007 364,044 1.9% 338,902 1.5% 702,946 1.7%
2008 370,621 1.8% 336,225 -0.8% 706,846 0.6%
2009 375,513 1.3% 328,282 -2.4% 703,795 -0.4%
2010 378,148 0.7% 326,243 -0.6% 704,391 0.1%
2011 381,031 0.8% 326,247 0.0% 707,278 0.4%
2012 383,903 0.8% 324,991 -0.4% 708,894 0.2%
2013 387,111 0.8% 331,049 1.9% 718,160 1.3%
RWSP 2013 Comprehensive Review 3-3

Chapter 3. Financial Stewardship
Figure 3-2. 2007 and 2013 Residential Customer Equivalent Forecasts (1993 to 2030)
Sewer Rate and Capacity Charge Projections
Sewer Rate Long-term projections of the monthly sewer rate are not strictly comparable to those presented each year in the annual rate process. The rates presented during the annual rate process incorporate the most up-to-date data and the assumption that not all of the capital improvement program (CIP) budget will be expended during the year. Historically, in a given year, actual capital spending is 10 to 25 percent less than budgeted for the entire program. This is largely because projects are delayed for a variety of reasons, including permitting issues, unknown geotechnical conditions, and unforeseen construction delays. Accounting for this actual spending lowers the proposed rate. However, long-term planning assumes that 100 percent of the costs are incurred by completion. Consequently, the long-run rate projections reflect an assumption that 100 percent of the annual CIP budget is expended each year.
Figure 3-3 presents the most current mid-term view of the original 1998 RWSP rate projections, the rate projections from the RWSP 2006 Comprehensive Review, and the actual rates through 2014 (all rates include inflation). Figure 3-4 presents long-term sewer rate projections from the RWSP 2006 Comprehensive Review and updated RWSP sewer rate projections with inflation (2002–2030) and compares them with the 2013 long-term projections.
3-4 RWSP 2013 Comprehensive Review

Chapter 3. Financial Stewardship
Figure 3-3. Sewer Rate Projections with Inflation (2002–2014)
Figure 3-4. Sewer Rate Projections with Inflation (2002–2030)
$0.00
$10.00
$20.00
$30.00
$40.00
$50.00
$60.00
2002 2003 2004 2005 2006 2007 2008 2009 2010 2011 2012 2013 2014
Original RWSP Forecast
2006 RWSP Update Forecast
2013 Adopted Rate
Comparison of Monthly Wastewater Rate Projections1998 Original RWSP, 2006 RWSP Update and 2013 Adopted Rate
(monthly rates with inflation)
Actual rates through $39.79 2014 rate
`
RWSP 2013 Comprehensive Review 3-5
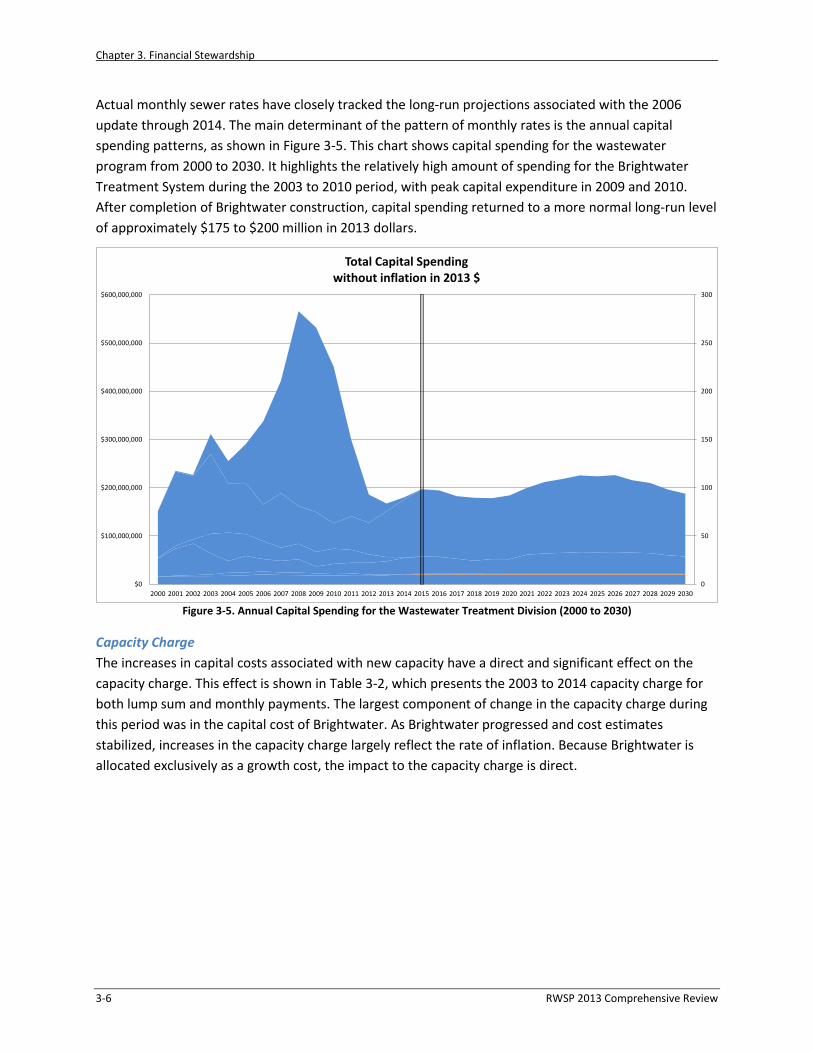
Chapter 3. Financial Stewardship
Actual monthly sewer rates have closely tracked the long-run projections associated with the 2006 update through 2014. The main determinant of the pattern of monthly rates is the annual capital spending patterns, as shown in Figure 3-5. This chart shows capital spending for the wastewater program from 2000 to 2030. It highlights the relatively high amount of spending for the Brightwater Treatment System during the 2003 to 2010 period, with peak capital expenditure in 2009 and 2010. After completion of Brightwater construction, capital spending returned to a more normal long-run level of approximately $175 to $200 million in 2013 dollars.
Figure 3-5. Annual Capital Spending for the Wastewater Treatment Division (2000 to 2030)
Capacity Charge The increases in capital costs associated with new capacity have a direct and significant effect on the capacity charge. This effect is shown in Table 3-2, which presents the 2003 to 2014 capacity charge for both lump sum and monthly payments. The largest component of change in the capacity charge during this period was in the capital cost of Brightwater. As Brightwater progressed and cost estimates stabilized, increases in the capacity charge largely reflect the rate of inflation. Because Brightwater is allocated exclusively as a growth cost, the impact to the capacity charge is direct.
0
50
100
150
200
250
300
$0
$100,000,000
$200,000,000
$300,000,000
$400,000,000
$500,000,000
$600,000,000
2000 2001 2002 2003 2004 2005 2006 2007 2008 2009 2010 2011 2012 2013 2014 2015 2016 2017 2018 2019 2020 2021 2022 2023 2024 2025 2026 2027 2028 2029 2030
Total Capital Spending without inflation in 2013 $
3-6 RWSP 2013 Comprehensive Review

Chapter 3. Financial Stewardship
Table 3-2. WTD Capacity Charge (2003−2014)
Year Monthly Charge Total Lump-Sum Paymenta Total When Paid Monthly
2003 $17.60 $2,197 $3,168
2004 $18.00 $2,247 $3,240
2005 $34.05 $4,251 $6,129
2006 $34.05 $4,251 $6,129
2007 $42.00 $5,196 $7,560
2008 $46.25 $5,721 $8,325
2009 $47.64 $5,893 $8,575
2010 $49.07 $6,070 $8,833
2011 $50.45 $6,241 $9,081
2012 $51.95 $6,427 $9,351
2013 $53.50 $6,618 $9,630
2014 $55.35 $6,847 $9,963
a.Current policy discounts lump sum payments at 3.2% percent.
Although total RCEs (new plus existing) have grown at a relatively slow rate recently, the number of newly connecting customers has equaled or surpassed originally expected levels. While new connections averaged more than 9,500 RCEs per year since the beginning of the capacity charge program in 1990, they averaged approximately 10,000 per year between 2000 and 2013. This average masks some volatility in that period, especially during the economic downturn of 2008 to 2013 when the average was closer to 7,500 new connections per year. The forecast begins with a conservative assumption on a recovery to 9,500 new connections in 2014 before moving to approximately 10,000 a year for 2015 to 2020, a level supported by longer-term demographic and employment trends for the County’s wastewater service area. The projections decrease to approximately 9,600 per year after 2020, reflecting a slowing in projected population growth.
Continuous Improvement Programs
Productivity Initiative Pilot Program WTD’s Productivity Initiative Pilot Program was developed to identify and implement ways to increase efficiency. This 10-year incentive program applied certain private-sector business practices, including the establishment of an incentive-based cash payment to employees in the wastewater program, to reduce
RWSP 2013 Comprehensive Review 3-7
Chapter 3. Financial Stewardship
operating costs, increase productivity, and continue a high level of service and environmental protection for WTD’s customers.
The pilot program ended in April 2011. The program generated nearly $84 million in savings for ratepayers over its 10-year lifespan.
More information on the Productivity Initiative Pilot Program, including the comprehensive review report of the program, is available at http://www.kingcounty.gov/environment/wtd/About/Finances/PI.aspx.
Bright Ideas Program WTD is committed to continuous improvement. As a follow-up to the Productivity Initiative, WTD established an employee-initiated program called Bright Ideas. The program encourages creative problem-solving throughout the organization and uses employees’ ideas to improve how WTD does business. Since Bright Ideas was launched in September 2012, WTD employees have submitted more than 550 ideas. It is expected that the program will result in over $400,000 in savings in 2014.
Policy Guidance on Construction Fund and Emergency Reserves The King County Council adopted Ordinance 17480 in December 2012, amending the RWSP comprehensive review reporting policies. The ordinance calls for including information related to policy guidance on WTD’s construction fund and emergency reserves in RWSP comprehensive reviews.
Policy guidance on the construction fund and emergency reserves is provided in Motion 13798, which was adopted by the County Council in December 2012. The development of the motion resulted from the work conducted by the FPWG in its review of RWSP financial policies. The direction provided in the motion continues to make sense and serve WTD’s ratepayers well. WTD will continue to review this guidance as directed in the motion.
In regards to the construction fund and emergency reserves, the motion states:
2. Reserves in the Wastewater Treatment Division operating and capital budgets.
a. The current practice of maintaining a liquidity reserve of at least ten percent of operating expenses plus five million dollars in the construction fund has been viewed favorably by rating agencies and has improved bond ratings, and should therefore continue.
b. The proposed financial plan for each fiscal year should include a minimum cash balance, to be utilized for reserves, at the beginning of the year equal to or greater than ten percent of operating expenses plus five million dollars in the construction fund.
c. If the cash balance or reserve has been utilized in the current or preceding year, the financial plan will show how and when it will be restored to the minimum.
d. In addition to this minimum cash balance, the financial plan should include an emergency capital reserve at the beginning of year with a minimum of fifteen million
3-8 RWSP 2013 Comprehensive Review

Chapter 3. Financial Stewardship
dollars to be used for unanticipated system repairs or equipment replacement in the event of a natural disaster or some unforeseen system failure.
e. Interest earnings on the emergency capital reserve shall be available for operations.
f. If the emergency capital reserve has been utilized in the current or preceding year, the financial plan will show how the capital reserve will be replenished to fifteen million within five years.
g. As a part of each Regional Wastewater Services Plan review and update, the dollar amounts for reserves stipulated in this motion should be reviewed to ensure they are appropriate in future years.
RWSP 2013 Comprehensive Review 3-9

Chapter 3. Financial Stewardship
3-10 RWSP 2013 Comprehensive Review

Chapter 4 Forecasting Future Wastewater Treatment Plant Capacity Needs
A major component of the RWSP 2013 comprehensive review included evaluating and updating future regional wastewater treatment capacity needs. This chapter summarizes this analysis, provides more detail on methodology and findings, and discusses the findings as they relate to future treatment plant capacity needs.
Summary In general, WTD updates its treatment plant forecasts every 10 years using updated population and employment forecasts provided by the Puget Sound Regional Council (PSRC). WTD also evaluates and updates other key planning assumptions, such as water use, water conservation, and the service area growth rate. The last major forecasting update occurred as part of the RWSP 2004 update and used PSRC’s 2003 forecast. The results found that the difference in overall change between population forecasts over the planning period and change in planning assumptions was insignificant with respect to the wastewater system’s treatment capacity needs and confirmed the need and timing for the Brightwater Treatment Plant and the anticipated expansion of South Treatment Plant in 2029.
For this review, WTD used PSRC’s 2013 Land Use Forecast as input for population and employment numbers and worked closely with the Metropolitan Water Pollution Abatement Advisory Committee’s (MWPAAC) Engineering and Planning Subcommittee (E&P Subcommittee) in May through December 2013 to update RWSP planning assumptions. WTD also met with individual agencies and consulted the water and sewer comprehensive plans of several local agencies. This information along with operational data from the treatment plants over the past several years was used to forecast treatment plant capacity needs through 2060.
Key findings from the analysis are as follows:
• Regional population continues to increase.
• Treatment plant solids loadings will continue to grow in proportion with population growth.
• There was a 15 percent reduction in average wet-weather flow (AWWF) over the last decade, which aligns with reduction in water use seen from 2000 to 2010. Because of this and projected future water use and conservation, the AWWF capacity needs are less than forecast previously.
• Projections of future peak flows for the treatment plants are being developed as part of the 2015 Conveyance System Improvement Program update. Capacity requirements will be reevaluated when these projections become available.
The analysis confirmed the benefits of having a three-plant regional system. Findings indicate that with the Brightwater Plant, there is sufficient treatment plant capacity until the 2030s. Current forecasts indicate that solids loadings capacity will be needed sooner than AWWF capacity at all three plants, which could require additional equipment and digesters to handle the solids capacity needs. The forecasts indicate that a full expansion at South Treatment Plant is unlikely to be needed in 2029 as
RWSP 2013 Comprehensive Review 4-1

Chapter 4. Forecasting Future Wastewater Treatment Plant Capacity Needs
previously projected. WTD will continue to monitor the factors and trends that affect treatment plant capacity needs.
Methodology WTD’s population and employment forecasts generally coincide with the most recent federal census data. For this forecast, the current baseline year is 2010; the previous baseline year was 2000. A 50-year planning horizon was used for this current forecasting effort.
The method used to forecast wastewater treatment plant flows and solids loadings (wasteloads) is to multiply the population and employment forecasts by flow and wasteload factors representing average volumes generated per person:
• AWWF has historically been used as the main indicator of treatment plant capacity needs. The South Plant and Brightwater Plant service areas are served by separated sewer systems. AWWF for these service areas is defined as the average of all flows during November through April. For the West Point Plant, the AWWF is defined as the average of all non-storm flows during November through April because the service area includes combined sewers and the plant has wet weather treatment capacity above its secondary treatment capacity.
• Solids must be treated to ensure compliance with National Pollution Discharge Elimination System (NPDES) permit limitations. Biological oxygen demand (BOD) and total suspended solids (TSS) entering the plants are measured daily. Biosolids (Loop) leaving the plants are also measured. The measurements are used in estimating future solids loading.
Peak flows to the treatment plants are also important in evaluating capacity needs. Peak flows represent the highest combination of base flow and infiltration/inflow (I/I) expected to enter a wastewater system during wet weather over a set time period (for example, 30-minute increments). The information needed to forecast the peak flows is being generated as part of the 2015 Conveyance System Improvement (CSI) Program update; therefore, peak flow forecasts for the treatment plants will be generated following completion of the update.
Planning Assumptions The planning assumptions used during this update compared to those used for the 2000 baseline forecasts are shown in Table 4-1. WTD worked with MWPAAC’s E&P Subcommittee from May through December 2013 to update these planning assumptions. In addition, WTD had discussions with individual agencies, reviewed agency water and sewer comprehensive plans, and used flow monitoring and treatment plant data to inform the update of the planning assumptions.
4-2 RWSP 2013 Comprehensive Review

Chapter 4. Forecasting Future Wastewater Treatment Plant Capacity Needs
Table 4-1. Previous and Updated Planning Assumptions
Category Previous Assumption Updated Assumption
Planning horizon 2050 50-year planning horizon (2060)
Extent of eventual service area
Potentially sewerable areas in Urban Growth Areas of King County’s wastewater service area
Same
Future population
2003 Puget Sound Regional Council (PSRC) forecast
2013 PSRC forecast
Water use Base Year 2000 Seattle residential: 55 gpcd Other residential: 66 gpcd Commercial: 33 gped Industrial: 55 gped
Base Year 2010 Inside Seattlea Residential: 46 gpcd Commercial: 30 gped Industrial: 61−68 gped
Outside Seattle Residential: 54 gpcd Commercial: 18 gped Industrial: 45−56 gped
Water conservation
A 10% reduction in per-capita and per employee water consumption between 2000 and 2010 and no additional reduction after 2010
A 10% reduction in per-capita and per-employee water consumption between 2010 and 2030 and no additional reduction after 2030
Sewered area growth rate 90% of unsewered sewerable area in 2000 is sewered by 2030, 100% by 2050
100% of unsewered sewerable area in 2010 is sewered by 2060, at a rate of 20% per decade starting in 2010
Average wet weather I/I degradation (treatment plants)
Increase of 7% per decade up to a maximum of 28%
No degradation
Design flow (separated conveyance system)
20-year peak flow Same
Degradation of peak I/I (separated conveyance system)
Model basin peak I/I in year 2000 with assumed increase of 7% per decade up to a maximum of 28% (over 4 decades)
Model basin peak I/I in year 2010 with assumed increase of 7% per decade through the planning horizon
New system I/I (separated conveyance system)
1,500 gpad with 7% degradation per decade increase to approximately 2,000 gpad over 4 decades
2,000 gpad plus assumed I/I degradation (7% per decade) through the planning horizon
gpcd = gallons per-capita per day; gped = gallons per employee per day; gpad = gallons per acre per day. a Because of the large difference between industrial and commercial water usage inside and outside Seattle, the analysis used separate employment usage factors for Seattle. b The data did could not determine any apparent trend for AWWF I/I degradation rate.
RWSP 2013 Comprehensive Review 4-3

Chapter 4. Forecasting Future Wastewater Treatment Plant Capacity Needs
Population and Employment Forecasts WTD relies on population and employment forecasts from the Puget Sound Regional Council (PSRC) to project flows in sewer model basins, which are delineations of the WTD service area. Model basins are aggregated to forecast flows in treatment plant service areas.
For its latest flow projections, WTD is using the PSRC 2013 Land Use Forecast as input for population and employment numbers. The 2013 Land Use Forecast was developed using PSRC’s new UrbanSim model. The model forecasts growth for each year out to 2040 for residential populations and several employment categories.
Figure 4-1 shows previous and current population projections for the whole WTD service area. Actual population growth in sewered areas through 2010 is very close to the growth forecast as part of the RWSP 2004 Update. The total residential population served by sewers is now projected to grow by 49 percent from 2010 to 2050 using the 2013 forecast compared to 45 percent for the same period using the 2004 forecast. This population is predicted to grow by 8.6 percent between 2050 and 2060. Commercial and industrial employment dropped slightly between 2000 and 2010; PSRC projects a recovery in employment levels by 2020, with employment rising slightly above the 2004 forecast by 2040. Commercial employment is extrapolated to 2060 with an increase of 12 percent per decade, and industrial employment is extrapolated with an increase of 3 percent per decade.
Figure 4-1. Previous and Current Population and Employment Projections for the WTD Service Area
Figure 4-2 shows the West Point, South, and Brightwater service areas. It was assumed in this analysis that the service areas would remain the same throughout the planning period. Figures 4.3, 4-4, and 4-5 compare the previous and current population forecasts for each treatment plant service area. Projections of sewered residential population are generated for each model basin using the assumed
4-4 RWSP 2013 Comprehensive Review

Chapter 4. Forecasting Future Wastewater Treatment Plant Capacity Needs
sewered area growth rate shown in Table 4-1. All existing and future commercial and industrial employees were assumed to be served by sewers.
Figure 4-2. King County’s Wastewater Treatment Service Areas
RWSP 2013 Comprehensive Review 4-5

Chapter 4. Forecasting Future Wastewater Treatment Plant Capacity Needs
Figure 4-3. Previous (2004) and Current (2013) Population and Employment Forecasts For West Point Service Area
Figure 4-4. Previous (2004) and Current (2013) Population and Employment Forecasts For South Plant Service Area
4-6 RWSP 2013 Comprehensive Review

Chapter 4. Forecasting Future Wastewater Treatment Plant Capacity Needs
Figure 4-5. Previous (2004) and Current (2013) Population and Employment Forecasts For Brightwater Service Area
Average Wet Weather Flow Forecasts
Estimating Flow Factors for the Baseline Year The process to forecast AWWF for each treatment plant begins with determining both the AWWF and the average dry weather flow (ADWF) for the baseline year of 2010. Flow meters in the conveyance system were used to estimate Brightwater flows prior to its startup.
The next step is to determine the portion of the flows attributable to base wastewater flow and to infiltration and inflow (I/I). Base flow is estimated based on wet weather water usage.
WTD obtained winter water usage data from water purveyors in its service area. Actual residential gallons per-capita per day (gpcd) of winter water usage for the years 2008 through 2012 were averaged for each purveyor and further apportioned to each treatment plant basin using PSRC population data for the period. Daily consumption rates were estimated for residential, commercial, and industrial populations inside and outside Seattle because recent history shows that residential consumption is lower and commercial/industrial consumption is higher in Seattle than in other areas. Because water purveyors generally combine commercial and industrial per-employee daily usage (gped), WTD used King County Industrial Waste Program records to estimate per-employee industrial water use (process waste discharge plus the per-employee commercial daily usage).
Flow factors are the per-capita or per-employee daily flow to the wastewater system, estimated as the daily consumption rates discussed previously. The updated flow factors are shown in Table 4-2. The flow
RWSP 2013 Comprehensive Review 4-7
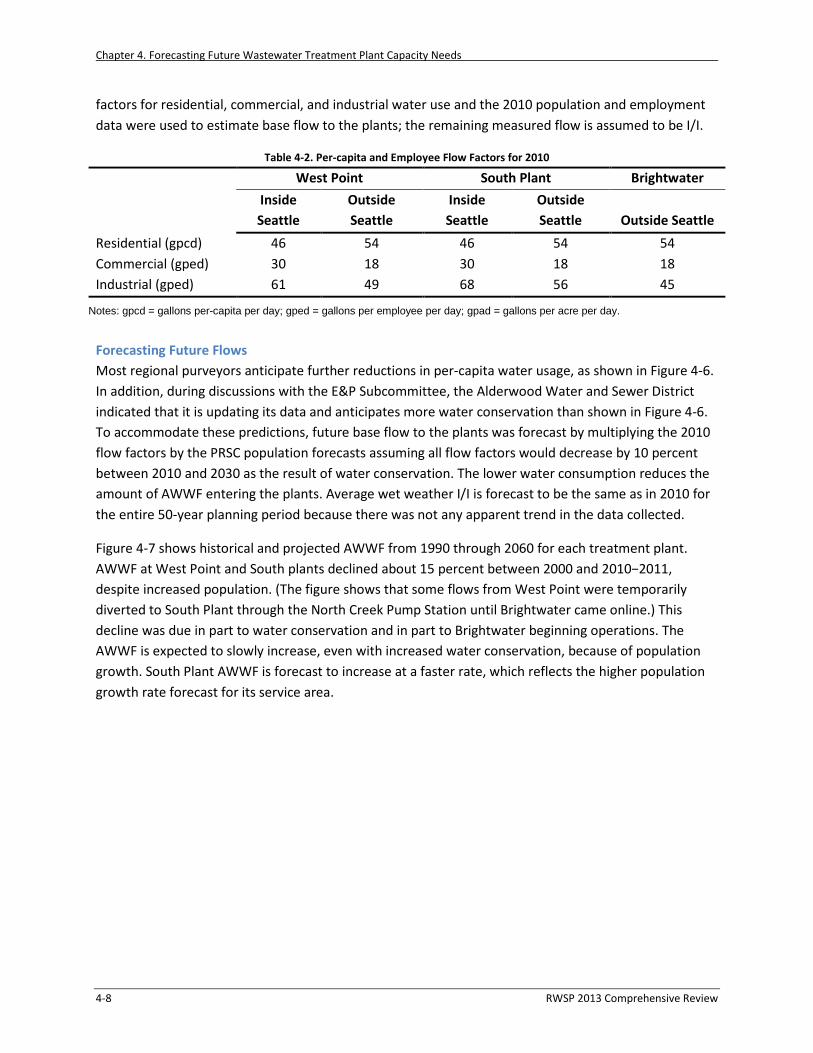
Chapter 4. Forecasting Future Wastewater Treatment Plant Capacity Needs
factors for residential, commercial, and industrial water use and the 2010 population and employment data were used to estimate base flow to the plants; the remaining measured flow is assumed to be I/I.
Table 4-2. Per-capita and Employee Flow Factors for 2010
Forecasting Future Flows Most regional purveyors anticipate further reductions in per-capita water usage, as shown in Figure 4-6. In addition, during discussions with the E&P Subcommittee, the Alderwood Water and Sewer District indicated that it is updating its data and anticipates more water conservation than shown in Figure 4-6. To accommodate these predictions, future base flow to the plants was forecast by multiplying the 2010 flow factors by the PRSC population forecasts assuming all flow factors would decrease by 10 percent between 2010 and 2030 as the result of water conservation. The lower water consumption reduces the amount of AWWF entering the plants. Average wet weather I/I is forecast to be the same as in 2010 for the entire 50-year planning period because there was not any apparent trend in the data collected.
Figure 4-7 shows historical and projected AWWF from 1990 through 2060 for each treatment plant. AWWF at West Point and South plants declined about 15 percent between 2000 and 2010−2011, despite increased population. (The figure shows that some flows from West Point were temporarily diverted to South Plant through the North Creek Pump Station until Brightwater came online.) This decline was due in part to water conservation and in part to Brightwater beginning operations. The AWWF is expected to slowly increase, even with increased water conservation, because of population growth. South Plant AWWF is forecast to increase at a faster rate, which reflects the higher population growth rate forecast for its service area.
West Point South Plant Brightwater
Inside Seattle
Outside Seattle
Inside Seattle
Outside Seattle Outside Seattle
Residential (gpcd) 46 54 46 54 54 Commercial (gped) 30 18 30 18 18 Industrial (gped) 61 49 68 56 45
Notes: gpcd = gallons per-capita per day; gped = gallons per employee per day; gpad = gallons per acre per day.
4-8 RWSP 2013 Comprehensive Review

Chapter 4. Forecasting Future Wastewater Treatment Plant Capacity Needs
Figure 4-6. Regional Water Purveyor Predicted Water Usage Reductions from Water Conservation
RWSP 2013 Comprehensive Review 4-9

Chapter 4. Forecasting Future Wastewater Treatment Plant Capacity Needs
Figure 4-7. Historical and Forecasted Average Wet Weather Flow at West Point, South, and Brightwater Treatment Plants, 1990−2060
Wasteload Forecasts
Estimating Loading Factors for the Baseline Year Solids loading to the treatment plants is directly related to population and employment. Biological oxygen demand (BOD) and total suspended solids (TSS) are measured daily at each treatment plant. To estimate existing (2010) wasteloads, the influent BOD and TSS measurements from 2007 through 2012 for each plant were averaged and adjusted for flow transfers to or from Brightwater. South Plant loads included septage from septage haulers, solids from the Vashon and Carnation Treatment Plants, and loadings from the SeaTac Airport deicing facility. West Point loadings included street washoff that enters through the combined system.
Forecasting Future Loadings Residential, commercial, and industrial loading factors (pounds per person per day) were determined for BOD and TSS based on population forecasts and the 2010 wasteload averages. The daily per-employee industrial loading factor was based on the Industrial Waste Program’s discharge and monitoring data
Flows from West Point were temporarily diverted to South Plant through the North Creek Pump Station when the station came online in 2000.
When Brightwater came online, flows treated at South Plant and West Point that are a part of Brightwater’s service area were sent to Brightwater.
4-10 RWSP 2013 Comprehensive Review

Chapter 4. Forecasting Future Wastewater Treatment Plant Capacity Needs
from 2008 through 2012. The loading factors were multiplied by population and employment forecasts by decade through 2060. Separate daily loading factors (pounds per day) were determined for other loads (septage, deicing, and street washoff). The future loading factor for septage was based on 2011 and 2012 daily loads (increased from the 2010 load because one septage receiver left the market in 2009). Figures 4-8 and 4-9 show actual and projected BOD and TSS loads for each treatment plant from 1990 through 2060. As population increases, the loadings to the treatments plants are forecast to increase proportionately.
Figure 4-8. Historical and Forecasted Average BOD load at Treatment Plants, 1990−2060
RWSP 2013 Comprehensive Review 4-11

Chapter 4. Forecasting Future Wastewater Treatment Plant Capacity Needs
Figure 4-9. Historical and Forecasted Average TSS load at Treatment Plants, 1990−2060
Comparison of Future Flows, Loadings, and Capacities WTD compared the AWWF and wasteload forecasts to treatment plant capacities to determine if capacity could be exceeded in the 50-year planning period. Solids loadings appear to be a greater determinant of capacity requirements than AWWF. Historically, AWWF has been used as a proxy for treatment plant capacity. The nominal plant capacity based on AWWF no longer reflects the capacity limitations of the treatment plants, mainly because of reduced water usage. Loadings continue to rise with population growth, whereas AWWF may either decrease or rise more slowly because of the effects of water conservation and commercial/industrial usage. This finding is consistent with trends in other wastewater utilities throughout the country.
Figure 4-10 shows the actual and forecast wasteloads from 1985 through 2060 and the systemwide capacities to treat BOD and TSS, both with and without the South Plant expansion around 2000 and the start of Brightwater operation in 2011.
4-12 RWSP 2013 Comprehensive Review

Chapter 4. Forecasting Future Wastewater Treatment Plant Capacity Needs
Figure 4-10. Comparison of Actual and Forecast Solids Loadings with Systemwide Treatment Capacities, 1980−2060
Comparison of forecast AWWF and solids loadings with capacity at the three treatments plants indicates the benefits of a three-plant system and that the plants will have sufficient treatment capacity until at least the 2030s:
• West Point Plant. Figure 4-11 shows that AWWF will not exceed design capacity at West Point through 2060, whereas capacity to treat TSS may be exceeded by around 2030 and to treat BOD about 10 years later.
• South Plant. Figure 4-12 shows that AWWF may be at capacity at South Plant in 2060 and that the capacity to treat TSS will be exceeded by around 2035 and to treat BOD about 10 years later.
• Brightwater Plant. Figure 4-13 shows that AWWF may come close to reaching capacity at Brightwater past 2060 and that BOD and TSS treatment capacities may be exceeded in the late 2030s with the addition of membrane cassettes and other associated equipment planned for 2020.
RWSP 2013 Comprehensive Review 4-13

Chapter 4. Forecasting Future Wastewater Treatment Plant Capacity Needs
Figure 4-11. Actual and Forecast AWWF and Solids Loadings Compared to West Point Treatment Plant Capacities, 1990−2060
4-14 RWSP 2013 Comprehensive Review

Chapter 4. Forecasting Future Wastewater Treatment Plant Capacity Needs
Figure 4-12. Actual and Forecast AWWF and Solids Loadings Compared to South Treatment Plant Capacities, 1990−2060
RWSP 2013 Comprehensive Review 4-15

Chapter 4. Forecasting Future Wastewater Treatment Plant Capacity Needs
Figure 4-13. Actual and Forecast AWWF and Solids Loadings Compared to Brightwater Treatment Plant Capacities, 2010−2060
Implications for Future Planning Actual population growth and water use rates could be more or less than projected. Factors such as the economy and natural or manmade events such as climate change could affect projections. Regulatory requirements could change; for example, nutrient removal requirements would likely require treatment plant upgrades that could affect treatment capacity. WTD will continue its evaluations and will revise forecasts as appropriate.
The analysis shows that with the addition of Brightwater, capacity at the three regional plants is sufficient until the 2030s. The forecasts indicate that additional capacity may be needed in the 2030s to meet the projected solids loadings. The required upgrades to expand the solids handling capacity may be less extensive than a full treatment plant upgrade and may include the need for additional digester capacity. WTD plans to conduct a study in 2015/2016 to explore options to meet future solids loadings needs.
4-16 RWSP 2013 Comprehensive Review

Chapter 4. Forecasting Future Wastewater Treatment Plant Capacity Needs
Although system-wide AWWF has remained fairly stable since 1990 and per-capita water use is expected to continue to decrease in the near future, growth in population is expected to result in increased AWWF through 2060 (Figure 4-14). The analysis shows that capacity at the three regional plants is expected to be sufficient to accommodate the increased AWWF for the next 40 years.
Projections of future peak flows for the treatment plants are being developed as part of the 2015 CSI Program update. Capacity requirements will be reevaluated when these forecasts become available. Of the factors that affect treatment plant capacity, peak flows are expected to have the greatest sensitivity to future climate change. Current scientific knowledge and projections on how climate change is expected to affect peak flows will be incorporated into a sensitivity evaluation as part of the peak flow projections.
The 2015 CSI program update may identify flow transfers that may be needed based on future conveyance capacity needs. WTD will reassess treatment plant flow forecasts if projects are identified that will lead to flow transfers not accounted for in the 2013 forecasts.
Recently a septage hauler applied for an operating permit to treat waste at its facility rather than at South Plant. Based on its hauling record, this could reduce septage loads at South Plant by a third, thus reducing TSS loading by 4,700 pounds per day and BOD by 1,500 pounds per day. This represents about 2.5 percent of the solids loading at South Plant and would delay the need for additional solids loading capacity at South Plant by about two years.
Figure 4-14. Historical and Projected Systemwide Average Wet Weather Flow
RWSP 2013 Comprehensive Review 4-17

Chapter 4. Forecasting Future Wastewater Treatment Plant Capacity Needs
4-18 RWSP 2013 Comprehensive Review

Chapter 5 Preparing for the Future
The RWSP was approved in 1999 and set a course for meeting the region’s wastewater needs through 2030. The timing of this RWSP comprehensive review represents the midway point of RWSP implementation. To date, the RWSP has been implemented as planned and amended to adjust to changing conditions or new information. The RWSP continues to protect water quality and the environment and ensures sufficient wastewater treatment and conveyance capacity to keep pace with population and employment growth.
Since adoption of the RWSP, several new trends and issues have emerged that influence wastewater management. These include climate change, new information about chemicals of concern, increased use and demand for the byproducts of wastewater treatment, sustainable building practices, technology trends, and more stringent regulations.
In addition, county initiatives and priorities have evolved over time. For, example, the County adopted its first strategic plan in 2010. The plan established the following priorities for all county departments:
• Improve customer service • Build lasting regional partnerships • Stabilize county finances • Build a culture of performance and empower employees to work together as “One King County”
Other key county priorities include responding to the challenges of climate change and integrating equity and social justice considerations into the County’s decisions and policies, practices, and methods for engaging communities.
This chapter summarizes WTD activities under way to address these emerging issues and priorities.
Climate Change Improving energy efficiency and reducing greenhouse gas emissions are important elements in addressing climate change. WTD has an active energy program both to conserve and to generate energy. The use of Loop® biosolids also helps reduce greenhouse gas emissions. Chapter 2 provides more information on WTD’s energy and biosolids recycling program.
WTD incorporates sustainable building practices into new facilities. The division considers energy costs and energy efficiencies in the planning, design, construction, and operation of its facilities. WTD has started to use the Institute for Sustainable Infrastructure’s EnvisionTM certification criteria during project design. Use of this assessment tool helps the project design team assess costs and benefits over the project lifecycle, evaluate environmental benefits, use outcome-based objectives, and achieve higher levels of sustainability. The tool is designed specifically for civil infrastructure projects such as roads, airports, dams, and water and wastewater systems.
RWSP 2013 Comprehensive Review 5-1

Chapter 5. Preparing for the Future
Incorporating roadside rain gardens and other green stormwater infrastructure (GSI) into projects not only helps reduce combined sewer overflows (CSOs) and the amount of untreated stormwater that finds its way to surface water, it also facilitates natural processes that recharge groundwater, preserve base flow in streams, moderate impacts to water and air temperature, and protect hydrologic and hydraulic stability. WTD is committed to using GSI where technically feasible and cost-effective. See Chapter 2 for more information on how GSI is being incorporated into the County’s Protecting Our Waters program.
WTD continues to implement the recommendations resulting from the study on the vulnerability of major wastewater facilities to flooding from sea-level rise. Work includes incorporating projected rises in sea level into the planning process for upgrades or rehabilitation of facilities located in areas affected by tides and storm surges. Estimates of sea-level rise continue to evolve. WTD regularly reviews new data and information to keep its projections current. As the effects of climate change (hotter temperatures, more frequent droughts, and other effects) become more noticeable across the country, there is concern that populations may shift to milder climates. WTD is including the potential for climate migration in its planning for the future.
Regulatory Environment RWSP policies provide guidance for the County’s participation in the development of water quality laws and standards. The County regularly participates in the development of effective and reasonable regulations.
The County participates on committees associated with the Washington State Department of Ecology (Ecology) water quality related rulemaking processes and efforts to update water quality standards. For example, the County is a member of Ecology’s “Delegate’s Table” that was formed in 2012 to provide advice and perspective on the water quality standards rule-making process that is under way. In addition, the County has been working closely with Ecology and the U.S. Environmental Protection Agency in developing and evaluating Lower Duwamish Superfund cleanup options.
Nutrient Removal One emerging area of concern for Ecology is algal growth, stimulated by nitrogen loadings to Puget Sound. The loadings may be contributing to depression of dissolved oxygen (DO) levels in near-bottom regions. In 2006, Ecology began a major study to determine the extent of low DO and how nitrogen from a variety of sources affects DO levels. Wastewater treatment plants around the nation are under growing pressure to remove nutrients. While it is not clear how Ecology will use the results of its studies to establish future regulatory limits, WTD conducted two studies to evaluate the impacts of a range of potential nitrogen limits on capital and operating costs at the South and West Point treatment plants. The studies evaluated a variety of nitrogen removal technologies and used existing treatment plant data and computer modeling to develop capital costs, operation and maintenance costs, and greenhouse gas emissions for each regulatory scenario.
Results of the studies show that the costs of upgrading South Plant would range from approximately $0.5 billion to $1 billion with an associated operating cost increase of $10 million to $33 million per year. The estimated costs of upgrading the West Point Plant would be about $1 billion with an operating cost
5-2 RWSP 2013 Comprehensive Review

Chapter 5. Preparing for the Future
of $30 million per year. However, because of lack of available space, upgrading the West Point Plant to remove nitrogen would most likely substantially reduce its treatment capacity.
Source Control Source control is one of the most effective ways to keep pollutants from entering the wastewater system and being discharged to water bodies. The King County Industrial Waste Program (KCIW) regulates industrial wastewater discharged into the County wastewater system. KCIW works cooperatively with more than 1,500 companies and facilities to protect surface water and biosolids quality, the environment, public health, and the wastewater system. The program provides technical assistance and ensures that industrial facilities treat wastewater for harmful substances before discharging the wastewater to sanitary sewers. Since 2007, KCIW has worked with other agencies to conduct pollution source control inspections at Lower Duwamish Waterway businesses as part of an Ecology interagency coordination effort. More information on the County’s Industrial Waste Program is available at http://www.kingcounty.gov/environment/wastewater/IndustrialWaste.aspx.
Chemicals of Concern WTD continues to follow the emerging science and technology investigations of chemicals of concern thought to be reaching the environment through wastewater or stormwater discharges. These include (1) chemicals found in personal care products and pharmaceuticals that are suspected to be endocrine disruptors or have other unintended effects on humans and/or wildlife and (2) other commonly used chemicals such as plasticizers, flame-retardants, and surface coatings like Gor-Tex and Teflon.
Other Topics The following are other issues that are important to WTD:
• Relabeling or banning of “disposable wipes” because they cause significant maintenance issues in wastewater systems.
• Product stewardship efforts to reduce pollutants in wastewater and stormwater.
• Drug take-back programs by local governments or pharmaceutical companies to reduce contamination of wastewater with unused and expired drugs. In 2013, King County’s Board of Health passed a Rule & Regulation to create a drug take-back system for King County residents. The program promotes the safe disposal of unused prescription and over-the-counter medicines. It will be funded and operated by the drug manufacturers who produce the medications. Under the new program, residents may dispose of unwanted medicines at pharmacies and other secure locations across the county for no charge. The new law creates one of only two such systems in the country.
Technology Trends Certain technology trends are emerging in the industry, including decentralized systems, nutrient recovery, energy recovery, and indirect and direct potable water reuse. WTD continues to monitor technology trends and to consider pilot projects as appropriate. Information on these trends follows.
RWSP 2013 Comprehensive Review 5-3

Chapter 5. Preparing for the Future
Decentralized Wastewater Systems The use of decentralized wastewater treatment systems is increasing. For some areas, decentralized systems are the most sustainable and cost-effective solutions. Examples of decentralization are as follows:
• Consolidated Utility District (CUD) of Rutherford County, Tennessee. The utility provides sewer service to many of its outlying customers through an innovative system, often referred to as a septic tank effluent pumping (STEP) system. Approximately 50 subdivisions contain a STEP system, a recirculating sand filter, and a large effluent drip dispersal system, all of which are owned and managed by the CUD. The system allows for high-density development (subdivisions) in areas where city sewer service is not available or soil types are not conducive to conventional septic tank and drain field lines. The 1,500-gallon septic tank is equipped with a pump and control panel located at each residence for controlled discharge of wastewater to a centralized wastewater collection system. For more information, see http://www.cudrc.com/Departments/Waste-Water.aspx.
• Loudoun Water, in Loudoun County, Virginia. Loudon Water has adopted an integrated approach to wastewater management that includes purchased capacity from a centralized plant, a satellite water reclamation facility, and several small community cluster systems. The approach has allowed Loudoun County to maintain its rural character and create a system in which growth pays for growth. Developers design and construct cluster wastewater facilities to Loudoun Water standards at their own cost and transfer ownership of the system to Loudoun Water for continued maintenance. For more information, see http://www.loudounwater.org/.
• The Bullitt Center in Seattle, Washington. World Architecture News honored the Bullitt Center as the “greenest commercial building in the world.” The Bullitt Center was built to achieve the goals of the Living Building Challenge and demonstrate 365 continuous days of performance that meet net zero energy and water. The center has a water and sewage processing system that provides some waste product processing on site and uses hauling to avoid discharge to the municipal sewage system. WTD supports the Bullitt Center’s efforts to achieve the Living Building certification by taking the building’s liquid waste stream to the Carnation Treatment Plant. At the Carnation Plant, the waste stream is treated and discharged to enhance a wetland in the Chinook Bend Natural Area rather than being discharged to a water body. WTD also takes the building’s solids from the composting toilets to make the GroCo commercial compost product. GroCo compost obtained “Declare” certification through the partnership with the Bullitt Center. For more information, see http://www.bullittcenter.org/.
Nutrient Recovery Clean Water Services in Hillsboro, Oregon, opened the world’s largest municipal nutrient recovery facility in 2012. The project is a public-private partnership with Ostara Nutrient Recovery Technologies of Vancouver, Canada. The facility captures phosphorus in wastewater to produce 1,200 tons a year of Crystal Green, a high value, slow-release fertilizer. The Ostara process is also being used in several wastewater plants in Canada. More information is available at
5-4 RWSP 2013 Comprehensive Review

Chapter 5. Preparing for the Future
http://www.cleanwaterservices.org/AboutUs/WastewaterAndStormwater/TreatmentFacilities/RockCreekNutrientRecovery.aspx.
Energy Recovery WTD continues to investigate means to improve and expand its ability to produce energy from wastewater treatment. Two promising opportunities area as follows:
• WTD is assessing the potential of adding organic wastes (such as food waste) to the sewage solids that are processed in anaerobic digesters at the South Treatment Plant. Recent WTD studies of what is known as “grease co-digestion” have investigated the costs and potential revenues associated with establishing a waste restaurant grease (brown grease) receiving facility. Brown grease is typically processed in rendering facilities and/or disposed of in landfills because there is a shortage of facilities that can cost-effectively convert the grease to energy. When restaurant grease is mixed into anaerobic digesters, it can substantially increase the production of valuable biogas that can be used to produce renewable energy. Numerous wastewater treatment facilities have successfully implemented brown grease co-digestion programs. In addition to continuing to assess the benefits of a facility at South Plant, WTD is working with private entrepreneurs to determine if the private sector might be able to cost-effectively convert this waste product into renewable energy.
• The South Plant biogas scrubber system currently processes biogas produced by the treatment plant solids digestion system to convert it into high-quality bio-methane (natural gas). This bio-methane is then injected into the nearby natural gas pipeline and sold to Puget Sound Energy. However, elements of the gas management system are aging and will require replacement in the near future. A study was conducted to assess the existing system of biogas recovery and energy production to determine if it still provides the “best and highest” use the biogas. Results from the study are expected in 2014.
Indirect and Direct Potable Reuse Advances in water treatment technology allow for production of high-quality drinking water for indirect and direct potable use. Two examples are as follows:
• In Texas, the Colorado River Municipal Water District is developing a direct potable reuse project. The project will reclaim wastewater effluent from the City of Big Spring and process it using advanced treatment technology. Approximately 1.8 million gallons per day of water from the facility will be blended with other water from surface water reservoirs. More information on this project is available at http://twri.tamu.edu/publications/txh2o/summer-2013/reclaiming-a-valuable-clean-resource/.
• In California, the Orange County Water District and the Orange County Sanitation District jointly funded the Groundwater Replenishment System (GWRS). The GWRS takes highly treated wastewater that would have previously been discharged into the Pacific Ocean and purifies it using a three-step advanced treatment process consisting of microfiltration, reverse osmosis, and ultraviolet light with hydrogen peroxide. The purified water is injected into a seawater
RWSP 2013 Comprehensive Review 5-5

Chapter 5. Preparing for the Future
barrier and pumped to recharge basins where it naturally percolates into the groundwater basin. More information on this system is available at http://www.gwrsystem.com/.
Building Equity and Opportunity WTD strives to further the goals of the County’s Equity and Social Justice Initiative in all its work—from planning through facility operations. In 2011, WTD conducted an analysis to compare historical capital project cost data with King County demographic data (to determine whether demographics (race, ethnicity, social status) affect project costs and schedule performance. The analysis used GIS (geographic information systems) to map 133 historical capital projects to see how they related to minority and income demographic conditions. When considering capital improvement, outreach, or planning decisions, these maps help assess the potential impacts of new actions as they relate to current service levels and spatial demographics. This analysis verified that the location of WTD facilities had no discernable correlation to the race, ethnicity, or economic status of the host community. It further confirms that facility locations are driven by hydraulics and topography–not any community-based factors.
WTD has also reviewed how its facilities are assets in the neighborhoods where they are located in comparison to neighborhood demographics. The information from this work is being used to improve facilities in residential areas where any discrepancies in screening or other neighborhood enhancements have been identified.
In addition, the WTD community outreach team shares information in multiple languages and uses other techniques to reach people who might not have traditionally participated in these processes. WTD provides career training and opportunities consistent with the Equity and Social Justice Initiative. In order to continue to introduce youth to wastewater careers, the division has developed more contracts with higher education organizations to provide work-study placements for students with financial aid awards and to provide job-training opportunities to disadvantaged youth through King County Worksource’s Work-to-Hire program.
5-6 RWSP 2013 Comprehensive Review

Chapter 6 Conclusions and Next Steps
This chapter summarizes conclusions from the review of RWSP implementation in 2007 through 2013 and next steps in continuing to implement the RWSP and protect the region’s water quality.
Conclusions • Overall, implementation of the RWSP continues to protect the region’s water quality,
environment, and economy by providing dependable and high-quality wastewater treatment.
• The RWSP’s primary objective, completion of the Brightwater Treatment Plant, has been achieved. The Brightwater Plant began operation in 2011 and is producing effluent, whose quality exceeds conventional secondary treatment, and reclaimed water that is used for irrigation in the Sammamish Valley.
• A major component of the RWSP 2013 comprehensive review included evaluating and updating future regional wastewater treatment capacity needs. The review confirmed the benefits of having a three-plant regional system. Findings indicate that with construction of the Brightwater Plant, there is sufficient treatment plant capacity until the 2030s. Updated forecasts indicate that a full expansion at South Treatment Plant is unlikely to be needed in 2029 as previously projected. WTD will continue to monitor the factors and trends that affect treatment plant capacity needs.
• Actual population growth and water use rates could be more or less than projected. Of the factors that affect treatment plant capacity, climate change is expected to have a significant impact on future peak flows at treatment plants. WTD will track trends and climate change impacts and projections over time.
• In accordance with RWSP conveyance and infiltration/inflow (I/I) policies, WTD completed five conveyance system improvement (CSI) projects and one I/I reduction project between 2007 and 2013.
• RWSP policies provide guidance to find beneficial uses for byproducts from wastewater treatment. WTD continues to create resources from the wastewater it treats in the form of biosolids and digester gas from the solids treatment process and reclaimed water from the liquids treatment process.
• WTD made significant progress in 2007−2013 to implement combined sewer overflow (CSO) control projects under the Protecting Our Waters Program to control all its CSO sites by 2030. About one-half of its 38 CSO sites are controlled to the Washington State standard of no more than one overflow per year on average. Projects are under way or planned to control the remaining uncontrolled CSOs by 2030.
RWSP 2013 Comprehensive Review 6-1

Chapter 6. Conclusions and Next Steps
• It would cost well over $20 billion to build King County’s wastewater system from the ground up today, and the current value of existing facilities is about $6 billion. The primary objectives of the Asset Management Program are to manage the whole lifecycle of a facility or asset; deliver a level of service that meets regulatory requirements and ratepayer expectations; and fulfill WTD’s mission to protect public health and enhance the environment by treating and reclaiming water, recycling solids, and generating energy.
• WTD is committed to continuous improvement. It completed a 10-year pilot Productivity Initiative Program in 2011 aimed at increasing efficiency. The program generated nearly $84 million in savings for ratepayers over its lifespan. Under WTD’s new Bright Ideas Program, WTD employees have submitted more than 550 ideas to improve efficiencies that are expected to result in over $400,000 in savings in 2014.
• RWSP comprehensive review reporting policies call for the inclusion of information on the effectiveness of policy implementation. This information is provided in Appendix A.
Next Steps • WTD will continue to implement the Protecting Our Waters Program to control the County’s'
remaining uncontrolled CSOs.
• WTD will conduct a study in 2015−2016 to explore options to meet future solids loadings needs that might improve treatment plant efficiency and reduce the cost of improvements needed to handle increased loadings over time.
• The CSI Program, which details capital projects necessary to meet the 20-year peak flow standard, was last updated in 2007. Based on updated population and employment projections released by the Puget Sound Regional Council in 2013, WTD will work to complete a CSI Program update in 2015. Projections of future peak flows for the treatment plants will also be developed as part of the update and capacity requirements will be reevaluated.
• In order to maintain accurate forecasts of wastewater system capacity needs, WTD will track trends and climate change impacts over time and will continue to monitor flow data and work with local agencies as they implement their land use and sewer plans in order to track actual population growth and water use rates in relation to current projections.
• WTD’s first I/I reduction project intended to reduce or eliminate the need for a CSI project was completed in 2013. The project followed recommendations contained in the I/I Control Program approved by the Council in 2006. In accordance with the program, WTD will be working with MWPAAC in 2015 to develop recommendations for long-term I/I reduction and control.
• WTD will be working with MWPAAC’s Engineering and Planning Subcommittee and the RWQC to discuss policy implementation and effectiveness and any recommendations for policy amendments. These discussions will help to inform the County Executive, who may recommend policy changes in 2015.
6-2 RWSP 2013 Comprehensive Review

Chapter 6. Conclusions and Next Steps
• WTD’s Strategic Asset Management Plan (SAMP) was last updated in 2010. Optimizing asset management practices is an ongoing process, and WTD will update the SAMP in December 2015.
• WTD will continue its efforts to be a state-of the-art, energy-efficient, lean, continually improving agency. A cornerstone of this effort will be the ongoing Bright Ideas Program that provides a means for employees to identify and seek approval for implementing efficiencies and cost saving measures in the Division’s operations.
• WTD will continue to expand its ability to create resources from wastewater through facilities at the West, South, and Brightwater plants by using digester gas to produce heat, electricity, and natural gas; recycling 100 percent of biosolids produced through the treatment process; and finding new customers and uses for reclaimed water.
RWSP 2013 Comprehensive Review 6-3

Chapter 6. Conclusions and Next Steps
6-4 RWSP 2013 Comprehensive Review

Appendix A
RWSP Policies Implementation in 2007−2013

Appendix A. RWSP Policies Implementation in 2007−2013
Introduction
This appendix provides information on how RWSP policies were implemented in 2007−2013. The appendix is in a similar format to the two previous RWSP comprehensive reviews.4 RWSP policies are part of King County Code Chapter 28.86.
There are 13 sets of RWSP policies:
• Treatment Plant Policies (TPP)
• Conveyance Policies (CP)
• Infiltration and Inflow Policies (I/IP)
• Combined Sewer Overflow Control Policies (CSOCP)
• Biosolids Policies (BP)
• Water Reuse Policies (WRP)
• Wastewater Services Policies (WWSP)
• Water Quality Protection Policies (WQPP)
• Wastewater Planning Policies (WWPP)
• Environmental Mitigation Policies (EMP)
• Public Involvement Policies (PIP)
• Financial Policies (FP)
• Reporting Policies
The introductory material for each policy set and the column that states each policy are written exactly as written in the King County Code, including punctuation and capitalization. The reader may notice certain words that are not capitalized that are usually capitalized or vice versa. The King County Code has its own style guide, and the policies reflect that guide. Any changes in policy made during 2007−2013 are noted in italics after either the introductory material or the policy.
The second column summarizes how each policy was implemented in 2007−2013. The information reflects WTD’s review of each policy.
4 Previous RWSP comprehensive reviews are available at http://www.kingcounty.gov/environment/wtd/Construction/planning/rwsp/Library/CompReview.aspx.
A-2 RWSP 2013 Comprehensive Review

Appendix A. RWSP Policies Implementation in 2007−2013
RWSP Treatment Plant Policies
A. Explanatory material. The treatment plant policies are intended to guide the county in providing treatment at its existing plants and in expanding treatment capacity through the year 2030. The policies direct that secondary treatment will be provided to all base sanitary flows. The county will investigate possible tertiary treatment with a freshwater outfall to facilitate water reuse. The policies also direct how the county will provide the expanded treatment capacity necessary to handle the projected increases in wastewater flows resulting from population and employment growth. The policies provide for the construction of a new treatment plant (the Brightwater treatment plant) to handle flows in a new north service area, expansion of the south treatment plant to handle additional south and east King County flows and the reservation of capacity at the west treatment plant to handle Seattle flows and CSOs. The potential for expansion at the west and south treatment plants will be retained for unanticipated circumstances such as changes in regulations. The policies address goals for odor control at treatment plants and direct that water reuse is to continue and potentially expand at treatment plants.
Treatment Plant Policies How implemented in 2007−2013 TPP-1: King County shall provide secondary treatment to all base sanitary flow delivered to its treatment plants. Treatment beyond the secondary level may be provided to meet water quality standards and achieve other goals such as furthering the water reuse program or benefiting species listed under the ESA.
The County operates three regional treatment plants—West Point, South, and Brightwater Treatment Plants, two local treatment plants—Vashon and Carnation Treatment Plants, and one large on-site septic system (Beulah Cove/Park). The processes used at all of the County’s treatment plants provide secondary treatment. The West Point and South Plants treat wastewater to secondary treatment using an activated sludge biological process. The Vashon Treatment Plant uses an oxidation ditch system. The Brightwater and Carnation Plants use membrane bioreactor technology. The Beulah Cove/Park uses a septic tank/trickling filter. Reclaimed water is produced at the South, West Point, Carnation, and Brightwater Plants. (See TPP-9 for information on the uses of reclaimed water produced from these plants.)
TPP-2: King County shall provide additional wastewater treatment capacity to serve growing wastewater needs by constructing the Brightwater treatment plant at the Route 9 site north of the city of Woodinville and then expanding the treatment capacity at the south treatment plant. The west treatment plant shall be maintained at its rated capacity of one hundred thirty-three mgd. The south treatment plant capacity shall be limited to that needed to serve the eastside and south King County, except for flows from the North Creek Diversion project and the planned six-million-gallon storage tank, or minor rerating to facilitate
Construction of the Brightwater Treatment System is complete, and the system began full operations on October 29, 2012. The work to complete the RWSP 2013 comprehensive review included updating key planning assumptions and using updated population and employment forecasts developed by the Puget Sound Regional Council to forecast treatment plant average wet-weather flow (AWWF) and solids loadings capacity through 2060. Findings indicate that there is sufficient AWWF and loadings capacity systemwide into the 2030s. WTD will continue to examine assumptions and trends
RWSP 2013 Comprehensive Review A-3

Appendix A. RWSP Policies Implementation in 2007−2013
Treatment Plant Policies How implemented in 2007−2013 south or east county growth. The potential for expansion at the west treatment plant and south treatment plant should be retained for unexpected circumstances which shall include, but not be limited to, higher than anticipated population growth, new facilities to implement the CSO reduction program or new regulatory requirements.
that could affect treatment plant capacity needs to ensure optimal timing for any future capacity-related capital investments. (See Chapter 4 for more information on the process to forecast treatment plant flows and loadings.)
TPP-3: Any changes in facilities of the west treatment plant shall comply with the terms of the West Point settlement agreement.
The County continues to be in compliance with the terms of the 1991 West Point Settlement Agreement.
TPP-4: King County’s goal is to prevent and control nuisance odor occurrences at all treatment plants and associated conveyance facilities and will carry out an odor prevention program that goes beyond traditional odor control. To achieve these goals, the following policies shall be implemented: 1. Existing treatment facilities shall be retrofit in a phased manner up to the High/Existing Plant Retrofit odor prevention level as defined in Table 1 of Attachment A to Ordinance 14712, the odor prevention policy recommendations dated March 18, 2003. This level reflects what is currently defined as the best in the country for retrofit treatment facilities of a similar size. Odor prevention systems will be employed as required to meet the goal of preventing and controlling nuisance odor occurrences; 2. Existing conveyance facilities that pose nuisance odor problems shall be retrofitted with odor prevention systems as soon as such odors occur, subject to technical and financial feasibility. All other existing conveyance facilities shall be retrofitted with odor control systems during the next facility upgrade; 3. The executive shall phase odor prevention systems implementing the tasks that generate the greatest improvements first, balancing benefit gained with cost, and report to the council on the status of the odor prevention program in the annual RWSP report as outlined in K.C.C. 28.86.165; 4. New regional treatment facilities shall be constructed with odor control systems that are designed to meet the High/New Plant odor prevention level as defined in Table 1 of Attachment A to Ordinance 14712, the odor prevention policy recommendations dated March 18, 2003. This level reflects what is currently defined as the best in the country for
TPP-4.1 Work associated with phased odor control retrofits in 2007−2013 included the following:
• West Point Plant. Completed modifications to the odor scrubber system. Operational activities, such as cleaning process tanks more frequently, were also implemented to complement and improve the results of the phased retrofits.
• South Plant. Completed installation of covers for each first pass of the four aeration basins and for the return activated sludge (RAS) channel and added a new odor scrubber to control emissions from the aeration basins and the RAS channel. Operational activities, such as more frequent inspections of the odor scrubber system, were implemented to complement and improve the results of the phased retrofits. In addition, a formal environmental management system (EMS) was implemented for air emission sources including odor control.
The retrofits and operational changes have served to reduce nuisance odors at both West Point and South Plants. WTD continues to evaluate the results of these efforts to determine if any further actions are needed. TPP-4.2: When odors are attributed to existing conveyance facilities, measures are taken to control and prevent those odors. These measures include sealing manhole covers, adjusting chemicals, and repairing or replacing odor control equipment. Conveyance system improvement projects include upgrades to odor control facilities as appropriate. For example, odor control equipment was included as part of the Hidden Lake Pump Station and Sewer Replacement project that was completed in spring 2009 and as part of the Bellevue Pump Station upgrade that was completed in 2011. TPP-4.3: The schedule for phased improvements follows the direction provided in this policy. RWSP
A-4 RWSP 2013 Comprehensive Review
Appendix A. RWSP Policies Implementation in 2007−2013
Treatment Plant Policies How implemented in 2007−2013 new treatment facilities of a similar size; 5. New conveyance facilities serving these new regional treatment facilities shall also be constructed with odor control systems as an integral part of their design; 6. Design standards will be developed and maintained for odor control systems to meet the county’s odor prevention and control goals; 7. A comprehensive odor control and prevention monitoring program for the county’s wastewater treatment and conveyance facilities will be developed. This program shall include the use of near facility neighbor surveys and tracking of odor complaints and responses to complaints and shall consider development of an odor prevention benchmarking and audit program with peer utilities; and 8. New odor prevention and measurement technologies will be assessed and methods for pilot testing new technologies identified when determined by the executive to be necessary and appropriate for achieving the goals of this policy.
annual reports include a status of the odor prevention program. TPP-4.4: The Brightwater Plant’s odor control system was designed to meet the “best in the country for new facilities” level, described in Attachment A to Ordinance 14712. There have been no odors attributed to the Brightwater Treatment Plant since it began operating. TPP-4.5: Odor control was incorporated into the Brightwater conveyance system. There have been no sewage-related odors attributed to Brightwater conveyance facilities since they began operating. There was one complaint in 2013 related to diesel odors that emanated from the Brightwater Influent Pump Station during testing of the pump station’s generators in 2013. To resolve the situation, a project is under way to install diesel oxidation catalyst units on each generator exhaust system. TPP-4.6: WTD continues to use the design standards for the County’s odor control systems. TPP-4.7: Surveys of businesses and residents that are near-neighbors of the County’s regional treatment plants are carried out every two years. The findings provide feedback on odor sources and process improvements that have reduced odor impacts. Information on the surveys is available at http://www.kingcounty.gov/environment/wtd/About/System/NearNeighborSurvey.aspx. In addition, WTD has procedures in place to log, investigate, and track all odor complaints. WTD’s goal is to respond to each complaint within two hours after receiving a complaint. WTD consults with peer utilities on odor control technologies, lessons learned, and other related information. TPP-4.8: WTD keeps informed on new technologies through participation in professional organizations and technical conferences. No assessments or pilot studies were conducted during 2007−2013.
TPP-5: King County shall undertake studies to determine whether it is economically and environmentally feasible to discharge reclaimed water to systems such as the Lake Washington and Lake Sammamish watersheds including the Ballard Locks.
WTD developed and analyzed conceptual strategies for discharging reclaimed water into Lake Washington and additional reclaimed water uses in the Lake Sammamish watershed as part of the reclaimed water comprehensive planning process that took place in 2009–2012. WTD will continue to monitor any changing conditions or future opportunities for reclaimed water uses in these watersheds.
RWSP 2013 Comprehensive Review A-5

Appendix A. RWSP Policies Implementation in 2007−2013
Treatment Plant Policies How implemented in 2007−2013 TPP-6: The county shall evaluate opportunities in collaboration with adjacent utilities regarding the transfer of flows between the county's treatment facilities and treatment facilities owned and operated by other wastewater utilities in the region. The evaluation shall include, but not be limited to, cost environmental and community impacts, liability, engineering feasibility, flexibility, impacts to contractual and regulatory obligations and consistency with the level of service provided at the county owned and operated facilities.
King County and the City of Edmonds continued to transfer wastewater flows between systems in accordance with their interlocal agreement. The agreement stipulates that an equivalent amount of flow is transferred through the Lake Ballinger Pump Station from Edmonds to King County’s West Point system as is transferred to Edmonds from King County’s Richmond Beach area. The transfers occurred during the dry season. An additional agreement was followed that sent the first 6 mgd of the Lake Ballinger Pump Station flows to Edmonds during the wet season until Brightwater came fully online in 2012. This arrangement made use of extra Edmonds treatment capacity and minimized the risk of overflows into Lake Washington during large storm events.
TPP-7: King County may explore the possibility of constructing one or more satellite treatment plants in order to produce reclaimed water. The county may build these plants in cooperation with a local community and provide the community with reclaimed water through a regional water supply agency. In order to ensure integrated water resource planning, in the interim period prior to the development of a regional water supply plan, King County shall consult and coordinate with regional water suppliers to ensure that water reuse decisions are consistent with regional water supply plans. To ensure costs and benefits are shared equally throughout the region, all reclaimed water used in the community shall be distributed through a municipal water supply or regional water supply agency consistent with a regional water supply plan.
In 2007, WTD completed a preliminary analysis of reclaimed water options in the Green River Valley to answer questions raised by the Cities of Auburn, Covington, Kent, Renton, and Tukwila. Information from the study was incorporated into the reclaimed water comprehensive planning process that occurred in 2009–2012. King County and the Covington Water District signed a Memorandum of Agreement in 2007 to jointly fund and pursue a phased approach to explore opportunities for reclaimed water development in the district’s service area. Information from this effort was incorporated into the reclaimed water comprehensive planning process. In 2008–2009, WTD worked with the Seattle Public Utilities (SPU) on SPU’s economic analysis of the potential for providing reclaimed water from the Brightwater Treatment Plant to large irrigators and other potential users of nonpotable water in north Seattle. Information from this effort was incorporated into the reclaimed water comprehensive planning process. WTD developed and analyzed three conceptual strategies for reclaimed water satellite or skimming facilities as part of the reclaimed water comprehensive planning process. WTD will continue to monitor changing conditions or future opportunities that could result in further exploration of such facilities. WTD worked closely with water utilities during the reclaimed water comprehensive planning process and will continue to coordinate with water utilities on future opportunities.
TPP-8: King County shall continue water reuse and explore opportunities for expanded use at existing plants, and shall explore water reuse
WTD has been producing and using reclaimed water since 1997 at the South and West Point plants. South Plant uses its reclaimed water at the plant for process
A-6 RWSP 2013 Comprehensive Review

Appendix A. RWSP Policies Implementation in 2007−2013
Treatment Plant Policies How implemented in 2007−2013 opportunities at all new treatment facilities. water and landscape irrigation. Some of the the
reclaimed water is distributed and used offsite for irrigation or public works uses, such as sewer flushing and street sweeping. All of the reclaimed water produced at the West Point Plant is used at the plant site for process water and landscape irrigation. The Carnation Treatment Plant began operating in 2008. The facility produces and discharges reclaimed water to enhance a wetland in the County's Chinook Bend Natural Area. The Brightwater Treatment System began full operations in 2012. Brightwater produces reclaimed water for use at the Brightwater Environmental and Education Center for non-drinking purposes such as toilet flushing and landscape irrigation. In summer 2013, Brightwater began distributing some of its reclaimed water offsite for irrigation uses.
RWSP 2013 Comprehensive Review A-7

Appendix A. RWSP Policies Implementation in 2007−2013
RWSP Conveyance Policies
A. Explanatory material. The conveyance policies are intended to guide how major improvements to the wastewater conveyance system, including building and upgrading the pipes and pump stations needed to convey wastewater to the Brightwater treatment plant and building the outfall pipe from the Brightwater treatment plant, will be accomplished. The policies also include guidance for other major and minor conveyance improvements to accommodate increased flows in other parts of the service area and to prevent improper discharges from the sanitary system.
Conveyance Policies How implemented in 2007–2013 CP-1: To protect public health and water quality, King County shall plan, design and construct county wastewater facilities to avoid sanitary sewer overflows. 1. The twenty-year peak flow storm shall be used as the design standard for the county’s separated wastewater system. 2. Parameters developed by the wastewater treatment division in consultation with the metropolitan water pollution abatement advisory committee shall be used to guide project scheduling and prioritization for separated wastewater system projects. 3. The south treatment plant effluent transfer system shall be designed with a five-year design storm standard. When effluent volumes exceed the five-year design standard and exceed the capacity of the south treatment plant effluent transfer system, secondary treated effluent from the south treatment plant will be discharged to the Green/Duwamish river until the flow subsides such that the flow can be discharged through the south treatment plant effluent transfer system.
CP-1.1: The 20-year peak flow storm is used as the design standard for the County’s separated wastewater system. All of the conveyance system improvement (CSI) capital projects that were implemented during the 2007−2013 period used this standard as the basis for design of the project. CP-1.2: The parameters developed with the Metropolitan Water Pollution Abatement Advisory Committee (MWPAAC) during the process to complete the 2007 CSI Program Update continue to guide CSI project scheduling and prioritization. CP-1.3: Effluent volumes did not exceed the capacity of the of the South Plant’s effluent transfer system during 2007–2013.
CP-2: King County shall construct the necessary wastewater conveyance facilities, including, but not limited to pipelines, pumps and regulators, to convey wastewater from component agencies to the treatment plants for treatment and to convey treated effluent to water bodies for discharge. Conveyance facilities shall be constructed during the planning period of this plan to ensure that all treatment plants can ultimately operate at their rated capacities. No parallel eastside interceptor shall be constructed. No parallel Kenmore Interceptor shall be constructed.
Conveyance projects in 2007–2013 were implemented following the prioritization that was included in the 2007 CSI Program update. The prioritization process was developed by WTD and MWPAAC. The goal of the process is to phase implementation of CSI projects to meet the most pressing needs and continue to protect public health, the environment, and ratepayers. The completion of the Brightwater Treatment System eliminates any need to parallel the Eastside Interceptor or the Kenmore Lakeline.
A-8 RWSP 2013 Comprehensive Review

Appendix A. RWSP Policies Implementation in 2007−2013
Conveyance Policies How implemented in 2007–2013 CP-3: King County shall periodically evaluate population and employment growth assumptions and development pattern assumptions used to size conveyance facilities to allow for flexibility to convey future flows that may differ from previous estimates. The following activities shall take place to confirm assumptions and conveyance improvement needs: 1. Field verification of wastewater flows and conveyance component conditions prior to implementation of regional conveyance capital projects that are intended to expand capacity of the system; and 2. Decennial flow monitoring to correspond with the Federal Census conducted every ten years. (Ordinance 16033, approved in March 2008, amended this policy to provide direction on the activities to undertake to confirm assumptions and needs.)
WTD uses population and employment growth projections from the Puget Sound Regional Council (PSRC), along with other RWSP key planning assumptions (see Chapter 4) in its efforts to forecast flows and determine sizing and timing of capital investments to meet conveyance or treatment capacity needs. CP-3.1: WTD completed field verification prior to implementing CSI projects during the 2007−2013 period. CP-3.2: The Decennial Flow Monitoring (DFM) project was completed in 2011. Data was collected from 235 flow meters in the separated portion of the regional wastewater service area. The data is being used to prepare the 2015 CSI Program update and will inform the prioritization, timing, and sizing of future CSI projects. The data is also available to local agencies for use in planning and designing their systems.
CP-4: The executive shall update the conveyance system improvement program every five years beginning in 2013 to ensure the program remains current. The program updates shall provide information on growth patterns, rate of growth and flow projections and report on how this information affects previously identified conveyance needs. The program updates shall also provide information on changed or new conveyance needs identified since the previous update. (This policy was added through Ordinance 16033.)
WTD began work in 2013 to update the CSI program, and the program update is expected to be complete in 2015. WTD is using PSRC’s 2013 population and employment forecast data, WTD’s updated planning assumptions (see Chapter 3), data from the DFM project, and information from local agencies to verify or update future needs for the separated conveyance system.
CP-5: King County shall apply uniform criteria throughout its service area for the financing, development, ownership, operation, maintenance, repair and replacement of all conveyance facilities. The criteria shall include: 1. County ownership and operation of permanent conveyance facilities that serve natural drainage areas of greater than one thousand acres; 2. Conformance to the county's comprehensive water pollution abatement plan and the Regional Wastewater Service Plan as precondition of county ownership; and 3. A financial feasibility threshold governing limitations of the county's financial contribution to: development of a new interceptor or trunk sewer; or acquisition of an interceptor or trunk sewer constructed by a local agency. The
The acquisition of the Central Plateau Interceptor from the City of Renton was the only acquisition that took place in 2007–2013 in accordance with this policy.
RWSP 2013 Comprehensive Review A-9

Appendix A. RWSP Policies Implementation in 2007−2013
Conveyance Policies How implemented in 2007–2013 threshold, as specified in K.C.C. 28.84.080, shall consider the capital costs that can be supported by the existing customers in the natural drainage area that would be served by the new facility. (This policy used to be CP-4. Ordinance 16033 moved it to CP-5; no other changes were made to this policy.)
CP-6: King County shall closely integrate water reuse planning and I/I study results with planning for wastewater conveyance and treatment facilities. King County shall consider water conservation and demand management assumptions developed by local utilities for wastewater facility planning. (This policy used to be CP-5. Ordinance 16033 moved it to CP-6; no other changes were made to this policy.)
WTD implemented this policy in 2007−2013 through the following activities:
• Assessed the effects of conceptual reclaimed water strategies on planned conveyance system projects in 2012 as part of the reclaimed water comprehesnive planning process. Findings indicated that the strategies would not affect any planned conveyance system improvements.
• Implemented the Skyway initial infiltration and inflow (I/I) reduction project. Post-project flow monitoring is under way, and results will be incorporated into conveyance system planning as appropriate.
• Updated the water conservation and water use assumptions based on winter water use data and the projections of future use from local water utilites (see Chapter 4). WTD worked closely with MWPAAC on the update of the RWSP key planning assumptions. The updated assumptions will be used to verify or udpate the sizing and timing of any future conveyance capacity needs.
CP-7: King County shall evaluate other demand management alternatives to meet identified conveyance needs, such as infiltration and inflow (I/I) reduction, water conservation, and reclaimed water facilities. Factors such as operational, environmental and financial impacts, costs and benefits, and the net present value of alternatives shall be included in the evaluation of all feasible alternatives identified by the county. (This policy was added through Ordinance 16033.)
The process to determine how best to meet an identified conveyance need occurs during project planning and predesign and includes consideration of the alternatives and factors listed in this policy.
A-10 RWSP 2013 Comprehensive Review

Appendix A. RWSP Policies Implementation in 2007−2013
RWSP Infiltration and Inflow Policies
A. Explanatory material. The I/I policies are intended to guide the county in working cooperatively with component agencies to reduce the amount of I/I that flows into component agencies’ local collection systems, thereby reducing the impact of I/I on the regional system’s capacity. This cooperative process will assess levels of I/I in local conveyance systems and construct pilot projects and will evaluate the cost-effectiveness and environmental costs and benefits of local collection system rehabilitation. The executive will develop and recommend long-term measures to reduce existing and future levels of I/I into local collection systems. Incentives for component agencies to meet the adopted target for I/I reduction may include a surcharge.
Infiltration and Inflow (I/I) Policies How Implemented in 2007–2013 I/IP-1: King County is committed to controlling I/I within its regional conveyance system and shall rehabilitate portions of its regional conveyance system to reduce I/I whenever the cost of rehabilitation is less than the costs of conveying and treating that flow or when rehabilitation provides significant environmental benefits to water quantity, water quality, stream flows, wetlands or habitat for species listed under the ESA.
The County’s Regional I/I Control Program was approved by the King County Council in 2006 through Motion 12292. The program calls for WTD to carry out initial I/I reduction projects to test the cost-effectiveness of I/I reduction on a larger scale than the pilot projects that were completed in 2004. WTD worked closely with MWPAAC to identfiy potential initial I/I reduction project areas for further analysis. As a result of the analysis, design efforts, and budget limitations, WTD selected the Skyway Initial I/I reduction project for implementation. The project was managed and funded by King County in partnership with the Skyway Water and Sewer District. Construction was completed in 2013. Analysis of the project’s results are under way. WTD will be working closely with MWPAAC to develop recommendations on the next steps regarding the County’s I/I control program and policy updates.
I/IP-2: King County shall work cooperatively with component agencies to reduce I/I in local conveyance systems utilizing and evaluating I/I pilot rehabilitation projects, and developing draft local conveyance systems' design guidelines, procedures and policies, including inspection and enforcement standards. Evaluations of the pilot rehabilitation projects and a regional needs assessment of the conveyance system and assessments of I/I levels in each of the local sewer systems will form the basis for identifying and reporting on the options and the associated cost of removing I/I and preventing future increases. The executive shall submit to the council a report on the options, capital costs and environmental costs and benefits including but not limited to those related to water quality, groundwater inception, stream flows and wetlands, and habitat of species listed under the ESA. No later than December 31, 2005,
This policy was written to provide guidance to the I/I reduction pilot program, which was completed in 2004. As a result of the 10 pilot projects, the Executive’s recommended I/I control program was developed in coordination with MWPAAC and approved by the County Council through Motion 12292 in 2006.
RWSP 2013 Comprehensive Review A-11

Appendix A. RWSP Policies Implementation in 2007−2013
Infiltration and Inflow (I/I) Policies How Implemented in 2007–2013 utilizing the prior assessments and reports the executive shall recommend target levels for I/I reduction in local collection systems and propose long-term measures to meet the targets. These measures shall include, but not be limited to, establishing new local conveyance systems design standards, implementing an enforcement program, developing an incentive based cost sharing program and establishing a surcharge program. The overall goal for peak I/I reduction in the service area should be thirty percent from the peak twenty-year level identified in the report. The county shall pay one hundred percent of the cost of the assessments and pilot projects.
I/IP-3: King County shall consider an I/I surcharge, no later than June 30, 2006, on component agencies that do not meet the adopted target levels for I/I reduction in local collection systems. The I/I surcharge should be specifically designed to ensure the component agencies’ compliance with the adopted target levels. King County shall pursue changes to component agency contracts if necessary or implement other strategies in order to levy an I/I surcharge.
One of the recommendations included in the 2006 I/I control program was to not implement a surcharge on local agencies. As noted in I/IP-1, WTD will be working with MWPAAC to develop recommendations on the next steps regarding the County’s I/I program and policy updates.
A-12 RWSP 2013 Comprehensive Review

Appendix A. RWSP Policies Implementation in 2007−2013
RWSP Combined Sewer Overflow Control Policies
A. Explanatory material. The CSO control policies are intended to guide the county in controlling CSO discharges. Highest priority for controlling CSO discharges is directed at those that pose the greatest risk to human health, particularly at bathing beaches, and environmental health, particularly those that threaten species listed under ESA. The county will continue to work with federal, state and local jurisdictions on regulations, permits and programs related to CSOs and stormwater. The county will also continue its development of CSO programs and projects based on assessments of water quality and contaminated sediments.
Note: In May 2013, the King County Council approved Ordinance 17587, which amended several of the CSO control policies to ensure the policies are consistent with the 2012 Council-approved long-term CSO Control Plan and consent decree that was negotiated in 2013 with the U.S. Environmental Protection Agency (EPA) and the Washington State Department of Ecology (Ecology).
Combined Sewer Overflow Control Policies How Implemented in 2007–2013 CSOCP-1: King County shall plan to control its CSO discharges by the end of 2030 to meet:
1. The state's CSO control standard of an average of one untreated discharge per CSO outfall per year based on a twenty-year moving average, and
2. Conditions of National Pollutant Discharge Elimination System permit requirements;
3. conditions of the Environmental Protection Agency/Washington state Department of Ecology Consent Decree.
(Ordinance 17587 amended this policy to include 2030 as the completion date to achieve CSO control; define the state’s CSO control standard; and reconfirm the County’s commitment to meet permit requirements and the conditions of the consent decree.)
The King County Council approved the County’s amended long-term CSO control plan through Ordinance 17413 in September 2012. The plan includes a schedule to complete nine CSO control projects by the end of 2030. EPA subsequently approved the plan in March 2013. The project schedule is also included in the consent decree that was negotiated with EPA and Ecology in 2013.
CSOCP-2: King County shall continue to work with state and federal agencies to develop cost-effective regulations that protect water quality. King County shall meet the requirements of state and federal regulations and agreements. (This policy was amended by Ordinance 17587. The language in this policy had previously been included as part of CSOCP-1. The Engineering and Planning Subcommittee of MWPAAC [E&P] recommended making this
The County continues to work with state and federal agencies on regulations related to protecting water quality. For example, the County is a member of Ecology’s “Delegate’s Table” that was formed in 2012 to provide advice and perspective to Ecology on the water quality standards rule-making process that is under way. In addition, the County has been working closely with Ecology and EPA in developing and evaluating Lower Duwamish Superfund cleanup options. The County continues to meet all of its state and
RWSP 2013 Comprehensive Review A-13

Appendix A. RWSP Policies Implementation in 2007−2013
Combined Sewer Overflow Control Policies How Implemented in 2007–2013 a separate policy.) federal regulations and agreements.
CSOCP-3: Consistent with the Environmental Protection Agency/Washington state Department of Ecology Consent Decree and the county's long-term CSO control plan as approved through Ordinance 17413, King County shall give the highest priority for control of CSO discharges that have the highest potential to impact: 1. Human health through contact with CSO flows or fish consumption; or 2. Environmental health, such as in areas where sediment remediation is under way or anticipated or where there is potential to impact species listed under ESA. (Previously, this policy was CSOCP-2. Ordinance 17587 amended this policy to add language to be consistent with the approved amendment to the County’s long-term CSO plan and to better define “highest priority”.)
The CSO control project schedule that was approved by the Council and EPA and included in the consent decree reflects the priorities outlined in this policy.
CSOCP-4: Consistent with its legal authority, if King County constructs new projects that would separate stormwater from its combined system that result in separated stormwater discharges to waterways, the county shall coordinate with the city of Seattle in the city's municipal stormwater National Pollutant Discharge Elimination System permit (MS4) process as appropriate. (Previously, this policy was CSOCP-3. Ordinance 17587 amended this policy to clarify that the policy provides guidance for new projects.)
There were no new projects constructed in 2007–2013 that corresponded to this policy.
CSOCP-5: King County's wastewater conveyance and treatment facilities shall not be designed to intercept, collect and treat new sources of stormwater. However, King County may evaluate benefits and impacts to the county system from accepting stormwater from the city of Seattle that is not currently in the combined system and shall consider factors including, but not limited to existing capacity, benefits and costs to ratepayers and the regional system, operational impacts, payment to county for value of the use of available capacity and for the costs of conveyance and treatment of new sources of stormwater and compliance with state and federal regulations and commitments. (Previously, this policy was CSOCP-4. Ordinance 17587 amended the policy to clarify
The County’s facilities are not designed to intercept, collect, or treat new sources of stormwater. During the 2007–2013 timeframe, there were no proposals from the City of Seattle regarding additional stormwater to WTD’s system.
A-14 RWSP 2013 Comprehensive Review

Appendix A. RWSP Policies Implementation in 2007−2013
Combined Sewer Overflow Control Policies How Implemented in 2007–2013 that King County’s facilities shall not be designed for new sources of stormwater and to require the County to consider the benefits, costs and impacts of accepting new sources of stormwater from Seattle if such a request were to occur.)
CSOCP-6: In accordance with King County's industrial waste rules and regulations, including K.C.C. 28.84.050.K.1 and 28.84.060, the county shall accept contaminated stormwater runoff from industrial sources and shall establish a fee to capture the cost of transporting and treating this stormwater. Specific authorization for such discharge is required. (Previously, this policy was CSOCP-5. Ordinance 17587 amended the policy to ensure it is consistent with King County Code’s definition of industrial waste and to acknowledge that the policy is in accordance with industrial waste rules and regulations.)
WTD’s Industrial Waste Program continues to coordinate the approvals of and cost recovery for industrial discharges.
CSOCP-7: King County shall consider implementing green stormwater infrastructure projects to control CSOs when results of technical, engineering, and benefit/cost analyses and modeling demonstrate it is a viable and cost-effective CSO control method. (Ordinance 17587 added this policy to assure that the use of green stormwater infrastructure to control CSOs would be based on analytical results and modeling.)
The Barton CSO control project that is under way in Seattle is a green stormwater infrastructure (GSI) project. The project includes constructing bioretention swales in the planter strips in the city right-of-way on up to 15 blocks in the Sunrise Heights and Westwood neighborhoods in West Seattle. The decision to use GSI for this project was based on the results of analyses listed in this policy. The project is expected be complete by the end of 2015. Four of the nine CSO control projects that were approved through Ordinance 17413 have been identified as projects that could benefit from GSI: West Michigan/Terminal 115, University, Montlake, and 11th Ave NW CSO control projects. The analyses listed in this policy will be conducted prior to implementing specific GSI projects.
CSOCP-8: King County shall consider implementing joint CSO control projects with the city of Seattle when it is cost-effective, is within county legal authorities and can be accomplished within the schedule outlined in the Environmental Protection Agency/Washington state Department of Ecology Consent Decree and the county's approved long-term CSO control plan. (Previously, this policy was CSOCP-6 Ordinance 17587 amended the policy to incorporate information on potential joint projects with Seattle, consistent with the consent decree and Council-approved
Three of the nine CSO control projects that were approved through Ordinance 17413 are identified as potential joint projects with Seattle to control both agencies’ CSOs in the 3rd Ave W, University, and Montlake CSO basins. Five small transfers of flows from Seattle projects to the King County system have also been identified; the City would reimburse the County for any operation and maintenance (O&M) costs associated with these flows. The County and City continue to discuss the potential for these joint projects. The City is expected to finalize and submit its long-term CSO control plan to EPA and Ecology in 2015.
RWSP 2013 Comprehensive Review A-15

Appendix A. RWSP Policies Implementation in 2007−2013
Combined Sewer Overflow Control Policies How Implemented in 2007–2013 amendment to the long-term CSO control plan.)
CSOCP-9: King County shall implement its long-range sediment management strategy to address its portion of responsibility for contaminated sediment locations associated with county CSOs and other facilities and properties. Where applicable, the county shall implement and cost share sediment remediation activities in partnership with other public and private parties, including the county's current agreement with the Lower Duwamish Waterway Group, the Department of Ecology and the Environmental Protection Agency, under the federal Comprehensive Environmental Response, Compensation and Liability Act. (Previously, this policy was CSOCP-7, Ordinance 17587 moved the policy to CSOCP-9.)
The County continues to work to improve water quality in the Lower Duwamish Waterway through actions such as reducing CSOs, restoring habitats, capping or removing sediments, and controlling toxicants from industries and stormwater runoff. WTD continued to carry out its Sediment Management Plan (SMP) to remediate contaminated sediments near CSO outfalls. The following activities were carried out as part of implementing the SMP during 2007–2013:
• Completed cleanup of the former Denny Way CSO site off of Myrtle Edwards Park in Seattle; monitoring of sediment quality began in 2008 and will continue through 2018
• Developed a model to better predict deposition of contaminants around CSO outfalls
• Completed post-construction monitoring of the Diagonal/Duwamish cleanup site
• Conducted sampling of sediments in the East Duwamish Waterway Superfund site, finalized the East Duwamish Waterway remedial investigation, and completed a draft feasibility study
The Lower Duwamish Waterway Group (LDWG) consists of King County, the City of Seattle, the Port of Seattle, and the Boeing Company. The LDWG has been working with EPA and Ecology since 2001 to study the contamination and determine the best and most effective alternatives to clean up the Lower Duwamish Waterway (LDW). During the 2007–2013 timeframe, the LDWG completed a remedial investigation and feasibility study for the LDW Superfund site and started a study to better understand who is eating contaminated seafood from the Duwamish River. In 2013, EPA issued the Proposed Plan for the Lower Duwamish Waterway Superfund Site, which presents a preferred alternative to clean up contamination in the in-waterway portion of the LDW Superfund site. EPA is expected to issue a Record of Decision in third quarter 2014 to direct cleanup actions and long-term monitoring. The County, in partnership with the LDWG, carried out engagement and outreach activities with interested industries, businesses, residents, and environmental and community groups throughout development of the remedial investigation, feasibility study, and EPA’s proposed cleanup plan.
A-16 RWSP 2013 Comprehensive Review
Appendix A. RWSP Policies Implementation in 2007−2013
Combined Sewer Overflow Control Policies How Implemented in 2007–2013 The process to allocate cleanup costs among potential responsible parties (PRPs) is under way.
CSOCP-10: Consistent with the Environmental Protection Agency/Washington state Department of Ecology Consent Decree, King County shall assess CSO control projects, priorities and opportunities using the most current studies and information available, for each CSO Control Plan Amendment as required by the Department of Ecology in the National Pollutant Discharge Elimination System permit renewal process. (Previously, this policy was CSOCP-8. Ordinance 17587 added language to be consistent with the Council-approved long-range CSO control plan and the consent decree. In addition, the policy was split into two policies – see CSOCP-11.)
For the 2012 CSO Control Program review and plan amendment, WTD assessed available scientific studies to identify information that could shape the program. Studies relating to the LDW Superfund cleanup efforts and to salmon health and recovery informed the recommendation and schedule to complete CSO control projects in LDW sooner than planned in the 1999 RWSP CSO control schedule.
CSOCP-11: Before completion of an National Pollutant Discharge Elimination System required CSO Control Plan Amendment, the executive shall submit a CSO program review report to the council and RWQC. The purpose of the review is to evaluate, at a minimum, changes to regulations, new technologies, existing CSO control performance, and human and environmental health priorities that may affect implementation of the CSO Control Plan. Based on its consideration of the CSO program review, RWQC may make recommendations to the council for modifying or amending the CSO program, including changing the sequencing of CSO projects. Any future updates or amendments to the county's long-term CSO control plan are subject to Environmental Protection Agency and Washington state Department of Ecology approvals. (Ordinance 17587 moved this portion of the previous CSOCP-8, and added language to indicate that EPA and Ecology must approve any future CSO Control Plan Amendment.)
The County Executive submitted the 2012 CSO Control Program review to the County Council in June 2012. The Council approved the program review and schedule for the amended long-term CSO control plan in September 2012. As required, the County’s 2012 long-term CSO control plan amendment was submitted to Ecology and EPA in October 2012. The next program review is scheduled to be submitted to the County Council in 2017.
CSCOP-12: King County shall implement its CSO control projects in accordance with the Environmental Protection Agency/Washington state Department of Ecology Consent Decree and the schedule outlined in the county's approved long-term CSO control plan. (Ordinance 17587 added this policy to be consistent with the Council-approved long-term CSO control plan and Consent Decree.)
Compliance with the consent decree is a top priority for the County. All the CSO control projects outlined in the consent decree are on schedule to achieve their critical milestones.
CSOCP-13: King County shall prepare a water Work on the Water Quality Assessment And
RWSP 2013 Comprehensive Review A-17

Appendix A. RWSP Policies Implementation in 2007−2013
Combined Sewer Overflow Control Policies How Implemented in 2007–2013 quality assessment and monitoring study, consistent with the guidance provided in Ordinance 17413 and other applicable legal requirements, to inform the next combined sewer overflow control program review in 2018. (Ordinance 17587 added this policy to be consistent with Ordinance 17413, which directs the County Executive to conduct a water quality assessment and monitoring study.)
Monitoring Study is under way. The scope of work for the assessment and study was approved by the County Council in September 2013. More information is available at http://www.kingcounty.gov/environment/wastewater/CSO/WQstudy.aspx.
A-18 RWSP 2013 Comprehensive Review

Appendix A. RWSP Policies Implementation in 2007−2013
RWSP Biosolids Policies
A. Explanatory material. The biosolids policies are intended to guide the county to continue to produce and market class B biosolids. The county will also continue to evaluate alternative technologies so as to produce the highest quality marketable biosolids. This would include technologies that produce class A biosolids.
Biosolids Policies How Implemented in 2007–2013 BP-1: King County shall strive to achieve beneficial use of wastewater solids. A beneficial use can be any use that proves to be environmentally safe, economically sound and utilizes the advantageous qualities of the material.
One hundred percent of King County’s Loop® biosolids were used beneficially as a soil amendment and fertilizer in agriculture and forestry or as an ingredient in compost. Loop production began at the Brightwater Treatment Plant in late 2011.
BP-2: Biosolids-derived products should be used as a soil amendment in landscaping projects funded by King County.
Specifications for the Loop compost (GroCo) have been added to King County’s standard procurement documents for use in bids and contracts. GroCo was used in landscaping at the Brightwater Treatment Plant.
BP-3: King County shall consider new and innovative technologies for wastewater solids processing, energy recovery, and beneficial uses brought forward by public or private interests. King County shall seek to advance the beneficial use of wastewater solids, effluent, and methane gas through research and demonstration projects.
Examples of efforts to meet this policy during 2007–2013 are as follows:
• Through the Northwest Biosolids Management Association (NBMA), WTD participates in biosolids-related research studies. In 2008, a research project was conducted to quantify the carbon sequestration benefits of using biosolids and other organic residuals as a soil amendment for land application. Results showed a significant increase in carbon stored in agricultural soils, indicating that use of biosolids as a soil amendment has the potential to reduce the carbon footprint while helping secure the sustainability of agriculture in the state. By sequestering carbon and avoiding synthetic fertilizers, the use of Loop offset over 42,000 tons of carbon dioxide equivalents in 2012, which is similar to taking 8,000 cars off the road.
• WTD issued a Request for Information in 2008 to learn about options for supplementing, strengthening, or diversifying the County’s biosolids program. Findings showed that generally no changes are needed at this time. The current program captures energy by producing biogas from digestion, helps reduce atmospheric carbon by storing it in the soil, provides fertilizer for crops, and is less expensive than other options.
• In summer 2009, the County began collaborating on a carbon-sequestration demonstration project in a borrow pit at Island Center Forest on Vashon Island. Researchers are evaluating the ability of composted organic residuals (biosolids, food waste, and woody debris) to recover soil quality
RWSP 2013 Comprehensive Review A-19

Appendix A. RWSP Policies Implementation in 2007−2013
Biosolids Policies How Implemented in 2007–2013 by capturing and storing carbon, improving soil health, and enhancing vegetation growth.
• In 2009, a Loop research and demonstration garden was installed at South Treatment Plant. University of Washington scientists studied the safety of vegetables grown in a sandy loam soil mix and a biosolids compost soil mix. The vegetables grown in the biosolids compost mix were deemed safe and the growth was considered lush.
• A request for information was submitted in 2012 inviting local developers and commerical owners to submit ideas for privately owned district energy systems that could extract and recover heat from WTD’s conveyance system. The goal was to gauge interest in the private sector about investing in new technologies that would make heat energy and possibly other forms of energy in the wastewater system more widely available.WTD is working with real estate developers to demonstrate how their projects can tap into this thermal energy asset.
BP-4: King County shall seek to maximize program reliability and minimize risk by one or more of the following: 1. maintaining reserve capacity to manage approximately one hundred fifty percent of projected volume of biosolids; 2. considering diverse technologies, end products, and beneficial uses; or 3. pursuing contractual protections including interlocal agreements, where appropriate.
WTD recycles 100 percent of its biosolids for use in forestry and on irrigated and dryland crops, and to make compost. In accordance with this policy, the biosolids program has permitted land, primarily in Douglas County, to maintain site capacity for 150 percent of annual volume. This additional capacity has allowed King County to recycle 100 percent of its biosolids even when one or more of its projects have temporarily reduced capacity. In addition, WTD has an agreement with the City of Everett for temporary storage for the County’s biosolids at the City’s treatment plant, which mitigates the effects of winter pass closures. When the passes reopen, the stored bisolids would be taken to Douglas County. The County continues to evaluate markets that would provide additional site capacity and environmental benefits and to investigate technologies that have the potential to cost-effectively produce Class A biosolids. Two requests for proposals were issued for composting services. While no new facilities were available, a new lower-cost, multi-year contract was awarded to the County’s long-term contractor for GroCo. More information on how the County continues to implement this policy is available in the Biosolids Strategic Plan 2012–2016, which is available at http://www.kingcounty.gov/environment/wastewater/Biosolids/DocumentsLinks.aspx.
BP-5: King County shall produce and use biosolids in accordance with federal, state and local regulations.
WTD continues to meet all regulatory requirements for production and beneficial use of biosolids. In accordance with an amendment to the state’s biosolids management rule (WAC 173-308-205),
A-20 RWSP 2013 Comprehensive Review
Appendix A. RWSP Policies Implementation in 2007−2013
Biosolids Policies How Implemented in 2007–2013 construction began in 2013 on the influent screenings project at the West Point Treatment Plant and will be completed in third quarter 2014. The project meets the rule’s requirement for “significant removal” of manufactured inerts (trash and plastics) from biosolids. The amendment rule requires treatment plants to screen these objects from the wastewater stream with 3/8-inch or finer bar screens. The West Point Plant currently has 5/8-inch screens.
BP-6: King County shall strive to produce the highest quality biosolids economically and practically achievable and shall continue efforts to reduce trace metals in biosolids consistent with 40 C.F.R. Part 503 pollutant concentration levels (exceptional quality) for individual metals. The county shall continue to provide class B biosolids and also to explore technologies that may enable the county to generate class A biosolids cost-effectively or because they have better marketability. Future decisions about technology, transportation and distribution shall be based on marketability of biosolids products.
WTD’s biosolids are routinely monitored for metals, conventional constituents (phosphorous, potassium, and pH), microbes, and organic compounds. The metal concentrations are well below the most restrictive federal and state standards. Industrial source control and pretreatment have reduced the amount of metals in biosolids by 70–90 percent since the 1980s. WTD participated in studies on the fate and degradation of trace organic compounds after land application of biosolids. Compounds include nonylphenol (a surfactant), ibubprofen, triclosan (an antibacterial), and estrogens. These are found in household cleaning products, personal care products, and pharmaceuticals. All compounds degraded quickly, and no movement in soil, leaching, or plant uptake was observed. WTD launched the County’s biosolids brand, Loop, in 2012. The development of the Loop brand is part of a long-term strategic goal to increase public support and strengthen demand for biosolids. More information on the benefits and uses of Loop is available at http://www.loopforyoursoil.com/. WTD developed an inventory of organic residuals and degraded lands managed by the County, with the objective of partnering with other county agencies to improve soils, sequester carbon, and reduce costs of managing residuals. The demonstration project at the Island Center Forest is a result of these efforts (see BP-3).
BP-7: When biosolids derived products are distributed outside the wastewater service area, the county shall require that local sponsors using the products secure any permits required by the local government body.
The local sponsors outside of the County’s wastewater service area who use biosolids are responsible for securing local support and any applicable permits relating to the use of biosolids.
BP-8: King County shall work cooperatively with statewide organizations on biosolids issues.
King County participates in local organizations and is a founding member of the NBMA, whose purpose is to share technical knowledge about biosolids management between members and to provide opportunities to work with university scientists; local, state, and federal regulators; and the general public. Through the NBMA, WTD works cooperatively with
RWSP 2013 Comprehensive Review A-21

Appendix A. RWSP Policies Implementation in 2007−2013
Biosolids Policies How Implemented in 2007–2013 regulatory officials, scientists, and other biosolids managers on regulatory issues, education and training, public information, and research and demonstration.
BP-9: King County shall seek to minimize the noise and odor impact associated with processing, transporting and applying of biosolids, consistent with constraints of economic and environmental considerations and giving due regard to neighboring communities.
In 2011, a new 10-year hauling contract was awarded. The new contract required an onboard tracking system, in advance of federal requirements to monitor both trucks and drivers. During 2011 and 2012, the biosolids program began replacing its fleet of haul trucks. The trucks are quieter and meet new EPA 2010 nitrous oxide (N2O) emission standards, lowering the N2O emissions to less than 1 percent of the emissions of the previous fleet. Construction of the West Point Treatment Plant Digestion System Improvements project was completed in 2013. The project will enhance the reliability of the West Point Plant’s solids digestion system and reduce the risk of digester upsets under current and future solids loading conditions. In addition to affecting the quality of the biosolids, these upsets could increase odor at the plant. The project also included modifications to the blending storage tank (Digester 6) to enable its use as an emergency digester if needed. WTD has procedures in place to log, investigate, and track all odor complaints. WTD’s goal is to respond to each complaint within two hours after receiving a complaint. (See TPP-4 for more information on the County’s odor goals.)
BP-10: Where cost-effective, King County shall beneficially use methane produced at the treatment plants for energy and other purposes.
The South, West Point, and Brightwater Treatment Plants use digester gas (methane) to produce heat, electricity, and natural gas. At the South Treatment Plant, digester gas that is not used for in-plant purposes is “scrubbed” to the quality required for pipeline natural gas and then sold to Puget Sound Energy. The new Waste-to-Energy cogeneration system that came online at the West Point Plant in 2013 will supply a source of green energy for plant operations and for sale to Seattle City Light per an agreement that was signed in 2009. The system will produce about 18,000 megawatt hours of electricity per year, which is the same amount of power used by 1,100 typical Pacific Northwest homes.
A-22 RWSP 2013 Comprehensive Review

Appendix A. RWSP Policies Implementation in 2007−2013
RWSP Water Reuse Policies
A. Explanatory material. The water reuse policies are intended to guide the county in continuing to develop its program to produce reclaimed water. The county will coordinate its program with regional water supply plans and work with state agencies and local jurisdictions on opportunities for water reuse. The county will implement pilot and demonstration projects. Additional projects shall be implemented subject to economic and financial feasibility assessments, including assessing environmental benefits and costs.
The water reuse policies, as in the treatment plant policies, intend that the county continue producing reclaimed water at its treatment plants. The treatment plant policies also address the potential construction of one or more satellite plants. These small plants would provide reclaimed water, with the solids being transferred to the regional plants for processing.
Water Reuse Policies How Implemented in 2007–2013 WRP-1: King County shall actively pursue the use of reclaimed water while protecting the public health and safety and the environment. The county shall facilitate the development of a water reuse program to help meet the goals of the county to preserve water supplies within the region and to ensure that any reclaimed water reintroduced into the environment will protect the water quality of the receiving water body and the aquatic environment.
WTD has been safely using reclaimed water since 1997 at the South and West Point treatment plants. Some of the reclaimed water produced at the South Plant is distributed and used off-site by reclaimed water customers, including the City of Tukwila. Starfire Sports uses reclaimed water for irrigation, and the City uses it for street sweeping, sewer flushing, and other public works uses. In March 2009, the Carnation Treatment Plant started discharging its Class A reclaimed water to enhance a wetland in the Chinook Bend Natural Area. The Brightwater Treatment Plant began producing reclaimed water in 2012. Reclaimed water is used at the Brightwater Environmental and Education Center for non-drinking purposes, such as toilet flushing and landscape irrigation. It is also used for in-plant uses. In June 2013, reclaimed water from Brightwater was distributed to Willows Run Golf Course for irrigation purposes. The County’s Reclaimed Water Program includes customer support and and development, permit compliance, and planning associated with reclaimed water use from South, Carnation, and Brightwater Plants. The County carried out two studies during this timeframe—a turf irrigation study and an ornamental plant and food crop irrigation study—in partnership with University of Washington researchers to develop local, independent, best-available science about the public health and environmental impacts of using reclaimed water. Results of both studies confirmed that that reclaimed water uses are safe for people and the environment. More information on the reclaimed water studies are available at http://www.kingcounty.gov/environment/wastewater/R
RWSP 2013 Comprehensive Review A-23

Appendix A. RWSP Policies Implementation in 2007−2013
Water Reuse Policies How Implemented in 2007–2013 esourceRecovery/ReWater/WaterResearch.aspx. Also, the County carried out a joint feasibility study with the City of Bothell, which was completed in 2013. The City has requested more information from the County on customer interests and funding options. WTD carried out a reclaimed water comprehensive planning process during this timeframe. The County worked with local jurisdictions, water supply agencies, and interested parties in the effort. The planning effort gathered informaton on potential uses for reclaimed water now and over the next 30 years and the different ways that that the County’s reclaimed water program could serve potential uses for reclaimed water.
WRP-2: By December 2007, the King County executive shall prepare for review by council a reclaimed water feasibility study as part of a regional water supply plan which will include a comprehensive financial business plan including tasks and schedule for the development of a water reuse program and a process to coordinate with affected tribal and local governments, the state and area citizens. The reclaimed water feasibility study shall be reviewed by the RWQC. At a minimum the feasibility study shall comply with chapter 90.46 RCW and include: 1. Review of new technologies for feasibility and cost effectiveness, that may be applicable for future wastewater planning; 2. Review of revenue sources other than the wastewater rate for distribution of reused water; 3. Detailed review and an update of a regional market analysis for reused water; 4. Review of possible environmental benefits of reused water; and 5. Review of regional benefits of reused water.
This policy has been fully implemented. The reclaimed water feasibility study was issued in March 2008 and reviewed by the Regional Water Quality Committee in April 2008; the study is available at http://www.kingcounty.gov/environment/wastewater/RWCompPlan/Library/Feasibility.aspx.
WRP-3: Recycling and reusing reclaimed water shall be investigated as a possible future significant new source of water to enhance or maintain fish runs, supply additional water for the region’s nonpotable uses, preserve environmental and aesthetic values and defer the need to develop new potable water supply projects.
The reclaimed water planning process collected information on potential nonpotable consumptive and environmental enhancement uses. Conceptual strategies to provide reclaimed water for some of these uses were developed and evaluated as a part of the effort. The information gathered in the planning effort will help inform any future reclaimed water opportunities that may arise. Documentation from the planning effort is available at http://www.kingcounty.gov/environment/wastewater/RWCompPlan/Library.aspx.
WRP-4: King County’s water reuse program WTD coordinated with water supply agencies during
A-24 RWSP 2013 Comprehensive Review

Appendix A. RWSP Policies Implementation in 2007−2013
Water Reuse Policies How Implemented in 2007–2013 and projects shall be coordinated with the regional water supply plans and regional basin plans, in accordance with state and federal standards. The coordination shall be done with the affected water supply purveyors. Water reuse must be coordinated with water supply/resource purveyors to ensure that resources are developed in a manner complementary with each other to allow the most effective management of resources in the county.
the reclaimed water planning process. Although a regional water supply plan has not been developed, the County remains committed to coordinating with water supply agencies on reclaimed water projects and related issues.
WRP-5: King County shall implement nonpotable projects on a case-by-case basis. To evaluate nonpotable projects, King County shall develop criteria which will include, but are not limited to: capital, operation and maintenance costs; cost recovery; potential and proposed uses; rate and capacity charge impacts; environmental benefits; fisheries habitat maintenance and enhancement potential; community and social benefits and impacts; public education opportunities; risk and liability; demonstration of new technologies; and enhancing economic development. A detailed financial analysis of the overall costs and benefits of a water reuse project shall include cost estimates for the capital and operations associated with a project, the anticipated or existing contracts for purchases of reused water, including agricultural and other potential uses, anticipated costs for potable water when the project becomes operational; and estimates regarding recovery of capital costs from new reused water customers versus costs to be assumed by existing ratepayers and new customers paying the capacity charge. Water reuse projects that require major capital funding shall be reviewed by RWQC and approved by the council.
There were no new major projects implemented during this timeframe. As opportunities arise, WTD will evaluate potential reclaimed water projects using the criteria in this policy prior to implementing any new major reclaimed water projects.
WRP-6: King County shall work with local water purveyors, including when the local purveyors update their water comprehensive plans, to evaluate the opportunities for water reuse within their local service area.
WTD participates in discussions with individual water agencies, jurisdictions, MWPAAC, and other entities concerning reclaimed water opportunities. In addition, King County Code 13.24.010 calls for water comprehensive plans to include an evaluation of reclaimed water opportunities, as required by RCW 90.46.120, and calls for sewer comprehensive plans to discuss opportunities for reclaimed water, as required under RCW 90.48.112 and 90.48.495. King County’s Utilities and Technical Review Committee (UTRC) serves as the technical review body for water and sewer utilities' comprehensive plans and works
RWSP 2013 Comprehensive Review A-25

Appendix A. RWSP Policies Implementation in 2007−2013
Water Reuse Policies How Implemented in 2007–2013 with the utilities during review of their plans.
WRP-7: King County shall develop an active water reuse public education and involvement program to correspond with the development of the water reuse program and be coordinated with other water conservation education programs.
Information on water conservation and reclaimed water is incorporated into WTD’s education programs, including the display at the Brightwater Education and Community Center. WTD’s education programs include treatment plant open houses, treatment plant tours for schools and interested groups, and information shared at public meetings, on websites, and through social media. As part of its education efforts, WTD reaches out to other education programs, local wastewater and water supply agencies, and community, environmental, and business groups. The information on how WTD implemented its Public Involvement Policies in 2007–2013 provides more information on WTD’s education and outreach programs.
WRP-8: King County shall utilize a forum or multiple forums to provide opportunities for coordination and communication with the Washington state Departments of Health and Ecology, which have the principal state regulatory roles in the planning, design and construction of reuse facilities. The county shall involve other parties on these forums, including but not limited to, the Corps of Engineers, Washington state Department of Fish and Wildlife, National Marine Fisheries Service, United States Fish and Wildlife Service, regional water suppliers, tribal governments, local water and wastewater districts, cities, local health departments, watershed forums and environmental and community groups.
This process is an ongoing element of the County’s reclaimed water program. Agencies cited in WRP-8 are regular participants, along with the County, in multiple processes and committees related to water supply and environmental and public health issues. Examples of WTD’s specific efforts during this timeframe are as follows:
• Participated in Ecology’s effort on reclaimed water rule making. The County was an active member of Ecology’s Reclaimed Water Rule Advisory Committee. The rule-making process was suspended in 2010. The governor directed state agencies to review all current and anticipated rule-making and decide what could be delayed.
• Worked closely with the groups listed in this policy during the reclaimed water comprehensive planning effort.
• Helped establish and is a board member of the WaterReuse Association’s Pacific Northwest Section. The new section will focus on local legislative and regulatory issues in Washington, Oregon, Idaho, and Alaska—and is the first WateReuse section to include multiple states.
WRP-9: King County shall work, on a case-by-case basis, with the Washington state Departments of Health and Ecology on water reuse projects including, but not limited to, those that are not specifically cited in the 1997 Department of Health and Ecology Water Reclamation and Reuse Standards.
King County works closely with the Washington State Departments of Health and Ecology on the County’s reclaimed water program, including the reclaimed water permitting processes for South, Brightwater, and Carnation treatment plants. South Plant’s reclaimed water permit was renewed in 2009, Carnation’s reclaimed water permit became effective in 2009 and was renewed in 2013, and Brightwater’s reclaimed water permit became effective in 2011.
A-26 RWSP 2013 Comprehensive Review

Appendix A. RWSP Policies Implementation in 2007−2013
Water Reuse Policies How Implemented in 2007–2013 WRP-10: King County shall hold and maintain the exclusive right to any reclaimed water generated by the wastewater treatment plants of King County.
The County continues to be in compliance with this policy. The policy is in accordance with RCW 90.46.120, which states “The owner of a wastewater treatment facility that is reclaiming water with a permit issued under this chapter has the exclusive right to any reclaimed water generated by the wastewater treatment facility.”
WRP-11: King County’s water reuse program projects shall not impair any existing water rights unless compensation or mitigation for such impairment is agreed to by the holder of the affected water rights.
The County continues to be in compliance with this policy. The policy is in accordance with RCW 90.46.130, which states “…facilities that reclaim water under this chapter shall not impair any existing water right downstream from any freshwater discharge points of such facilities unless compensation or mitigation for such impairment is agreed to by the holder of the affected water right.”
WRP-12: King County shall retain the flexibility to produce and distribute reclaimed water at all treatment plants including retaining options to add additional levels of treatment.
The County continues to look to expand customer opportunities for distributing reclaimed water from South and Brightwater treatment plants. All of the reclaimed water from the Carnation Plant is used to enhance a wetland at the Chinook Bend Natural Area. Reclaimed water produced at Brightwater, South, and West Point Plants is used for irrigation at the plant sites and for in-plant purposes.
WRP-13: King County shall continue to evaluate potential funding of pilot-scale and water reuse projects, in whole or in part, from the wastewater utility rate base.
The Reclaimed Water Feasibility Study included a review of revenue sources for reclaimed water distribution, and the reclaimed water comprehensive planning process included discussions on ways to fund future reclaimed water projects. The County’s reclaimed water projects are currently funded through the wastewater rate and reclaimed water customers.
WRP-14: King County shall complete an economic and financial feasibility assessment, including environmental benefits, of its water reuse program. The assessment shall include the analysis of marginal costs including stranded costs and benefits to estimate equitable cost splits between participating governmental agencies and utilities. The assessment shall also include a review of existing and planned water and wastewater facilities in an approved plan to ensure that water reuse facilities are justified when any resulting redundant capacity as well as other factors are taken into account.
The feasibility study that was completed per WRP-2 addressed this policy. In addition, the reclaimed water comprehensive planning process included an economic and financial feasibility assessment and an analysis of environmental benefits of the conceptual strategies that were developed as part of the process.
WRP-15: King County should pursue development of a water reuse program to discharge reclaimed water to reduce freshwater consumption used in the operation of the Ballard Locks as a priority water reuse project.
This policy is similar to the guidance in TPP-5. WTD developed and analyzed conceptual strategies for discharging reclaimed water into Lake Washington and additional reclaimed water uses in the Lake Sammamish watershed as part of the reclaimed water comprehensive planning process that took place in 2009–2012. Based on the analysis, it was determined
RWSP 2013 Comprehensive Review A-27

Appendix A. RWSP Policies Implementation in 2007−2013
Water Reuse Policies How Implemented in 2007–2013 to not pursue any of the strategies at this time. WTD will continue to monitor changing conditions or future opportunities that could result in additional reclaimed water uses in these watersheds
A-28 RWSP 2013 Comprehensive Review

Appendix A. RWSP Policies Implementation in 2007−2013
RWSP Wastewater Service Policies
A. Explanatory material. The wastewater services policies guide the county in both providing wastewater services to its customers and maintaining the wastewater system in a cost-effective, environmentally responsible manner. These policies shall also guide King County’s development and operation of community treatment systems.
King County provides wholesale wastewater treatment and disposal service to component agencies. The county’s wastewater service area boundary generally coincides with the boundaries of these component agencies, including certain areas in Snohomish county and Pierce county. The county is to provide wastewater services to areas within the respective urban growth boundaries and in rural areas only to protect public health and safety, in conformance with state provisions and local growth management act policies and regulations.
Wastewater Services Policies How Implemented in 2007–2013 WWSP-1: King County shall provide wastewater services to fulfill the contractual commitments to its component agency customers in a manner that promotes environmental stewardship, recognizes the value of wastewater in the regional water resource system and reflects a wise use of public funds.
King County has long-term agreements to provide sewage disposal and treatment services with 33 local governments and one Indian Tribe. Environmental stewardship is an important component of the County’s wastewater treatment service; WTD’s mission is to protect public health and enhance the environment by treating and reclaiming water, recycling solids, and generating energy. WTD’s vision of creating resources from wastewater is carried out in recognition of the overall value of wastewater. WTD provides high-quality wastewater treatment in as cost-effective manner as possible. The division regularly evaluates projects in the planning and design phases to identify potential cost-savings. WTD bonds are highly rated and receive low interest rates.
WWSP-2: King County shall continue to foster tribal relations as appropriate to structure processes for joint water quality stewardship.
WTD regularly works with affected Tribal Governments on its plans and projects. Activities with the Tribal Governments during the 2007 to 2013 timeframe include the following:
• Participating in workshops on environmental priorities and CSO control technologies during the 2012 CSO Control Program review
• Holding meetings and discussions with staff from area tribal governments during the reclaimed water comprehensive planning process
• Working with the Puyallup Tribal Government to address shellfish contamination of the Quartermaster Harbor area of Vashon-Maury Island and in other closed or restricted areas in the Vashon-Maury Island area
• Working with the Suquamish and Tulalip Tribal Governments to implement a shellfish program enhancement effort in the Richmond Beach area of north King County as part of the Brightwater
RWSP 2013 Comprehensive Review A-29

Appendix A. RWSP Policies Implementation in 2007−2013
Wastewater Services Policies How Implemented in 2007–2013 mitigation program
• Working with the Muckleshoot Indian and Suquamish Indian Governments in the decision process for cleaning up Duwamish River sediments and on improving equity and social justice determinants
• Working with Muckleshoot Indian Tribe regarding water or sewer plan reviews and approvals within areas of interest to the tribe.
WWSP-3: King County shall not accept additional wastewater directly from private facilities within the boundaries of a component agency without the prior written consent of such component agency.
WTD has received no such requests from private facilities since the adoption of the RWSP.
WWSP-4: King County’s wastewater service area generally has been developed along those boundaries adopted in the original metropolitan Seattle sewerage and drainage survey, substantive portions of which were adopted as the county's comprehensive water pollution abatement plan and amended. King County's wastewater service area consists of the service areas of the component agencies with which a sewage disposal agreement has been established (agreement for sewage disposal, section 2) and the county's service area boundary is the perimeter of these areas. The service area boundary for sewer service provided to Snohomish county and Pierce county shall not exceed each county’s urban growth boundary. The service area boundary within King County shall be consistent with countywide planning policy CO-14 and the King County Comprehensive Plan which permit sewer expansion in rural areas and resource lands where needed to address specific health and safety problems. To protect public health and safety, the county may assume in accordance with state procedures, the ownership of existing sewer treatment and conveyance facilities that have been constructed by a sewer district organized under state law.
The County’s wastewater service area boundary remains consistent with this policy.
WWSP-5: Extensions of existing conveyance facilities or construction of new conveyance facilities must be consistent with King County’s land use plans and policies, and certified by potentially affected land use jurisdictions as consistent with their adopted land use plans and policies.
WTD evaluates its projects during the planning process to ensure consistency with the County’s land use plans and policies. WTD maintains and reviews up-to-date local capital improvement plans for jurisdictions and sewer districts in the County’s wastewater service area and works closely with local jurisdictions through all phases of a WTD project that is planned within their jurisdiction.
A-30 RWSP 2013 Comprehensive Review

Appendix A. RWSP Policies Implementation in 2007−2013
Wastewater Services Policies How Implemented in 2007–2013 WWSP-6: King County shall operate and maintain its facilities to protect public health and the environment, comply with regulations and improve services in a fiscally responsible manner.
WTD’s mission is to protect public health and enhance the environment by treating and reclaiming water, recycling solids, and generating energy. Extensive resources have been committed to maintaining the integrity of the wastewater system and preventing sanitary sewer overflows. The Industrial Waste and Local Hazardous Waste Management programs work to control pollutants at their sources and prevent those pollutants from reaching the County’s treatment plants. The King County Council’s review of WTD’s programs, priorities, and costs during the annual rate setting process and Council’s budget process provides additional assurance that WTD is carrying out its programs in a fiscally responsible manner.
WWSP-7: King County shall plan, design and construct wastewater facilities in accordance with standards established by regulatory agencies and manuals of practice for engineering.
WTD designs and constructs wastewater treatment facilities to ensure that they fully comply or exceed regulatory and permit requirements. WTD applies science and engineering to planning, design, and construction of facilities and follows industry-recognized standards. As a result, the County’s wastewater system exceeds the reliability standards of most major metropolitan systems and has been able to absorb record storm events in recent years with little effect on public health and safety. WTD participates in national organizations and associations that address issues such as pumping standards, treatment and odor control standards and technologies, and predictive modeling tools. In addition, WTD follows the guidelines in the Criteria for Sewage Works Design manual. Ecology prepares this manual, also known as the “Orange Book.” It serves as a guide for the design of wastewater collection, treatment, and reclamation systems and addresses requirements that will lead to approvable plans. WAC 173-240-040 requires that sewer plans and specifications are reasonably consistent with the Orange Book.
WWSP-8: King County shall construct, operate and maintain facilities to prevent raw sewage overflows and to contain overflows in the combined collection system. In the event of a raw sewage overflow, the county shall initiate a rapid and coordinated response including notification of public health agencies, the media, the public and the affected jurisdiction. Preserving public health and water quality shall be the highest priority, to be implemented by immediately initiating repairs or constructing temporary diversion systems that return flow back to the wastewater system.
Implementation of the RWSP ensures that adequate wastewater capacity will be available when needed. The various sections and work units of WTD coordinate to assess needs and prioritize projects to prevent overflows. WTD’s forecasting and demand-modeling capabilities, in-field flow monitoring, and ongoing facility inspections provide essential information to identify and address capacity, operational, and maintenance needs. WTD has established emergency response procedures in the event of sewage overflows.
WWSP-9: To ensure the region’s multibillion- WTD’s formal and detailed Strategic Asset
RWSP 2013 Comprehensive Review A-31

Appendix A. RWSP Policies Implementation in 2007−2013
Wastewater Services Policies How Implemented in 2007–2013 dollar investment in wastewater facilities, an asset management program shall be established that provides for appropriate ongoing maintenance and repair of equipment and facilities. The wastewater maintenance budget, staffing levels and priorities shall be developed to reflect the long-term useful life of wastewater facilities as identified by the asset management program.
Management Plan (SAMP) that was developed in 2006 was updated in 2010. The next update is scheduled for 2014. The focus of the SAMP is to balance lifecycle costs and risks at the asset level. To optimize stewardship of ratepayer dollars, minimize risk of asset failure and comply with regulations WTD’s Asset Management Program (AMP) is sustained at all levels of the division through the Asset Management Steering Committee (AMSC), Maintenance Best Practices Steering Committee (MBPSC), Technical Standards Committee (TSC) and the Computerized Maintenance Management System (CMMS) Users Group. WTD’s AMP strives to apply the whole life (cradle to grave) approach to its assets. The focus is holistic, starting with the development of technical standards and predesign (what we build), project management and engineering (how we build it), O&M (how we operate and maintain it from commissioning through decommissioning and disposal), and finance (how we pay for it). The ability to measure and improve each step of the asset management process is the function of the Key Performance Indicator (KPI) Program, which is currently being updated. Another important element is tracking, scheduling, and assessing asset management and performance over the life of the asset. A high priority for WTD is to ensure this essential information is kept current in its CMMS.
WWSP-10: The asset management program shall establish a wastewater facilities assets management plan, updated annually, establishing replacement of worn, inefficient and/or depreciated capital assets to ensure continued reliability of the wastewater infrastructure.
Regularly scheduled condition assessments are performed on the conveyance system and facility structures. Findings and rehabilitation recommendations are reported in a facilities inspection annual work plan and are tracked in CMMS. The lifecycle of process equipment, facility structures, and the conveyance system is managed under the SAMP.
WWSP-11: King County shall design, construct, operate and maintain its facilities to meet or exceed regulatory requirements for air, water and solids emissions as well as to ensure worker, public and system safety.
WTD’s treatment plants continue to meet and. in most cases, exceed permit requirements. In 2013, all of the County’s treatment plants operated without any violation of their NPDES permit effluent limits. The Industrial Waste Program permits discharges into the sewer that are not hazardous to workers and cause no environmental harm. For emergencies, WTD has procedures in place to ensure worker, public, and system safety.
A-32 RWSP 2013 Comprehensive Review

Appendix A. RWSP Policies Implementation in 2007−2013
Wastewater Services Policies How Implemented in 2007–2013 WWSP-12: King County shall accept sewage, septage and biosolids from outside its service area provided that it is consistent with the King County Comprehensive Plan or the comprehensive plan of the source jurisdiction, capacity is available and no operating difficulties are created. The county shall establish a rate to recover costs from accepting sewage, septage and biosolids from outside its service area.
Services are monitored for consistency with applicable plans and to ensure they cause no adverse impact to the wastewater system. A separate rate, based on solids content, has been established to cover the costs of processing deliveries of septage and biosolids at the South Treatment Plant.
WWSP-13: King County shall identify the potential for “liability protection” for component agencies for unexpected costs associated with water quality requirements.
This policy was developed in 1999, soon after Chinook salmon was listed as a threatened species under the Endangered Species Act. There was discussion that if the County were to do a Habitat Conservation Plan (HCP) for the entire wastewater service area, there might be a way for the local agencies to achieve “liability protection” under WTD’s HCP. WTD discontinued the work on the HCP in April 2005 after the first phase was completed.
WWSP-14: King County shall continue its long-standing commitment to research and development funding relating to water quality and technologies for the wastewater system.
Examples of studies undertaken in this timeframe include:
• Nitrogen Removal Study. WTD conducted two studies to evaluate the impacts of a range of potential nitrogen limits on capital and operating costs at the South Treatment Plant and West Point Treatment Plant. The studies evaluated a variety of nitrogen removal technologies and used existing treatment plant data and computer modeling to develop capital costs, O&M costs and greenhouse gas (GHG) emissions for each regulatory scenario. Results of the studies show that the costs of upgrading the South Treatment Plant would range from approximately $0.5 billion to $1 billion with an associated operating cost increase of $10 to $33 million per year. The estimated costs of upgrading the West Point Treatment Plant is $1 billion with an operating cost of $30 million per year. Upgrading the West Point Plant to remove nitrogen would substantially reduce its treatment capacitybecause of lack of available space and would therefore require construction of one or more new treatment plants with a total design capacity of 75–150 mgd.
• South Plant Biogas Utilization. The South Plant biogas scrubber system currently processes biogas produced by the solids digestion system to convert it into high-quality bio-methane (natural gas). This gas is then injected into the nearby natural gas pipeline and sold to Puget Sound Energy. Critical elements of the biogas recovery and
RWSP 2013 Comprehensive Review A-33

Appendix A. RWSP Policies Implementation in 2007−2013
Wastewater Services Policies How Implemented in 2007–2013 energy production system are aging and will require replacement in the near future. A study was conducted to assess the system to determine if it still provides the best and highest use the biogas. The study concluded that replacing the gas scrubbing system with new technology and upgrading the plant heating systems would resolve substantial issues at a similar capital cost but significantly lower lifecycle cost when compared to the status quo alternative or other alternatives evaluated (including internal combustion engine generators).
• Grease Co-Digestion at South Plant. WTD has been investigating the potential of adding organic wastes (such as food waste) to the sewage solids that are processed in anaerobic digesters (“co-digestion”) at the South Plant. Recent WTD studies have investigated the costs and potential revenues associated with establishing a waste restaurant grease (“brown grease”) receiving facility. Brown grease is typically processed in rendering facilities and/or disposed of in landfills. There is a shortage of facilities that can cost-effectively convert the grease to energy. When restaurant grease is mixed into anaerobic digesters, it can substantially increase the production of valuable biogas that can be used to produce renewable energy. Numerous wastewater treatment facilities have successfully implemented brown grease co-digestion programs. In addition to continuing to assess the benefits of a facility at South Plant, WTD is actively working with private entrepreneurs to determine if the private sector could cost-effectively convert this waste product into renewable energy.
WWSP-15: King County will consider development and operation of community treatment systems under the following circumstances: 1. The systems are necessary to alleviate existing documented public health hazards or water quality impairment; 2. Connections to public sewers tributary to conventional wastewater treatment facilities are not technically or economically feasible; 3. Installation of on-site septic systems is not technically feasible; 4. Properties to be served by said systems are within the jurisdiction and service area of a local government authority authorized to provide sewer service; 5. The local sewer service provider agrees to own and operate the collection system tributary
The County continues to own and operate the Beulah Park/Cove Treatment Facility on Vashon Island in accordance with this policy.
A-34 RWSP 2013 Comprehensive Review

Appendix A. RWSP Policies Implementation in 2007−2013
Wastewater Services Policies How Implemented in 2007–2013 to the community treatment system; 6. Development of the community systems and provision of sewer service are consistent with all applicable utility and land use plans; and Public sewer extensions shall be in compliance with King County Comprehensive Plan Policy F-313 as in effect on March 11, 1999.
RWSP 2013 Comprehensive Review A-35

Appendix A. RWSP Policies Implementation in 2007−2013
RWSP Water Quality Protection Policies
A. Explanatory materials. The water quality protection policies are intended to guide King County in identifying and resolving regional water quality issues, protecting public and environmental health and protecting the public’s investment in wastewater facilities and water resource management. Research and analysis are required and will be used to evaluate water quality in county streams and other bodies of water within the service district.
Water Quality Protection Policies How Implemented in 2007–2013 WQPP-1: King County shall participate in identifying and resolving water quality issues pertaining to public health and ecosystem protection in the region to ensure that the public's investment in wastewater facilities and water resource management programs is protected.
King County monitors the waters and sediments near treatment plant and CSO outfalls to ensure compliance with water quality regulations and to quickly identify and resolve water quality issues. King County’s Trouble Call Program responds to water quality emergencies in King County. The primary role of this program is to support WTD. The program also investigates activities such as illegal spills, dump sites, construction erosion and sediment control problems, unknown discharges from outfalls, algal blooms, and fish kills. The program’s mission is to respond, investigate, and work cooperatively with agencies on water quality complaints and emergency environmental situations within the greater King County region. More information on the program is available at http://www.kingcounty.gov/environment/wlr/sections-programs/environmental-lab/trouble-call.aspx.
WQPP-2: King County shall evaluate the impacts and benefits of actions that affect the quality of the region’s waters and identify measures to meet and maintain water quality standards.
WTD builds, operates, and maintains wastewater facilities to ensure the County meets or exceeds water quality regulations and standards, such as NPDES discharge limitations. In 2007 through 2012, West Point and South treatment plants received the National Association of Clean Water Agencies (NACWA) Platinum Peak Performance Award each year for operating multiple consecutive years of compliance with NPDES permit effluent limits. The Vashon Treatment Plant received NACWA’s Silver Peak Performance Award in 2010 and the Gold Award in 2011 and 2012. NACWA’s Silver Awards are presented to facilities with no more than five NPDES violations in a year and Gold Awards are presented to facilities with no NPDES permit effluent limit violations in a year. In 2011, the Vashon Plant had one effluent limit violation because of a pH exceedance that occurred on December 12, and in 2012, the plant earned Ecology’s “Outstanding Performance Award” for meeting all the conditions of its NPDES permit with no violations of any kind. The Vashon Plant met its NPDES permit effluent requirements in 2007 through 2009. The Carnation Treatment Plant received NACWA’s Gold Award in 2010 and 2012, and the Silver Award in 2011. In 2011, the plant exceeded its reclaimed water
A-36 RWSP 2013 Comprehensive Review

Appendix A. RWSP Policies Implementation in 2007−2013
Water Quality Protection Policies How Implemented in 2007–2013 permit instantaneous maximum turbidity limits on two days in March. All of the County’s treatment plants met their NPDES permit effluent limits in 2013. At the time of publication of this report, NACWA had not awarded its peak performance awards for 2013. The County’s CSO Control Program, Protecting Our Waters, and amended long-term CSO control plan is designed to protect water quality in the water bodies where the County’s CSOs discharge. The County is on schedule to meet all the milestones associated with its CSO Control Program and consent decree to ensure all the County’s CSOs are controlled by 2030. About one-half of the County’s CSOs are controlled to the state standard of one untreated overflow from each location per year on average. Construction is under way on four CSO control projects along Puget Sound beaches, and work has begun on two CSO control projects in the Lower Duwamish Waterway that were approved by the County Council in 2012 as part of the County’s amended long-term CSO control plan.
WQPP-3: King County shall forecast future aquatic resource conditions that may affect wastewater treatment decisions and work cooperatively to identify cost-effective alternatives to mitigate water quality problems and enhance regional water quality.
King County routinely monitors and models the condition of County water resources and uses information from these efforts and from other programs in the region to identify trends. The Water Quality Assessment And Monitoring Study that is under way and was approved through Ordinance 17413 aligns with this policy. The assessment is examining local water quality concerns near King County CSOs in Elliott Bay, Lake Union/Ship Canal, and the Duwamish River.
WQPP-4: King County shall participate with its regional partners to identify methods, plans and programs to enhance water quality and water resources in the region.
King County works with other entities in the region on water quality monitoring and protection programs, including cities, Tribes, and state and federal agencies. The County monitoring data is routinely used by Ecology when they present monitoring results in the Puget Sound region. The County continues to work with Ecology and local jurisdictions on developing and implementing Total Maximum Daily Loads for impaired surface waters and to develop a more coordinated ambient monitoring program. Since 2008, multiple agencies and organizations, including the County, are participating in a regional stormwater monitoring coordination effort to ensure cost efficiencies and avoid duplication in the monitoring programs. The regional monitoring recommendations have been incorporated into stormwater NPDES permits for jurisdictions. The County also participates on coordination committees regarding toxic chemical monitoring, marine water quality monitoring, and
RWSP 2013 Comprehensive Review A-37

Appendix A. RWSP Policies Implementation in 2007−2013
Water Quality Protection Policies How Implemented in 2007–2013 freshwater monitoring. The County continues to provide technical assistance to the Puget Sound Partnership (PSP). The County also participates in the South Central Caucus Group, which is the local integrating organization (LIO), for PSP’s South Central Puget Sound Action Area and the Snohomish-Stillaguamish LIO, which is one of the LIOs for the PSP’s Whidbey Action Area.
WQPP-5: The King County executive shall implement a comprehensive water quality monitoring program of streams and water bodies that are or could be impacted by influent, effluent, sanitary system overflows or CSOs. The range of data to be gathered should be based on water pollutants and elements that scientific literature identifies as variables of concern, what is needed to substantiate the benefits of abating combined sewer overflows and what is required by state and federal agencies. The executive shall submit summary reports and comprehensive reviews of this information to the King County council as outlined in K.C.C. 28.86.165.
A summary report on the County’s comprehensive water quality monitoring program is provided in the RWSP annual reports. Monitoring results are also provided annually in the environmental indicator tab of the County’s Department of Natural Resources and Parks KingStat website at http://your.kingcounty.gov/dnrp/measures/.
WQPP-6: King County shall implement and maintain water quality, monitoring, evaluating and reporting programs to support the national pollutant discharge elimination system for wastewater and other permit applications, and ensure permit compliance.
King County has ongoing monitoring programs that assess discharge quality for permit compliance. Ambient water and sediment quality monitoring provides background information and assists in identifying any adverse impacts from wastewater facilities. The specific programs that were under way in this timeframe and support the regional wastewater treatment system’s needs are as follows:
• Marine water quality monitoring, including routine offshore and nearshore water quality, continuous water quality, and sediment quality in King County’s marine waters
• Lake Union, Lake Washington, and Lake Sammamish water quality monitoring, including routine water quality and continuous water quality
• Stream water quality monitoring in Water Resource Inventory Areas (WRIAs) 8 (greater Lake Washington watershed) and 9 (Green/Duwamish watershed) and on Vashon Island, including routine water quality, stream benthos (bottom-dwelling organisms), and pollution source identification
• Streamflow and temperature monitoring in WRIAs 8 and 9
• Freshwater swimming beach monitoring in WRIAs 8 and 9
• Toxics and contaminant assessment in fish tissue in Lake Washington and addressing new and emerging
A-38 RWSP 2013 Comprehensive Review

Appendix A. RWSP Policies Implementation in 2007−2013
Water Quality Protection Policies How Implemented in 2007–2013 contaminants of concern
• Watershed impact assessment/management support affecting the WTD service area.
In response to a proviso in the 2012 King County Budget, a report on King County’s water quality monitoring was provided to the King County Council in April 2012. The report is available at http://green.kingcounty.gov/WLR/Waterres/StreamsData/pdf/King-County-WTD-Proviso-Final-4-18-12.pdf.
WQPP-7: King County shall actively participate in the development of water quality laws, standards and program development to ensure cost-effective maintenance or enhancement of environmental and public health.
The County regularly participates in the development of effective and reasonable regulations, both on its own and through professional organizations such as NACWA, Water Environment Federation, Water Reuse Association, and Pacific Northwest Clean Water Association. The County participates in advisory groups, contributes technical information, and reviews and comments on proposals. County staff has also been participating in nationwide discussions on emerging chemicals of concerns. The County participates on committees associated with Ecology’s water quality related rule-making processes and efforts to update water quality standards. For example, the County is a member of Ecology’s “Delegate’s Table” that was formed in 2012 to provide advice and perspective to Ecology on the water quality standards rule-making process that is under way. The County also participated in Ecology’s reclaimed water rule-making process, which was suspended in 2010. In addition, the County has been working closely with Ecology and the U.S. Environmental Protection Agency (EPA) in developing and evaluating Lower Duwamish Superfund cleanup options.
WQPP-8: King County shall assess the risk to human health and the environment from wastewater treatment and conveyance activities, and use this information in evaluating water pollution abatement control options.
Results of the water quality monitoring activities described in WQPP-6 help to inform WTD of any risks to public health and environment from its facilities. WTD operates and maintains its facilities to ensure they are operating well and meet or exceed permit and other requirements that are designed to protect public health and the environment. In addition, during design and construction of wastewater facilities, WTD works with the affected communities and regulatory agencies to ensure measures are taken to minimize adverse impacts to the public or the environment during construction or operations.
RWSP 2013 Comprehensive Review A-39

Appendix A. RWSP Policies Implementation in 2007−2013
RWSP Wastewater Planning Policies
A. Explanatory material. The wastewater planning policies are intended to guide the county in its long-term comprehensive planning for design and construction of facilities that meet the wastewater needs of customers within the service area.
Recognizing that the RWSP is a complex and dynamic comprehensive development guide that will regularly need to be updated, the county will conduct annual reviews of plan implementation and its consistency with policies, and of scientific, economic and technical information as well as periodic comprehensive reviews of the assumptions on which the RWSP is based.
These policies also express the intent of the council to request that the RWQC continue review of the conditions and assumptions that guide the implementation of the RWSP.
Wastewater Planning Policies How Implemented in 2007–2013 WWPP-1: King County shall plan comprehensively to provide for the design and construction of facilities that meet the wastewater system needs of the service area and shall coordinate with other local jurisdictions to ensure that construction-related disruption to neighborhoods is minimized.
WTD considers several factors to ensure comprehensive wastewater planning. Flow monitoring and facilities inspections provide key information related to capacity, maintenance, and asset replacement needs. WTD reviews population and employment forecasts, water conservation and water use assumptions, and rainfall data and then incorporates updated information into its planning of facilities. In addition, WTD reviews the comprehensive plans of its local agencies and meets with representatives of those agencies to confirm planning assumptions as well as to coordinate construction related activities. WTD regularly works with permitting agencies, local jurisdictions, and affected neighbors during the planning, design, and construction of projects to minimize construction related disruptions. Agreements related to hours of construction, parking for construction workers, noise control, and traffic control measures often result from these efforts.
WWPP-2: In planning future wastewater systems, King County shall make a long-term assessment of wastewater system needs.
To protect public health and water quality, it is essential to plan wastewater facilities before they are needed. Current planning takes into account a 50-year planning horizon from the base year 2010. This means that 2060 represents the year that WTD assumes that all the sewerable portions of the County’s service area will be sewered. However, WTD expects the population in its service area to continue to increase after 2060. To ensure that existing and planned facilities will meet future needs, the County monitors population and employment forecasts, comprehensive plans of the local agencies, the potential for new regulations, new technologies, and information relating to climate change.
WWPP-3: In planning for facilities, King County shall work collaboratively with other jurisdictions and look for opportunities to
WTD coordinates with local jurisdictions and agencies during planning and implementation of projects. Examples during the 2007−2013 timeframe are as
A-40 RWSP 2013 Comprehensive Review

Appendix A. RWSP Policies Implementation in 2007−2013
Wastewater Planning Policies How Implemented in 2007–2013 achieve cost-savings. follows:
• Update of RWSP planning assumptions. WTD coordinated closely with the Engineering and Planning Subcommittee of MWPAAC and individual local agencies during the review and update of the RWSP planning assumptions for the RWSP 2013 comprehensive review.
• Skyway initial I/I reduction project. This project was managed and funded by King County in partnership with the Skyway Water and Sewer District. As part of the cost-share agreement, the project rehabilitated mains and manholes in the project basin at the District's cost.
• Bellevue Influent Trunk project. This project was completed in 2012. It included design and construction of a new portion of the City of Bellevue’s West Central Business District (CBD) Trunk. Under a cost-share agreement, the City of Bellevue covered the costs associated with the improvements to the CBD Trunk and shared a portion of the design, construction, and staff labor costs.
• Ballard Siphon Replacement project. Coordination within WTD also provides opportunities for cost-savings. Control of the Ballard CSO was incorporated into this project, which was completed in 2013.
• Long-term CSO control plan. The County worked closely with the City of Seattle during development of the County’s amended long-term CSO control plan, which was approved by the County Council in September 2012. Three of the nine CSO control projects that were approved are identified as potential joint projects with Seattle to control both agencies’ CSOs in the 3rd Ave W, University, and Montlake CSO basins. Five small transfers of flows from Seattle projects to the King County system have also been identified; the City would reimburse the County for any O&M costs associated with these flows. The County and City continue to discuss the potential for these joint projects.
• RainWise. Over 250 rain gardens and cisterns are now helping to control stormwater runoff and preventing CSOs as part of the RainWise Program in Seattle. Seattle Public Utilities (SPU) started the successful program in 2010 to pay for rain gardens and cisterns on private property in some parts of the city. WTD is now also offering the RainWise Program to homeowners through a memorandum of agreement with the SPU; the
RWSP 2013 Comprehensive Review A-41

Appendix A. RWSP Policies Implementation in 2007−2013
Wastewater Planning Policies How Implemented in 2007–2013 agreement outlines the cost-sharing and other responsibilities of each agency.
• Lower Duwamish Waterway Superfund cleanup. The County is an active participant in the Lower Duwamish Waterway Group (LDWG), which consists of King County, the City of Seattle, the Port of Seattle, and the Boeing Company. The LDWG has been working with EPA and Ecology since 2001 to study contamination and determine the best and most effective alternatives to clean up the LDW.
WWPP-4: Facility sizing shall take into account the need to accommodate build-out population.
As noted in WWPP-2, current planning considers needs over a 50-year planning horizon, through 2060. The year 2060 represents when potentially sewerable portions of the County’s service area are expected to be sewered. WTD evaluated regional treatment plant capacity needs through 2060 as part of the process to complete the RWSP 2013 comprehensive review. The 2015 CSI program update will evaluate and identify separated conveyance system capacity needs over a 50-year planning horizon, through 2060.
WWPP-5: RWSP review processes. King County shall monitor the implementation of the RWSP and conduct reviews of the RWSP as outlined in K.C.C. 28.86.165.
During 2007−2013, RWSP annual reports were submitted in accordance with the reporting policies outlined in K.C.C. 28.86.165. The RWSP 2013 comprehensive review has been completed following the guidance provided in K.C.C. 28.86.165.
A-42 RWSP 2013 Comprehensive Review

Appendix A. RWSP Policies Implementation in 2007−2013
RWSP Environmental Mitigation Policies
A. Explanatory material. The environmental mitigation policies are intended to guide King County in working with communities to develop mitigation measures for environmental impacts from the construction and operation of wastewater facilities. These policies also ensure that the siting and mitigation processes for wastewater facilities are consistent with the Growth Management Act and the state Environmental Policy Act.
Environmental Mitigation Policies How Implemented in 2007–2013 EMP-1: King County shall work with affected communities to develop mitigation measures for environmental impacts created by the construction, operation, maintenance, expansion or replacement of regional wastewater facilities. These mitigation measures shall: 1. Address the adverse environmental impacts caused by the project; 2. Address the adverse environmental impacts identified in the county’s environmental documents; and 3. Be reasonable in terms of cost and magnitude as measured against severity and duration of impact.
During the planning, design and construction of projects, WTD works with permitting and regulatory agencies, local jurisdictions, tribes, and affected businesses and residents to identify measures to avoid and minimize environmental impacts that could result from the construction, operation, maintenance, and expansion or replacement of regional wastewater facilities. Adverse environmental impacts and associated mitigation are typically identified during project review under the State Environmental Policy Act and consultations or reviews required by local, state and federal regulations (such as Endangered Species Act and National Historic Preservation Act). Examples of mitigation related activities that occurred in 2007–2013 are as follows:
• Barton Pump Station Upgrade project. Construction impacts associated with this project include temporary closure of a Fauntleroy Ferry Terminal toll collection lane and the release of odorous air when the pump station wetwell was exposed. To address these impacts, the County worked with Washington State Ferries to develop an operational strategy (such as closing the ferry lane only during non-peak use times) and agreed on traffic control plans to minimize impacts to ferry traffic. To minimize odor impacts during construction, an aboveground temporary odor control unit will be located at the project site to treat foul air from the wetwell. Following construction, part of the site will be restored for use as a street-end park containing a community-maintained garden and artwork and providing beach access. The County incorporated community input into the landscaping plan for the site and measures for protecting and replacing artwork.
• Barton CSO Control project. The County proposed construction rain of gardens, a low impact development approach, for controlling CSOs in the Barton basin rather than constructing a large tank that would have had a higher potential for adverse environmental impacts. The County responded to community
RWSP 2013 Comprehensive Review A-43

Appendix A. RWSP Policies Implementation in 2007−2013
Environmental Mitigation Policies How Implemented in 2007–2013 concerns by reducing the number of proposed curb extensions and locating rain gardens on one side of the street instead of both to preserve mature trees. The County is minimizing impacts by phasing construction.
• Murray CSO Control project. Based on community feedback received during predesign, the County decided to locate the CSO storage facility on private properties occupied by residential buildings rather than in a public park. Mitigation included compensation to property owners for fair market value of the properties and relocation benefits to eligible tenants. Project design elements were developed by a professional artist and landscape architect with input by community members to address concerns about potential aesthetic impacts. Design elements include the provision of public access to portions of the project site, maintenance of Puget Sound views from publicly accessible areas, finishes and landscaping that have a more park-like than industrial feel, and redesign of Beach Drive to discourage through-traffic.
• North Beach CSO Control project. Based on community feedback received during predesign and design, the County located the CSO storage facility below an existing street and configured it so as to minimize impacts to residential and park access during construction. A new permanent aboveground ancillary equipment facility was situated on the project site and designed so that it would not block views of Puget Sound from nearby residences. The County worked with the City of Seattle on a street restoration plan to ensure that the design addressed community’s concerns. The City proposed new street lights, but did not require them after the County conveyed the community’s concerns about light pollution in the residential area that currently has unobstructed views of Puget Sound. The street restoration plan also included reconfiguration of the intersection in which the storage facility is located to increase pedestrian and vehicle safety.
• Kent/Auburn Conveyance System Improvement project. The County developed traffic control plans for this trenched pipeline installation project. The plans included traffic and pedestrian detour routes, flaggers, notice to businesses, residences, and a school of times when construction would be nearby. The County minimized the impact of trenching through a school playground by performing the work during
A-44 RWSP 2013 Comprehensive Review
Appendix A. RWSP Policies Implementation in 2007−2013
Environmental Mitigation Policies How Implemented in 2007–2013 the summer. A professional archaeologist monitored activities in culturally sensitive project areas.
EMP-2: Mitigation measures identified through the state Environmental Policy Act process shall be incorporated into design plans and construction contracts to ensure full compliance.
This policy is implemented for every project that undergoes the SEPA review process. WTD environmental planners prepare checklists and review construction plans and specifications to make sure mitigation measures are included in these documents. Typical mitigation measures included in SEPA checklists for WTD projects include the following:
• Temporary erosion and sedimentation control measures during project construction
• Measures to minimize noise, such as mufflers or sound barriers
• Landscaping and architectural features to help a facility blend into the surrounding area
• Actions to minimize light and glare • Construction traffic routing and parking plans
EMP-3: The siting process and mitigation for new facilities shall be consistent with the Growth Management Act and the state Environmental Policy Act, as well as the lawful requirements and conditions established by the jurisdictions governing the permitting process.
Wastewater treatment facilities are considered essential public facilities under the Growth Management Act. WTD plans new facilities or upgrades to existing facilities to ensure capacity is available when needed. Environmental, community, cost, right-of-way, and regulatory considerations are included in the process to site new wastewater facilities. WTD staff works with permitting agencies and local jurisdictions to ensure projects and facilities comply with applicable requirements and conditions.
EMP-4: King County shall mitigate the long-term and short-term impacts for wastewater facilities in the communities in which they are located. The county’s goal will be to construct regional wastewater facilities that enhance the quality of life in the region and in the local community, and are not detrimental to the quality of life in their vicinity.
King County is committed to being a good neighbor with its wastewater facilities. The examples provided in EMP-1 align with this policy.
RWSP 2013 Comprehensive Review A-45

Appendix A. RWSP Policies Implementation in 2007−2013
Environmental Mitigation Policies How Implemented in 2007–2013 EMP-5: King County shall enter into a negotiated mitigation agreement with any community that is adversely impacted by the expansion or addition of major regional wastewater conveyance and treatment facilities. Such agreements shall be executed in conjunction with the project permit review. Mitigation shall be designed and implemented in coordination with the local community, and shall be at least ten percent of the costs associated with the new facilities. For the south treatment plant and for the new north treatment plant, a target for mitigation shall be at least ten percent of individual project costs, or a cumulative total of ten million dollars for each plant, whichever is greater, provided that mitigation funded through wastewater revenues is consistent with: chapter 35.58 RCW; Section 230.10.10 of the King County Charter; agreements for sewage disposal entered into between King County and component agencies; and other applicable county ordinance and state law restrictions.
This policy was written with the construction of a new third regional treatment system (now known as the Brightwater Treatment System) and the anticipated full future expansion of the South Plant in mind. The Brightwater systemwide mitigation package that has been implemented complied with this policy.
A-46 RWSP 2013 Comprehensive Review

Appendix A. RWSP Policies Implementation in 2007−2013
RWSP Public Involvement Policies
A. Explanatory material. The public involvement policies are intended to guide the county in maintaining public information and education programs and to engage the public and component agencies in planning, designing and operating decisions that affect them.
Public Involvement Policies How Implemented in 2007−2013 PIP-1: King County shall maintain public information/education programs and engage the public and component agencies of local sewer service in the planning, designing and operating decisions affecting them.
WTD holds monthly meetings MWPAAC to share information with local agencies on programs and projects that are at various stages of planning and implementation.
WTD routinely engages public officials and residents in the planning and decision-making process for its projects and programs. Here are some examples of how the public influenced WTD decisions:
• With the help of a group of educators who raised more than $1 million, the Brightwater Center achieved platinum LEED status. The Brightwater Center is an environmental education and community center built to replace a grange hall on the Brightwater site.
• 53rd Avenue Pump Station improvements were designed to expand the facility underground in order to maintain neighborhood views.
• As part of the Ravenna Creek Pipe Extension, WTD removed invasive weeds and replaced native plants in some areas around the Ravenna Creek Daylighting Project in the south end of Ravenna Park.
• Neighbors of the Murray Pump Station worked with WTD designers to minimize the “industrial facility” feel, encourage views of Puget Sound, discourage through-traffic on Beach Drive, and enhance continuous space between Lowman Beach Park and the facility site.
• WTD responded to a West Seattle community’s concerns by minimizing the number of blocks and the number of parking spaces required for a GSI project. Neighbors have input on street trees and many want a rain garden on their own property.
• MWPAAC participated in the process to amend the CSO control plan in 2012. Members also provided significant input on the proposed CSO control policy updates that were developed to be consistent with the CSO control plan and the CSO consent decree. These CSO control policies were approved by the King County Council in May 2013.
• Industrial waste customers provided advice on policies, procedures, and program priorities
RWSP 2013 Comprehensive Review A-47

Appendix A. RWSP Policies Implementation in 2007−2013
Public Involvement Policies How Implemented in 2007−2013 through an advisory committee, customer survey, and program workshops.
PIP-2: King County shall develop public information and education programs to support county wastewater programs and shall lay the groundwork for public understanding of and involvement in specific programs.
WTD places high importance on educating the public regarding the wastewater system, projects and services. Innovations in 2007−2013 include the following:
• WTD’s website transitioned to a new domain www.kingcounty.gov in 2007−2008 and was improved to make it more user-friendly and informative. The website includes information on the county’s wastewater system and process, programs planned for the future, projects in design and construction, and the sewer rate and the capacity charge.
• The status of King County and Seattle CSOs is now on the web in real time. King County worked with Seattle in 2011 to bring its overflow information into the County’s website in order to streamline the public’s access to the information. http://www.kingcounty.gov/environment/wastewater/CSOstatus.aspx
• The King County Equity and Social Justice Ordinance (launched as in initiative in 2008) has shaped the way WTD implements the public involvement policies. Information is being provided in multiple languages, and other techniques are being used to reach people who might not have traditionally participated in these processes.
• WTD has been expanding its use of social media tools to include Facebook, Twitter, U-tube, Vimeo, and Flickr.
Ongoing activities from 2007−2013 include the following:
• Public information and outreach: web pages, open houses, information booths, displays, speakers bureau, wastewater treatment facility tours, and education partnerships.
• Two-way dialogue: briefings, 24-hour hotlines, advisory groups, public meetings, canvassing neighborhoods with fliers, newsletters, mailings, response to inquiries, on-line forms.
• Response to odor complaints within two hours.
• Response to over 15,000 customer calls every year from ratepayers about the monthly sewer and capacity charge rates.
• Outreach to industrial businesses regarding federal and King County pretreatment regulations, policies, and procedures: meetings,
A-48 RWSP 2013 Comprehensive Review

Appendix A. RWSP Policies Implementation in 2007−2013
Public Involvement Policies How Implemented in 2007−2013 newsletters, fact sheets and web page with easy access to tools and forms.
• Media relations to keep local news media informed about WTD projects and programs that affect the neighborhoods they serve and provide general information on the wastewater system.
See PIP-5 for more information on WTD’s educational programs.
PIP-3: King County shall involve public officials and citizens of affected jurisdictions early and actively in the planning and decision-making process for capital projects.
A public involvement initial needs assessment is conducted at the beginning of every WTD capital project to assess opportunities for early and active involvement. The assessment is used to tailor public involvement plans for specific projects. Examples of how early, active involvement shaped capital projects are as follows:
• Public officials and the public had many opportunities to comment on and shape the 2012 CSO Control Program review. Information was available through briefings, presentations, and workshops; in public libraries; and on the Web. Materials were available in five languages. http://www.kingcounty.gov/environment/wastewater/CSO/ProgramReview.aspx
• Our Duwamish is a website designed to provide one location for information on all the services King County provides in the Duwamish area and links to opportunities to comment on EPA’s Superfund cleanup plan. http://www.kingcounty.gov/environment/watersheds/green-river/OurDuwamish.aspx
• In 2013, outreach was under way in the Duwamish area, where WTD has large CSO control projects (Brandon-Michigan, Hanford) planned over the next several years. While continuing to maintain existing relationships, WTD is also reaching out to diverse community leaders, offering treatment plant tours to area schools, and developing multi-lingual tools to help implement these projects.
PIP-4: King County shall inform affected residents and businesses in advance of capital construction projects.
WTD construction teams include community relations experts to inform affected residents and businesses in advance of capital construction projects and respond to questions and concerns. Typical activities include pre-construction meetings, fliers, web updates, signs, direct on-the-ground contact, and 24-hour project hotlines. Procedures are in place to document and track questions, concerns, or complaints, and ensure prompt response. Lessons-learned evaluations are conducted to identify what has worked and to apply the lessons to other projects.
RWSP 2013 Comprehensive Review A-49

Appendix A. RWSP Policies Implementation in 2007−2013
Public Involvement Policies How Implemented in 2007−2013 This website explains how WTD works with the public throughout the stages of a capital project from planning to construction to operation. http://www.kingcounty.gov/environment/wtd/Construction/phases.aspx WTD provides construction information in multiple languages to reach everyone in affected neighborhoods. For example, construction information was provided in Russian and English during the Bellevue Influent Trunk project (completed in 2012). http://www.kingcounty.gov/environment/wtd/Construction/Completed/BellevueInfluentTrunk.aspx In 2012, routine construction specifications were updated so that solutions to some typical community impacts are automatically included when a contract is bid. This ensures all communities have the same level of consideration and improves service for everyone, including communities who may have linguistic or other challenges communicating with the County.
PIP-5: King County shall disseminate information and provide education to the general public, private sector and governmental agencies regarding the status, needs and potential future of the region's water resources.
WTD reached significant information and education milestones between 2007−2013:
• A new partnership with Cascadia Community College began in 2012 to provide training for future treatment plant operators. http://www.cascadia.edu/programs/degrees/waterquality.aspx
• In 2011, WTD celebrated the Brightwater Grand opening. More than 2000 people (general public; private sector and governmental agencies) attended the event and learned about the status and potential future of the region’s water resources.
• In 2011, the Brightwater Center opened and began offering significant programming about water resources through educational partnerships with IslandWood and other organizations. The center includes an interactive display hall. In the first year of operation the center reached approximately 4,000 4th−8th graders in school programs, 300 participants in family programs, and 150 teachers in professional development workshops.
• King County’s new biosolids brand Loop® was introduced to the public at the 2012 Flower and Garden Show. King County biosolids have been a key ingredient in compost available at the show for decades.
• Since 2010, King County, Seattle University and the Salvation Army Renton Food Bank have partnered on a five-year community farm project
A-50 RWSP 2013 Comprehensive Review
Appendix A. RWSP Policies Implementation in 2007−2013
Public Involvement Policies How Implemented in 2007−2013 located on an acre of the South Treatment Plant, demonstrating the use of GroCo compost made with Loop biosolids and increasing public understanding of the benefits of nutrient recycling. http://www.kingcounty.gov/environment/wtd/Education/SouthPlant/RRdemoprojects.aspx
Continuing programs include the following:
• Treatment plant tours. Over 3,000 students and hundreds of other interested parties annually learn the importance of water conservation and the process of wastewater treatment by touring a treatment plant.
• Treatment plant open houses. Members of the public are invited to tour the Brightwater Treatment Plant one Saturday every month. Tours at other treatment plants are scheduled each year in conjunction with World Water Day (March) and World Toilet Day (November) and upon request. All of these events feature water conservation, water quality, and wastewater treatment information.
Key educational materials include the following:
• Let’s Talk Trash brochures and posters. These materials, designed to prevent trash in the wastewater system, are available in six languages. http://www.kingcounty.gov/environment/wtd/Education/ThingsYouCanDo/TalkTrash.aspx
• Ratepayer report. This is a detailed report for the general public about the services WTD provides. It is updated each time the rate is changed. http://www.kingcounty.gov/environment/wtd/About/Finances/RatePayerReport.aspx
• New materials describing the quality and effectiveness of Loop biosolids are available at http://www.loopforyoursoil.com/.
PIP-6: King County shall actively solicit and incorporate public opinions throughout the implementation of its comprehensive plan.
The activities described in PIP-1 through PIP-5 illustrate how WTD keeps people informed and involved in the projects and programs associated with implementing the RWSP. WTD solicits public feedback and opinion in its the bi-annual water quality surveys, bi-annual surveys of near neighbors of the regional treatment plants, capital project surveys, public meetings, open houses, and informational booths. Opportunities for public comment are also provided via WTD project websites, emails, letters, and phone calls.
RWSP 2013 Comprehensive Review A-51

Appendix A. RWSP Policies Implementation in 2007−2013
Public Involvement Policies How Implemented in 2007−2013 PIP-7: Beginning January 1, 2001, King County shall implement a public awareness and education program regarding the environmental impacts and costs to wastewater rate payers of I/I in the local and regional conveyance systems.
WTD’s I/I website provides detailed information on I/I, how it is found and fixed, and what people can do to help. http://www.kingcounty.gov/environment/wastewater/II.aspx WTD serves as a clearinghouse regarding information on technologies related to I/I reduction; this information is made available to MWPAAC members.
From 2007−2012, members of the Skyway community participated in intensive public involvement associated with construction of a pilot I/I project. http://www.kingcounty.gov/environment/wastewater/II/InitialProjects/Skyway.aspx . Meetings, newsletters, door-to-door fliers, and response to complaints and inquiries included education about the impacts of I/I on the wastewater system. Community members in Bellevue and Issaquah received significant I/I information until Skyway was selected for the pilot project. A post-construction survey of Skyway residents illustrated a high level of understanding of the I/I problem. The survey showed that 61 of 63 respondents (97 percent) recalled getting information about the project before it began, and 62 of the 63 respondents (98.5 percent) understood the purpose of the project and the benefit to the area.
PIP-8: King County shall support regional water supply agencies and water purveyors in their public education campaign on the need and ways to conserve water. King County should promote pilot projects that support homeowner water conservation in coordination with water suppliers and purveyors, emphasizing strategies and technologies that reduce wastewater.
Water conservation is a key theme for all of WTD’s outreach and education efforts, including Brightwater Center activities, open houses, informational booths, public meetings, and school outreach. It is embedded in a number of the “things you can do” to protect the environment featured on the web site. http://www.kingcounty.gov/environment/wtd/Education/ThingsYouCanDo.aspx Water conservation is a major theme in the Brightwater Center displays, including signs informing visitors about the use of reclaimed water on site. Because Brightwater is in its service area, Cross Valley Water District had input on the displays developed for the center.
A-52 RWSP 2013 Comprehensive Review

Appendix A. RWSP Policies Implementation in 2007−2013
RWSP Financial Policies
A. Under the provisions of the King County Charter and RCW 35.58.200, these financial policies are hereby adopted and declared to be the principal financial policies of the comprehensive water pollution abatement plan for King County, adopted by the Municipality of Metropolitan Seattle (Metro) in Resolution No. 23, as amended, and the RWSP, a supplement to the plan.
B. Explanatory material.
1. Financial forecast and budget. Policies FP-1 through FP-10 are intended to guide the county in the areas of prudent financial forecasting and budget planning and are included to ensure the financial security and bonding capacity for the wastewater system. This set of policies also addresses the county’s legal and contractual commitments regarding the use of sewer revenues to pay for sewer expenses.
2. Debt financing and borrowing. Policies FP-11 through FP-14 are intended to guide the county in financing the wastewater system capital program. These policies direct that capital costs be spread over time to keep rates more stable for ratepayers by the county issuing bonds. A smaller share of annual capital costs will be funded directly from sewer rates and sewer revenues and capacity charges.
3. Collecting revenue. Policies FP-15 through FP-17 are intended to guide King County in establishing annual sewer rates and approving wastewater system capital improvement and operating budgets. Monthly sewer rates, which are the primary source of revenue for the county’s regional wastewater system, are to be uniformly assessed on all customers. Customers with new connections to the wastewater system will pay an additional capacity charge. The amount of that charge is set by the council, within the constraints of state law.
4. Community treatment systems. Policy FP-18 is intended to guide the county in the financial management of community treatment systems.
Financial Policies How Implemented in 2007–2013 FP-1: The county shall maintain for the wastewater system a multiyear financial forecast and cash-flow projection of six years or more, estimating service growth, operating expenses, capital needs, reserves and debt service. The financial forecast shall be submitted by the executive with the annual sewer rate ordinance.
A six-year financial plan is submitted each year with the WTD sewer rate proposal and again with the annual budget proposal. The financial plan is also updated for each new bond issue or bond refunding.
FP-2: If the operations component of the proposed annual wastewater system budget increases by more than the reasonable cost of the addition of new facilities, increased flows, new programs authorized by the council, and inflation, or if revenues decline below the financial forecast estimate, a feasible alternative spending plan shall be presented, at the next quarterly budget report, to the council by the executive identifying steps to reduce cost increases.
There were no occurrences of the situation described in FP-2 in 2007–2013, nor are any anticipated for the near-term. If such a situation were to occur, this policy would be implemented.
RWSP 2013 Comprehensive Review A-53

Appendix A. RWSP Policies Implementation in 2007−2013
Financial Policies How Implemented in 2007–2013 FP-3: The executive shall maintain an ongoing program of reviewing business practices and potential cost-effective technologies and strategies for savings and efficiencies; the results shall be reported in the annual budget submittal and in an annual report to the RWQC.
Results of WTD’s Productivity Initiative Pilot Program, a 10-year incentive program, was reported annually in RWSP annual reports. In addition, an annual report was submitted to the King County Council. The pilot program ended in April 2011. The program generated nearly $84 million in savings for ratepayers. As part of WTD’s continuous improvement efforts and the Executive’s Efficiency Initiative, WTD has implemented a Bright Ideas program, which encourages creative problem-solving throughout the organization and uses employees’ ideas to improve how WTD does business. Information on this program is included as part of the annual sewer rate submittal to the King County Council.
FP-4: New technologies or changes in practice that differ significantly from existing technologies or practices shall be reported to the council and RWQC with projected costs prior to implementation and shall also be summarized in the RWSP annual report.
No major changes in wastewater technologies or practices were implemented during this timeframe.
FP-5: Significant new capital and operational initiatives proposed by the Executive that are not within the scope of the current RWSP nor included in the RWSP, or are required by new state or federal regulations will be reviewed by the RWQC and approved by the council to ensure due diligence review of potential impacts to major capital projects' schedules, including Brightwater, the bond rating or the sewer rate and capacity charge.
All capital and operational costs are reviewed as part of the annual budget adoption process. No initiatives of this type were included in either the capital or operating budget requests in this timeframe. Brightwater began full operations on October 29, 2012.
FP-6: The county shall maintain for the wastewater system a prudent minimum cash balance for reserves, including but not limited to, cash flow and potential future liabilities. The cash balance shall be approved by the council in the annual sewer rate ordinance.
Since 2007, the bond ratings of the wastewater system have been upgraded. The rating from Moody’s has been upgraded twice from A1 to Aa2 and the rating from Standard’s and Poor’s has been upgraded once from AA to AA+.
FP-7: Unless otherwise directed by the council by motion, the King County department of natural resources and parks or its successor agency shall charge a fee that recovers all direct and indirect costs for any services related to the wastewater system provided to other public or private organizations.
All work performed by WTD for other public or private organizations has required the recovery of all direct and indirect costs.
FP-8: Water quality improvement activities, programs and projects, in addition to those that are functions of sewage treatment, may be eligible for funding assistance from sewer rate revenues after consideration of criteria and limitations suggested by the metropolitan water pollution abatement advisory committee, and, if
The 1.5 percent of annual operating budget limit on “Culver” funds had been strictly adhered to when such funding was approved in the annual rate process. This funding was eliminated from the 2011, 2012, 2013, and 2014 rate submittals. As part of the 2015 rate submittal, the County Executive has proposed the start-up of “Our Waters”
A-54 RWSP 2013 Comprehensive Review

Appendix A. RWSP Policies Implementation in 2007−2013
Financial Policies How Implemented in 2007–2013 deemed eligible, shall be limited to one and one half percent of the annual wastewater system operating budget. An annual report on activities, programs and projects funded will be made to the RWQC. Alternative methods of providing a similar level of funding assistance for water quality improvement activities shall be transmitted to the RWQC and the council within seven months of policy adoption.
program, which, if approved and implemented, would adhere to this policy.
FP-9: The calculation of general government overhead to be charged to the wastewater system shall be based on a methodology that provides for the equitable distribution of overhead costs throughout county government. Estimated overhead charges shall be calculated in a fair and consistent manner, utilizing a methodology that best matches the estimated cost of the services provided to the actual overhead charge. The overall allocation formula and any subsequent modifications will be reported to the RWQC.
Overhead costs of King County general government are allocated by the Executive budget office to all parts of the County on a consistent basis.
FP-10: The assets of the wastewater system are pledged to be used for the exclusive benefit of the wastewater system including operating expenses, debt service payments, asset assignment and the capital program associated therewith. The system shall be fully reimbursed for the value associated with any use or transfer of such assets for other county government purposes. The executive shall provide reports to the RWQC pertaining to any significant transfers of assets for other county government purposes in advance of and subsequent to any such transfers.
No assets were transferred outside of WTD in 2007–2013.
FP-11: The county shall structure bond covenants to ensure a prudent budget standard.
Bond covenants are strictly followed, monitored, and revised to maintain prudent and conservative standards. Outstanding bonds are constantly monitored for refunding opportunities to lower interest rates/debt service. See FP-6 regarding the upgrading of WTD’s bond ratings since 2007.
FP-12: King County should structure the term of its borrowings to match the expected useful life of the assets to be funded.
In 2007, WTD increased the term of bonds issued to 40 years. In addition to moderating the impact to current sewer rates, this provides a better match between the life of the facilities and the debt financing their construction.
FP-13: The wastewater system’s capital program shall be financed predominantly by annual staged issues of long-term general obligation or sewer revenue bonds, provided
WTD capital expenditures are predominantly funded by the issuance of Sewer Revenue Bonds. Between 2007 and 2013, County General Obligation Bonds have not been a significant portion of new debt
RWSP 2013 Comprehensive Review A-55

Appendix A. RWSP Policies Implementation in 2007−2013
Financial Policies How Implemented in 2007–2013 that: All available sources of grants are utilized to offset targeted program costs; Funds available after operations and reserves are provided for shall be used for the capital program; excess funds accumulated in reserves may also be used for capital; Consideration is given to competing demands for use of the county’s overall general obligation debt capacity; and Consideration is given to the overall level of debt financing that can be sustained over the long term given the size of the future capital programs, potential impacts on credit ratings, and other relevant factors such as intergenerational rate equity and the types of projects appropriately financed with long-term debt.
issuances. Significant bond refundings occurred between 2011 and 2012. All refinanced revenue bonds have been refunded with new revenue bonds with the same term and at least a present value savings of 5 percent. In some cases, refinanced general obligation bonds have been refunded with new revenue bonds with the same term and at least a present value savings of 5 percent.
FP-14: To achieve a better maturity matching of assets and liabilities, thereby reducing interest rate risk, short-term, variable rate borrowing shall be used to fund a portion of the capital program, provided that: Outstanding short-term, variable rate debt comprises no more than twenty percent of total outstanding revenue bonds and general obligation bonds; and Appropriate liquidity is available to protect the day-to-day operations of the system. (Ordinance 17492, approved in December 2012, amended this policy to add the words “variable rate”, and changed the percent amount of allowable outstanding short term, variable debt to comprise twenty [previously it was fifteen] percent of total outstanding revenue bonds and general obligation bonds.)
Short-term variable (junior lien) debt is targeted for no more than approximately 20 percent of the total debt issued. Year-end liquidity reserves are targeted at 10 percent of the year’s operating expense total plus $5 million.
FP-15: King County shall charge its customers sewer rates and capacity charges sufficient to cover the costs of constructing and operating its wastewater system. Revenues shall be sufficient to maintain capital assets in sound working condition, providing for maintenance and rehabilitation of facilities so that total system costs are minimized while continuing to provide reliable, high quality service and maintaining high water quality standards.
1. Existing and new sewer customers shall each contribute to the cost of the
King County maintains a uniform monthly sewer rate in accordance with this policy. The sewer rate is set on an annual basis such that, given projections of other revenues and costs, the revenue requirements for providing wastewater services are met. The rate stabilization reserve allows for excess revenues generated in an earlier year to be treated as operating revenues for the subsequent year. These revenues therefore can be applied directly to debt coverage requirements in the subsequent year, allowing for a reduction of the sewer rate in that subsequent year. The use and planned use of the rate stablization funds are included in annual the rate
A-56 RWSP 2013 Comprehensive Review

Appendix A. RWSP Policies Implementation in 2007−2013
Financial Policies How Implemented in 2007–2013 wastewater system as follows:
a. Existing customers shall pay through the monthly sewer rate for the portion of the existing and expanded conveyance and treatment system that serves existing customers.
b. New customers shall pay costs associated with the portion of the existing wastewater conveyance and treatment system that serves new customers and costs associated with expanding the system to serve new customers. New customers shall pay these costs through a combination of the monthly sewer rate and the capacity charge. Such rates and charges shall be designated to have growth pay for growth.
2. Sewer rate. King County shall maintain a uniform monthly sewer rate expressed as charges per residential customer equivalent for all customers.
a. Sewer rates shall be designed to generate revenue sufficient to cover, at a minimum, all costs of system operation and maintenance and all capital costs incurred to serve existing customers.
b. King County should attempt to adopt a multiyear sewer rate to provide stable costs to sewer customers. If a multiyear rate is established and when permitted upon the retirement by the county of certain outstanding sewer revenue bonds, a rate stabilization reserve account shall be created to ensure that adequate funds are available to sustain the rate through completion of the rate cycle. An annual report on the use of funds from this rate stabilization account shall be provided annually to the RWQC.
c. The executive, in consultation with the RWQC, shall propose for council adoption policies to ensure that adequate debt service coverage and emergency reserves are established and periodically reviewed.
3. Capacity charge. The amount of the capacity charge shall be a uniform charge, shall be approved annually and shall not exceed the
transmittal financial plan and the annual budget financial plan as required by Governmental Accounting Standards Board (GASB) accounting standards. Information on the rate stabilization account is included in the annual sewer rate briefing to the Regional Water Quality Committee. The debt service coverage minimum is based on meeting two ratios, 1.25 on parity debt (revenue and general obligation bonds) and a target of 1.15 on all debt. The capacity charge is based on the methodology listed in this policy.
RWSP 2013 Comprehensive Review A-57

Appendix A. RWSP Policies Implementation in 2007−2013
Financial Policies How Implemented in 2007–2013 cost of capital facilities necessary to serve new customers. The methodology that shall be applied to set the capacity charge is set forth in FP-15.3.a.
a. The capacity charge shall be based on allocating the total cost of the wastewater system (net of grants and other non rate revenues) to existing and new customers as prescribed in this subsection. The total system cost includes the costs to operate, maintain, and expand the wastewater system over the life of the RWSP. Total estimated revenues from the uniform monthly rate from all customers and capacity charge payments from new customers, together with estimated non rate revenues, shall equal the estimated total system costs. The capacity charge calculation is represented as follows:
Capacity = [Total system costs — rate revenue Charge from existing customers] — Rate revenue from new customers
_________________________________ Number of new customers
where:
(1) total system costs (net of grants and other non rate revenues) minus rate revenue from existing customers equals costs allocated to new customers.
(2) costs allocated to new customers minus rate revenue from new customers equals the total revenue to be recovered through the capacity charge.
(3) total capacity charge revenue requirements divided by the total number of new customers equals the amount of the capacity charge to be paid by each new customer.
b. The capacity charge may be paid by new customers in a single payment or as a monthly charge at the rate established by the council. The county shall establish a monthly capacity charge by dividing that amount by one hundred eighty (twelve monthly payments per
A-58 RWSP 2013 Comprehensive Review

Appendix A. RWSP Policies Implementation in 2007−2013
Financial Policies How Implemented in 2007–2013 year for fifteen years). The executive shall transmit for council adoption an ordinance to adjust the discount rate for lump sum payment. The executive shall also transmit for council adoption an ordinance to adjust the monthly capacity charge to reflect the county's average cost of money if the capacity charge is paid over time.
c. King County shall pursue changes in state law to enable the county to require payment of the capacity charge in a single payment.
d. The capacity charge shall be set such that each new customer shall pay an equal share of the costs of facilities allocated to new customers, regardless of what year the customer connects to the system. The capacity charge shall be based upon the costs, customer growth and related financial assumptions used for the Regional Wastewater Services Plan adopted by Ordinance 13680 as such assumptions may be updated. Customer growth and projected costs, including inflation, shall be updated every three years beginning in 2003.
e. The county should periodically review the capacity charge to ensure that the actual costs of system expansion to serve new customers are reflected in the charge. All reasonable steps should be taken to coordinate the imposition, collection of and accounting for rates and charges with component agencies to reduce redundant program overhead costs.
f. Existing customers shall pay the monthly capacity charge established at the time they connected to the system as currently enacted by K.C.C. 28.84.055. New customers shall pay the capacity charge established at the time they connect to the system.
g. To ensure that the capacity charge will not exceed the costs of facilities needed to serve new customers, costs assigned and allocated to new customers shall be at a minimum ninety five percent of the projected capital costs of new and existing treatment, conveyance and biosolids capacity needed to serve new customers.
RWSP 2013 Comprehensive Review A-59

Appendix A. RWSP Policies Implementation in 2007−2013
Financial Policies How Implemented in 2007–2013 h. Costs assigned and allocated to existing customers shall include the capital cost of existing and future treatment, conveyance and biosolids capacity used by existing customers, and the capital costs of assessing and reducing infiltration and inflow related to the use of the existing conveyance and treatment capacity.
i. Capital costs of combined sewer overflow control shall be paid by existing and new customers based on their average proportionate share of total customers over the life of the RWSP.
j. Operations and maintenance costs shall be paid by existing and new customers in the uniform monthly rate based on their annual proportionate share of total customers.
k. Any costs not allocated in FP-15.3 f., g., h., i. and j. shall be paid by existing and new customers in the sewer rate.
l. Upon implementation of these explicit policies, the Seattle combined sewer overflow benefit charge shall be discontinued.
4. Based on an analysis of residential water consumption, as of December 13, 1999, King County uses a factor of seven hundred fifty cubic feet per month to convert water consumption of volume-based customers to residential customer equivalents for billing purposes. King County shall periodically review the appropriateness of this factor to ensure that all accounts pay their fair share of the cost of the wastewater system.
FP-16: The executive shall prepare and submit to the council a report in support of the proposed monthly sewer rates for the next year, including the following information: Key assumptions: key financial assumptions such as inflation, bond interest rates, investment income, size and timing of bond issues, and the considerations underlying the projection of future growth in residential customer equivalents; Significant financial projections: all key projections, including the annual projection of operating and capital costs, debt service
All key assumptions, significant financial projections, historical results, and policy options are provided as part of the annual sewer rate submittal letter and attachments.
A-60 RWSP 2013 Comprehensive Review

Appendix A. RWSP Policies Implementation in 2007−2013
Financial Policies How Implemented in 2007–2013 coverage, cash balances, revenue requirements, revenue projections and a discussion of significant factors that impact the degree of uncertainty associated with the projections; Historical data: a discussion of the accuracy of the projections of costs and revenues from previous recent budgets, and Policy options: calculations or analyses, or both, of the effect of certain policy options on the overall revenue requirement. These options should include alternative capital program accomplishment percentages (including a ninety percent, a ninety-five percent and a one hundred percent accomplishment rate), and the rate shall be selected that most accurately matches historical performance in accomplishing the capital program and that shall not negatively impair the bond rating.
FP-17: Expenditures from the wastewater revenues to correct water pollution problems caused by septic systems shall occur only if such expenditures financially benefit wastewater system current customers when the additional monthly sewer rate revenues from these added customers are considered.
No expenditures from the wastewater revenue were used for these purposes in 2007−2013.
FP-18: The cost of community treatment systems developed and operated in accordance with WWSP-15 would not be subsidized by the remaining ratepayers of the county’s wastewater treatment system.
This policy has been adhered to since the adoption of the RWSP.
RWSP 2013 Comprehensive Review A-61

Appendix A. RWSP Policies Implementation in 2007−2013
RWSP Reporting Policies
A. The executive shall review the implementation of the RWSP on a regular basis and submit the following reports to council and the RWQC:
Reporting Policies How Implemented in 2004–2006 A. Regional wastewater services plan annual report. The executive shall submit a written report to the council and RWQC in September each year until the facilities identified in the RWSP are operational. This report, covering the previous year's implementation, will provide the following: 1. A summary of activities for each major component of the RWSP, including treatment, conveyance, infiltration and inflow, combined sewer overflows, water reuse, biosolids and highlights of research and development projects underway and proposed for the coming year; 2. Details on each active RWSP project in the capital budget, including a project summary, project highlights, project issues, upcoming activities, schedules, an expenditures summary including staff labor and miscellaneous services, a description of adjustments to costs and schedule and a status of the projects contracts; 3. A status of the odor prevention program, including a listing and summary of odor complaints received and progress on implementing odor prevention policies and projects; 4. A summary of the previous year's results for the comprehensive water quality monitoring program; 5. A review of the plan elements, including water pollution abatement, water quality, water reclamation, Endangered Species Act compliance, biosolids management and variability of quality over time, wastewater public health problems, compliance with other agency regulations and agreements, to ensure it reflects current conditions; and 6. An update of anticipated RWSP program costs through the year 2030
The RWSP annual reports are submitted to the King County Council in September to cover the previous year’s implementation and include information on the items listed in 1 through 6 of this policy. The King County Executive has transmitted an annual report to the King County Council every year since 2000.
B.1. Comprehensive regional wastewater services plan review. The executive shall submit a written report to council and RWQC that provides a comprehensive review of the RWSP. The report will review the following:
The RWSP 2013 Comprehensive Review is the third RWSP comprehensive review and covers implementation of the RWSP from 2007 through 2013. The report has been prepared following the guidance in this policy.
A-62 RWSP 2013 Comprehensive Review

Appendix A. RWSP Policies Implementation in 2007−2013
Reporting Policies How Implemented in 2004–2006 a. assumptions on the rate and location of growth, the rate of septic conversions and the effectiveness of water conservation efforts; b. phasing and size of facilities; and c. effectiveness of RWSP policies implementation, for infiltration and inflow reduction, water reuse, biosolids, CSO abatement, water quality protection, environmental mitigation and public involvement; d. policy guidance for the construction fund and the emergency capital reserves 2. The next comprehensive regional wastewater services plan review is due in June 2014. Subsequent reports will be prepared every three to five years as established by the council and RWQC following their review of the current report. The specific due date will be based upon the availability of necessary information, the completion of key milestones, and the time needed to collect and analyze data. The executive may recommend policy changes based on the findings of the report and other information from changing regulations, new technologies or emerging or relevant factors; 3. The comprehensive regional wastewater services plan review will include all elements of the RWSP annual report, replacing it for that year. (Ordinance 17480, which was approved in December 2012, amended this policy to include “policy guidance for the construction fund and the emergency capital reserves” in RWSP comprehensive reviews, and established the due date for this Comprehensive Review Report.)
C. Operational master plan. The RWSP Operational Master Plan that was adopted by council in December 1999 shall be updated on a regular basis in conjunction with policy revisions to the RWSP.
In accordance with Motion 13758, the King County Executive submitted to the County Council a report on options to provide summary information on WTD’s long-range capital program. The report was submitted in August 2013.
RWSP 2013 Comprehensive Review A-63


Appendix B Odor Prevention and Control Program

Appendix B. Odor Prevention and Control Program
Odor Prevention and Control Program RWSP policies provide direction on implementing an Odor Prevention and Control Program at all wastewater treatment plants and associated conveyance facilities that goes beyond traditional odor control. RWSP policies also call for including a summary of odor complaints in annual reports.
WTD received and investigated 49 odor complaints in 2013. When investigating an odor complaint, the source is not always identifiable. For example, some complaints received are in areas where there are no WTD facilities. Of the 56 complaints received, 25 were determined to be attributable to WTD facilities. The breakdown is shown in Table 1. No odor complaints were attributed to the Brightwater, South, Vashon, and Carnation treatment plants. Complaints attributable to WTD facilities were resolved through replacing carbon in odor control facilities, using chemical solutions, sealing manhole covers, replacing equipment such as fan belts, and restoring power after a power outage.
Table1. Odor Complaints in 2013
Location Complaints Received Complaints Attributed to WTD Facilities
South Treatment Plant 3 0
South Plant conveyance facilities 25 19
West Point Treatment Plant 10 1
West Point conveyance facilities 14 4
Brightwater Treatment Plant 1 0
Brightwater conveyance facilities 3 1a
Vashon Treatment Plant 0 0
Carnation Treatment Plant 0 0
Total 56 25
a There were no sewage-related odors attributed to Brightwater conveyance facilities since they began operating. This complaint was related to diesel odors that emanated from the Brightwater Influent Pump Station during testing of the pump station’s generators in 2013. To resolve the situation, a project is under way to install diesel oxidation catalyst units on each generator exhaust system.
Odor complaints in 2007−2012 can be found in the RWSP annual reports at http://www.kingcounty.gov/environment/wtd/Construction/planning/rwsp/Library/AnnualReport.aspx.
More information on the Odor Prevention and Control Program is available at http://www.kingcounty.gov/environment/wtd/Response/OdorControl/GoodNeighbor.aspx.
B-2 RWSP 2013 Comprehensive Review

Appendix C Water Quality and Sediment Monitoring in 2013

Appendix B. Odor Prevention and Control Program
Water Quality and Sediment Monitoring in 2013 To protect public health and King County’s significant investment in water quality improvements, the County regularly monitors treatment plant effluent, marine water, fresh water, and sediments. The parameters used to assess a water body’s health under Washington State Water Quality Standards are fecal coliform bacteria, dissolved oxygen, temperature, pH, nutrients, turbidity, and a variety of chemical compounds. Monitoring results for the previous year are presented as environmental indicators on the County’s Department of Natural Resources and Parks KingStat website at http://your.kingcounty.gov/dnrp/measures/. Overall water and sediment quality conditions observed in 2013 were largely consistent with those observed in 2012 and in previous years. Key findings in 2013 include the following:
• Treatment plant effluent consistently met permit requirements.
• Waters in most urban streams are frequently warmer than Washington State temperature standards allow, have more bacteria than the standards allow, and occasionally do not have as much oxygen as required by state standards.
• The health of streams, as measured by the diversity and abundance of the community of organisms that live on the stream bottom, is generally not as good in urban areas.
• Two beaches in Lake Sammamish and six beaches in Lake Washington had incidents of high bacteria that did not meet state standards. These events were brief and did not result in beach closures.
• With the exception of two stations in Quartermaster Harbor, marine water quality throughout the Puget Sound Central Basin was at a low level of concern in 2013. Level of concern rankings in Quartermaster Harbor were moderate and high due to low dissolved oxygen and dissolved inorganic nitrogen values during the late summer and early fall months.
• There were no exceedances of the standards for fecal coliform bacteria levels at the County’s treatment plant marine outfalls in 2013.
In addition, investigations to locate sources of bacteria in Juanita Creek, Thornton Creek, Boise Creek and the stormwater drainage infrastructure in White Center continued in 2013. When sources are identified, staff works with other entities, such as county and local stormwater programs, local sewer districts, and Public Health−Seattle & King County, to ensure identified sources are controlled.
Data and reports are available at the Water and Land Resources Division’s Science and Technical Support Section website at http://www.kingcounty.gov/environment/wlr/sections-programs/science-section/doing-science.aspx.
Water quality and sediment monitoring reports for 2007−2012 can be found in the RWSP annual reports at http://www.kingcounty.gov/environment/wtd/Construction/planning/rwsp/Library/AnnualReport.aspx.
C-2 RWSP 2013 Comprehensive Review