regional sediment resource...
TRANSCRIPT

DRAFT REPORT OF THE RSRM WORKING GROUP
Executive Office of Energy and Environmental Affairs
REGIONAL SEDIMENT RESOURCE MANAGEMENT Workgroup Report November 21, 2008 (revised 11/24/08)
DRAFT REPORT OF THE RSRM WORKING GROUP
TABLE OF CONTENTS
SECTION ONE: Workgroup Membership
1
SECTION TWO: Introduction and Mission
3
SECTION THREE: Data Resources
5
A. Existing GIS Data
5
MORIS Data Layers
5
Non-MORIS Data Layers
6
B. Non-Extant GIS Data
9
C. Future Data Development
11
SECTION FOUR: Data Analysis
18
SECTION FIVE: Regulatory Summary
22
SECTION SIX: References
25
INDEX OF TABLES AND FIGURES
TABLE 1. Matrix used to identify potential sediment resources in the ocean
management planning area of Limited, Low, Medium, and High suitability for possible beneficial use.
19
FIGURE 1. Pre- and post-nourishment of Long Beach, Barnstable using sand obtained offshore.
4
FIGURE 2. Folk code used to classify sediments.
7
FIGURE 3. Extent of high-resolution seafloor mapping data.
15
FIGURE 4. Interpolated sediment layer overlaid on hillshaded bathymetry grid.
16
FIGURE 5. Interpolated sediment layer overlaid on backscatter intensity imagery.
17
FIGURE 6. Surficial sediment data for the ocean management planning area.
20
FIGURE 7. Ranked suitability of sediment resources in the ocean management planning area.
21

DRAFT REPORT OF THE RSRM WORKING GROUP
1
SECTION ONE: Workgroup Membership Regional Sediment Resource Management Charter Members Robert Boeri [workgroup lead] Project Review Coordinator Office of Coastal Zone Management Rebecca Haney Coastal Geologist Office of Coastal Zone Management Julia Knisel Coastal Resiliency Specialist Office of Coastal Zone Management Kevin Mooney Senior Waterways Engineer Department of Conservation and Recreation Joseph Orfant Chief of Bureau of Project Design and Management Department of Conservation and Recreation Daniel Sampson [workgroup GIS liaison] GIS/Data Manager Office of Coastal Zone Management James Sprague Environmental Analyst Department of Environmental Protection Anthony Wilbur Marine Ecologist Office of Coastal Zone Management Expanded Members Walter Barnhardt Marine Geologist USGS Coastal and Marine Geology Program Leslie Fields Coastal Geologist Woods Hole Group
DRAFT REPORT OF THE RSRM WORKING GROUP
2
William Hanson Vice President, U.S. Business Development Great Lakes Dredge and Dock Company Wayne Jaedtke Dredge Supervisor Barnstable County Dredge John Kennelly Chief of New England District Planning Branch U.S. Army Corps of Engineers Matthew Liebman Environmental Biologist U.S. Environmental Protection Agency, New England Richard W. Murray Professor of Earth Sciences Boston University Marine Program John Ramsey Principal Coastal Engineer Applied Coastal Research and Engineering, Inc. Workgroup Lead’s Acknowledgement: I would like to thank the entire workgroup for the extraordinary amount of time and effort that went into the preparation of this document. They were responsible for taking an all-encompassing concept and turning it, in short order, into a realistic and workable product that can be used as a solid foundation for future analysis. Without their input, the project would still be at square one. Thanks to all.

DRAFT REPORT OF THE RSRM WORKING GROUP
3
SECTION TWO: Introduction and Mission Regional sediment resource management (RSRM) is the integrated management of oceanic, littoral, estuarine, and riverine sediments to achieve balanced and sustainable solutions to sediment-related needs, while accounting for the effect of human activities on sediment erosion and transport. RSRM recognizes that sediment is a resource and attempts to maintain the natural movement or transport of sediment. RSRM actions are activities that potentially affect the transport, erosion, removal, and deposition of sediment. RSRM recognizes multiple, and often competing, demands for sediment in a region. Regions are defined by large-scale sediment transport boundaries and patterns, along with other factors such as political boundaries and region-specific issues and resources. Although the Massachusetts ocean management planning area covers the ocean environment from approximately 0.3 nautical miles from shore to the state-federal boundary (approximately three nautical miles from shore), RSRM for this effort recognizes the larger region (e.g., coastal watershed and nearshore littoral zones to offshore waters) that influences sediment distribution and transport while focusing on specific actions and functions in the planning area. The following categories represent current, proposed, and future uses, activities, and functions of sediments in the planning area:
• Dredged material disposal (both clean and contaminated sediment)
• Sand and gravel mining for shoreline protection or beach nourishment (Figure 1)
• Mining for mineral extraction
• Mining for commercial construction or fill material
• Natural, in-situ shoreline protection (in the planning area but protecting shoreline assets) The locations and characteristics of areas that contain hazardous and contaminated sediment that may exclude these uses of the sediment (Exclusion Areas) are also considered in this report. The mission of the Regional Sediment Resource Management Workgroup is to identify existing, specific spatial data that characterize the physical and chemical properties of sediment in the planning area and/or that locate and quantify sediment types. These data will be used to assist with the siting and review of projects in the coastal zone that propose to remove and use sediment beneficially or whose location requires specific sediment types. These data will also be used to prioritize sediment uses and needs, assisting resource managers and the public in evaluating sediment management activities.

DRAFT REPORT OF THE RSRM WORKING GROUP
4
Figure 1. Pre- (top) and post-nourishment (bottom) of Long Beach, Barnstable using sand obtained offshore (photos courtesy of Woods Hole Group and CZM).

DRAFT REPORT OF THE RSRM WORKING GROUP
5
SECTION THREE: Data Resources The data presented in this section were used to create the sediment resources map for the ocean management planning area, to analyze of sediment resources, and to rank the suitability of the sediment resources for beneficial use. The report also contains a list of non-extant data that would be useful for further, more detailed analysis. The non-extant data needs include areas where: existing data are available in Geographic Information System (GIS) format but need conversion from raster format, existing data are not available in Geographic Information System (GIS) format, or no data exist. For example, the U.S. Geological Survey (USGS)/Massachusetts Office of Coastal Zone Management (CZM) seafloor mapping project will be mapping physiographic zones and depth to bedrock in four areas: Hull to Duxbury (ongoing), Northern Cape Cod Bay (ongoing), Buzzards Bay (to start in 2009) and Vineyard Sound (to start in 2010). This effort is essential to the identification of sediment resources in these areas and needs to be expanded into the entire ocean management planning area and included in the RSRM analysis. The existing data compiled for this analysis are briefly described below and categorized into Massachusetts Ocean Resource Information System (MORIS) data layers and data layers not available in MORIS. Non-extant data and data needs are also listed. The information presented is excerpted from the relevant metadata. A. Existing GIS Data Massachusetts Ocean Resource Information System (MORIS) Data Layers MORIS, the Massachusetts Ocean Resource Information System, is an online mapping tool created by CZM and the Massachusetts Office of Geographic and Environmental Information (MassGIS). MORIS can be used to search and display spatial data pertaining to the Massachusetts coastal zone. Users can interactively view various data layers (e.g., tide gauge stations, marine protected areas, access points, eelgrass beds, etc.) over a backdrop of aerial photographs, political boundaries, natural resources, human uses, bathymetry, or other data. Users can quickly create and share maps and download the actual data for use in a Geographic Information System (GIS). While designed for coastal management professionals, MORIS can be used by anyone interested in these data and maps.
Ocean Management Planning Area Boundary Abstract: This GIS layer shows the extent of the Massachusetts coastal ocean governed by the Massachusetts Oceans Act of 2008. The polygon layer was created by merging three arc layers: the Submerged Lands Act line administered by the U.S. Minerals Management Service, the presumed Massachusetts lateral boundaries, and the Nearshore Ocean Management Planning Area Boundary created by CZM. The area closed by these three lines was converted into a polygon by CZM (July 18, 2008). Purpose: These data were created to show the extent of Massachusetts waters under jurisdiction of the Massachusetts Oceans Act of 2008. A full text of the Act can be found at <http://www.mass.gov/legis/laws/seslaw08/sl080114.htm>. Citation_Information:
Originator: CZM Publication Date: July 18, 2008 Title: Oceans Act of 2008: Offshore Management Planning Area
DRAFT REPORT OF THE RSRM WORKING GROUP
6
Ocean Management Planning Area 1 km2 Grid Exact Abstract: This GIS data layer is a gridded polygon representation of the ocean management planning area defined in the Oceans Act of 2008; for a full text of the Act, see <http://www.mass.gov/legis/laws/seslaw08/sl080114.htm>. The grid cells are 1 kilometer on a side (1,000 meters) and projected into the Mass State Coordinate System, Mainland Zone (Fipszone 2001), meters. Purpose: These data are intended to be used in the creation of a comprehensive plan to manage development in Massachusetts state waters as mandated in the Oceans Act of 2008. Citation_Information:
Originator: CZM Publication Date: July 24, 2008 Title: Oceans Act of 2008: Ocean Management Planning Area - 1km2 Analysis Grid
(Exact Border) Ocean Management Planning Area 250 m2 Analysis Grid Exact Border
Abstract: This GIS data layer is a gridded polygon representation of the ocean management planning area defined in the Oceans Act of 2008; for a full text of the Act, see <http://www.mass.gov/legis/laws/seslaw08/sl080114.htm>. The grid cells are 250 meters on a side and projected into the Mass State Coordinate System, Mainland Zone (Fipszone 2001), meters. Purpose: These data are intended to be used in the creation of a comprehensive plan to manage development in Massachusetts state waters as mandated in the Oceans Act of 2008. Citation_Information:
Originator: CZM Publication Date: July 24, 2008 Title: Oceans Act of 2008: Ocean Management Planning Area - 250m2 Analysis Grid (Exact Border)
Non-MORIS Data Layers These data layers were created by CZM for use in evaluating the sediment resource for the purposes of the report but are not available on MORIS at this time.
30m Bathymetry Abstract: A 30-meter bathymetry grid was built by combining the most highly spatially resolved data within the study area. Input data included 5-meter USGS open file report data, 30-meter National Oceanic and Atmospheric Administration (NOAA) Estuarine Bathymetry, and 90-meter NOAA Coastal Relief Model data. All data were regridded by USGS at 30 meters and merged to generate a continuous coverage at a standardized spacing. Purpose: These data are intended to be used in the creation of a comprehensive plan to manage development in Massachusetts state waters as mandated in the Oceans Act of 2008. Citation_Information:
Originator: CZM Publication Date: 2008 Title: 30m Bathymetry

DRAFT REPORT OF THE RSRM WORKING GROUP
7
Interpolated Sediment Size Abstract: Sediment data from the USGS publication, usSEABED: Atlantic Coast Offshore Surficial Sediment Data Release (USGS Data Series 118), in the region of the ocean management planning area were spatially interpolated using Inverse Distance Weighting (IDW) to create a crude surficial sediment map based on Folk’s classification system (Figure 2). The usSEABED “extracted” and “parsed” data were combined and then parsed to remove sub-surface data and generally older data with poor horizontal accuracy. The usSEABED data attributes were modified as follows: 1) using the sediment fraction (“SORTING” field), a Folk code was generated for each point, 2) combined all Folk code for Silt and Clay records into Mud, 3) any slightly gravel characters in the Folk code (g) were dropped, 4) added a non-Folk code called hard (H) that represents all points that are greater in size than Gravel (G) on the Folk diagram, and 5) the Folk codes were binned as follows: M = M, sM = M, gM = M, mS = S, S = S, gmS = G, gS = G, mG = G, msG = G, sG = G, and G = G. The binned Folk codes were then assigned numeric codes: M = 1, S = 2, G = 3. The code “H” was assigned the value of 4. The points data was then interpolated using an Inverse Distance Weighting (IDW) Algorithm based on the numeric values. The IDW parameters were set as follows: Power = 2, Search Radius Type = Variable, Search Radius Settings - # of Points = 12 and Maximum Distance = 5000m, and Output Cell size = 250m. Note that, the distribution of points in the usSEABED data is not uniform, creating areas where interpolation occurs across far larger distances than others. Consequently, this layer must be interpreted with great care. Purpose: These data are intended to be used in the creation of a comprehensive plan to manage development in Massachusetts state waters as mandated in the Oceans Act of 2008. Citation_Information:
Originator: CZM Publication Date: 2008 Title: Interpolated Sediment Size
Figure 2. Folk code used to classify sediments.
DRAFT REPORT OF THE RSRM WORKING GROUP
8
Depth of Closure Abstract: The depth of closure refers to the seaward limit of sediment transport that marks the end of the littoral zone. Sediments beyond the closure depth and littoral zone are not normally affected by waves and do not contribute significantly to beach profile changes such as erosion and accretion. Two depth of closure data sets were created, one covering the bathymetric isobaths between 0 and 5 meters (0 – 16.4 ft), and the other from 5 to 9 meters (16.4 – 29.5 ft). All data less than 9 meters in depth that were physically separated from the shoreline (e.g. a shallow in Nantucket Sound) were excluded. The 9 meter contour was used to flag nearshore sand and gravel deposits for the purposes of resource extraction due to the potential for significant impacts on shorelines. The 0 to 5 meter data were classified as “limited suitability” denoting their high importance in shoreline protection. In addition, shorelines that are directly exposed to open Atlantic Ocean wave conditions may have closure depths deeper than 5 meters and limited wave analysis on these shorelines indicates that the depth of closure may be closer to 9 meters. Therefore, sites located in water depths between 5 and 9 meters have been identified as having low suitability, pending site-specific analyses that would quantify the closure depth for the site. Purpose: These data are intended to be used in the creation of a comprehensive plan to manage development in Massachusetts state waters as mandated in the Oceans Act of 2008. Citation_Information:
Originator: CZM Publication Date: 2008 Title: Depth of Closure
Massachusetts Bay Sediment Resources Abstract: NOMES I to V and Cat Island were identified as potential sand and gravel resources by the Massachusetts Coastal Mineral Inventory Survey and further explored by Applied Coastal Research and Engineering, Inc. for the Massachusetts Department of Conservation and Recreation (DCR). Purpose: The former Massachusetts Division of Mineral Resources was legislatively mandated to determine the nature of Massachusetts' offshore mineral resources and the environmental effects of the removal of these minerals due to limited upland resources and the need for offshore resources. Applied Coastal Research and Engineering, Inc. was subcontracted by DCR to assess shore protection alternatives for the Winthrop Shores Reservation Restoration Program. Citation_Information:
Originator: CZM Publication Date: August 6, 2008 Title: MassBay_Seds
Potential Sediment Resources Abstract: Sites with potentially high-quality sand and gravel resources have been identified through general exploration as well as targeted projects. These sites that are described in public reports and associated with general coordinates have been included in a point shapefile. Purpose: These potential sand and gravel resource points were mapped for ocean management planning.
DRAFT REPORT OF THE RSRM WORKING GROUP
9
Citation_Information: Originator: CZM Publication Date: August 6, 2008 Title: Potential_Sed_Resources
Dumping Ground (Disposal Sites) Abstract: Areas exist in the planning area where dredged material or other potentially more harmful material, e.g. explosives and chemical waste, are deliberately deposited. These areas are included in navigation chart data and have been converted to vector format for electronic navigational charts. Purpose: Electronic navigational charts (ENC) are primarily intended to support the navigation of vessels in the territorial waters of the United States. Data contained in the ENCs may also be used for other coastal mapping purposes that require up-to-date information similar to that portrayed on traditional navigational charts. The current release of the ENCs is provisional. This means that the ENCs are currently not for navigational use and are provided for system development, testing, familiarization, and user feedback. Citation_Information:
Originator: NOAA, National Ocean Service, Office of Coast Survey Publication Date: Unknown Title: Electronic Navigational Charts (ENC), Dumping Ground (DMPGRD)
B. Non-Extant GIS Data This section includes relevant data layers that are either: available in GIS format but require more manipulation to be useful in the MORIS database or need to be converted into GIS format. The following data are available in GIS format, however they need to be converted from a raster format to allow for inclusion into the MORIS database.
Physiographic Zones Abstract: Zones of the seafloor with similar sedimentary characteristics have been determined using high-resolution seafloor mapping and geologic interpretation of sediment thickness seafloor morphology and the type of surficial materials. These zones exist in three study areas: Salisbury to Cape Ann, Gloucester to Nahant, and Boston Harbor. Purpose: The goal of this mapping is to produce high-resolution geologic maps of the surface and subsurface geology and a GIS that will serve the needs of research, management, and the public. The descriptions of each physiographic zone include details regarding the origin of the deposit, grain size distribution, volume, geographic extent, and descriptions of bedform types present. This information can be used to rank the potential value of an area as a sediment resource. Citation_Information:
Originator: USGS Open File Reports Publication Date: 2006 Titles: U.S. Geological Survey Open-File Report 2005-1293. High-Resolution Geologic
Mapping of the Inner Continental Shelf: Nahant to Gloucester, Massachusetts by W. A. Barnhardt, B. D. Andrews, and B. Butman
U.S. Geological Survey Open-File Report 2006-1008. High-Resolution Geologic
DRAFT REPORT OF THE RSRM WORKING GROUP
10
Mapping of the Inner Continental Shelf: Boston Harbor and Approaches, Massachusetts by S. D. Ackerman, B. Butman, W. A. Barnhardt, W. W. Danforth, and J. M. Crocker
The following data are not readily available in GIS format; however, they would provide additional information to identify potential sediment resources. These data were derived from several large detailed studies to identify potential sediment resources. Conversion of these data should be considered in the next phase of ocean management plan development and implementation. Merrimack River Delta
Abstract: Geophysical surveys, cores, and grain size analysis of the Merrimack River Delta identified that this resource contains approximately 1.3 billion cubic meters of sediment. Citation_Information:
Originator: Hein, C.J., Fitzgerald, D. M., and Barnhardt, W. Title: Holocene Reworking of a Sand Sheet in the Merrimack Embayment, Gulf of
Maine Source: Journal of Coastal Research, Special Issue 50
Cape Ann-Brant Rock Abstract: Geophysical surveys, cores, grab samples, and bottom photographs were used to produce surficial sediment and isopach maps of 110 million cubic yards of seafloor deposits between Cape Ann and Brant Rock. Citation_Information:
Originator: Willett, C.F. Publication Date: 1972
Title: Final Report of Massachusetts Coastal Mineral Inventory Survey Source: Raytheon Company
NOMES I
Abstract: Cores were collected and analyzed to recreate the geologic history of the NOMES I site. Citation_Information:
Originator: Sampson, M.R. Publication Date: 1974
Title: Technical Report 74-3 – Supplement to Geologic Investigation of the NOMES Dredging Site, Technical Report 73-2
Source: MA DNR, Division of Mineral Resources
Offshore Boston Harbor Abstract: Geophysical surveys, cores, and grab samples were used to identify three potential sand and gravel resources offshore of Boston Harbor. Citation_Information:
Originator: Fitzgerald, D.M., Smith, J.B., and Goodbred, S. L. Publication Date: 1990
Title: Exploration and Inventory of Sand and Gravel Resources Offshore of Boston Harbor; Technical Report No. 2

DRAFT REPORT OF THE RSRM WORKING GROUP
11
Cape Cod Bay Abstract: Cores were collected along Plymouth Shoal, Duxbury Shoal, Lookout Point/Scorton Neck, and Billingsgate Shoal. Citation_Information:
Originator: Sampson, M. Publication Date: 1974
Title: Technical Report 74-2 Source: MA DNR, Division of Mineral Resources
C. Future Data Development When investigating the data available for inclusion into this report, it became apparent that several areas of interest lacked significant spatial data pertaining to the planning area. First, regional sediment transport data for the region is minimal. The inputs to, and movement of, sediment along the coast is of vital concern to the entire concept of sediment resource management. Without understanding the quantity of sediment entering and exiting the planning area, it becomes difficult to predict the potential effects that use of this resource will have. These inputs, outputs, and movements need to be studied as regional phenomena due to the differences in geography between the regions. For example, the geology of the North Shore of Massachusetts (including Cape Ann) differs greatly from the south side of Cape Cod (including Martha’s Vineyard and Nantucket). The potential sediment resource uses and impacts of the uses to these regions may vary significantly and need to be taken into account for an effective and science-based plan to be developed. Some information from the USGS is available (Butman et al. 2002), but it requires more work to incorporate it into this analysis. Second, no comprehensive evaluation of contaminated sediments exists for the planning area. There is a relative wealth of sediment chemistry data for harbors, rivers, and embayments due to the frequency of dredging and construction that takes place in these locations. Outside of dredge sediment disposal areas, however, sediment chemistry identifying contaminated areas within the planning area is limited primarily to the data collected by the USGS and the Massachusetts Water Resources Authority (Butman et al. 2004). This information is invaluable in identifying and assisting in the decision-making process for ranking the suitability of a particular location for a multitude of uses. Third, wave modeling on a site-specific basis has not been conducted. This modeling could be used in a more detailed identification of the depth of closure as used in the analysis. Site-specific wave modeling has the potential to either reduce the area determined to be of limited suitability for use (due to the effects on shoreline protection) thereby expanding the medium and high suitability areas, or to increase the area of protection for critical features. For example, it has been suggested (Ramsey and Kelley, personal communication) that based on this type of modeling, it may be possible to adjust the depth of closure to 10 feet in Nantucket/Vineyard Sound/Upper Buzzards Bay, 15 feet in lower Buzzards Bay and eastern Cape Cod Bay, 25 feet along the eastern facing open coast, and 30 feet along the southern facing open coast. Lacking this level of analysis, however, the workgroup has chosen a more conservative approach to incorporating the depth of closure. Due to the simplifying assumptions associated with the closure depth analysis provided, caution should be exercised in eliminating potential offshore sand and gravel borrow sites without a more in-depth evaluation of the local wave climate. Pursuit of this additional analysis would be valuable to all stakeholders.
DRAFT REPORT OF THE RSRM WORKING GROUP
12
Fourth, refinement of the bottom and sub-bottom types needs to continue. There were several discussions held with the USGS Woods Hole seafloor mapping specialists regarding how to describe and analyze grain size data for the ocean planning area. A preliminary map was generated using a very simplified classification based on the Folk classification (Folk 1959): mud, fine sediment, and coarse sediment. Source data on grain size was from the usSEABED dataset (Reid et al. 2006). All silt combinations are mud, all sand combinations are fine sediment, and all gravel combinations are coarse sediment. Anything with a grain size higher than gravel was labeled hard bottom. This is the same classification of sediment types that was utilized in the Irish Sea Pilot Project of the UK SeaMap program. More details regarding the usSEABED dataset (including a data quality assessment) and the process utilized to analyze the dataset will be available via a technical report in the coming months. The resulting dataset that showed the distribution of sediment type was interpolated using an IDW (inverse distance weighting) approach. Due to the variability of some parts of the Massachusetts seafloor as well as the paucity of data in some areas, this approach may oversimplify the seafloor sediment composition. There are many datasets that remain to be integrated into a full assessment of grain size. Point datasets include MarineFisheries lobster habitat data, MarineFisheries trawl hang data, dredged material management sediment profile imagery, benthic monitoring data (e.g., Massachusetts Water Resources Authority outfall monitoring), and datasets generated by construction and dredging projects. It is anticipated that these datasets will be incorporated over the next several months.
More importantly, acoustic seafloor mapping datasets have not yet been incorporated. CZM
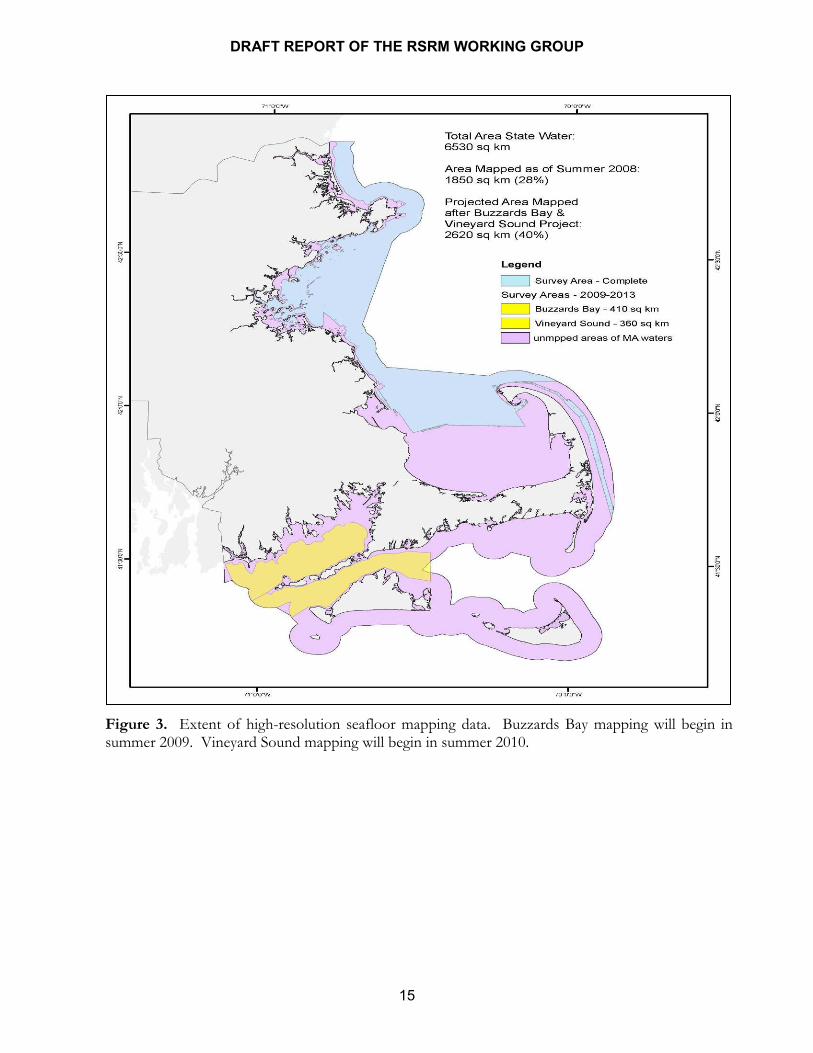
and USGS partnered in a Seafloor Mapping Cooperative to comprehensively map the seafloor environment in Massachusetts. Acoustic data from the CZM-USGS Massachusetts Seafloor Mapping Cooperative are used to produce high-resolution bathymetric, backscatter intensity, and geologic interpretative maps of offshore coastal Massachusetts. The level of detail and spatial accuracy of these new data are better than the various existing and historic seafloor datasets (e.g., usSEABED). To date, nearly 1450 sq km of the seafloor is mapped from the New Hampshire border to northern Cape Cod Bay, Bay as part of the CZM-USGS partnership, with plans to start mapping Buzzards Bay and Vineyard Sound in 2009. When combined with recent seafloor mapping projects in western Massachusetts Bay (Butman et al. 2004), approximately 1850 sq km of Massachusetts waters (1770 sq km of the Ocean Management Planning Area) is mapped with swath sonar systems in state waters (Figure 1).
Acoustic datasets offer unparalleled views and investigation opportunities of the seabed
topography, character, and sub-surface structure. The CZM-USGS Seafloor Mapping Cooperative acquires the following three acoustic datasets, as well as sediment samples, bottom photos, videos, and cores to ground truth acoustic signatures:
Swath bathymetry provides high accuracy depth measurements over large areas of the seafloor, which are used to create detailed bathymetric maps and give a sense of the varied or subtle nature of the seafloor landscape (e.g. highly rugged relief, broad flat plains). Backscatter intensity provides information about the distribution and characteristics of the surficial sediment and bedrock on the seafloor. The intensity of acoustic backscatter indicates the relative hardness and roughness of the seabed (e.g., high-backscatter intensity is produced by a strong return of acoustic energy and generally signifies a coarse and/or rough surface, while low-backscatter intensity is produced by a weaker return that generally signifies finer sediments and/or a smoother surface). Natural and man-made features, such

DRAFT REPORT OF THE RSRM WORKING GROUP
13
as boulders, shipwrecks, pipelines, can often be identified by abrupt changes in local backscatter intensity. Seismic-reflection (or sub-bottom) profiles provide insight into geologic structure and stratigraphy beneath the seafloor. Sub-bottom structure often influences the surficial expression of the seafloor. The thickness and volume of sediment deposits as well as the distribution and extent of bedrock hard-bottom is imaged with sub-bottom data. These data are especially useful in determining the suitability of an offshore area for construction (e.g. potential locations for new navigation channels or marine transport terminals) or engineering activities (e.g. potential sites for mining construction aggregate or beach-nourishment fill). Seismic-reflection data are the primary data source for sediment depth (see next section; ‘Sediment Depth’).
These acoustic mapping datasets provide significantly higher resolution, and can in some cases change previous interpretations of the seafloor made from the usSEABED dataset. Although the usSEABED database has significant state-wide coverage, there are limitations that should be noted with using these data to create a continuous seafloor sediment type map: (1) many of the samples from the usSEABED database were collected prior to modern GPS navigation, which may present substantial error in geographic position of samples; (2) a relatively small percentage of the usSEABED records are sediment samples that have been laboratory analyzed, which means most samples are observational and are crudely classified from written descriptions; and (3) many areas in Massachusetts are not sampled, so interpolation between points may incorrectly represent bottom types. Furthermore, usSEABED data were gridded and the recently collected acoustic data are contiguous coverages, which inherently results in the loss of data resolution.
The following figures illustrate the differences in resolution and accuracy between the interpolated usSEABED data and the high-resolution acoustic data being collected by the CZM-USGS Seafloor Mapping Program in an area of Salem Sound (Figures X and X). Also to help demonstrate the differences between acoustic data and interpolated usSEABED data, the following are specific narrative examples of data differences that are derived from the following figures:
• Figure 1 shows a number of NW-SE trending rocky zones; however since there are very few rock or hard-bottom samples represented in the usSEABED, a very limited area of the seafloor is actually classified as rocky/hard bottom. Most of the rocky areas are classified instead as class 3 (gravelly sediment) which is not a correct classification or description for rocky/hard bottom area (e.g., bedrock or boulder).
• Three cells are classified as muddy in the northern part of figures 1 and 2. The muddy classification was based on a single bottom sample from the usSEABED. Figure 2, displaying the backscatter intensity data, shows that the muddy sample was taken from a very thin ribbon characterized in the imagery as low backscatter which probably does correlate to mud or sandy mud. This thin ribbon of sediment is, however, flanked by relatively large areas of higher backscatter (relatively harder bottom) and appears to occur (see figure 1) on the NW facing base of a topographic high area which is probably a rocky outcrop (seismic reflection data could verify this interpretation). The interpolation process used for creating the sediment type map resulted in three cells classified as mud, which is obviously incorrect when observing the grid and contiguous bathymetric and backscatter intensity data.
DRAFT REPORT OF THE RSRM WORKING GROUP
14
Classifying the seafloor environment into discrete geologic and habitat units is an ongoing effort in Massachusetts. CZM, DMF, USGS, and other partners are actively examining the next steps in moving acoustic seafloor mapping data, in combination with detailed examination (e.g., benthic grabs and underwater observation) of the ecology of the seafloor, toward an integrated seafloor habitat classification. Among the many tasks required to appropriately classify the geological and biological nature of the seafloor is the development of a rigorous approach to combine the multiple backscatter datasets that are collected through the CZM-USGS Seafloor Mapping Cooperative. Backscatter intensity provides a relative value of seafloor hardness and roughness that is specific to a study area. These discrete datasets need to be combined to create a state-wide dataset, including a state-wide dataset of sediment types. An approach to classify and map the seafloor environment, including the combination of disparate backscatter data, could be applied to areas that currently have acoustic data, with sufficient ground truth data, and then to the whole planning area once acoustic coverage is completed. Seismic data are collected as part of the CZM-USGS Seafloor Mapping Cooperative. These data exist for most of the state waters that were mapped using acoustic technologies (Figure 1). Sediment depth data has not yet been incorporated into the ocean planning process. There are also a variety of sediment cores located throughout the planning area that may help characterize depths of particular sediment types in specific areas. Additional data gaps are likely to be identified through the course of ocean management plan development and implementation. The level of sophistication employed in constructing a resource management suitability determination is limited by the amount of funding, time, and personnel available to develop the data. This document is meant to be part of an adaptive management program, updated and modified as new data become available.
DRAFT REPORT OF THE RSRM WORKING GROUP
15
Figure 3. Extent of high-resolution seafloor mapping data. Buzzards Bay mapping will begin in summer 2009. Vineyard Sound mapping will begin in summer 2010.
DRAFT REPORT OF THE RSRM WORKING GROUP
16
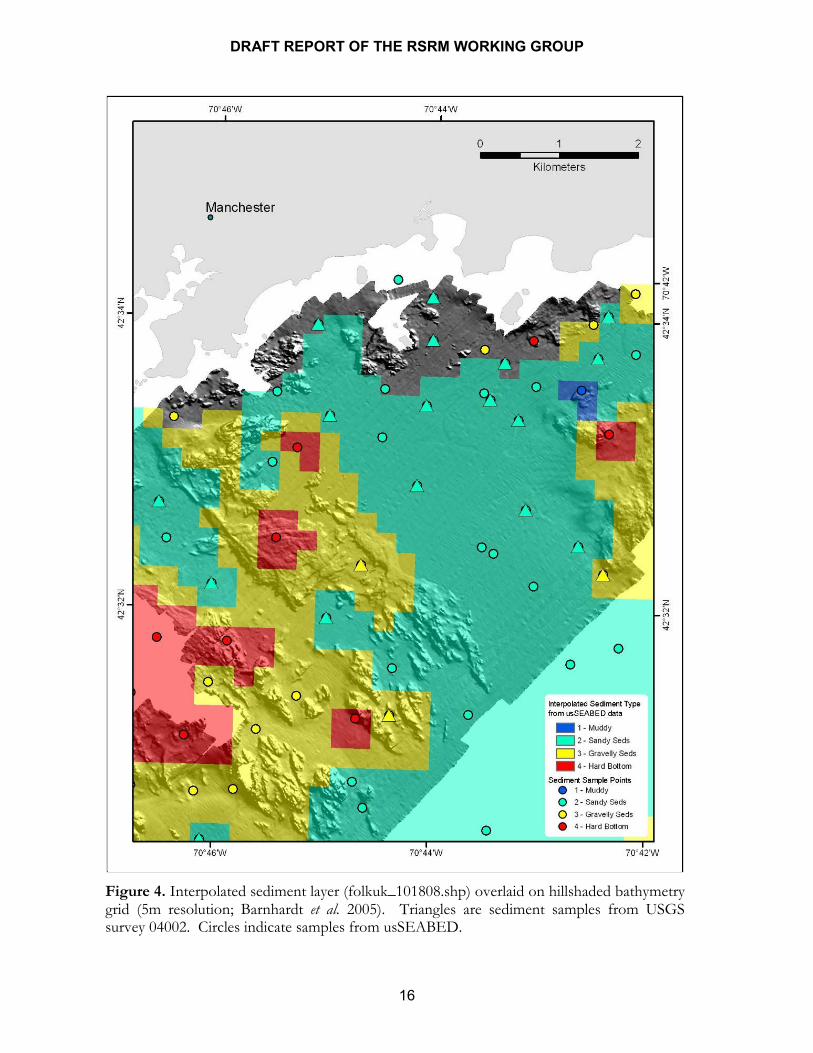
Figure 4. Interpolated sediment layer (folkuk_101808.shp) overlaid on hillshaded bathymetry grid (5m resolution; Barnhardt et al. 2005). Triangles are sediment samples from USGS survey 04002. Circles indicate samples from usSEABED.

DRAFT REPORT OF THE RSRM WORKING GROUP
17
Figure 5. Interpolated sediment layer (folkuk_101808.shp) overlaid on backscatter intensity imagery (1m resolution; Barnhardt et al. 2005). Triangles are sediment samples from USGS survey 04002. Circles indicate samples from usSEABED.
DRAFT REPORT OF THE RSRM WORKING GROUP
18
SECTION FOUR: Data Analysis GIS analysis to create the ranked sediment suitability map followed the work flow outlined below. Derivation of Limited Suitability category: The data used to delineate limited suitability included Hazardous Material, Depth of Closure, and Hard Bottom (Table 1). The depth of closure refers to the seaward limit of sediment transport that marks the end of the littoral zone. Sediments beyond the closure depth and littoral zone are not normally affected by waves and do not contribute significantly to beach profile changes such as erosion and accretion. The most landward 15 foot contour has been used to exclude nearshore sand and gravel deposits for the purposes of resource extraction due to the potential for significant impacts to shorelines. When data becomes available, contaminated sediment would also limit the suitability ranking. Derivation of Low Suitability category: Low Suitability was an amalgam of Dumping Ground (Disposal Sites) and Interpolated Sediment Types described as Fine Sediments (representing M, sM, gM; Figure 3). Additionally, sites located in water depths between 15 feet and 30 feet have been identified as having low suitability, pending site-specific analyses that would quantify the closure depth for the site. Derivation of Medium Suitability category: The only data used to delineate Medium Suitability was Interpolated Sediment Types described as Coarse Sediments (representing gmS, gS, mG, msG, sG, G; Figure 3). Derivation of High Suitability category: High Suitability was an amalgam of Massachusetts Bay Sediment Resources and Interpolated Sediment Types described as Medium Sediments (representing mS, S; Figure 3). The derived suitability category data were overlaid in the following order from top to bottom: Limited Suitability, Low Suitability, Medium Suitability, and High Suitability. This was done to ensure that exclusionary and/or “negative” criteria such as Depth of Closure or Dumping Grounds (Disposal Sites) were not masked by “positive” criteria such as Massachusetts Bay Sediment Resources or highly suitable grain sizes. The final step in the analysis was merging the four categories and then converting the result to a 250m2 grid with the following attributes codes (Figure 4):
Limited Suitability = 0 Low Suitability = 1 Medium Suitability = 2 High Suitability = 3
Caveat: There has been no detailed analysis to identify all sediment resources in the planning area; therefore these rankings cannot fully represent the presence or absence of sediment resources. It should also be noted that the data used to construct both the map and the rankings do not include any other biological, cultural, habitat, infrastructure, or transportation layers.

DRAFT REPORT OF THE RSRM WORKING GROUP
19
Suitability Ranking
Limited Low Medium High
Sediment Resource Area
0 1 2 3
Contaminated Sediment
Present — — —
Hazardous Material
Present — — —
Closure Depth ≤ 5 m 5-9 m — —
Surficial Sediment Hard Bottom Fine
(M, sM, gM)*
Coarse (gmS, gS, mG, msG, sG, G)*
Medium (mS, S)*
Disposal Site — Fine(1)
(M, sM, gM)* —
Medium(2)
(mS, S)*
Identified Resources
— — — Present
*Folk code: M, mud; m, muddy; S, sand; s, sandy; G, gravel; g, gravelly (1) Cape Cod Bay Disposal Site (2) Cape Cod Canal Disposal Sites Table 1. Matrix used to identify potential sediment resources in the ocean management planning area of Limited, Low, Medium, and High suitability for possible beneficial use. Areas identified as Limited Suitability contained characteristics potentially eliminating beneficial uses.
DRAFT REPORT OF THE RSRM WORKING GROUP
20
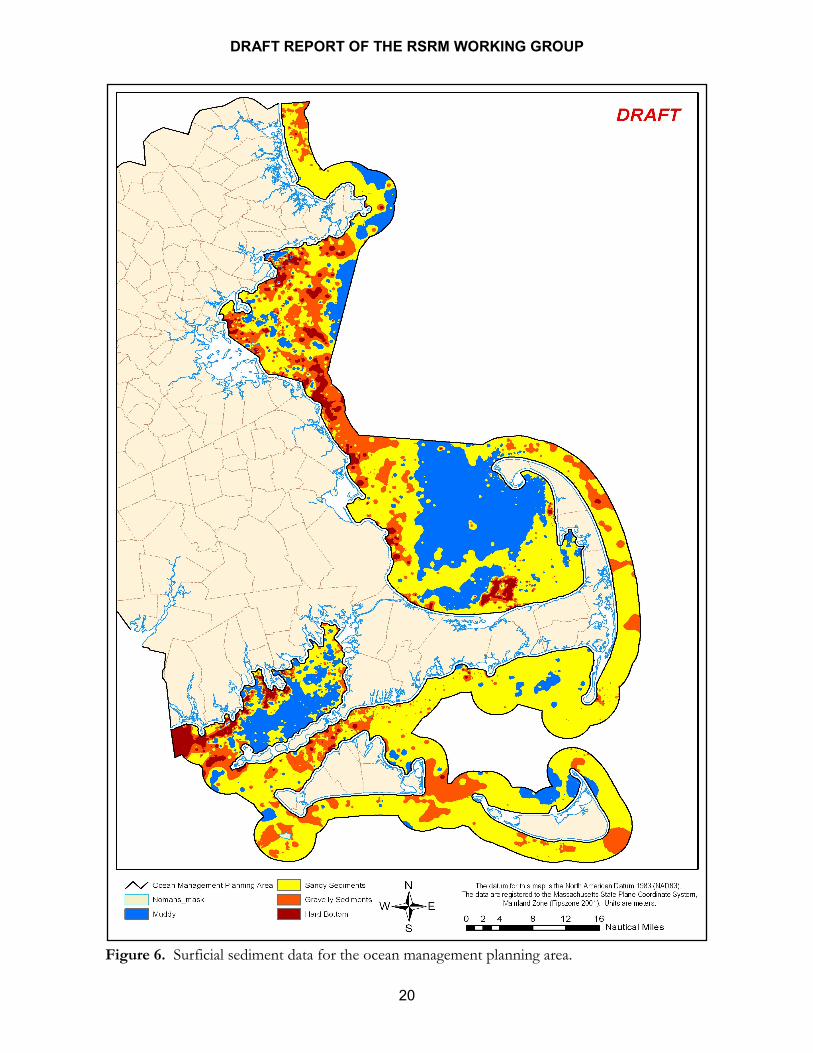
Figure 6. Surficial sediment data for the ocean management planning area.

DRAFT REPORT OF THE RSRM WORKING GROUP
21
Figure 7. Ranked suitability of sediment resources in the ocean management planning area. Suitability of sediment resources for extraction and/or beneficial use is primarily ranked using best available data on grain size. Areas determined to be of limited suitability are located within the 5 meter closure depth, contain contaminated or hazardous material, or exhibit hard bottom.
DRAFT REPORT OF THE RSRM WORKING GROUP
22
SECTION FIVE: Regulatory Summary Within the defined ocean planning area there are a number of statutes and regulations governing the use, removal, and disposal of marine sediments. Those relevant to the activities associated with these uses are summarized below. Massachusetts Environmental Policy Act
Authorities: M.G.L. c. 30, §§ 61-62H: Massachusetts Environmental Policy Act (MEPA); 301 CMR 11.00: MEPA Regulations.
Regulatory Summary: The Massachusetts Environmental Policy Act (MEPA) Unit, within the Executive Office of Energy and Environmental Affairs, administers this review. MEPA provides opportunities for public review of the potential environmental impacts of projects for which state agency action is required; and helps state agencies to satisfy their obligation to avoid damage to the environment, or if damage to the environment cannot be avoided, to minimize and mitigate the damage to the maximum extent practicable. State agency action includes activities that are undertaken, permitted, and/or funded by agencies of the Commonwealth, and the transfer of lands owned or controlled by the Commonwealth. Major categories of project impacts subject to review include land; rare species; wetlands, waterways and tidelands; water; wastewater; transportation; energy; air; solid and hazardous waste; historical and archaeological resources; and state-designated Areas of Critical Environmental Concern.
The intent of the MEPA review is to inform project proponents and state agencies of potential adverse environmental impacts while a proposal is still in the planning stage. The proponent, through the preparation of one or more review documents, identifies required state agency actions and describes the means by which the proposal complies with applicable regulatory standards and requirements. All relevant state agencies are required to identify any aspects of the proposal that require additional description or analysis prior to completion of the agency action, most commonly issuance of an environmental permit.
Massachusetts Wetlands Protection Act and Rivers Protection Act
Authorities: M.G.L. c. 131, § 40: Massachusetts Wetlands Protection Act (WPA); 310 CMR 10.00: Wetlands Regulations.
Regulatory Summary: Local Conservation Commissions and the Massachusetts Department of Environmental Protection (MassDEP), Wetlands Program administers the WPA (310 CMR 10:00: Wetlands Regulations). The purpose of the WPA is to protect Massachusetts wetlands resources and to ensure that the beneficial functions of these resources are maintained. The resources identified are protected because they fulfill the public interest to protect public and private water supply, protect fisheries, protect groundwater supply, provide flood control, protect land containing shellfish, prevent storm damage, protect wildlife habitat, and prevent pollution. These interests are protected by a “no net loss of wetlands” policy. Projects that affect wetlands are required to avoid impacts where possible, minimize unavoidable impacts, and mitigate for unavoidable impacts. Performance standards define the levels of environmental impacts that cannot be exceeded.

DRAFT REPORT OF THE RSRM WORKING GROUP
23
Projects proposed in wetlands resource areas or in the buffer zone around them must obtain a local Order of Conditions. Wetland resources include land under the ocean, coastal banks, coastal beaches and tidal flats, coastal dunes, barrier beaches, rocky intertidal, salt marshes, land under salt ponds, Designated Port Areas, land containing shellfish, and land on the banks of fish runs.
401 Water Quality Certification for Dredging/Discharge
Authorities: 33 U.S.C. 1341 et seq., § 401: Federal Water Pollution Control Act; M.G.L. c. 21, §§ 26-53: Massachusetts Clean Water Act; 314 CMR 4.00: Surface Water Quality Standards, 314 CMR 9.00: 401 Water Quality Certification.
Regulatory Summary: The Division of Wetlands and Waterways in the MassDEP administer the 401 Water Quality Certification Program. The 401 review ensures that a proposed dredge and/or fill project that can result in the discharge of pollutants complies with Massachusetts Surface Water Quality Standards, the Massachusetts Wetlands Protection Act (16), and otherwise avoids or minimizes individual and cumulative impacts to Massachusetts waters and wetlands. As the authority to administer the 401 Water Quality Certification is derived from the Federal Water Pollution Control Act, only projects that require a federal permit are subject to 401 review.
Public Waterfront Act (Chapter 91)
Authorities: M.G.L. c. 91: Public Waterfront Act; 310 CMR 9.00: Waterways Regulations.
Regulatory Summary: The Division of Wetlands and Waterways in the MassDEP administers the Chapter 91 Waterways Program. Chapter 91 is the Massachusetts public trust statute and, as such, protects the public’s rights to fish, fowl, and navigate below the current or historic high water line, as well as in great ponds and navigable rivers and streams in Massachusetts, the so-called public trust lands. Waterways regulations promote the preservation of tidelands for water-dependent uses that require direct access to the water. In addition, the regulations seek to ensure that areas in jurisdiction are maintained for public use and enjoyment when privately developed.
Projects are reviewed to ensure that they: (1) do not unreasonably interfere with navigation, (2) are structurally sound, (3) provide a proper public purpose, (4) do not interfere with public rights or rights of adjacent property owners, (5) will not adversely affect natural resources, and (6) preserve DPAs for maritime industrial use.
U.S. Army Corps of Engineers Permits The following permits are considered together as they are administered together by the U.S. Army Corps of Engineers (Corps) Regulatory Branch through a single permit application.
Rivers and Harbors Act of 1899 (Section 10)
Authorities: 33 U.S.C. §§ 401-413: Rivers and Harbors Act of 1899; 33 CFR 323: Permits for Structures or Work Affecting Navigable Waters of the United States.

DRAFT REPORT OF THE RSRM WORKING GROUP
24
Clean Water Act (Section 404)
Authorities: 33 U.S.C. §1251 et seq.: Federal Water Pollution Control Act; 33 FCR 322: Permits for Discharges of Dredged or Fill Material into the Waters of the United States.
Marine Protection, Research and Sanctuaries Act, (Section 103)
Authorities: 33 U.S.C. §1401 et seq.: Marine Protection, Research and Sanctuaries Act; 33 CFR 324: Permits for Ocean Dumping of Dredged Material.
Massachusetts Programmatic General Permit
Authorities: 33 CFR 320-330: U.S. Army Corps of Engineers Regulations.
Regulatory Summary: A Section 10 permit is required for all work, including structures, seaward of the annual high water line in navigable waters of the United States, defined as waters subject to the ebb and flow of the tide, as well as a few of the major rivers used to transport interstate or foreign commerce. A Section 404 permit is required for activities that involve the discharge of dredged or fill material into waters of the United States, including not only navigable waters, but also coastal waters, inland rivers, lakes, streams, and wetlands. A Section 103 permit is required to transport dredged material for the purpose of disposal in the ocean.
Federal Consistency Review
Authorities: 16 U.S.C. 1451 et seq.: Coastal Zone Management Act of 1972, as amended, 15 CFR 930; M.G.L. c. 21A, §§ 2, 4: Massachusetts Coastal Zone Management Act, 301 CMR 20.00: Coastal Zone Management Program, 301 CMR 21.00: Federal Consistency Review Procedures.
Regulatory Summary: The Massachusetts Office of Coastal Zone Management (CZM) federal consistency review ensures that any federal activities in or affecting Massachusetts coastal resources are consistent with state coastal policies. These policies, the so-called enforceable program policies, are based on existing Massachusetts statutes and regulations and offer policy guidance on management of water quality, marine habitat, protected areas, coastal hazards, port and harbor infrastructure, public access, energy, ocean resources, and growth management. The project-specific federal activity cannot take place until CZM concurs that the project is consistent with state coastal policies.
DRAFT REPORT OF THE RSRM WORKING GROUP
25
SECTION SIX: References
Barnhardt, W.A., B.D. Andrews, and B. Butman. 2005. High-resolution geologic mapping of the inner continental shelf – Nahant to Gloucester, Massachusetts. U.S. Geological Survey Open-File Report 2005-1293. Available online at http://woodshole.er.usgs.gov/pubs/of2005-1293/ Butman, B., M.H. Bothner, F.L. Lightsom, B.T. Gutierrez, P.S. Alexander, M.A. Martini, and W.S. Strahle. 2002. Long-term Oceanographic Observations in Western Massachusetts bay Offshore of Boston, Massachusetts: data Report for 1989-2000. U.S. Geological Survey Digital Data Series DDS-74. Available online at http://pubs.usgs.gov/dds/dds74/ Butman, B., P.C. Valentine, W.W. Danforth, L. Hayes, LA. Serrett, and T.J. Middleton. 2004. Shaded relief, backscatter intensity and sea floor topography of Massachusetts Bay and the Stellwagen Bank region, offshore of Boston Massachusetts. U.S. Geological Survey Geologic Investigations Series Map I-2734, scale 1:125,000, 2 sheets. Available online at http://pubs.usgs.gov/imap/i2734 Folk, R.L., 1959, Practical petrographic classification of limestones: American Association of Petroleum Geologists Bulletin, v. 43, p. 1-38. Reid, J.M., J.A. Reid, C.J. Jenkins, M.E. Hastings, S. Williams, and L.J. Poppe. 2006. usSEABED: Atlantic coast offshore surficial sediment data release. U.S. Geological Survey Data Series 118, Version 1.0, CD-ROM. Available online at http://pubs.usgs.gov/ds/2005/118/