regional sediment management in the corps … · regional sediment management in the corps of...
TRANSCRIPT

Regional Sediment Management Paper submitted to 14th Annual National Beach Preservation Technology Conference
REGIONAL SEDIMENT MANAGEMENT IN THE CORPS OF ENGINEERS
Julie D. Rosati1, Lynn M. Bocamazo2, Bruce D. Carlson3, Jack E. Davis1,
Thomas D. Smith4, Jennifer M. Wozencraft5, Lynn Hardegree5
ABSTRACT
Regional Sediment Management (RSM) refers to the effective utilization of
littoral, estuarine, and riverine sediment resources in an environmentally effective and
economical manner. RSM strives to maintain or enhance the natural exchange of
sediment within the boundaries of the physical system. A “region” may include a variety
of geologic features, uplands, beaches, inlets, rivers, estuaries, and bays.
Implementation of RSM recognizes that the physical system and embedded ecosystems
are modified and respond beyond the formal dimensions and time frames of individual
projects. The larger spatial and longer temporal perspectives of RSM, as well as the
broad range of disciplines with a stake in RSM projects, result in partnerships and co-
leadership of RSM initiatives by the stakeholders. This paper discusses ongoing
demonstrations of RSM by the U.S. Army Corps of Engineers (USACE). Six USACE
District offices are implementing RSM demonstration projects, and two Districts within
the State of Florida have developed their RSM plans with consensus and partnership
with the State of Florida’s Department of Environmental Protection (FDEP), Office of
Beaches and Coastal Systems (OBCS). The paper concludes by highlighting numerical
models that have been applied at the USACE District, New York for RSM, and Research
and Development (R&D) being conducted and planned at the Coastal and Hydraulics
Laboratory (CHL) in support of RSM.
1.0 INTRODUCTION
Regional Sediment Management (RSM), as defined above, essentially changes the
focus of engineering activities within the coastal, estuarine, and riverine systems from
1 U.S. Army Engineer Research and Development Center, Coastal and Hydraulics Laboratory, 3909 Halls Ferry Rd., Vicksburg, MS 39180-6199, (601) 634-3005; fax: (601) 634-4314; [email protected], 2 U.S. Army Engineer District, New York, 3 U.S. Army Engineer Institute for Water Resources, 4 U.S. Army Engineer District, Jacksonville, 5 U.S. Army Engineer District, Mobile.
1

Report Documentation Page Form ApprovedOMB No. 0704-0188
Public reporting burden for the collection of information is estimated to average 1 hour per response, including the time for reviewing instructions, searching existing data sources, gathering andmaintaining the data needed, and completing and reviewing the collection of information. Send comments regarding this burden estimate or any other aspect of this collection of information,including suggestions for reducing this burden, to Washington Headquarters Services, Directorate for Information Operations and Reports, 1215 Jefferson Davis Highway, Suite 1204, ArlingtonVA 22202-4302. Respondents should be aware that notwithstanding any other provision of law, no person shall be subject to a penalty for failing to comply with a collection of information if itdoes not display a currently valid OMB control number.
1. REPORT DATE 2001 2. REPORT TYPE
3. DATES COVERED 00-00-2001 to 00-00-2001
4. TITLE AND SUBTITLE Regional Sediment Management in the Corps of Engineers
5a. CONTRACT NUMBER
5b. GRANT NUMBER
5c. PROGRAM ELEMENT NUMBER
6. AUTHOR(S) 5d. PROJECT NUMBER
5e. TASK NUMBER
5f. WORK UNIT NUMBER
7. PERFORMING ORGANIZATION NAME(S) AND ADDRESS(ES) U.S. Army Engineer Research and Development Center,Coastal andHydraulics Laboratory,3909 Halls Ferry Rd,Vicksburg,MS,39180-6199
8. PERFORMING ORGANIZATIONREPORT NUMBER
9. SPONSORING/MONITORING AGENCY NAME(S) AND ADDRESS(ES) 10. SPONSOR/MONITOR’S ACRONYM(S)
11. SPONSOR/MONITOR’S REPORT NUMBER(S)
12. DISTRIBUTION/AVAILABILITY STATEMENT Approved for public release; distribution unlimited
13. SUPPLEMENTARY NOTES Proceedings: 14th Annual National Conference on Beach Preservation Technology, Orlando, Florida
14. ABSTRACT
15. SUBJECT TERMS
16. SECURITY CLASSIFICATION OF: 17. LIMITATION OF ABSTRACT Same as
Report (SAR)
18. NUMBEROF PAGES
50
19a. NAME OFRESPONSIBLE PERSON
a. REPORT unclassified
b. ABSTRACT unclassified
c. THIS PAGE unclassified
Standard Form 298 (Rev. 8-98) Prescribed by ANSI Std Z39-18

Regional Sediment Management Paper submitted to 14th Annual National Beach Preservation Technology Conference
the local, or project-specific scale, to a broader scale that is defined by the natural
sediment processes and may include the entire watershed. As a result, decisions are
made concerning the timing and scope of projects that move sediment or, alternatively,
form a barrier to sediment movement within the understanding of the regional system.
Figure 1 illustrates a hypothetical example of two regions within a coastal watershed.
Features are shown that provide a source of sediment (rivers and eroding headlands),
and are a sink to sediment (sandy beaches, inlet/harbor entrance, and bay). Ideally,
regions are defined by the large-scale sediment transport patterns as shown in Fig. 1,
although in practical application, other factors influence regional boundaries, such as
political delineation, ecosystems, and economics.
OceanRegion 2
Region 1
riverine source
erodingheadland
erodingheadland
Sediment transport
bay
Sediment transport
riverine source
inlet and
harbor
Figure 1. Example of regions for a hypothetical coastal setting
2

Regional Sediment Management Paper submitted to 14th Annual National Beach Preservation Technology Conference
An example of “project-level sediment management” might be maintenance dredging
of an inlet, with offshore placement of the mixed sand and silt material (the “least cost,”
most economically defensible alternative) despite an eroding adjacent beach. However,
“regional sediment management” would consider the entire watershed in the problem,
and perhaps place the dredged material in a nearshore berm offshore of the eroding
beach. The intent would be that beach-quality material would ultimately move onshore
(or at least provide wave dissipation) and reduce erosion of the beach. If nearshore
placement increased the cost of the project, it may be justified by considering the
additional economic and/or environmental benefits of providing storm protection for the
eroding beach. Alternatively, state and local partners might share the additional cost.
The U.S. Army Corps of Engineers (USACE) has a unique role in the implementation
of RSM. The mission areas of the USACE include navigation, environmental restoration,
storm damage reduction, and flood reduction. In particular, the mission area ensuring
the navigability of our Nation’s waterways involves removing, transporting, and placing
sediment, perhaps providing material that is utilized to support the other mission areas.
In planning, designing, and executing RSM, the USACE works towards consensus with
state and local partners.
In October 1999, a National RSM Demonstration program was initiated within the
USACE to prove that an RSM approach to handling sediment can increase overall
benefits or reduce overall costs. The program has been designed to accomplish this
goal by minimizing the interruption of natural sediment transport processes or by
enhancing these processes to maximize environmental and economic benefits.
Independently, several states have been pursuing RSM within their boundaries. The
USACE District, Mobile, was the first demonstration site (Lillycrop et al 2000). In
October 2000, five more demonstrations were initiated. This paper discusses the history
3

Regional Sediment Management Paper submitted to 14th Annual National Beach Preservation Technology Conference
and economic benefits of RSM, and presents the unique goals and setting for each RSM
demonstration project. Numerical models that have been applied for regional studies in
the USACE District, New York, are discussed. The paper concludes by discussing
ongoing and planned Research and Development (R&D) in support of RSM at the CHL.
2.0 HISTORY
2.1 Background. First, a brief history of the Federal agencies established to
direct the Nation’s coastal engineering is provided to aid in the following discussion. The
Corps established the Board on Sand Movement and Beach Erosion (BSMBE) in
January 1929, which was succeeded by the Beach Erosion Board (BEB) in September
1930 (Quinn 1977). The American Shore and Beach Preservation Association was the
key organization in lobbying for creation of the BEB. The mission of the BEB was to
review plans for coastal projects, make recommendations on them to the USACE Chief
of Engineers, and oversee research in coastal engineering. Membership of the BEB
included four officers of the Corps and three civilians, and therefore formed a unique
organization in the government in that non-government employees participated in review
functions generally considered to be purely the domain of government employees. The
BEB was the key force in development of coastal projects for decades.
From 1930 to 1963, the BEB reviewed and approved all coastal projects (Hunter
and Dean 1995), conducted related research, and documented these studies as well as
theory and guidance for coastal engineering (Wiegel and Saville 1995). In November
1963, Congress passed new legislation abolishing the BEB and replaced it with the
present-day Coastal Engineering Research Board (CERB) and the Coastal Engineering
Research Center (now part of the U.S. Army Engineer Research and Development
Center, Coastal and Hydraulics Laboratory, CHL). The primary reason for the change
was that coastal research and development (R&D) had grown significantly and was
4

Regional Sediment Management Paper submitted to 14th Annual National Beach Preservation Technology Conference
more than a part-time job for the BEB to manage. The BEB recommended the formation
of an R&D laboratory. The CERB was established by Public Law 88-172 as an advisory
board to the USACE Chief of Engineers on matters pertaining to coastal engineering,
and continues to have two meetings each year with discussions of Federal coastal
engineering projects as well as research at the CHL.
2.2 Evolution of concepts related to RSM. The term “river of sand,” the
idealized model of sediment moving parallel to the shoreline in a somewhat continuous
manner due to oblique wave approach was first discussed in a 1933 BEB publication
(Quinn 1977). The corollary to this concept, that obstructions to this movement will
ultimately create erosion further down the “river,” is a fundamental consideration for
RSM on developed shorelines. It was realized that sediment also moves cross-shore,
and laboratory measurements of cross-shore sediment transport were made at the BEB
in the mid-1930s.
The first sand bypassing systems at navigation projects, designed to reinstate
net longshore sand transport to downdrift beaches, were put into operation in the mid-
1930s at Santa Barbara, California (Penfield 1960) and South Lake Worth Inlet, Florida
(Caldwell 1951). In the 1940s and 1950s, measurements of longshore sand transport
were made through impoundment at jetties and groins, and semi-empirical formulae and
theories were developed (Wiegel and Saville 1995). These formulae are still in use today
(Shore Protection Manual 1984). In 1966, Bowen and Inman introduced the concept of
littoral cells (Bowen and Inman 1966). Littoral cells represent sub-regions of the
watershed within which sediment transport processes can be bounded, perhaps by
“known” values. For the purposes of RSM, a region may be defined by one or many
littoral cells. Komar and Inman (1970) developed the concepts of sediment budgets,
sources, and sinks within defined littoral cells. A sediment budget is an accounting of
gains (sources) and losses (sinks) of littoral material within a defined area (littoral cell).
5

Regional Sediment Management Paper submitted to 14th Annual National Beach Preservation Technology Conference
Today, these ideas are fundamental in defining a regional system and in optimizing
sediment management actions.
2.3 USACE’s National RSM Demonstration Program. The USACE’s National
RSM Demonstration Program was initiated in October 1999 as a result of several CERB
initiatives, and a “grass-roots” movement within several individual Corps District offices
and their State partners. At the 60th CERB Board Meeting in 1994, the president of the
CERB tasked the CERB with developing future directions that the Corps and the coastal
engineering R&D program should take. A task force was formed, and recommended
among other things that the Corps adopt a “systems approach to coastal sediment
management.” As a result, a Working Group on Sediment Resource Management was
formed to develop an implementation plan for the initiative. The 67th CERB meeting held
in 1998 was themed “Regional Sediment Management,” and later CERB meetings
entertained a proposal for a RSM demonstration within the Mobile District. The Mobile
District was the first district that stepped forward with a RSM demonstration plan that
received Congressional support. Funding for the National Demonstration Program
began with this demonstration in October 1999. Separately, the grass-roots movement
for RSM grew with Corps Districts pursuing RSM initiatives with State and local
partnerships. In late 2000, the National RSM Demonstration Program expanded to
include five additional demonstration sites in the U.S.
3.0 BENEFITS
3.1 Introduction. In simplest terms, economics is about getting the most for our
money. The role of the economist in RSM is to help the study team identify the best
Federal investment options for operating and maintaining coastal projects, both at given
sites (local and regional systems) and at the program level (nationwide).
6

Regional Sediment Management Paper submitted to 14th Annual National Beach Preservation Technology Conference
The main goal of RSM is to keep sand in the littoral system, avoiding disruptions to
natural sand movement. Unfortunately, as a society we can’t afford to return all sand to
the system at once, so the best opportunities for wisely managing sand need to be
identified for priority implementation. This is addressing the fundamental economic
problem: how do we put our scarce resources to their best uses?
3.2 Sources. Benefits from RSM are derived from several different sources.
The first is better information, specifically better knowledge about the physical makeup
and processes in the coastal zone. By better understanding the problem, more efficient
management approaches can be identified. RSM also generates benefits through better
technology. New techniques, and refinement in older techniques, can lead to smarter
management actions. RSM also brings a broader view of how to wisely manage sand.
It incorporates a systems view of projects, rather than treating operations at projects in
isolation, taking advantage of previously unidentified synergistic effects. The categories
of benefits considered under RSM are also broadened in comparison to status quo
management, so more desirable purposes can be achieved. Finally, RSM builds
stronger partnerships among coastal stakeholders leading to a wide range of potential
benefits in improving business processes, sharing data, expanding partners’ overall
scope of effectiveness, and greater cooperation among parties.
3.3 Economic Framework for RSM. Under the “old” approach to managing
coastal projects, actions were determined by the least cost means of delivering the
navigation benefits of the specified project. Frequently this resulted in actions that
removed sand from the littoral system, through upland, isolated, or offshore placement.
Additionally, each site or project was treated in isolation, rather than as part of the
coastal system. Offsite and unintended effects were generally not recognized or
considered. In retrospect, this approach can be seen as missing opportunities for more
wisely managing the sand resource.
7

Regional Sediment Management Paper submitted to 14th Annual National Beach Preservation Technology Conference
Under RSM, the economic effects of evaluating alternative sand management
activities can be considered under two “tracks”: cost savings; and wise management of
sand resources. Cost savings can most easily be thought of as achieving the same
results or benefits from a project through more efficient methods. Cost savings are
realized by identifying production efficiencies, such as dredging cost savings across
places or time, or by eliminating actions that are working at cross purposes, such as
adjacent dredging and beach nourishment projects. Wiser management of sand
resources can be achieved by expanding the scope of beneficial effects considered for
alternative approaches to project operations and maintenance. It recognizes the value
of sand as a resource. For example, keeping sand in the system may be slightly more
expensive than disposing material offshore, but it may reduce costs at a downdrift beach
nourishment site, thereby realizing overall net benefits. Another possibility is that
dredged material can be put to a beneficial use, rather than be placed in a disposal area
that may or may not have storage costs. The timing of effects may also play a role in
realizing new benefits.
A range of anticipated benefit categories is shown below, organized by the system of
four “accounts” established in the Principles and Guidelines (U.S. Water Resources
Council, 1983):
• National Economic Development o Storm damage reduction
• Commercial, residential structures • Undeveloped land • Infrastructure
o Recreation • Domestic • International
o Navigation • Reduced operations and maintenance outlays
• Environmental Quality
o Ecosystem restoration • Beach habitats, dunes, freshwater wetlands
8
Regional Sediment Management Paper submitted to 14th Annual National Beach Preservation Technology Conference
• Endangered species o Aesthetics o Cultural resources
• Regional Economic Development
o Income o Employment o Tax receipts
• Other Social Effects
o Urban and community impacts o Life, health, safety o Environmental Justice
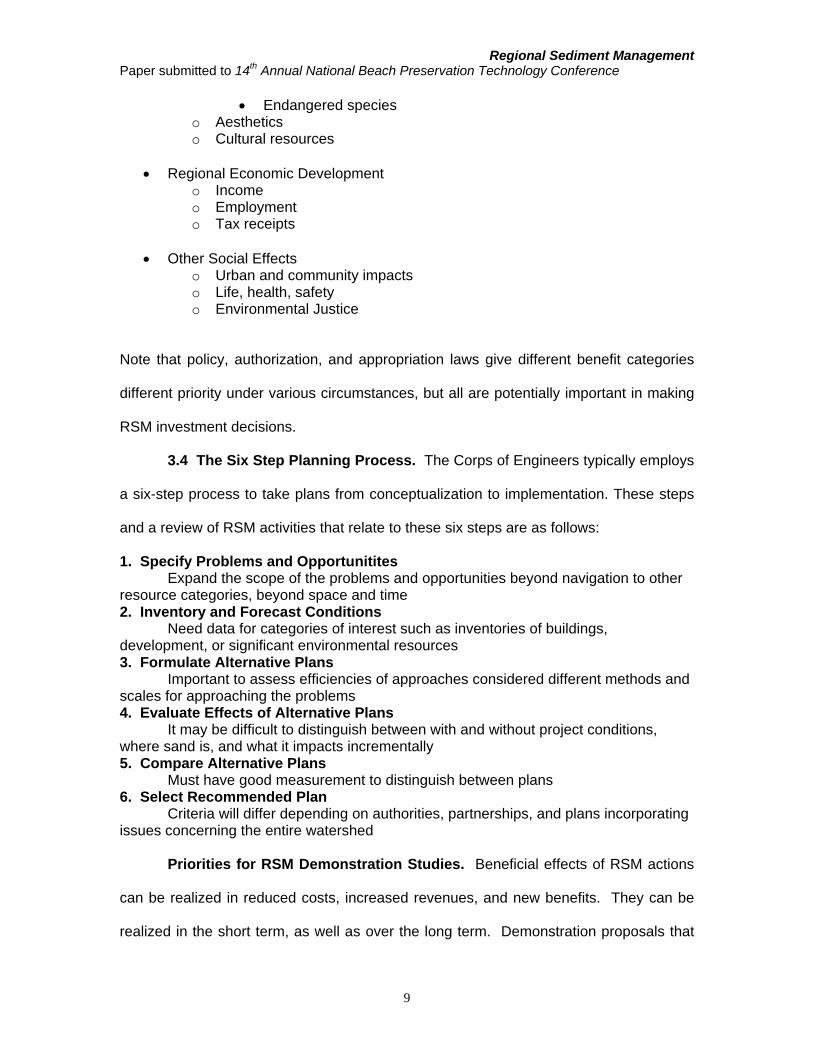
Note that policy, authorization, and appropriation laws give different benefit categories
different priority under various circumstances, but all are potentially important in making
RSM investment decisions.
3.4 The Six Step Planning Process. The Corps of Engineers typically employs
a six-step process to take plans from conceptualization to implementation. These steps
and a review of RSM activities that relate to these six steps are as follows:
1. Specify Problems and Opportunitites Expand the scope of the problems and opportunities beyond navigation to other resource categories, beyond space and time 2. Inventory and Forecast Conditions Need data for categories of interest such as inventories of buildings, development, or significant environmental resources 3. Formulate Alternative Plans Important to assess efficiencies of approaches considered different methods and scales for approaching the problems 4. Evaluate Effects of Alternative Plans It may be difficult to distinguish between with and without project conditions, where sand is, and what it impacts incrementally 5. Compare Alternative Plans Must have good measurement to distinguish between plans 6. Select Recommended Plan Criteria will differ depending on authorities, partnerships, and plans incorporating issues concerning the entire watershed
Priorities for RSM Demonstration Studies. Beneficial effects of RSM actions
can be realized in reduced costs, increased revenues, and new benefits. They can be
realized in the short term, as well as over the long term. Demonstration proposals that
9

Regional Sediment Management Paper submitted to 14th Annual National Beach Preservation Technology Conference
highlighted management actions to realize cost savings in the short term received
highest priority within the RSM program. While all benefits across these variables are
important, those actions demonstrating short-term cost savings will rapidly show the best
of what RSM can achieve. Actions providing other effects have been included in the
demonstration program to round out the range of experience that can be captured under
the program.
3.5 Specific Beneficial Activities from RSM Demonstration Projects. The
proposed RSM actions include a fairly wide range of measures that will be beneficially
employed. These actions can be grouped into categories, even at this early stage of
conceptualization. The first broad area can be described as accretion/erosion
management. In these cases, coastal projects are disrupting the natural flow of sand.
Measures to balance the sediment movement include various means of bypassing sand
artificially, as well as restoring natural flows that have been impeded. Both accretion
and erosion can be problematic, with too much sand clogging storm water outflow
systems, and erosion threatening buildings or infrastructure.
Environmental or ecosystem restoration is another category of activity present in
the initial demonstrations. Reinforcing natural berms that protect freshwater lakes or
wetlands from saltwater intrusion is one example. Placing sediment behind an island to
mimic historic natural overwash sediment dynamics (early successional habitat for
colonial and nesting shorebirds) is another. There are a number of threatened and
endangered species in the areas of the demonstration studies that should benefit from
restored habitat under RSM.
Demonstration studies are also identifying new efficiencies in dredging for
existing coastal projects. These efficiencies may result from scheduling maintenance for
adjacent projects to share costs; from better understanding sediment flows to avoid
10

Regional Sediment Management Paper submitted to 14th Annual National Beach Preservation Technology Conference
“rehandling” of the materials; and by employing more refined technologies, such as
pinpoint dredging systems.
Recognizing sand as a valuable resource (and expensive liability) depending on
circumstances accounts for another area where savings are foreseen. Dredged material
may be put to beneficial uses rather than dumped or placed in disposal areas. This
results in positive benefits where the material is wisely use, and may be less expensive
than finding other beach quality material. Additionally, there are savings that result from
reduced costs in disposal areas, which can be especially important as existing areas
reach capacity. Sediments trapped behind dams starve beaches of material that would
be expensive to replace, and accumulation reduces both the volume and effectiveness
of the dams’ original purposes. Stockpiling sand for emergency recovery from
hurricanes is also being considered to reduce recovery costs and improve readiness to
alleviate the emergency.
3.6 Improved Processes and Partnerships. The approach taken to
implementing RSM has involved substantial participation across levels and agencies of
government. Participants in the Mobile District RSM Demonstration Project have
identified a number of important intangible benefits of working together that will
ultimately lead to wiser sand and coastal management, which have been divided by
related category:
• Overarching program goals o Wider beaches, more protection, less maintenance o Keep sand in the littoral zone o Keeping sand in the system as a beneficial use of dredged material
• Aligned actions across agencies o Identifying programs that are working at cross-purposes (ex: trucking
sand away from an area that needs sand) o Opportunities to align programs at the Federal, state, and local levels
• Improved understanding of physical processes o Sediment budget will identify areas of erosion/accretion to assist in
modifying sediment management practices o Better models and understanding of the physical system will lead to better
decisions
11

Regional Sediment Management Paper submitted to 14th Annual National Beach Preservation Technology Conference
• Business process efficiency o Baseline data to make future Feasibility studies faster and cheaper o Building a common database for all agencies to use o Solving datum problems, which are currently costly to fix, but more costly
to ignore if errors lead to bad or inefficient decisions • Stakeholder collaboration
o Improved communication between Federal, state, and local governments (and presumably non-governmental organizations too)
o RSM is a catalyst for realizing the importance of managing the coastal resources
o Eglin Air Force Base has joined as a participant in the East Pass management plan
o Understanding where the various states are in terms of coastal management and policies (ex: Florida advanced, Alabama less developed)
• Preparedness o Identifying future problem areas, and acting now (expected
concentrations in population growth, related development, recreational use)
o Identification of where data collection is needed
3.7 Goals for National RSM Economic Assessment. The economics tasks for
Fiscal Year 2001 include establishing the framework described in this paper and
applying it to each of the demonstration projects. Efforts will focus on sharing
measurement approaches and broadened concepts of benefits attributable to RSM. In
Fiscal Year 2002, the scope of the analysis will widen to attempt to sum up the potential
for RSM actions if undertaken on the demonstration districts as a whole. In Fiscal Year
2003, the scope will increase to assessing the potential of implementing RSM
nationwide.
4.0 USACE’S NATIONAL RSM DEMONSTRATION PROGRAM
The USACE’s National RSM Demonstration Program was started largely through the
CERB initiative together with strong Congressional support from several Coastal and
Great Lakes States. The five-year program is designed to run through Fiscal Year 2003.
12

Regional Sediment Management Paper submitted to 14th Annual National Beach Preservation Technology Conference
The goals of the program are:
1. The USACE will have improved sediment management practice (as necessary).
2. Demonstrations will highlight and document unique elements of RSM and provide guidance for future implementation of specific RSM actions as appropriate.
3. State and local partnerships for RSM will result in a unified vision, cost-sharing, and co-leadership of RSM actions.
4. RSM actions will seek to engage cross-mission objectives of the Corps. (More projects will be designed and constructed with the deliberate intent to achieve cross-mission benefits, e.g., storm protection, navigation, and environmental enhancement.)
5. Approaches for defining environmental and economic benefits for RSM will have been defined.
And, a final goal depending on R&D support of RSM,
6. Decision-support technology for RSM will have improved. (Conceptual, analytical, and numerical models will have been adapted and improved to support RSM.)
Towards these goals, RSM demonstrations within the USACE are being conducted
in six of the 18 coastal and Great Lakes Districts (Figure 2). The following section
highlights only a part of each demonstration project, with the intent to describe how each
demonstration is working towards the goals of the program.
MobileJacksonville
SouthPacificDivision
NewJersey
NewYorkDetroit
Figure 2. USACE’s Fiscal Year 2001 National RSM Demonstration Projects
13

Regional Sediment Management Paper submitted to 14th Annual National Beach Preservation Technology Conference
4.1 Mobile District. The Mobile District’s demonstration project covers 345 miles
of shoreline, extending from the St. Mark’s River, Florida in the east through the Pearl
River, Mississippi in the west. As such, the demonstration involves the coastal,
estuarine, environmental, and geological agencies from three states, x counties, and
other Federal offices. At the start of the demonstration in October 1999, historical data
sets for the region were vastly different. Data were unavailable for large portions of the
region. A primary goal, then, was to establish a baseline data set (bathymetry, shoreline
position, and profiles) within a Geographic Information System (GIS), which is ongoing.
Partnerships have been formed, and several sub-initiatives of the RSM demonstration
are being appropriately directed by non-Corps agencies.
The Mobile District is also working towards the end vision of the program by
changing operation and maintenance practices at three sites. At Perdido and East Pass
Inlets, disposal sites for dredged material have been selected that minimize rehandling
of material. The third initiative presently under consideration involves the disposal sites
for dredged sediment along the Apalachicola River, located near the eastern boundary
of the region. Disposal sites along the river are full, and the RSM demonstration project
is considering the cost and benefits of bringing this sediment to the coast for beach
nourishment and/or environmental enhancement. For more detail about the Mobile
District’s RSM demonstration project, the reader is directed to the web site for the
Demonstration project
http://www.sam.usace.army.mil/sediment/sediment_homepage.htm.
4.2 Jacksonville District. The Jacksonville District formally began their National
demonstration project in January 2001 for the Northeast Coast of Florida, although they
had initiated State and local partnerships, cost-sharing with the State, conducted four
regional workshops, and began three RSM initiatives prior to receiving formal
14

Regional Sediment Management Paper submitted to 14th Annual National Beach Preservation Technology Conference
demonstration funding (see Schwichtenberg and Schmidt 2000). RSM investigations in
this region were accomplished under a Section 22 agreement between the Jacksonville
District of the USACE and the Florida Department of Environmental Protection (FDEP),
Office of Beaches and Coastal Systems (OBCS). Section 22 of the Water Resources
Development Act of 1974 (Public Law 93-251), as amended, authorizes the Secretary of
the Army, acting through the Chief of Engineers, to assist the states in the preparation of
comprehensive plans for the development, utilization and conservation of water and
related land resources. The agreement facilitated RSM practices in the Sea Islands and
St. John’s Beaches Sub-Regions of the Northeast Atlantic Coast Region as defined by
the OBCS. As so defined, the limits of these sub-regions extend from the northern
Nassau County line through Duval County to the southern St. Johns County line. The
Jacksonville District provided technical assistance to the OBCS in coordinating RSM
activities in the two sub-regions. A RSM web site (http://rsm.saj.usace.army.mil) has
been developed as part of the agreement to facilitate coordination with other Federal
and non-Federal agencies as well as the public sector.
RSM strives to enhance the planning, construction, operation and maintenance
(O&M) of navigation, shore protection and environmental restoration projects while
protecting natural resources. The USACE and the FDEP recognize that there are other
agencies, entities and non-governmental organizations that are also integral to RSM
initiatives and have solicited their insight. Workshops concerning RSM in northeast
Florida were held in St. Johns, Duval and Nassau counties. During these workshops the
Federal, state and local perspectives were presented and opportunities for RSM were
identified. Potential Demonstration Projects (PDPs) were identified as cost effective and
innovative regional approaches. A fourth workshop involving all of the regional interests
focused on implementation of PDPs in Northeast Florida. Six specific PDPs identified
during initial workshop efforts included, 1) Stabilize South End of Amelia Island, 2)
15

Regional Sediment Management Paper submitted to 14th Annual National Beach Preservation Technology Conference
Bypass Sand at St. Marys Entrance, 3) Backpass and Bypass Sand at Ft. George and
St. Johns River Entrances, 4) Bypass Sand at St. Augustine Inlet, 5) Offloading Disposal
Areas and 6) Demonstrate Innovative Technologies.
The purpose of the fourth workshop was to identify and brainstorm actions required
to implement demonstration projects under the framework of the USACE missions and
the FDEP Strategic Beach Management Plan. The workshop included several overview
presentations intended to provide baseline information upon which the group
discussions were based. The discussions themselves were intended to elicit comments
and suggestions from various stakeholders regarding the PDPs, as well as to obtain
specific information requisite to the implementation of the PDPs. Specific
recommendations were generated for each PDP regarding engineering, economic,
environmental and policy issues. Participants identified specific economic and
environmental benefits as well and these benefits were similar across all six PDPs.
Economic benefits include reduction in future renourishment and O&M costs, enhanced
recreational usage and increased protection for upland development. Environmental
benefits of these PDPs include maintaining nesting habitats for turtles and shore birds,
reestablishment and stabilization of dune systems, increased viability of local species
(e.g., beach mouse populations) and overall improvement to public lands. Based upon
the final comments of the workshop sponsors, the workshop provided useful information
and recommendations for the USACE and the FDEP to prioritize the RSM demonstration
projects. The priority PDPs were identified as 1) Stabilize South End of Amelia Island,
and 2) Backpass and Bypass Sand at Ft. George and St. Johns River Entrances.
The southern tip of South Amelia Island presently experiences chronic erosion. The
FDEP Strategic Beach Management Plan identifies a 3.1-mile segment of critical erosion
along the ocean shoreline of South Amelia Island that needs renourishment. The Plan
also recommends a feasibility study of shore protection structures. The influences of the
16

Regional Sediment Management Paper submitted to 14th Annual National Beach Preservation Technology Conference
1994 beach fill borrow pit on wave refraction and action of the existing groins on
transport processes will be evaluated. Short-term efforts to implement the “Stabilize
South End of Amelia Island” PDP have recently been completed through a multi-agency
(USACE, FDEP, Florida Inland Navigation District, South Amelia Island Shoreline
Stabilization Association and others) cooperative RSM initiative. This initiative resulted
in the placement of approximately 330,000 cubic yards of beach quality material from
O&M dredging of the Atlantic Intracoastal Waterway and construction of geotextile
shoreline stabilization tubes (see Figure 3). Ultimately, the goal of the PDP is to
establish long-term solutions to the erosion problems on the south part of the island.
Figure 3. South Amelia Island O&M disposal area (January 25, 2001). Approximately 330,000 cubic yards of beach quality sand were placed as part of this multi-agency initiative
17

Regional Sediment Management Paper submitted to 14th Annual National Beach Preservation Technology Conference
The “Backpass and Bypass Sand at Ft. George and St. Johns River Entrances”
PDP involves the backpassing of beach quality material onto Little Talbot Island and
bypassing material across the entrance to the Duval County beaches. The PDP also
strives to identify the optimum location for placement of the bypass material. The FDEP
Strategic Beach Management Plan has identified a 10-mile segment of critical erosion
that extends from the St. Johns River entrance to the Duval-St. Johns County line. The
Plan also calls for continued beach nourishment in Duval County and further study of the
St. Johns River entrance. The Jacksonville District has identified several sources for
beach renourishment including Buck Island and the Jacksonville Harbor deepening
project. In addition, three alternative borrow sites have been identified in and around Ft.
George Inlet (see Figure 4). These include 1) the extensive ebb shoal system, 2) the
1
2
3
Figure 4. Three proposed borrow areas identified for the “Backpass and Bypass Sand at
Ft. George and St. Johns River Entrances” potential demonstration project
18

Regional Sediment Management Paper submitted to 14th Annual National Beach Preservation Technology Conference
flood shoal north of the A1A bridge, and 3) the shoal that forms just south of the north
jetty at the southern tip of Wards Bank. Another purpose of this PDP involves
backpassing of sand to persistent erosion areas located on the south end of Little Talbot
Island.
Concrete rip-rap shore protection provided by the Florida Department of
Transportation effectively stabilizes a segment of the north bank of the inlet channel in
the vicinity of the eastern end of the State Road A1A bridge. However, the channel
remains free to shift northward over its eastern segment. This process has led to the
continued erosion of the southeastern corner of Little Talbot Island along with a
northward growth of Wards Bank. In turn, the inlet channel has changed its former east-
west orientation, and has increased in length. As a result of the ensuing shoreline
recession, state park facilities on Little Talbot Island have been compromised. Several
of the potential borrow sites for the St. Johns River bypass operations could also serve
as backpassing sources for the southern tip of Little Talbot Island.
Funds provided by the USACE National RSM program along with matching State
funds will be used to investigate various alternatives for implementation of these PDPs.
The scope of work for this investigation involves applying Diagnostic Modeling System
(DMS) tools and methodologies to examine the sediment transport mechanisms related
to each PDP. Additionally, the DMS will identify existing shoaling sources to provide
beach compatible material for erosion control. Finally, hydrodynamic modeling outlined
by these scopes will employ the community model currently under development by the
U.S. Army Engineering Research and Development Center. The scope of work for the
investigation of these two PDPs includes the following:
19
Regional Sediment Management Paper submitted to 14th Annual National Beach Preservation Technology Conference
Stabilize South End of Amelia Island 1. Compile and collect survey data 2. Identify existing shoaling sources of beach placement material 3. Model existing conditions and alternative plans 4. Evaluate alternatives effectiveness and impacts 5. Report results
Work will begin by conducting a hydrographic and high water survey of the
Nassau Sound vicinity and amassing recent available hydrographic and shoreline data.
Next, the region of interest (Nassau Sound vicinity) will be extracted from the community
model mesh constructed by the U.S. Army Engineer Engineering Research and
Development Center, Coastal and Hydraulics Laboratory. The survey data will provide
high resolution, sub-region detail not included in the community model. Next, suitable
calibration for the wave and current models will be located for the study area. ADCIRC
and STWave, two USACE-supported models, will provide simulations of representative
wave and tidal conditions and bathymetric controls on the nearshore wave pattern.
Specifically, wave and current modeling will be linked through the steering module
developed for the USACE. The steering module provides interaction between ADCIRC
and STWave giving a more accurate representation of the wave and current climates.
The existing conditions model provides the baseline conditions at Ft. George and the St.
Johns River Entrance. Applying the DMS in conjunction with the above-described
modeling will identify the areas of problematic shoaling in the Atlantic Intracoastal
Waterway.
Application of the DMS will also identify potential shoaling sources of beach
placement material and pathways associated with the shoaling areas. A maximum of
three additional simulations will evaluate the wave and current conditions associated
with three stabilization alternatives. By comparison to the baseline results, these
simulation results will quantify the impacts and effectiveness caused by implementing
these alternatives.
20

Regional Sediment Management Paper submitted to 14th Annual National Beach Preservation Technology Conference
Backpass and Bypass Sand at Ft. George and St. Johns River Entrances
1. Compile and collect survey data 2. Apply DMS to identify existing shoaling sources of potential beach placement
material 3. Model existing conditions (tidal current, waves) and alternative plans 4. Determine location of longshore transport node and characteristics of the
nearshore wave climate downdrift of St. Johns River Entrance. 5. Report results
Work will begin by conducting a hydrographic and high-water survey of the Ft.
George Inlet vicinity and amassing recent available hydrographic and shoreline data.
Next, the region of interest (St. Johns River and Ft. George Inlet vicinity) will be
extracted from the community model mesh constructed by the US Army Engineering
Research and Development Center. The survey data will provide high resolution, sub-
region detail not included in the community model. Next, suitable calibration for the
wave and current models will be located for both the St. Johns River and Ft. George
Inlet. The numerical models ADCIRC and STWAVE (for more information, see
subsequent section titled “Numerical Models for RSM”) will provide simulations of
representative wave and tidal conditions. Specifically, wave and current modeling will be
linked through the steering module developed for the USACE. The steering module
provides interaction between ADCIRC and STWAVE giving a more accurate
representation of the wave and current climates.
The existing-condition model provides the baseline conditions at Ft. George and
the St. Johns River Entrance. Applying the DMS in conjunction with the above-
described modeling will identify the areas of problematic shoaling in the Jacksonville
Harbor Entrance and littorally influenced interior channel. Applying the DMS will also
identify potential shoaling sources of beach placement material and pathways
associated with the shoal located south of Wards Bank inside the jetties. Three
additional simulations will evaluate the wave and current conditions associated with
21

Regional Sediment Management Paper submitted to 14th Annual National Beach Preservation Technology Conference
mining the three areas identified previously: Ft. George ebb shoal, Ft. George flood
shoal, and the shoal within the jetties south of Wards Bank. By comparison to the
baseline results, these simulations will quantify changes caused by these mining
operations. Wave modeling will also aid in both identifying the location of the transport
node downdrift of the St. Johns River Entrance and determining nominal location(s) for
potential nearshore or onshore placement of dredged material. A report summarizing all
work performed and conclusions reached will be prepared.
The scope of work also requires that the DMS work be used to summarize
sediment inputs, outputs, and available shoreline and channel response information
generated or developed in the overall summary in a Sediment Budget Analysis System
(SBAS) application. The coastal issues described above are readily summarized and
explored in a conceptual sediment budget that can be made quantitative through
incorporation of magnitudes and directions of longshore and cross shore transport,
volume change on the beaches, and engineering actions. Applicable results of the
proposed studies, such as potential transport rates and directions, will be compiled in
SBAS and transferred to study sponsors. The SBAS will contain both macro and
individual preliminary budgets for initiation of an RSM approach to the study areas. It is
understood that the sediment budgets are preliminary in that potential rates and
inferences will form the basis of the SBAS input, not specific data collection and analysis
(such as shoreline change, nearshore bathymetry change) that would require a separate
and dedicated effort. The SBAS will also include metadata explaining the budget
formulation.
In conclusion, the brainstorming and coordination provided through the workshop
series and products derived from the DMS modeling efforts are being utilized by the
USACE and FDEP to efficiently and effectively implement RSM demonstration projects
in northeast Florida.
22

Regional Sediment Management Paper submitted to 14th Annual National Beach Preservation Technology Conference
4.3 Philadelphia District. The initiative planned by the Philadelphia District ties
closely with ongoing R&D at the CHL. The Philadelphia RSM demonstration extends
approximately 130 miles from Sandy Hook in the north (located in the New York District),
to Cape May (mouth of the Delaware Bay) in the south. A suite of wave, current, and
sediment transport models will be applied to the region to characterize the longshore
and cross-shore transport rates, as well as the regional sediment budget. The RSM
demonstration involves moving sand from an accreting beach northeast (updrift) of Cape
May Inlet to the eroding southwest (downdrift) side of the inlet. Accretion along the
updrift beach is believed to be caused primarily by the construction of jetties at Cape
May Inlet in 1911, and has resulted in at least two problems: storm water outfalls that do
not drain because of beach accretion, and excessive beach widths that make
recreational beach user access to the “shoreline” problematic. Nourishment of the
downdrift shoreline has been obtained from an offshore borrow site, but that site has an
insufficient reserve of material for future nourishment needs (approximately 153,000 cu
m/yr) (McCormick et al 2001). Through application of the numerical models, and
possibly a pilot implementation study, the RSM demonstration will evaluate two means
of moving the sand, i.e., a continuous mechanical bypass system or trucking material as
required.
4.4 New York District. The New York District has two initiatives under the National
RSM Demonstration Project: backpassing of sand at Jones Inlet, New York, and creation
of an artificial overwash fan using dredged material proposed for Seabright, New Jersey
(Rahoy and Bocamazo, 2001). The first initiative will explore the benefits of removing an
attachment bulge in the shoreline downdrift (west) of Jones Inlet, located on Long Island.
This attachment zone formed as the ebb tidal shoal reached a size that it began
bypassing sediment to the adjacent beach. It is hypothesized that the attachment zone
is now acting as a barrier to eastward-directed sand transport. Immediately to the east
23

Regional Sediment Management Paper submitted to 14th Annual National Beach Preservation Technology Conference
of the attachment zone, and west of the inlet, the beach is severely eroded. The
demonstration project will place sand scraped from the attachment zone into the
severely eroded beach. In addition to providing an immediate source of sand for this
area, it is believed that removing the attachment zone will allow east-moving sand to
nourish the severely eroding region, at least until the ebb tidal shoal re-establishes the
bypassing bridge. This demonstration project has the potential for national applicability,
because many inlets in the U.S. share the same downdrift signature of Jones Inlet.
The second demonstration, creation of an overwash fan, attempts to restore this type
of habitat on these populated barrier islands. On an undeveloped barrier island, storms
with elevated wave and water levels will overwash the island and move sand into the
bay. This material forms an “overwash fan,” and provides habitat for specific
endangered species. The infrastructure of the South Shore of Long Island prohibits this
process from occurring on a regular basis. The success of an artificial overwash fan will
be evaluated as an alternative for dredged material disposal, and, if successful,
guidance for construction will be developed.
4.5 Detroit District. The Great Lakes provide a unique setting for RSM. Beach
quality sediment available to nourish eroding beaches is scarce. The clay bluffs can
erode rapidly when unprotected by a sandy beach and nearshore profile. As part of the
National RSM Demonstration Project, the Detroit District is striving to develop a sand
placement schedule and warning system for protecting the fragile bluffs. Also under the
demonstration, they are exploring the feasibility of implementing a “Sand Bank” policy in
which proponents of new private shore protection projects would have the option to pay
into a trust fund dedicated to financing larger scale beach nourishment projects (Ross et
al 2001). Alternatively, individual sand placements would be required to mitigate for
coastal structures that prevent sand from entering the littoral system.
24

Regional Sediment Management Paper submitted to 14th Annual National Beach Preservation Technology Conference
4.6 South Pacific Division (San Francisco, Sacramento, and Los Angeles
Districts). The South Pacific Division began partnerships with the State, counties, and
various grass-roots agencies with a goal to develop a state-wide RSM plan in FY00,
prior to formal funding. Regional studies have been conducted in Southern California
since the 1980s. Funds from the National Demonstration Project are being used to
finalize the statewide RSM plan, as well as explore the feasibility of moving material
trapped behind dams on rivers feeding the coast to the coastline. Ownership of this
material has long been a topic of discussion and debate in California (O’Brien 1936,
Magoon and Edge 1998). Reservoirs on many rivers in Southern California have
reached sediment capacity, and some have degraded to such an extent that the
infrastructure must be repaired, replaced, or removed. Several options have been
discussed: remove the dams and allow riverine transport processes move the material;
excavate and truck the material to the coast; and pump the material via pipeline. The
RSM demonstration is evaluating the cost, benefits, and time required for each of these
options (Domurat and Sloan 2001).
5.0 GEOGRAPHICAL INFORMATION SYSTEMS FOR RSM 5.1 Introduction. The Spatial Data Branch, Operations Division, USAE District
Mobile, created a Geographic Information System (GIS) to address the data
management and data analysis requirements of the Regional Sediment Management
Demonstration Program undertaken by USAED Mobile. The resulting GIS provides
RSM scientists and engineers an interface to hydrographic, topographic,
photogrammetric, and historic dredge material data for the RSM Demonstration Region,
as well as custom applications designed to facilitate engineering analyses. The RSM
GIS serves as the link between engineering analyses and regional numerical models.
To date, development of the RSM GIS has included: input of spatial data for the RSM
25

Regional Sediment Management Paper submitted to 14th Annual National Beach Preservation Technology Conference
region, use of built-in ArcView applications to enhance data manipulation and display,
and creation of custom applications to extend the utility of ArcView for RSM specific
goals. This section will give an overview of the effort to create the RSM GIS including
data preparation for inclusion in the GIS, data display using ArcView, creation of custom
applications for RSM, and other capabilities currently under development.
5.2 Spatial Data Input. Spatial data that are currently included in the RMS GIS
include: hydrographic and topographic survey data, aerial and oblique photography,
dredge material records, digital nautical charts, and generic GIS information.
5.2.1 Hydrographic and Topographic Survey Data. Hydrographic and
topographic survey data are required for the RSM Demonstration Program in two forms.
First, a unique data set must be created for each survey collected in the region. Second,
the data sets must be merged into a single most recent, or “baseline” data set that
covers the entire region. The RSM GIS data sets include three types of hydrographic
and topographic data: singlebeam fathometer data, multibeam fathometer data, and
airborne lidar bathymetry and topography.
The most extensive data set used to create the RSM baseline data set was
obtained from National Geophysical Data Center (NGDC). These data are the data that
appear on NOAA nautical charts and are the result of several years of hydrographic
surveying. The NGDC data is referenced to MLLW based on NOAA specifications that
require transfer of tidal datum based on comparisons of simultaneous tide
measurements collected at a gauge near the survey site and an established gauge
(NOAA 1999). In most areas, the distance between adjacent points ranges from 300
meters near shore to 1500 meters farther offshore. Exceptions are the navigation
channels at Mobile Pass, Alabama, Pensacola Pass, Florida, and the Panama City
Entrance Channel, Florida. In these areas the data density approaches 30 meters.
26

Regional Sediment Management Paper submitted to 14th Annual National Beach Preservation Technology Conference
The USACE District Mobile’s Irvington Site Office provided the second type of
data included in the RSM baseline data set. The data take the form of navigation
channel condition surveys collected using a singlebeam fathometer. This type of data
was included in the baseline for Mobile Pass and Perdido Pass, both located in
Alabama. These data were originally referenced to MLLW using tidal gauges at the
passes. The survey coverage includes only the authorized navigation channel, with data
points collected in profile lines spaced approximately 100 meters apart along the length
of the navigation channel. Data spacing along the profile lines is sub-meter. These data
were collected in spring of 2000.
The final type of data included in the RSM baseline is that collected by the
USACE SHOALS (Scanning Hydrographic Operational Airborne Lidar Survey) system
(Lillycrop et al. 1996). These data were collected at a density of 4 meters for project
condition surveys at East Pass, Pensacola Pass, Panama City, and Perdido Pass. The
project condition surveys were collected for USAED Mobile. Survey coverage includes
the navigation channel, ebb and flood shoals, and adjacent shorelines and offshore
areas. For these surveys, depth data were collected relative to the water surface and
were referenced to tidal gauges in each of the inlets. The tidal gauges were set relative
to NOAA tidal benchmarks in the area.
In addition to the SHOALS project condition surveys, SHOALS shoreline surveys
were also included in the RSM baseline data set. SHOALS data have been collected for
the entire coastline of the RSM demonstration region. The Florida Department of
Environmental Protection (FLDEP) commissioned SHOALS data extending from the
Panama City Entrance Channel to Apalachicola Bay, Florida, to support coastal erosion
monitoring. The data were collected relative to a short baseline of NOAA benchmarks
relative to NGVD29 using kinematic GPS. The remaining coastline was surveyed by
SHOALS as part of the RSM baseline initiative. These data were collected relative to
27

Regional Sediment Management Paper submitted to 14th Annual National Beach Preservation Technology Conference
the water surface and were referenced to tidal benchmarks in the area by interpolation
between the benchmarks. These last two data sets were collected at a density of 8
meters. The surveys follow the coastline, covering 300 meters of inshore dry beach and
800 meters of offshore bathymetry.
Each of the data sets listed above were converted to the same horizontal and
vertical datums. The horizontal datum chosen by the user is Universal Trans Mercator
(UTM) projection defined by the North American Datum 1983 (NAD83). The vertical
datum chosen by the user is North American Vertical Datum 1988 (NAVD88).
As mentioned above, the baseline data set represents the most recent data for
each part of the demonstration region. This means data collected most recently for each
area supercedes all other data for that area. For example, near East Pass, Florida, the
baseline data set includes NGDC data, the RSM SHOALS shoreline data set (collected
in 2000), and a SHOALS project condition survey (collected in 1997). The NGDC data is
superceded by the more recent SHOALS surveys. So, the NGDC data retained for the
RSM baseline data set only covers the offshore areas beyond the extent of the SHOALS
surveys. The SHOALS project condition survey of 1997 includes data for the flood and
ebb shoals, adjacent beaches and inlet throat at East Pass. The RSM SHOALS
shoreline data set collected in 2000 covers an area along the shoreline extending from
300 meters onshore to 800 meters offshore. The 2000 data set supercedes the 1997
data set in this alongshore swath. The 1997 data for the flood and ebb shoals and inlet
throat that lie outside of this swath are retained for the baseline data set.
A graphical representation of the data retained in the RSM baseline data set near
East Pass, Florida, is shown in Figure 5. The triangles shown in Figure 5 represent
individual NGDC data points, while the 4- to 8-meter density SHOALS data sets are
represented by filled polygons.
28

Regional Sediment Management Paper submitted to 14th Annual National Beach Preservation Technology Conference
Figure 5. East Pass, Florida. Graphical representation of data retained for RSM baseline data set. Triangles represent actual NGDC data points while SHOALS 4- to 8-meter density data sets are represented by filled polygons.
5.2.2 Aerial and Oblique Photography. Both aerial and oblique photos are
included in the RSM GIS. All aerial photography currently included in the RSM GIS was
provided to the Spatial Data Branch ortho-rectified and of various geographic projections
(See Figure 6). The individual images were tiled together (mosaicked) using the Image
Analysis extension of ArcView. Mosaics were then imported into ArcINFO, converted
into grids, and reprojected to the desired projection of the RSM GIS project. The
projected grids were converted back into image files and compressed using
Multiresolution Seamless Image Database (MrSID) software.
Oblique photos, along with corresponding descriptions, were provided to the Spatial
Data Branch in hardcopy form. The photos were scanned and saved in JPEG file
interchange formats. Photo descriptions were typed and saved as text files. Through
29

Regional Sediment Management Paper submitted to 14th Annual National Beach Preservation Technology Conference
Figure 6. Aerial photo mosaic built for the area near Perdido Pass, Alabama
the Historical Photos application inside the RSM GIS, oblique photos are viewed and
printed with corresponding descriptive data.
5.2.3 Dredged Material Records. Historical dredged material records are stored in
a customized database. The database stores information regarding dredging history for
each of the nine federal navigation projects in the region. Every known dredging event
is included in the RSM GIS dredge material database, along with associated removal
sites, dredge material quantities, placement sites, dredge contractors, and costs
associated with the dredging contract. This information was collected from the USAED
Mobile Operations Division’s Irvington and Panama City Site Offices. The original form
of the information was 3” X 5” notecards.
5.2.4 Digital Nautical Charts. NOAA nautical charts serve as the background
for all other graphic entities built into the RSM GIS. These nautical charts were obtained
from MapTech distributed CD’s. Three steps were required to prepare the digital
nautical charts for inclusion in the RSM GIS. First, the charts were reprojected from
MapTech’s proprietary .kap format into a UTM83 projection using the Chart Reproject
DOS utility available through the NOAA webpage. Second, the .kap files and their
30

Regional Sediment Management Paper submitted to 14th Annual National Beach Preservation Technology Conference
associated .bsb files were imported into ArcView and converted into the Tagged Image
File (TIFF) Format with corresponding world files. This process was achieved using the
Chart Reproject extension to ArcView, also provided by NOAA. Finally, the TIFF format
charts were “cleaned” to remove extraneous graphics and text as well as colorized to
produce an accurate depiction of a nautical chart. This last step was achieved using the
Paint Shop Pro image editor.
5.2.5 Generic GIS Data. The US Census Bureau releases extracts from the
Census Topologically Integrated Geographic Encoding and Referencing (TIGER)
database. The database is built on a county by county basis. For each county,
TIGER/Line files include roads; railroads; hydrography; transportation information; power
lines; pipe lines; municipal boundaries; landmarks (schools, churches, parks and
cemeteries); and key geographic locations like shopping centers and factories (US
Census Bureau 2000). These data are released in GIS format and are directly
importable into the RSM GIS, provided that they are in the proper projection. In the case
of the RSM GIS, generic GIS data was projected into UTM83 through the Projection
Utility of ArcView.
5.3 Data Manipulation and Display Using ArcView. ArcView and its
extensions provide a great deal of data manipulation capability. This section outlines the
use of built-in ArcView functionality for the creation of new coastal entities like the mean
high water line and bathymetric contours.
5.3.1 Shorelines. Shorelines were created directly in ArcView. The shoreline
was determined from the position of the debris line on the ortho-rectified aerial
photographs. The debris line often denotes the location of mean high water (MHW),
which is the desired shoreline for most coastal applications. The shoreline was
delineated using heads-up digitizing in ArcView. The position of the debris line on the
orhto-rectified aerial photographs were marked approximately every 50 feet. Through
31

Regional Sediment Management Paper submitted to 14th Annual National Beach Preservation Technology Conference
the X tools extension in ArcView, a linear interpolation was performed between each
point to create the MHW shoreline.
5.3.2 Triangulated Irregular Network. Using an ArcView extension called 3D
Analyst, a triangulated irregular network (TIN) was created from each of the
hydrographic and topographic data sets included in the RSM GIS, including the baseline
data set. TINs allow RSM data users to use these data sets as surfaces, rather than as
two-dimensional data points with an elevation attribute. The surfaces allow for more
accurate volume computations between data layers and are included as a data layer in
the GIS.
5.3.3 Grids. 3D Analyst was also used to create a grid of each data set. A grid
is a set of regularly spaced data points created from a set of irregularly spaced data
points, like the topographic and hydrographic data sets. In the RSM GIS, grids were
created from TINS in order to most accurately represent elevation changes about the
surface. Grids are used to facilitate calculations between data sets and volume
computations. At each XY grid point an elevation is interpolated based on the elevation
of the TIN at that same XY grid point. Each grid has been assigned a color scale based
on elevation of the grid points. This colorizing of the grid points has the effect of creating
color-filled contours for each data set. The grids are included as a data layer in the GIS.
5.3.4 Contours. Linear contours are also included as a layer in the RSM GIS. The
contours were created using 3D Analyst. The contours are spaced at 1.5m intervals.
The contours are drawn based on the elevations given by the grid surfaces.
5.4 Creating Custom Applications for ArcView. Several custom applications
have been written to extend the capability of ArcView to meet RSM specific goals.
These applications are generally written in AVENUE script and Visual Basic and take
32

Regional Sediment Management Paper submitted to 14th Annual National Beach Preservation Technology Conference
advantage of ArcView and ArcView extension functionality. AVENUE is ESRI’s
programming language.
5.4.1 Oblique Photo Tool. Aerial photography and oblique photography often
contain valuable qualitative information regarding the condition of beaches, dunes,
offshore shoals, and other coastal features. Oblique photography, generally taken with a
standard camera from the beach itself, from nearshore buildings, or sometimes from the
air, cannot be integrated into a GIS because it lacks positioning information. Aerial
photography can be integrated with a GIS if necessary rectification information is
available such as camera angles, which are related to aircraft roll and pitch. However,
especially with older aerial photography, often the only information available is the
contact print itself.
To include these valuable photos in the GIS, even though no positioning
information is available, an oblique photo tool was created that hotlinks these photos to
the areas in which they were taken. For example, several photos have been collected at
East Pass, Florida, that cannot be rectified for input into the GIS. The oblique photo tool
allows the RSM GIS user to select a location. Available photography for that location is
displayed with relevant information.
An example of the oblique photo tool is shown in Figure 7. In the dialog, a small,
or “thumbnail” version of a photo taken at East Pass, Florida, is displayed. By clicking
the Full Size button, users can access a larger version of the photo. All relevant
information stored in the photo database is displayed to the right of the photo. This
includes the date of the photo, the file the photo is stored in, and a caption describing the
photo.
33

Regional Sediment Management Paper submitted to 14th Annual National Beach Preservation Technology Conference
Figure 7. Custom oblique photo viewing tool built for the RSM GIS. The left side of the dialog shows a thumbnail view of a photo taken at East Pass, Florida, while the right size contains the photo location, date, and a caption stored for the photo.
5.4.2 Dredge Data Reporting Tool. The dredge material database is accessed
through the dredge data reporting tool. The reporting tool calls up all known dredging
events from the dredge material database. The user may access a Dredging Report by
selecting an event from the scroll down list. The user may also select a particular
navigation channel from the spatial domain of the RSM GIS and view reports for every
event within that particular channel.
An example of a dredge data report is shown in Figure 8. Figure 8a shows the
spatial domain of the RSM GIS near Mobile Pass, Alabama. Visible in the domain are
the shoreline and navigation channels in this area. The dredging event highlighted in the
dredge data reporting tool (shown blacked out here) is linked to the channel section
highlighted in the main window of Figure 8a (denoted by arrows here). The dredge data
reporting tool then uses data extracted from the dredge material database to fill a
dredging report. A portion of a dredging report is shown in Figure 8b.
34

Regional Sediment Management Paper submitted to 14th Annual National Beach Preservation Technology Conference
Dredge data reporting tool
Figure 8 Dredging Report tool created for RSM GIS. Figure 8a shows the RSM GIS spatial domain near Mobile Pass, Alabama. This view includes the shoreline and navigation channels in this area. Figure 8b shows a portion of the dredging report filled with data from the dredge material database.
(a)
(b)
Dredge Data Reporting Tool
35

Regional Sediment Management Paper submitted to 14th Annual National Beach Preservation Technology Conference
5.4.3 Profile Tool. Beach profiles have been collected as part of the coastal
monitoring for the State of Florida for many years. Part of the baselining effort for the
RSM Demonstration Program included the collection of beach profiles along the entire
coast of Alabama. To compare this data with higher-density data sets, like SHOALS or
multibeam data sets, users must be able to view profiles extracted from the higher
density data sets at locations where historical profiles were collected.
The profile tool allows the user to extract profiles from the higher density data
sets. The profiles may be extracted along hand drawn line objects. The profile tool
creates a set of elevations along a line based on the grid surfaces included in the GIS.
An example profile tool is shown in Figure 9. Figure 9a shows the spatial domain
of the RSM GIS near East Pass, Florida. Visible in the domain are the shoreline in this
area, the grid surface for a SHOALS data set collected in at East Pass in 1996, and a
solid line for which a profile will be extracted. Figure 9b shows the profileviewing
window, where a profile is shown for both the November 1995 SHOALS data set and the
1996 SHOALS data set.
5.4.4 Compute Volumes Tool. The compute volumes tool gives RSM
engineers and scientists the capability to compute volumes between data sets. The
volumes are computed based on the grids created from the original data sets. The user
may compute a volume by drawing an area (polygon) for which a volume is desired. At
each grid point, an elevation difference is calculated between the two data sets. The
volume is determined by integrating the differences over the areas they represent. The
volume for the designated area is reported in a pop-up window. The differences are
stored as a data layer in the RSM GIS.
36

Regional Sediment Management Paper submitted to 14th Annual National Beach Preservation Technology Conference
(a)
(b)
Figure 9. Profile tool created for RSM GIS. Figure 9a shows the spatial domain of the RSM GIS near East Pass, Florida. This view includes the shoreline in this area, the grid created for the 1996 SHOALS data set, and a line where a profile is desired. Figure 9b shows the profile viewing window, where a profile is displayed for the November 1995 SHOALS survey and the 1996 SHOALS survey.
37

Regional Sediment Management Paper submitted to 14th Annual National Beach Preservation Technology Conference
An example showing the computed differences is shown in Figure 10. This view
shows the spatial domain for the RSM GIS near East Pass, Florida. Visible in the
domain are the shoreline and the difference grid computed during a volume calculation.
The difference grid is shown in the lower central portion of the view. The black and dark
gray grid cells are areas of positive difference, or accretion. The lighter gray areas are
areas of negative difference, or erosion.
5.4.5 Additional RSM Tools. Five additional tools created specifically for the
RSM are the RSM theme tool, a dynamic search tool, a coordinate conversion tool, and
two printing tools. The theme tool allows users to select a group of themes, or data
layers, to add to a view at a single time. For instance, all the themes in the area
surrounding East Pass, Florida may be added as a single group. The dynamic search
tool allows the user to search for a specific feature within a single theme. The
coordinate conversion tool allows the user to convert between UTM and geographic
coordinates. The printing tools allow the user to automatically print the current view or
select feature attributes to output to the printer.
5.5 Conclusions. The RSM GIS provides engineers and scientists with tools to
both visualize spatial data and perform engineering analyses. Data visualization
improves understanding of potential sediment transport pathways. Engineering
analyses provide exact quantities of change in shoreline position and sand volumes.
These two pieces of information are required by RSM engineers and scientists to
calibrate the numerical models upon which regional sediment management concepts
depend.
38

Regional Sediment Management Paper submitted to 14th Annual National Beach Preservation Technology Conference
Figure 10. Volume tool created for RSM GIS. This figure shows the spatial domain for the RSM GIS near East Pass, Florida. The view includes the shoreline and the difference grid computed during a volume calculation. The black and dark gray grid cells are areas of positive difference, or accretion. The lighter gray grid cells are areas of negative difference, or erosion.
6.0 NUMERICAL MODELS FOR RSM Regional sediment management concerns identifying and quantifying pathways
and patterns of sediment movement, and using best management practices to preserve
littoral and financial resources. Regional numerical models are tools to aid decision-
makers in alternative selection for future activities to minimize or improve impacts on all
pieces of the littoral system. Only through modern numerical models and innovative data
measurement procedures are we now able to technically support the development of
answers to regional sediment pathways questions.
39

Regional Sediment Management Paper submitted to 14th Annual National Beach Preservation Technology Conference
This section gives a general overview of the regional setting on the south shore
of Long Island, New York, and of the numerical models that can be used in the
evaluation of regional sediment management. Examples of how we are using these
models at the New York District Corps of Engineers will be discussed.
The south shore of Long Island faces the Atlantic Ocean. Net transport of
material is to the west, toward New York Harbor, but there are strong seasonal and
localized reversals of transport, especially at the inlets. The Long Island south shoreline
consists of 95 miles of barrier island, eroding headlands on the eastern 30 miles, and
productive estuarine bays. There are six federal navigation inlets on the south shore.
The area has farms and parklands, and the cities of Long Beach and New York. The
shoreline over the last 100 years has been impacted by both storms, which caused
barrier island breaching and overwash, and human activities such as inlet stabilization
and groin construction.
On south shore of Long Island, the Army Corps has six maintained navigation
channels that are each dredged every two to three years, from 200,000 cubic yards per
operation at Rockaway Inlet to 1 million cubic yards at Fire Island Inlet. There are a
number of storm protection projects, including the 83-mile Fire Island Inlet to Montauk
Point study. The entire shoreline is covered by Federally authorized storm protection
projects. Over the last six years we have had intensive data collection efforts, and we
have an Ecosystem Restoration program for the bays. As an indication of the amount of
sediment placed on the beach in the area between Fire Island Inlet and Montauk Point,
over the last 40 years, an average of approximately 300,000 cubic yards of material has
been placed annually by the Corps and others. For these Long Island projects, over the
last 10 years we have extensively used numerical modeling for the individual project
areas.
40

Regional Sediment Management Paper submitted to 14th Annual National Beach Preservation Technology Conference
Within the last three years, the district was forced by the geography and coastal
processes of Long Island, its’ continuous sediment transport path along the headlands
and barrier islands, and the need for material for storm damage protection projects, to
start to think regionally, as the navigation inlets, shoreline protection projects and the
ecosystem concerns are interconnected. Other agencies are concerned about regional
impacts also. The EPA and U.S. Fish and Wildlife Service have asked us to examine
the cumulative impacts of the beachfill placement and dredging activities. There are
also concerns about endangered species and prevention of overwash fan development.
The task now facing the New York District is to connect the project areas into a regional
system using the coastal processes tools and models available.
For regional numerical modeling on Long Island, we have initiated regional
sediment budgets, a regional ocean circulation model, regional shoreline change
models, circulation models for inlets and bays, and a regional wave model, with nested
grids at the inlets. A requirement for the validity of the regional models is accurate input
data. We have been fortunate to be able to collect repeated high quality bathymetry of
some of the inlets, long-range profiles and aerial photography. Through an authorized
data collection program and the support of the Coastal Inlets Research Program (CIRP),
we have collected a very large data set of wave, wind, current and water level data.
Again, through CIRP support, we have assembled a long-term history of the shoreline
and the bays, which is used to check the reasonableness of the models. Regional does
not always mean a large spatial area. It can also mean the understanding of all the
features of a location, such as ebb and flood shoals, bay hydrodynamics, and wave and
current interaction. Models are needed to answer the questions of wave energy and
height, shoreline evolution, ocean and bay hydrodynamics, inlet sedimentation patterns
and effects on adjacent beaches, and the stability of the barrier islands.
41

Regional Sediment Management Paper submitted to 14th Annual National Beach Preservation Technology Conference
The District has used the following numerical models to develop regional
understanding of natural processes, and as tools for evaluating engineering alternatives:
sediment budgets and the Sediment Budget Analysis System (SBAS), STWAVE,
GENESIS, ADCIRC, a multiple inlet stability model, MIKE21, the Reservoir Model, and
the Cascade model. A discussion of each of the models follows.
6.1 Sediment Budgets and SBAS. A regional sediment budget is an
accounting of gains and losses within a littoral system for a specific period of time, over
both local and regional scales. Sediment budgets can range from conceptual to very
detailed, depending on the quantity and quality of the littoral system change data
available. Sediment budgets can be used to measure the impacts of engineering
actions along a regional coastal area, and well as measure the effects of natural
processes such as long-term erosion and barrier island breaching.
Rosati and Gravens (1999) developed a regional sediment budget for the Fire
Island Inlet to Montauk Point study area. The area was divided into five morphologic
zones, and evaluated over a number of time periods. Through the sediment budget, the
net longshore transport rates for various conditions, such as the uncertainties in
contributors such as bluff erosion, the historical and existing conditions, and various time
periods, were developed, along with the potential longshore transport rate developed
from adjusted Wave Information Study (WIS) hindcast data. In the near future we will
develop a regional sediment budget for all of Long Island as an RSM demonstration
project. This Fire Island to Montauk Point sediment budget will be used to evaluate
storm protection alternatives for that project. The Sediment Budget Analysis System
(SBAS) is a PC-based system for formulating sediment budgets, has been applied at
Shinnecock Inlet, including all the sources and sinks and the sediment pathways. SBAS
can be as general or specific as needed.
42
Regional Sediment Management Paper submitted to 14th Annual National Beach Preservation Technology Conference
6.2 Steady Wave (STWAVE). STWAVE is a steady-state spectral wave model.
It is a nearshore wave transformation model used to describe changes in wave
parameters such as wave height, period, direction and spectral shape, between the
offshore and the nearshore. STWAVE simulates many wave transformation
characteristics, including refraction and shoaling, diffraction and wave growth due to
wind input. The nearshore wave output from STWAVE is used to develop estimates of
sediment transport, and then with subsequent models, shoreline change. An STWAVE
wave grid has been developed for the 83-mile Fire Island Inlet to Montauk Point
reformulation study (Gravens, 1999). The wave grid was developed from recent
bathymetry, the use of the WIS waves, and verified using nearshore and offshore wave
gage data. Three computational grids were used for this nearshore model. Accounting
for changes in bathymetry and coastal features, variations of net sediment transport over
the domain were developed. The model was applied to evaluate the changes in
transport caused by dredging offshore borrow sites.
The LISHORE project has implemented STWAVE regionally along the Long
Island coast (Grosskopf, 2001). LISHORE is supporting wave gauges that provide
validation data for numerical modeling and real time documentation of wave conditions.
The model is configured on a coarse resolution grid (1 nautical mile) along the entire
island that provides boundary wave spectra for the finer, nested grids with resolution of
50 to 100 meters at Shinnecock and Jones Inlet. The application of STWAVE along the
entire regional domain provides insight into wave-driven processes at a variety of spatial
scales, which are critical to defining the regional sediment budget and impacts of
engineering on that budget.
6.3 Generalized Model for Simulation of Shoreline Change (GENESIS).
GENESIS is a one-contour-line beach evolution model. GENESIS calculates
longshore sand transport rates and resulting planform shape of the modeled coast at
43

Regional Sediment Management Paper submitted to 14th Annual National Beach Preservation Technology Conference
short time intervals over a proscribed simulation period. The effects of coastal structures
and other planform changes to the beach can be evaluated by the model. For the Fire
Island to Montauk Point study, the GENESIS model was configured for application to
three analysis reaches within the study area, from 15 to 30 miles long. The area
includes three inlets, as well as a field of 16 groins at Westhampton. Project
alternatives for the Fire Island to Montauk Point study, such as widened beaches, and
the addition or removal of coastal structures, will be evaluated in the near future, based
on the configured GENESIS model. Having a regional shoreline change model will
provide answer to questions of the regional impacts of the project alternatives.
6.4 Advanced Circulation Model. ADCIRC is a two-dimensional, depth
integrated finite-element hydrodynamic model developed with the capability of operating
over a wide range of grid element sizes. Fine resolution can be defined for accurate
calculation of flow through channels and around coastal structures. ADCIRC has been
applied by the New York District in large- and small-scale applications. A regional tidal
circulation model has been developed that includes the Atlantic Ocean, Long Island
Sound and New York Harbor, and the six inlets and the associated bays located on the
south shore of Long Island. Resolution is increased from the ocean toward the coast,
with greatest node density in the bays and inlets. The regional propagation of the tidal
wave around Long Island was modeled using ADCIRC. Differences in water surface
elevations play a key role in the circulation of water through the south shore estuary
system, which in turn impacts inlet hydrodynamics and inlet sediment transport patterns.
Due to concerns regarding borrow area sources for a shoreline protection project
just west of Shinnecock Inlet, we asked for assistance from the Coastal Inlet Research
Program to develop a model which could predict impacts of using the flood shoal as a
borrow source (Militello and Kraus 2001). Fine detail was implemented in the ADCIRC
model mesh for the Shinnecock study area, for resolution of the channels, jetties and
44

Regional Sediment Management Paper submitted to 14th Annual National Beach Preservation Technology Conference
shoals. Over 15 alternative configuration of flood shoal mining were modeled. ADCIRC
has a robust wetting and drying algorithms to simulate the inundation and exposure of
the flood shoal. Based on the impacts calculated by the model, a final recommended
plan for the flood shoal mining was developed. By having this tool, we were able to
show the local land trustees how changes in the bathymetry would change the current
patterns. Without this tool we would have never been able to recommend using the
flood shoal as a borrow source.
6.5 Stability Analysis. A multiple inlet stability analysis was used for the
evaluation of barrier island breaching, to determine whether a stabilized inlet or a newly
formed inlet would remain open after a breaching event (Headland, 1999). The
condition of the inlet/bay system can have great impacts on local and regional sediment
transport, including displacement of barrier island sediments, burial of bay habitat,
interruption of littoral drift, and increased shoaling or closure of inlet navigation channels.
The analysis was based on the methods of Escoffier and van de Kreeke. For each of
the barrier-bay systems, closure surfaces considering the areas of the inlet and the
breach, and corresponding flow velocities were developed. The overlapping of the two
equilibrium flow curves, is plotted separately to determine if both the inlet and the breach
will close, if the inlet will close, if the breach will close or both will remain open. Empirical
data of historical breaches on Long Island, especially breach cross-sectional area, was
very important to this analysis.
6.6 MIKE21. The New York District used MIKE21 ST at Coney Island, due to
the need to better describe current actions which combine with waves to move sediment
around a groin and wrap the sediment around the back side of the island (Moffatt &
Nichol Engineers 1998). The model enabled the District to make conclusions about
sediment transport patterns and to test alternatives at a highly eroding shoreline.
45

Regional Sediment Management Paper submitted to 14th Annual National Beach Preservation Technology Conference
6.7 Cascade. “Cascade” is a new numerical simulation model aimed to bridge
the gap between a sediment budget over a regional extent and the application of
GENESIS over the individual reaches comprising the region. Sediment storage and
bypassing are represented at the inlets between reaches. Cascade explicitly represents
sediment-transporting motion on different spatial and temporal scales, cascading
sediment transport processes to and from regional to local scale. The regional and local
contours are represented, as are the ebb shoals for calculation of waves and longshore
sediment transport. The Cascade model stores and bypasses sand at inlets by
incorporation of elements of the Reservoir model.
6.8 Reservoir Model. The Reservoir Model (Kraus 2000) is a mathematical
model for calculating the volume and sand-bypassing rate at ebb-tidal shoals. The
analytical solution for volume changes and bypassing rates depends on the ratio of input
longshore sand transport rates and the equilibrium volume of morphological features of
the ebb shoal, the bypassing bar and the attachment bar. The model gives explicit
expressions for the time delays in sand bypassing associated with creation and growth
of the features. The Reservoir model was applied at Shinnecock Inlet to evaluate
consequences of mining the flood shoal (Militello and Kraus 2001). An extended
generalized model also includes the flood shoal, the inlet entrance channel and the
exchange of sediment between these and other sand bodies.
6.9 Conclusions. In summary of this aspect of regional sediment management,
numerical models are available to help define the littoral system and can be used to
evaluate natural and engineering impacts to the system. Regional numerical modeling
can be initiated by gathering all the available accurate data on waves, shoreline change,
engineering activities, natural events such as breaching, sediment type, circulation
patterns. The next step is to develop a conceptual sediment budget. From that base,
SBAS can be used to develop a flexible, spatially variable sediment budget, to determine
46

Regional Sediment Management Paper submitted to 14th Annual National Beach Preservation Technology Conference
areas where more data is needed. If there are enough funding resources, and good
regional data including measured wave data is available, the models describe in this
section can be used to assist in regional sediment management tasks.
7.0 RESEARCH AND DEVELOPMENT NEEDS FOR RSM
Although regional concepts have engaged our attention for many decades,
procedures and models for answering questions that must be addressed in RSM are not
available for the large spatial and temporal scales required. Because RSM may involve
the movement of sediments over large regions, and repetitive placement of material,
long time periods (10 to 50 years) are necessary to evaluate the likely outcome of many
RSM activities. Research at CHL in support of coastal RSM is directed towards the
models discussed in the previous section, as well as other endeavors. Studies needed
for RSM include:
•
•
•
Large-Scale Barrier Island Processes. Processes such as barrier island dynamics, including wind-blown sand processes, overwash, and barrier island migration and shape changes are not well-understood.
Prediction of long-term wetland and coastal land losses, and practical restoration options.
Physics governing long-term evolution of coastal morphology (shoreline, inlets, offshore shoals, sand ridges, sandbars, etc.) expressed in terms of large temporal and spatial scales and including long term hydro-meteorological phenomena such as El Nino events, changing weather patterns, and relative sea-level rise (from Kraus 1997).
8.0 CONCLUSION
The intent of the National Regional Sediment Management Demonstration
Program within the U.S. Army Corps of Engineers is to improve the Corps’ management
of sediment throughout the entire watershed (from the riverheads, through the estuaries,
to the coasts). The program has been designed to accomplish this goal by minimizing
47

Regional Sediment Management Paper submitted to 14th Annual National Beach Preservation Technology Conference
the interruption of natural sediment transport processes or by enhancing these
processes to maximize environmental and economic benefits. Implementation of RSM,
both from the grass-roots level prior to implementation of the National Program, and
during the past year of the National Demonstration Program has resulted in partnerships
between the Corps, state, local, and other Federal offices, some of which are cost-
sharing. The result of State and USACE RSM initiatives will be improved methods for
managing sediment within our Nation’s waterways, with advances in conceptual,
analytical, and numerical models to support regional studies.
ACKNOWLEDGEMENTS
Funding for Ms. Rosati and Dr. Davis was provided by the “Regional-Scale Modeling Morphology Change and Sediment Transport” work unit of the Coastal Sedimentation and Dredging Program, U.S. Army Corps of Engineers (USACE). Permission was granted by Headquarters, USACE, to publish this information.
REFERENCES
Bowen, A.J., and Inman, D.L. (1966). “Budget of littoral sand in the vicinity of Point Arguello, California,” U.S. Army Coastal Engineering Research Center Technical Memorandum No. 19, 56 pp.
Caldwell, J.M. 1951. “By-passing Sand at South Lake Worth Inlet, Florida,” Proceedings, First Conference on Coastal Engineering, Long Beach, California, October 1950, ed. By J.W. Johnson, Council on Wave Research, The Engineering Foundation, 320-325.
Caldwell, J.M. 1966. “Coastal Processes and Beach Erosion,” Journal of the Society of Civil Engineers, Vol. 53, No. 2, April, 142-157.
Domurat, G., and Sloan, R. 2001. “Regional Sediment Management Demonstration Project,” internal proposal submitted to the National Regional Demonstration Program, January, 3 p.
Gravens, M.B., Rosati, J.D., and Wise, R.A. 1999. “Fire Island Inlet to Montauk Point Reformulation Study (FIMP): Historical and Existing Condition Coastal Processes Assessment,” prepared for the U.S. Army Engineer District, New York.
Grosskopf, W.G., Kraus, N.C., Militello, A. and Bocamazo, L.M., 2001. Implementation of a Regional Wave Measurement and Modeling System, South Shore of Long Island, New York, Proceedings of WAVES 2001, in preparation.
48

Regional Sediment Management Paper submitted to 14th Annual National Beach Preservation Technology Conference
Headland, J.R., Rasmussen, C., Bocamazo, L., Smith, W.G., and Herrman, M. 1999. “Tidal Inlet Stability at Fire Island, Moriches and Shinnecock Inlets, Long Island, New York, Proceedings of Coastal Sediments ’99, ASCE.
Hunter, M., and Dean, R.G. 1995. “Report of Coastal Engineering Research Board Task Force Response to Major General Genega's Charge,” Proceedings, 60th Coastal Engineering Research Board Meeting, Vicksburg, MS.
Komar, P.D., and Inman, D.L. 1970. “Longshore Sand Transport on Beaches,” Journal of Geophysical Research, Vol. 76, No. 3, 713-721.
Kraus, N.C. 1998. “R&D Needs for Regional Sediment Management,” Proceedings, 67th Coastal Engineering Research Board Meeting, Ft. Lauderdale, FL.
Kraus, N.C. 2000. “Reservoir Model of Ebb-Tidal Shoal Evolution and Sand Bypassing,” Journal of Waterway, Port, Coastal, and Ocean Engineering, 126(6), 305-313.
Lillycrop, L.S. and L.E. Parson. 2000. The Mobile District Regional Sediment Management Demonstration Program. Proceedings: Florida Shore and Beach Preservation Association Annual Meeting. 13-15 September, Captive Island, Florida.
Lillycrop, L.S., Wozencraft, J.M., Rosati, J.D., Gravens, M.B., and Scheffner, N.W. 2000. “The Northern Gulf of Mexico Regional Sediment Management Demonstration Program,” abstract, American Shore and Beach Preservation Association Conference, Hawaii.
Magoon, O.T., and Edge, W.L. 1998. “Sand Rights – The Fragile Coastal Balance,” Proceedings, 67th CERB Meeting, Ft. Lauderdale, FL.
MapTech, Inc. 2000. USGS topographic maps and NOAA nautical charts. MapTech, Inc. http://www.maptech.com/. 28 December 2000.
Militello, A. and Kraus, N.C. 2001. “Flood and Ebb Shoal Sediment Source Alternatives for the West of Shinnecock Interim Project, New York. Report 4, Site Investigation,” Coastal Inlets Research Program, U.S. Army Research and Development Center, Coastal and Hydraulics Laboratory, Vicksburg, Miss., in press.
McCormick, J., Chasten, M., and Lucas, S. 2001. ““Regional Sediment Management Demonstration Project,” internal proposal submitted to the National Regional Demonstration Program, January, 9 p.
Moffat & Nichol, Engineers. 1998. “Field Data Gathering, Project Performance Analysis and Design Alternative Solutions to Improve Sandfill Retention,” prepared for the U.S. Army Engineer District, New York.
O’Brien, M.P. 1936. “The Coast of California as a Beach Erosion Laboratory,” Shore and Beach, 4(3), July, 74-79.
Penfield, W.C. 1960. The Oldest Periodic Beach Nourishment Project,” Shore and Beach, 28(1), April, 9-15.
Quinn, M. 1977. “The History of the Beach Erosion Board, U.S. Army Corps of Engineers, Miscellaneous Report No. 77-9, USACE CERC, August, 181 p.
Rahoy, D., and Bocamazo, L.M. 2001. “Regional Sediment Management Demonstration Project,” internal proposals submitted to the National Regional Demonstration Program, January, 16 p.
49

Regional Sediment Management Paper submitted to 14th Annual National Beach Preservation Technology Conference
Rosati, J.D. 2000. “Application of a Regional Sediment Budget Analysis System for Florida’s East Coast,” Proceedings, 2000 National Conference on Beach Preservation Technology, Florida Shore and Beach Preservation Association, pp. 1-16.
Rosati, J.D., Gravens, M.B., and Smith, W.G. 1999. “Regional Sediment Budget for Fire Island to Montauk Point, New York, USA,” Proceedings of Coastal Sediments ’99, ASCE.
Ross, P, Thieme, S., and Selegan, J. 2001. “Regional Sediment Management Demonstration Project,” internal proposal submitted to the National Regional Demonstration Program, January, 7 p.
Shore Protection Manual. (1984) 4th ed., 2 Vols, Coastal Engineering Research Center, U.S. Government Printing Office, Washington, DC.
Smith, T.D., and Schmidt, D.V. 2001. “Regional Sediment Management Demonstration Project,” internal proposal submitted to the National Regional Demonstration Program, January, 11 p.
U.S. Census Bureau. 2000. Census 2000 TIGER/Line Files Technical Documentation-Preliminary. US Department of Commerce, Washington DC.
U.S. Water Resources Council. 1983. “Principles and Guidelines for Determining Economic Benefits.”
Wiegel, R.L., and Saville, Jr., T. 1996. “History of Coastal Engineering in the USA,” in History and Heritage of Coastal Engineering, N.C. Kraus, Editor, American Society of Civil Engineers, 513-600.
50