regional pattern of socio-economic characteristics...
TRANSCRIPT
CHAPTER II
REGIONAL PATTERN OF SOCIO-ECONOMIC CHARACTERISTICS OF RURAL
POPULATION
The incidence of child labour and its various dimensions are closely linked to region
specific demographic, educational and economic characteristics. These features of a region
· could, to a large extent, determine the variations in the magnitude of child labour. In this
chapter, various characteristics of demography, education and economy have been examined
for each of the following four regions of Haryana. This is done with the intention to get a
broad overview of the dynamics of the above-stated characteristics in each region and then
inter-link these with the phenomenon of child labour. These four regions of Haryana are:
Siwalik, Eastern Haryana Plains, Aravalli and Western Haryana Plains and the following
specific characteristics have been examined across these regions.
1. Characteristics of the population
1. Distribution of population,
n. Population composition according to social groups,
m. Child composition,
tv. Average number of children per household.
2. Educational characteristics
1. Literacy rate,
ii. Educational level of the adult population,
iii. Literacy level of the head ofthe sample household.
3. Economic characteristics
1. Land-ownership pattern,
11. Household type in terms of employment status,
111. Distribution of employed in various industrial sectors.
tv. Poverty level.
31
Regional Pattern of Socio-Economic Characteristics of Rural Population
These are the variables which are expected to explain the participation of children in
work and have been examined for further analysis in the subsequent chapters. Further, these
characteristics are studied across different social groups i.e. schedule caste, other backward
castes. (OBC) and others (Non-Schedule caste/Scheduled Tribes/OBC) in order to understand
the variations in the demographic, educational and economic features of the regions within
these social groups.
Demographic Characteristics
Distribution of Population: Haryana accounts for 2.51% of India's total rural population.
Half of the population in Haryana resides in the Eastern Haryana Plains while the Aravalli
and the Western Haryana Plains share the second position with about 20% each of the states
rural population (Table 2.1). Haryana's population consists of a higher proportion of males
(53 percent) than females (47 percent) and the sex ratio also is tipped towards male. In this
state for every 1000 males there are 891 females, much below the national average of 939
females per thousand males. Across the state as well the sex ratio is biased towards males
with Siwalik region in the north having the maximum gap (777 females per thousand males).
Similarly, the gap in the ratio of males to females is wider in the Eastern Haryana Plains than
the states' average. In the Western Haryana Plains and the Aravalli region the sex ratio is
biased towards males but the gap is Tiarrower than the states' average (Table 2.1 ).
Haryana is predominantly a patriarchal society and a male member heads 92% of the
total rural households while a female heads only 8% of the households. At the regional level,
the percentage of the households headed by males is higher than the states' average in the
Siwalik, the Eastern Haryana Plains and the Western Haryana Plains while in, the Aravalli,
female headed households are higher than the states' average but still the male member
dominates the decision ofthe households (Table 2.11). Across all three social groups as well,
the male member is in charge and is at the head of the household. Household's'where women
is at the head is slightly higher for the SC (13%) as compared to the 'other' (9%) and the
OBC (7%) social group (Table 2.11a to 2.11c).
Population composition according to social groups: In Haryana, the dominant social group
is the 'Other' followed by the OBC's and then the SC's. As seen in Table 2.2, ST forms an
extremely small percentage of total population (1 %) in Haryana. Hence, our analysis would
be concentrated on the dominant social groups which are the Schedule caste (23%), the Other
32
Regional Pattern of Socio-Economic Characteristics of Rural Population
Backward Caste (30%) and the 'Other' (46%). Within the regions too, a similar pattern in
social group is followed with the 'other' being a dominant social group followed by the other
backward caste and then the schedule caste. The Siwalik region is the only exception where
the OBC is higher by 4% than the 'other', while the SC social group is still in the minority.
The distribution of social groups across regions is presented in Table 2.3 and it can be seen
that of the total Schedule caste in Haryana, 50% reside in the Eastern Haryana Plains
. followed by the Western Haryana Plains and the Aravalli region. Similarly in case of the
OBC's, 56% reside in the Eastern Haryana Plains followed by the Aravalli and the Western
Haryana Plains respectively. The Eastern Haryana Plains also has more than half (55%) of
the total population of the 'other' social group, followed by the Western Haryana Plains and
the Aravalli region respectively.
Population in the age group 0 to 14: In rural Haryana, two-fifth of the population comprises
children (Table 2.5). At the regional level, the Eastern Haryana Plains and the Aravalli
account for a higher proportion of child population in their respective population while the
Siwalik and the Western Haryana Plains have a lower proportion of children to the states'
average. The Eastern Haryana Plains has the maximum concentration of child population and
this holds true for all the social groups. Further, among the children a higher proportion
(38%) is in the age group 10-14, followed by 33% in the 5-9 age groups with the least (30%)
in the age group 0-4. Composition of children according to gender follows a similar pattern
as the adult composition with more boys than girls at the state as well as at the regional level
(Table 2.6 to 2.8).
Studying the child composition according to social groups it is found that in the age
group 0-14 the OBC's have the highest proportion of children (43%), followed by the ·sc (38%) and the 'other' social group (35%). Additionally, in all the three social groups under
study, the 10-14 age groups comprise the maximum proportion of children. As far as th€1 s~x
ratio is concerned, interestingly it is balanced in the case of the SC social group while in the
OBC's and the 'other' social group there are more boys than girls. In fact, in the SC child
population a higher proportion of girls than boys are observed in the Eastern Haryana Plains,
the Aravalli and the Western Haryana Plains. In case of the OBC and the 'other' child
populdtion, the four regions follow the state level pattern of imbalance of the sex ratio (Table
2.8a to 2.8c).
33
Regional Pattern of Socio-Economic Characteristics of Rural Population
Average Number of Children per Household: Table 2.9 presents average number of children
in 0 - 14 age group by gender and social groups. In Haryana on an average there are three
children per household, with boys being more in number than girls. A similar pattern is
obtained at the regional level also. Disaggregated at the social group level it is found that the
schedule caste households have two children with an equal number of boys and girls. On the
other hand the OBC and the 'other' have one child per household and that child is generally a
boy. This pattern is similar at the state as well as the regional level for all the three social
groups. In the 10 - 14 age groups as well, on an average there are two children per household
with boys and girls being equal in number (Table 2.1 0). At the regional level, the Eastern
Haryana plains and the Aravalli region have two children per household while in the Siwalik
and the Western Haryana Plains there is only one child per household and that child is
generally boys.
The overall demographic characteristics for Haryana are as follows:
1. Eastern Haryana Plains accommodate more than half of the population of Haryana
resides in the.
2. The sex ratio is biased towards males in rural Haryana. This is true for all the four
regions in Haryana.
3. The dominant social group is the 'others' i.e. non ST/SC/OBC, followed by the
OBC and then the schedule caste. This composition of population is unifonn for all
the regions except the Aravalli where OBC is a dominant social group. Schedule
caste is a minority social group in all the four regions.
4. More than half of the child population of Haryana is concentrated in the Eastern
Haryana Plains.
5. The highest proportion of population is found in the age group of,l0-14 years in all
the social groups and at the state as well as the regional level.
6. Proportion uf boys is higher than the girls in 10-14 age group across all social
groups except amongst the schedule caste.
7. Average number of children (in the age group 0-14) per household in Haryana is 3,
with a higher number of boys than girls.
34
Regional Pattern of Socio-Economic Characteristics of Rural Population
Educational Characteristics
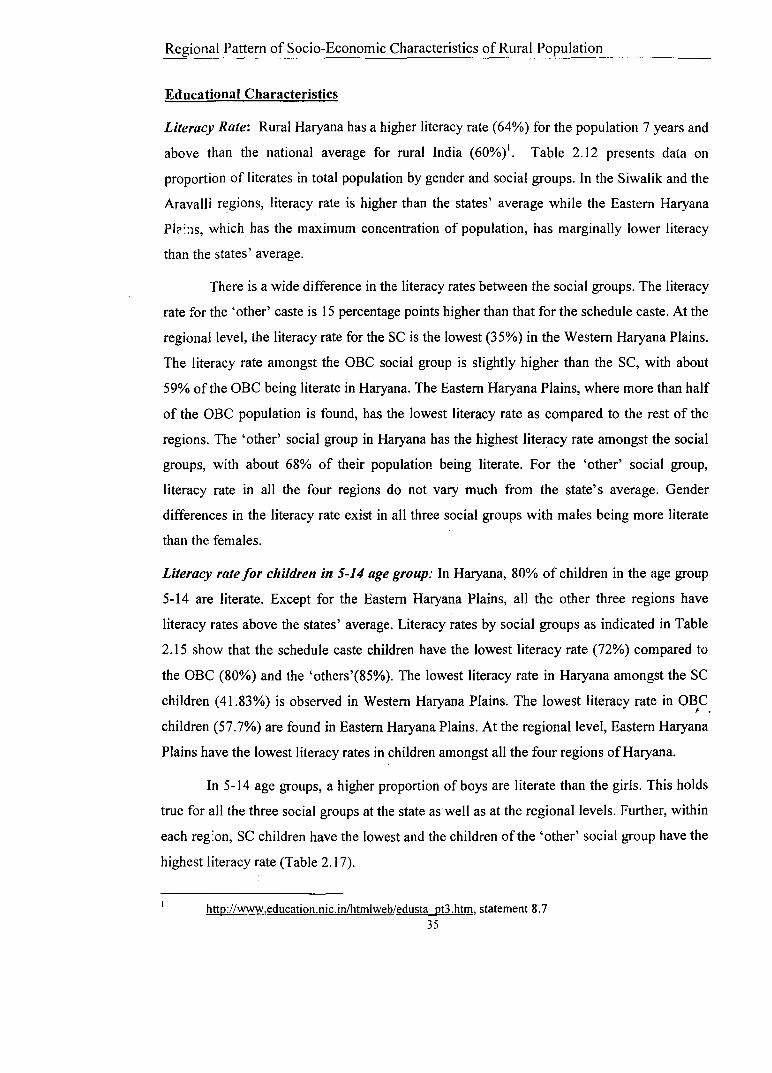
Literacy Rate: Rural Haryana has a higher literacy rate (64%) for the population 7 years and
above than the national average for rural India (60%) 1• Table 2.12 presents data on
proportion of literates in total population by gender and social groups. In the Siwalik and the
Aravalli regions, literacy rate is higher than the states' average while the Eastern Haryana
Pl?;:1s, which has the maximum concentration of population, has marginally lower literacy
than the states' average.
There is a wide difference in the literacy rates between the social groups. The literacy
rate for the 'other' caste is 15 percentage points higher than that for the schedule caste. At the
regional level, the literacy rate for the SC is the lowest (35%) in the Western Haryana Plains.
The literacy rate amongst the OBC social group is slightly higher than the SC, with about
59% of the OBC being literate in Haryana. The Eastern Haryana Plains, where more than half
of the OBC population is found, has the lowest literacy rate as compared to the rest of the
regions. The 'other' social group in Haryana has the highest literacy rate amongst the social
groups, with about 68% of their population being literate. For the 'other' social group,
literacy rate in all the four regions do not vary much from the state's average. Gender
differences in the literacy rate exist in all three social groups with males being more literate
than the females.
Literacy rate for children in 5-14 age group: In Haryana, 80% of children in the age group
5-14 are literate. Except for the Eastern Haryana Plains, all the other three regions have
literacy rates above the states' average. Literacy rates by social groups as indicated in Table
2.15 show that the schedule caste children have the lowest literacy rate (72%) compared to
the OBC (80%) and the 'others'(85%). The lowest literacy rate in Haryana amongst the SC
children (41.83%) is observed in Western Haryana Plains. The lowest literacy rate in OBC 1 •
children (57.7%) are found in Eastern Haryana Plains. At the regional level, Eastern Haryana
Plains have the lowest literacy rates in children amongst all the four regions ofHaryana.
In 5-14 age groups, a higher proportion of boys are literate than the girls. This holds
true for all the three social groups at the state as well as at the regional levels. Further, within
each reg:on, SC children have the lowest and the children of the 'other' social group have the
highest literacy rate (Table 2.17).
http://www.education.nic.in/htmlweb/edusta pt3.htm, statement 8. 7 35

Regional Pattern of Socio-Economic Characteristics of Rural Population
Educational Level among the Literates in Haryana: Level of education in Haryana is fairly
low as maximum proportion of literates (60%) has attained education up to primary level. On
the other hand, only 16% have attained middle level education, about 21% have attained
secondary and higher secondary level while only 2% have reached graduation. This pattern is
visible at the regional level too with the maximum proportion of literates having education
below primary level. Gender differences exist at each educational level, with males more
educated in proportion to the females.
Level of education by social groups in Table 2.18 (a) and (b) indicates that maximum
proportion of SC and OBC literates are educated only below primary, followed by primary
level. In fact, if we club together the educated below primary and primary levels, it accounts
for about 70% in the SC and the OBC social groups. Literates with a higher educational level
are very low in proportion in these two social groups. This situation is consistent at the
regional level too. On the other hand, the literates in the 'other' social group are concentrated
in a higher proportion in the middle and secondary educational level (Table 2.18 (c). Further,
at a higher level of education i.e. secondary and higher secondary and graduate, the
proportion is higher for the 'other' vis-a-vis SC and OBC social group. This holds true at
regional level too (Table 2.20).
Education of the Head of the Households: In Haryana and its regions, half of the members
(who are mostly males) heading the household are illiterate (Table 2.21). The literacy rate of
the heads of the households is the least (55%) for the SC social group. In fact, in Western
Haryana a staggering 70% of the heads of the SC households are illiterate (Table 2./.1 a).
With respect to the OBC households, 53% of the heads are literate. Siwalik and Aravalli
regions have literate heads of the households more than the states' average, while Eastern
Haryana Plains and Western Haryana Plains have lower than the states' average (Table 2.21
b). For the 'others' category of social group, 66% ofthe heads ofthe households are literate
in Haryana. At the regional level, 77% of the head of the other households are literate in
Aravalli regions while only 57% of the head of the households are literate in Western
Haryana Plains (Table 2.21 c). Thus, the comparative analysis of the social groups indicate
that a higher proportion of the heads of the households from the 'others' are educated as
compared to the OBC and the SC households.
36
Regional Pattern of Socio-Economic Characteristics of Rural Population
Hence, the following broad features of educational characteristics emerge for
Haryana and its regions:
1. 64 % of the population (7 years and above) is literate, and the literacy rates across the
regions do not vary much from the states' average.
2. Literacy rate is higher for males as compared to females.
3. Li~.:..acy rates are the highest for the non SC/ST/OBC social group while it is the lowest
for the SC social group. This scenario is similar at the state as well as at the regional
level.
4. 80% of the children in the age group 5-14 are literates with boys having a higher
literacy rate than girls.
5. Among the social groups, SC children have the lowest literacy rate while the children
of the 'other' social group have the highest literacy rate. This is true at state as well as
at the regional level.
6. 60% of the literates have attained education below primary and primary level, 16%
middle and 21% up to secondary and higher secondary level, with only 2% being
graduates'. These proportions are maintained at the regional level too with very less
variation from the states' average.
7. The male out-number in proportion the girls at every educational level.
8. Among the social groups, schedule caste literates have the lowest level of education.
70% of the SC literates have attained education only below primary and primary level.
As one goes up the ladder of educational level, the proportion of SC literate starts
declining with only 1% reaching the graduation level. Similar is the case with the OBC
literates.
9. In case of 'other', level of education is better than the SC and the OBC literates. In the
ladder of educational level, 50% of the 'other' group is educated below primary and
primary level (as against 70% for SC literates) and about 45% are educated up to
middle, secondary and higher secondary level (as against 28% for SC literates).
I 0. The literacy rate of the heads of the SC household is fairly low in Haryana, with three
in every four member being illiterate.
?.7
Regional Pattern of Socio-Economic Characteristics of Rural Population
Economic Characteristics
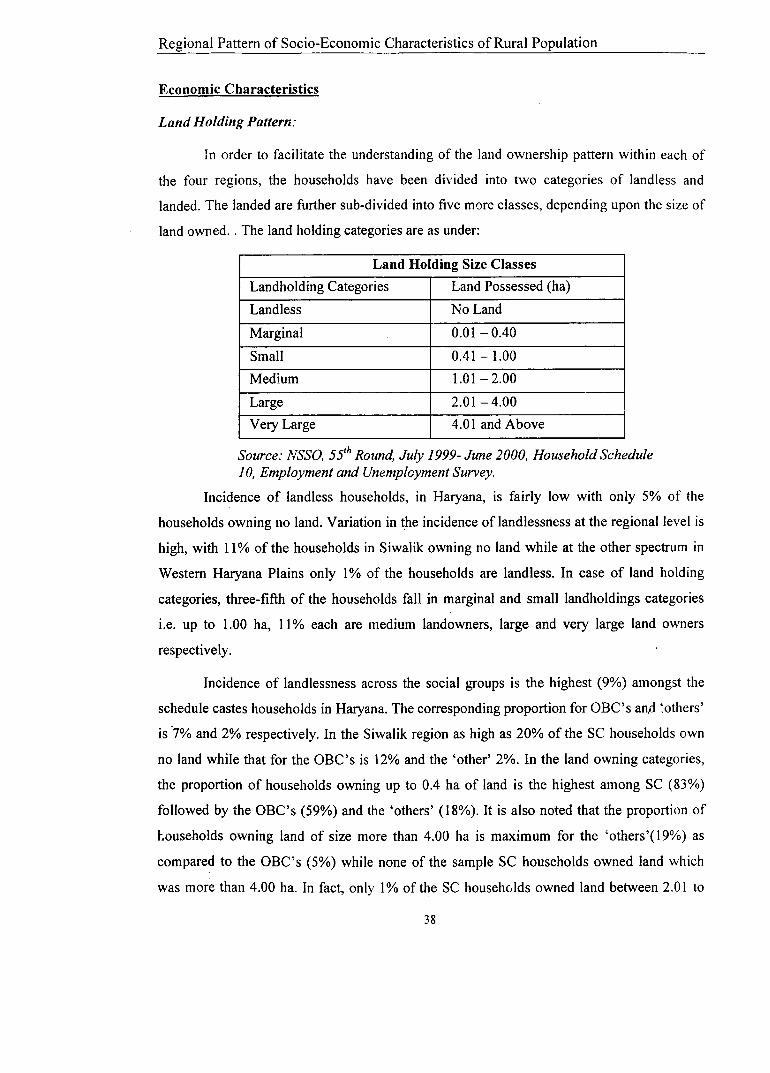
Land Holding Pattern:
In order to facilitate the understanding of the land ownership pattern within each of
the four regions, the households have been divided into two categories of landless and
landed. The landed are further sub-divided into five more classes, depending upon the size of
land owned .. The land holding categories are as under:
Land Holding Size Classes
Landholding Categories Land Possessed (ha)
Landless NoLand
Marginal 0.01-0.40
Small 0.41- 1.00
Medium 1.01-2.00
Large 2.01-4.00
Very Large 4.01 and Above
Source: NSSO, 551h Round, July 1999- June 2000, Household Schedule
10, Employment and Unemployment Survey.
Incidence of landless households, in Haryana, is fairly low with only 5% of the
households owning no land. Variation in the incidence of landlessness at the regional level is
high, with 11% of the households in Siwalik owning no land while at the other spectrum in
Western Haryana Plains only 1% of the households are landless. In case of land holding
categories, three-fifth of the households fall in marginal and small landholdings categories
i.e. up to 1.00 ha, 11% each are medium landowners, large and very large land owners
respectively.
Incidence of landlessness across the social groups is the highest (9%) amongst the
schedule castes households in Haryana. The corresponding proportion for OBC's an;i :others'
is ·7% and 2% respectively. In the Siwalik region as high as 20% of the SC households own
no land while that for the OBC's is 12% and the 'other' 2%. In the land owning categories,
the proportion of households owning up to 0.4 ha of land is the highest among SC (83%)
followed by the OBC's (59%) and the 'others' (18%). It is also noted that the proportion of
touseholds owning land of size more than 4.00 ha is maximum for the 'others'(19%) as
compared to the OBC's (5%) while none of the sample SC households owned land which
was more than 4.00 ha. In fact, only I% of the SC househulds owned land between 2.0 I to
38

Regional Pattern of Socia-Economic Characteristics of Rural Population
4.00 ha. The related proportion for the OBC's is 7% and for 'others' it is 20% respectively.
Across regions as well, majority (75% to 90%) of the schedule caste are marginal farmers. In
fact, if we club landless and marginal landowners, then 90% to 9 5% of schedule caste falls in
these two categories (Table 2.23a).
Furthermore, the households belonging to the non SC/ST/OBC ('others') social group
have almost an equitable distribution of landholdings as compared to the SC households. At
the s~:lte level among the 'others' households, 18% are marginal landowners, 22% are small
land owners, 19% are medium landholders, 20% are large landowners and 19% are very large
farmers. Amongst the regions as well this even distribution in land holdings is maintained in
the 'others' social group.
A comparison between the social groups in each of the land size categories reveals
that a higher proportion (42%) ofSC households own marginal landholdings as compared to
the OBC's (36%) and the 'others' (21%). On the other hand, in the larger land size
categories, the 'others' is the dominant group. For instance, among the medium land size
category, 75% of the households belong to the 'others' social group, 20% are from the
'OBC's' while only 4% belong to the SC social group (Table 2.24). Similarly among the
large and very large land size holdings, 82% of the households belong to the 'others' social
group, 16% are the OBC's and only 2% of the SC households own land which is four
hectares and above. Hence it can be observed that in the marginal landholding category, SC's
are the highest in proportion followed by the OBC's and then the 'others'. In the small,
medium, large and very large and holding categories the 'others' is the dominant group
followed by the OBC's and then SC's. This pattern of the distribution of land holding
category across the social groups holds true for all the four regions.
Household Types in terms of Employment Status:
The NSSO determines the 'household type' based on the type or the nature of work
which fetched the maximum income to the household during the reference period of365 days
preceding the date of survey. About 55% of the households in Haryana depend on agriculture
for their income. The proportion of households depending on self-employment is higher
(35%) compared to those depending on wage labour in agriculture (19%). Outside
agriculture, 16% of the households are self-employed in non-agricultural activities, 9% work
as labourers in public work and 22% work in other occupations in rural areas. In the regions
39
I .

Regional Pattern of Socio-Economic Characteristics of Rural Population
as well, maximum proportion of the households are self-employed in agriculture except in the
Aravalli region. Here, dependence on agriculture is the least as compared to the other regions
as 70% ofthe households depend on the income from the non-agricultural sector. Within the
non-agricultural sector, proportion of households depending on other occupations2 is higher
(42%) compared to self-employed (12%) and wage labour in public works (12%). Further
amongst the regions, households dependent on wages both from agriculture and non
agriculture sector, is the highest in the Siwalik region followed by Western Haryana Plains.
In the Eastern Haryana Plains, an equitable distribution of households is observed across the
household's types, with self-employment in agriculture the dominant income generating type
ofwork for 36% of the households (Table 2.26).
A comparison between the nature of work preformed by the households from the SC,
OBCs and the 'others' social group indicates that the proportion of households depending on
self employment is considerably higher among the 'others' households (70%) compared to
the OBCs (48%) and the SC (22%) households. On the other hand, proportion of 'rural
labour' households "who earn wages which place them at the bottom rung of the rural
poverty ladder, are characterized by casual forms of labour, precarious working conditions
and little or no social protection"3 is higher among the SC (57%) and the OBCs (33%) as
compared to the 'others' households (7%). A lower proportion of SC households as self
employed in agriculture and in the non-farm sector in Haryana as compared to others,
indicates the lack of access of SCs to ownership of land and capital. Hence, inadequate
access to the factors of production for self-employment activities leaves no option to SC
workers but to opt for manual wage labour predominantly in the agricultural sector.
Preponderance of the SC households depending on wage labour is observed across the state
except in the Aravalli and the Siwalik region (fig 2.i). In the Aravalli region, 50% of the SC
households fall in the other occupation (in non-farm activities) category while 31 ~ ~re rural
labour households and the rest depend on self-employment.
The category of"others" covers two types of earnings, namely (a) those households whose major source of income arises mostly from contractual employment with regular wages and salaries and (b) those who earn their living from non-labour assets without direct participation in gainful economic activity. The latter category of non-participatory earnings (as distinct from participatory earnings may include current returns from ownership of immovable assets (land or real estate) or from past financial investments, or receipts from public or private transfers (including pension and remittances)'' .http://www.cdedse.org/pdf/workll8.pdf #sear;;h='povertyestimates,lndia', pg3. http://www. i lo.org/publ ic/engl ish/bureau/inf/pr/ 1996/26.htm,
40

HARYANA Proportion of Wage Labour in Total Wage Labour
Across Social Groups
,--; WESTERN HARYANA \ _--._,,----.-, PLAINS 14.80
1_) \
Proportion to Total W age Labour
OTHERS sc
OBC
'-:l t~ _ _:;J <-/ \_ ' _) '
----- /
EASTERN HARYANA PLAINS
/ _) )
10.66
Kms30 0
Fig 2. i
(
)_ \ \ )
\ \
.-.-'> -r-
30 60 Kms
Plate 2

Regional Pattern of Socio-Economic Characteristics of Rural Population
In contrast to the SC households who are largely dependent on the wages from the
agricultural sector, the OBCs have a diversified occupational structure, with 60% of the
households deriving iheir main income from the non-farm sector. Within this sector, the
proportion of households dependent on self-employment is higher (26%) than those
dependent on wage labour (13%). At the regional level, all the regions conform to the states'
pattern except in the Siwalik region where a large proportion (68%) of the households is
de;:...,11dent on agricultural sector and 34% in self-employed and wage labour occupations,
respectively. In the non-farm sector, households dependent on wage labour account for a
marginally higher proportion (14%) than the self-employed (12%).
Hence, it is evident from the data that among the self-employed households, the
'others' households are the highest in proportion while the SC households are the least in
proportion. Among the households who are self employed in the non- farm sector, OBC
households are the highest in proportion followed by the 'others' social group. Here again SC
households are the least in proportion. In the labour category (both agricultural and non-farm)
the proportion of SC households are the highest. This scenario amongst the social groups at
the regional level is similar to the state level (Table 2.27).
Industrial Distribution of Employed
As far as the participation of employed in the industrial categories in rural Haryana is
concerned, the predominant sector is the primary sector. Table 2.31 shows that ab:mt 63% of
the workers are engaged in the primary, 19% in the secondary, and 18% in the tertiary.
Within the secondary, manufacturing employs a slightly higher percentage of workers (9.6%)
as compared to construction (8.3%). In the tertiary sector, the 'other industry' which includes
those employed in real estate, computer and related activities, education, service activities
like sewage disposal etc is the important industry employing 8% of the workers. Industrial
distribution of the employed at the regional level follows a similar pattern as at the state. !Ia ·
all the four regions, agriculture is the dominant sector followed by secondary (construction
and manufacturing) and tertiary (the 'other' industry
Comparing the industrial distribution of workers between the three social groups it is
noted that for the schedule caste workers, primary sector is the dominant sector which
employs 57% of the workers, 28% in the secondary and 15% in the tertiary. Within the
secondary sectorj construction is the important industry employing 18% of the SCs workers.
41

Regional Pattern of Socio-Economic Characteristics of Rural Population
Similarly in all the regions construction is an important industry providing employment to SC
workers. In the Siwalik region, manufacturing is the dominant industry employing slightly
more (39%) of the SC's workers than agriculture (37%). After manufacturing and agriculture,
the next important industry is construction which employs 24% of the SCs workers in this
region. In the Aravalli region, maximum proportion of SCs workers are employed m
construction (38%) followed by agriculture (23%) and then 'other industry' (18%).
In case of the OBC workers (Table 2.31 b), 51% are engaged in the primary sector,
followed by the secondary (manufacturing) sector with 30% of the workers while the tertiary
sector (primarily wholesale & retail trade) employs 19% of the workers. Hence, at the state
level the OBC workers are primarily engaged in agriculture followed by manufacturing and
then construction. Wholesale and retail trade is another important industry in the tertiary
sector that employs 8% of the OBC workers. The pattern of the industrial distribution that is
observed at the state level is observed for all the four regions as well.
As far as the industrial distribution of the workers from the 'others' social group is
concerned, 74% of the workers are engaged in the primary sector, followed by 20% in the
tertiary and the rest in the secondary (6%). Within the tertiary sector it is the computer related
activities that is an important industry for the workers from the 'others' social group in
contrast to the SC workers who are primarily engaged in construction. The secondary sector
(manufacturing) employs only 5% of the workers from this social group. The pattern in the
industrial distribution of the employed at the regional level is similar to the state level for the
'other' social group.
Further, among the social groups a higher proportion of 'others' are employed in the
agriculture than the SC and the OBC workers. In the manufacturing industry the OBC forms
the bulk of workers followed by the SC. On the other hand in construction, schedule caste
workers are higher in proportion than the OBC as well as the 'others'. This holds true at the
regional level as well (Table 2.32).
Incidence of Poverty:
Haryana has one of the lowest proportions of poor in India4, with 9% of the
population falling below the poverty line. Proportion of population below the poverty line in
http://www.wws.princeton.edu/-rpds/downloads/deaton dreze poverty india.pdffl search='povertyestimates,lndia', pg 1731.
42

"
HARYANA Proportion of Poor in Total Population
Across Social Groups
EASTERN HARYANA PLAINS
/ / ) )
\ ------.. ,r---- ...... ,_J <....
13.44 '!_ \ \
OTHERS
"-- - \._ , f\_ ,..; ' 1:;
Proportion to Total Poor
sc
~ l,
(
,r·
)
\ \
.~ _ _...!> .r-
,..,/-">-- ' \ ,-1'\_ ' ' '-'\. --....-
' i ' 7 >
(
\ !'
Kms 30 0 30 60 Kms
OBC
Fig 2. ii Plate 3

Regional Pattern of Socio-Economic Characteristics of Rural Population
Haryana and its region is presented in Table 2.32. Variation in the incidence of poverty
across regions from the state's average is fairly low. The lowest poverty incidence is found in
the Eastern Haryana Plains (7%) while the highest is found in the Western Haryana Plains
(12% ). The regional distribution of the poor indicates that the largest proportion ( 40%) is
found in the Eastern Haryana Plains, which incidentally is also the most populous of all the
four regions. Western Haryana Plains has 26% of the state's poor though it accounts for 20%
of :he states rural population. The lowest proportion of poor out of total poor in Haryana is
found in the Siwalik region (14%).
A comparative analysis of the social groups indicates that the proportion of poor is
the highest (26%) in the SC group, followed by the OBC (6%) and 2% for the 'others'. The
highest incidence of poverty among the SC is found in the Siwalik region, where 3 7% of the
SC population is poor. The least poverty incidence is found in the Eastern Haryana Plains
where 20% of the SCs are poor. Further, among the social groups, 66% of the poor in
Haryana are schedule caste followed by the OBC and the 'others'. It is evident from the
figure 2.ii that within the regions too, majority of the poor belong to the SC social group
followed by the OBCs. In fact, in the Western Haryana Plains, 81% ofthe poor are from the
SC social group. Thus, the overall poverty levels of SC population are relatively high with
not much variation from the state average. On the other hand, the proportion of poor among
the OBC social group varies considerably from the state average. For instance, in the Aravalli
region 11% of the OBC population is poor while in the Western Haryana Plains, 3% of•
OBC are poor.
To recapitulate, following are the broad economic characteristics that emerge out of
the analysis:
1. In Haryana, 51% of the landowning households are marginal farmers who are as good
as being landless. Landless and households with marginal landholdings toge~h~r
account for 55% ofthe total households. Preponderance of households with marginal
landholding is witnessed at the regional level as well.
2. Among the social groups, within the landless households, SC households form the
largest proportion while the 'others' are the least in proportion. Similarly, among the
households with marginal landholdings, SC constitutes 40% followed by the OBC
and 'o.thers'. But as the land-size category starts increasing, the proportion of
43

Regional Pattern of Socio-Economic Characteristics of Rural Population
households from the 'others' social group starts increasing while that of SC starts
declining. This pattern is similar for all the four regions.
3. The dominant household type in Haryana is self-employed in agriculture followed by
households employed in other occupations. But if we club self-employed in
agriculture and agricultural labourers, about 55% of the households are dependent on
agriculture for their livelihood.
4. Among the households self-employed in agriculture, the dominant social group is the
'others' followed by the OBC and the SC. Among self-employed in non-agriculture
households, the OBC constitute the largest in proportion while the SC are the least.
On the other hand, in the rural labour households, SC constitutes the bulk followed
by the OBC, while 'others' constitute only 10% of the labour households.
5. Primary sector is the dominant sector providing employment to more than 60% of the
workers in rural Haryana .The next important sector is the secondary followed by the
tertiary sector. Within the secondary it is the construction industry that is dominant
especially for the workers from the SC social group. The workers from the 'other'
social group are primarily employed in the computer related activities in the tertiary
sector. This holds true at the regional level as well.
6. 9% of the total population in Haryana is below poverty line. Variation m the
incidence of poverty at the regional level from the state average is very low.
7. Among the social groups, the highest incidence of poverty is found in the schedule
caste followed by the OBC and the least in the 'others' social group.
Conclusion
In this chapter, the characteristics of population, educational and economy of rural ! .
Haryana across social groups have been discussed. Summing up, the analysis of the key
characteristics of population (sex ratio, composition of social groups, child composition by
age-group, and average number of children) has resulted in the following observations.
Firstly, the proportion of children in total population is high i.e. on an average, households in
rural Haryana have three children. Secondly, within the child population, the proportion of
children is the highest in the I 0-14 age group. Thirdly, the sex ratio in rural Haryana is biased
towards male in the adult as well as in the child (0-14 age group) population. This is true
44

Regional Pattern of Socio-Economic Characteristics of Rural Population
across the social groups as well, except in the case of the SC social group. Amongst the SC
social group, the proportion of girls is higher than the boys in the age group 10-14. With
respect to education, it is observed that the literacy rate for rural Haryana is higher than the
average for rural India. Regarding the literacy rate for children, 80% are literate with large
variations in the literacy rate ( 15 percentage point) between the social groups. The gap in
male-female literacy is also wide in rural Haryana and is witnessed among the children as
well as i11 che adults. Furthermore, the level of education attained by the literates is fairly low
in this state, with three-fourth educated only up to primary level.
The key characteristics regarding the population distribution, sex ratio, education,
employment and economy for the regions in Haryana are as follows:
Siwalik Region
1. This region has the lowest proportion of population in Haryana.
2. The dominant social group is OBC followed by the 'others' and then the SC's.
3. 34% of the children in Siwalik are between the age group 10-14. Within the social
groups, the OBC have the highest proportion of children between the age group 1 0-
14 followed by the 'others' and the SCs.
4. Siwalik has the highest literacy rate amongst all the regions in Haryana. Further,
literacy rate is the highest for the 'others', followed by the OBCs and the SCs.
5. Likewise, maximum proportion of the head of the households is literate in the
Siwalik compared to the rest of the regions.
6. Proportion of landless is the highest in this region when compared to other regions.
Further, landlessness is the highest in the SC households in this region compared to
the other regions.
7. Dominant iandholding category in Siwalik is marginal landholding. Three fifth of the
households among the 'others' social group primarily own landholdings up to 2 ha
while one-fifth of the households own land above 4.0 ha. This region also has the
least proportion of households among 'others' owning Jess than 0.40 ha of land as
comprred to other regions.
45
Regional Pattern of Socio-Economic Characteristics of Rural Population
8. Dominant household type is self-employed in agriculture followed by agricultural
labourers, with a higher proportion of SC households deriving their main income
working as agricultural labourers compared to the OBC households and the 'others'.
9. Dominant industry providing employment is agriculture followed by manufacturing
and then construction. A higher percentage of workers from the OBC and the 'others'
social groups are employed in agriculture compared to the SC. On the other hand, a
higher proportion of SC workers are employed in manufacturing and construction as
compared to the OBCs and 'others'.
10. Incidence of poverty in Siwalik is higher to the state average. Further, proportion of
poor among the SC social group is the highest in this region as compared to rest of
Haryana.
Eastern Haryana Plains
1. This is the most populous region ofHaryana with 50% of the state's population found
in this region. 'Others' is the dominant social groups foHowed by the OBC and then
the SCs.
2. Proportion of SC children in the age group 10-14 in total SC children is the highest in
this region as compared to other regions ofHaryana.
3. This region has the second lowest literacy level in Haryana. Further, in this region
literacy level for children is the lowest in Haryana.
4. Similarly, literacy of the head of the household in this region is the second lowest in
Haryana.
5. Predominantly households own marginal landholdings in this region followed by
small landholdings. The SC and the OBC households in this regi9n. primarily own
marginal landholdings. An equitable distribution of land holding is observed among
the 'others', with one-fifth of the households owning large areas of land (2.0 1 to 4.00
ha).
6. Dominant form of household type is self-employed in agriculture followed by
agricultural labourers and other occupation. This region has the second highest
proportion of SC households as agricultural labourers as compared to other regions.
46

Regional Pattern of Socio-Economic Characteristics of Rural Population
7. Agricultural sector is the dominant sector providing employment to the workers in
this region followed by manufacturing and construction like the state's pattern of
industrial distribution of workers.
8. It has the least incidence of poverty in Haryana. Likewise incidence of poverty in the
SC social group is also the least in this region when compared to other regions.
Aravalli Region
I. It is the third most populated region ofHaryana. Within this region the OBC and the
'others' are the dominant social group while the SCs are the minority social group in
this region as well.
2. Literacy rate for the total population and for children of this region is above the state
average. Further, this region has the maximum proportion of the head of the
households who are literate as compared to the rest of Haryana.
3. In the land size categories, maximum proportion of the households own marginal
landholding followed by small landholdings. This region has the highest proportion
of the SC households owning marginal landholdings compared to other regions. This
region has the maximum OBC proportion of households owning small landholdings
compared to other regions.
4. Predominant household type in this region is that of other household type (non
manual and non-self employed). At the social group level, proportion of the SC, the
OBC and the 'others' working in other household type is the highest when compared
with the rest of the regions.
5. Agriculture is the predominant sector of the regional economy providing employment
followed by construction and computer related activities. ' .
6. Incidence of poverty is at a slightly higher level as compared to the state level, with
one-fourth of the SC population below the poverty line compared to one-tenth for the
OBC and one per cent for the 'others'.
47
Regional Pattern of Socio-Economic Characteristics of Rural Population
Western Haryana Plains
1. This region is the second most populous region in the state. The 'Others' social group
is the dominant group of this region.
2. Within the child population, 40% are between the age group I 0-14, the highest when
compared to other regions. Children in the age group 10-14 from the 'others' social
group is the highest in this region compared to rest of Haryana.
3. This region has the lowest literacy rates for both adults and children as compared to
the rest of Haryana. Literacy rate for the head of the household is also the lowest in
this region.
4. Households in this region predominantly own marginal landholding followed by
large landholding.
5. Self employed in agriculture and agricultural labour is the dominant household type
in this region.
6. Agricultural sector employs 74% of the regions workers, the highest compared to
other regions. Hence agriculture is the dominant industry of the regional economy.
7. Western Haryana Plains has one of the highest incidences of poverty in Haryana, with
proportion of poor among the SC population being the highest when compared to
Eastern Haryana Plains and the Aravalli region.
48