regional consumer expenditure studies using national food survey data
TRANSCRIPT
I97
REGIONAL CONSUMER EXPENDITURE STUDIES USING NATIONAL FOOD SURVEY DATA
John M. Slater Uni versify of Manchester
Attention has been drawn in N.F.S. reports to the considerable regional variation in the consumption of individual foods. In this paper, the relevant theory and methodology of food expenditure analysis is briefly surveyed and an atrempt is made ro point out some of the gaps in the current state of knowledge. Results of preliminary analysis of regional variations in expenditure on apples are reported and methodological and statistical problems discussed. Finally, suggestions are made as to how some of the problems may be over- come and the lines along which future studies may proceed.
Introduction (a) The problem and its relevance The annual reports of the National Food Survey (N.F.S.) have drawn attention to the considerable regional variation in the consumption of individual food commodities. ( ' ) t An understanding of the underlying causes of this variation would be of considerable interest from both practical and theoretical standpoints. For instance. if it can be shown that differences in the level of consumption, or expenditure, are due to factors, such as income or family size, which are clearly outside the sphere of influence of the seller, then attempts to promote consumption of a commodity in a region where consumption is low due to low income may be wasteful. In addition, the results of analysis may provide producers with useful information on the demand for different qualities of a commodity.
From a theoretical viewpoint, an understanding of the underlying causes of variation would make a valuable contribution to the methodology of the analysis of consumer expenditure and assist in the building up of the store of knowledge on stable economic relationships. I t is widely held that such a stable relationship exists between the expenditure on a commodity and income. If this relationship can be isolated, and other relationships identified which take account of the impact of other economic and non-economic variables, it will be of con- siderable value in predicting consumption not only in countries with income levels similar to that in the U.K. but also in developing economies.
The author would like to thank his colleagues at the University of Manchater for their helpful comments, especially Professor Thomas, who provided the initial stimulus. and Mr. S. A. Moore. who carried out the enormous task of writing the necessary programs. Without the complete co-o ration of the National F d Survey and assistance from Profusor J. H. Kirk, H.M.flfA. of Wye College and A.M.D.E.C. in financing the early stages. the study would not have been possible. Finally. a special acknowledgement must be made to the work of a research student, Mr. J. M. Currie. whose M.A. Dissertation on the inter-regional variations in demand for apples(') was supervised by the author. His extensive review of the literature, and his own ideas. constitute a major contribution to this paper.
t Numbers in brackets relate to references at the end of the paper.
JOHN M. SLATER I98
(b) The data The data used in consumer expenditure studies can be broadly be classed into
time series, where the variables relating to a particular economic unit are measured at different points in time, and cross-sectional, where the variables are measured across economic units at a single point in time. The former have the disadvantage that multicollinearity between variables is frequently a problem, and the number of observations is likely to be small, but are most useful when interest is centred on variables, such as price, which change over time. Cross-sectional data are more appropriate in studying the effects of variables which change across house- holds, such as family size, social class and including income. Multicollinearity is not usually a major problem and there is less restriction on the size of cross- sectional samples.
Many previous studies have suffered from poor quality data, small sample size or the computational difficulties of handling large quantities of data. In this study, records of food expenditure collected by the N.F.S. in 1965 were used. They were obtained from approximately 8,000 families selected in a three stage stratified random sample. Records are collected over a 12 month period divided into 34 ten-day cycles with food expenditure being recorded for seven of the ten days and a sample of households in each region being interviewed during each
The reliability of the estimates obtained from the analysis depends very much on the quality of the data, whether the sample is representative and whether the information recorded is accurate. Apart from a slight over-representation of Scotland, the sample for 1965 approximates closely the Registrar General's estimate of the true population distribution and there Seems to be no reason to suppose that the sample is biased in respect of types of household although one anomaly, viz. very few farmers in the sample for Wales, has come to light.
Inaccuracies in the information collected may be more serious although, in such a large sample, a good deal of the unsystematic error is likely to cancel out. Despite assurances that the information recorded will remain confidential, i t is quite possible that family income figures will be underestimated and this must be borne in mind when analysing the results. An additional problem is that the data collected relate to food purchases rather than food consumption and, as expenditure is recorded for only a seven-day period, information relating to commodities subject to "impulse" purchase may be less reliable.
(c) The Manchesrer University N.F.S. Project Before analysis could be started, the transfer of the 1965 N.F.S. data from
paper tape in Elliot Autocode to magnetic tape in Atlas Autocode had to be undertaken and this proved a much greater task than had been anticipated.
However, an initial study on apples(') was completed earlier this year and refinement of the techniques of analysis of N.F.S. data is continuing. A series of studies investigating a wider range of foodstuffs is already underway.t
cycle.
The theory and methodology of Budget analysis Economic theories of consumer behaviour are well documented and, for present purposes, it is sufficient to point out that both the indifference curve and revealed preference approaches arrive at the same conclusion: The quantity demanded of a
For further details of the sampling technique KC reference (9). Appendix F. t I t had been hoped to include results of the study of a number of ditTerent commodities.
Unfortunately computational difficulties have delayed this work as well 89 restricting the time which it has been possible fo spend on analysing the results of the study on apples.
REGIONAL CONSUMER EXPENDITURE STUDIES USING (N.F.S.) DATA 199
commodity is a function of all prices and income, subject to the tastes and preferences of the consumer. Similar conclusions can be derived with respect to household behaviour although, as Samuelson(ls* P . l 1 6 ) stresses, the assumptions of a consistent and transitive set of preferences become even more tenuous. In addition, the aggregation of household demand functions is based on the assumption that the preferences of individual households are independent.
The fact that current economic theory fails to explain how preferences arise has led researchers to look for information from other disciplines. Currie,(s. PP*lL1al for instance, summarises some of the important aspects of consumer behaviour studied by psychologists. A consumer purchases goods to satisfy biogenic needs, such as hunger, sleep and sex, which arise out of a tension caused by disequilibrium in the physiological system of the body, and psychogenic needs, such as the need for affiliation, the need for achievement and the need for power, which arise out of a person's association with other people. When, where and how a person responds to these needs is determined by a cue, for instance seeing the good, and if the response is rewarded then it is likely to be repeated when the need and cue coincide. Thus, when a person experiences hunger (biogenic need), he sees food (cue) purchases and consumes it (response). The food will generally alleviate the hunger (reward) and a behaviour pattern is established. Similarly, the belief that a particular food is, or is not, good for one's health exemplifies a psychogenic need. Clearly, a household's consumption will depend on its pattern of biogenic and psychogenic needs and it may be that explanations for the establishment of these patterns must be sought from the work of physio- logists, sociologists and other scientists. This suggests that measurement will be extremely difficult but already a good deal of information is available. For instance, i t is possible to see that a relationship exists between the biogenic and psychogenic needs of the family and such variables as family size, family composition, social class and nutrient code.
(a) The Variables (i) The dependent iuriable: I t was Engel who observed that, as income rises,
the proportion of income spent on food declines and, in deference to his early work, study of the relationship between income and expenditure on a commodity, using budget data, is referred to as Engel curve analysis. In such studies, however, either expenditure or quantity can be used as the dependent variable. To the extent that consumers pay the same unit price for a particular commodity, which is an assumption usually made when using budget data, equivalht estimates will be obtained for the elasticities of income with respect to expenditure and quantity. Where households pay varying unit prices, which is assumed to represent the purchase of different qualities,. the elasticities will not be equivalent and the difference between the two is defined as the quality elasticity. The relationship between the elasticities can easily be shown. Given the Expenditure ( E ) = Quantity ( Q ) k Price ( P ) and that Y is income. I t follows that:
dE Y - d Q Y d P . Y n'E-n.Q+n P or that the income elasticity of expenditure is equal to the sum of the income elasticities with respect to quantity and quality. Thus, if households with higher incomes purchase the same quantity of a commodity but pay more (for a better
~~ ~~ ~~
Prais and Houthakkcr suggest four reasons for price variations in budget data. ( I ) regional price differences (2) differences due to price discrimination (3) differences due to additional services and (4) seasonal price differences. The questions raised by ( I ) and (4) will be discussed later. (2) is unlikely to be of importance in the present analysis and ( 3 ) can be thought of as a quality difference.
200 JOHN M. SLATER
quality), it would be expected that the quality elasticity will be positive. This has been borne out by Gorcux(O1 p . 0 who found that in high income countries, while quantity elasticities for cereal products are often negative, expenditure elasticities tend to be positive. Prais and Houthakker, ( ls . P-llS) when analysing British budget data, also found that the quality elasticity for individual foodstuffs was usually positive but was not very important except in cases where many different qualities were available.
(ii) The income variable: In deciding what form the income variable should take the real issue lies in determining the relevant measure of consumer purchasing power. To the extent that purchasing power, during a short survey period, comprises not only earned income but alsoconsumercredit, current income may not be a realistic measure, especially where durable goods are concerned. Friedman(’) is the leading exponent of the view that expenditure patterns are determined by permanent income and it is argued that total expenditure, rather than current income, reflects this better. Also, the distribution of expenditure over commodities depends upon total expenditure. However, Prais and Houthakker(”. Pae1) point out that if families purchase consumer durables during the survey period their total expenditure will tend to put them in an unjustifiably high income group although this may be offset by cut backs in expenditure on other goods. p * l r l ) also shows that this dependence between total expenditure and expenditure on a commodity will result in biased estimates of the income coefficient if the ordinary least squares method is used. Prais(ll. Pall7’ has calculated that this bias is not likely to be very important and Liviatan(O* p.rao) suggests a method for eliminating the bias in large samples by using current income as an instrumental variable. He shows that, ifexpenditure on the commodity is regressed on current income and if total expenditure is regmsed on current income, the ratio of the two coefficients obtained gives an unbiased estimate of the coefficient of expenditure on the commodity with respect to total expenditure. This does, however, depend on the assumption of current income being exogenously determined in the above relationships.
(iii) Subsrirures: Economic theory suggests a relationship between expenditure on a commodity and the price of canpeting commodities. However, when using budget data it is assumed that any change in the unit price of substitutes reflects the purchase of a different quality. Nevertheless, it is evident that house- holds in the same income group, and with similar household characteristics. have different expenditures on substitute commodities and when expenditure on a substitute is high, expenditure on the commodity tends to be lower.
Allen and B o w l ~ y ( ~ * P e w ) thought that it might be possible to obtain estimates of cross elasticities by including expenditure on substitutes as a separate variable but theoretical research shows that the coefficient with respect to expenditure on a substitute does not indicate the reaction which would ensue if there was a change in relative prices. Clearly, the fact that a household has a higher preference for a substitute affects the expenditure on a commodity but Prais(lol P - g 8 ) found, when studying the consumption of butter, that although the inclusion of expenditure on margarine as a separate variable increased the amount of variation explained it led to an underestimate of the income coefficient.
(iv) Household Size and Composirion: A priori, expenditure on a commodity is influenced by household size and the exclusion of family size from the relation- ship will constitute a specification bias. Tobin,(*a. P . l l a ) in analysing the demand for food in the U.S.A., introduced the number of persons in the household as a separate variable but it would seem that the correlation between income and household size could cause problems in estimation. An alternative approach
REGIONAL CONSUMER EXPENDITURE STUDIES USING (N.F.S.) DATA 20 I
is to divide through by household size. This transformation implies no economies of scale in household consumption (homogeneity hypothesis) but Prais,(lo. p.s7) in an analysis of Dutch budget data, concluded that this is a satisfactory way of taking family size into account.
However, it is clear from the evidence of the National Food Survey' that the actual composition of the houszhold is also an important determinant of expenditure. There appear to be two basic approaches to this particular problem. The first is to group households according to their composition and either estimate a relationship for each group or use dummy variables to signify the separate groups in a regression using the pooled data. Such methods are likely to yield useful information but in either case difficulties will arise when the number of classes is not small or it is necessary to group the data by other characteristics as well. The second approach is to try and quantify family composition and some of the alternative methods using this approach are discussed by Prais and Houthakkcr.(l*. c*.s) The basic problem is finding a scale with which to weight members of the household so as to reflect their importance in the consumption cf the commodity being considered. It is evident that one scale will not suffice for all commodities and, although many attempts have been made to construct suitable scales, no completely satisfactory methods have so far come to light.
(v) Orher Variables: Resort to related disciplines suggests that other, non- economic, variables may be important determinants of household expenditure. This appears to be supported by N.F.S. reports P, 7d1r lS) which reveal significant differences in the pattern of expenditure when households are grouped by such variables as social class or nutrient code. The inclusion of similar variables in budget analysis depends to a great extent on the household characteristics recorded and, as mentioned previously, analysis becomes extremely complicated when several non quantifiable variables are included. Stuvel and James(16) used a covariance analysis approach to study the effects of income, family size, social class and occupation on expenditure of Dutch households but this does not get over the problem of relatively few observations occurring in certain cells. The N.F.S. records a number of these household characteristics and their inclusion in the model will be discussed later.
(b) Thefimctional fornr Economic theory provides little information on the form of the functional
relationship between expenditure and income and, although this topic has bCpn the subject of a considerable volume of research, no clear cut solution has emerged. Goreux(6. P ~ ) found that when the same data were fitted to five different types of function the income elasticities were similar at the mean but showed large discrepancies at the extremes. Several researchers(10.7) suggest that the types of functiont should be assessed on their intuitive appeal and whether certain technical criteria are fulfilled.
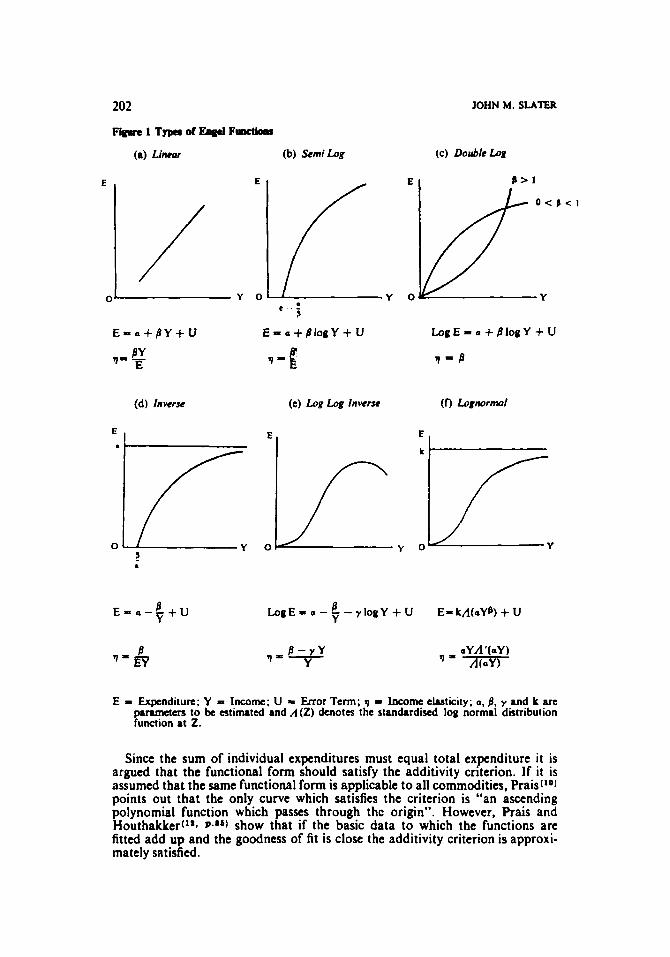
I t would be expected that for most commodities there is some level of income below which the good is not purchased and at some point a level of satiety is reached. Only the functions (c, d, e and f) in Fig. 1 satisfy the satiety criterion but this may not be too crucial unless the range of income is likely to include the satiety level. Where expenditure is the dependent variable rather than quantity, there are probably few commodities where this is likely to be the case.
The N.F.S.(*. Tdk '1) reports differences in per capita expenditure on most foods by
+ Some typical functional forms used in Engel curve analysis are shown in Figure I, households with different family compositions.
202
Figwe 1 Typa dEagd Fmctbm
E
(a) Linear
E
/ c Y O
(d) lnwrse
E
i 2 0
P ”E
(c) Log Log Inverse
JOHN M. S L A M
(c) Doub1eL.q
P > 1
(f) Lognormal
I E L I
I Y
E - a - - + U B LogE = a - 6 - y l o p Y + U E=kn(aYB) + U Y
E = Expenditure; Y = Income; U = Error Term; 7 = Income elasticity; a, 8, y and k arc parameters to be estimated and A ( Z ) denotes the standardid log normal distribution function at 2.
Since the sum of individual expenditures must equal total expenditure it is argued that the functional form should satisfy the additivity criterion. If it is assumed that the same functional form is applicable to all commodities, Prais(lo) points out that the only curve which satisfies the criterion is “an ascending polynomial function which passes through thc origin”. However, Prais and Houthalcker(l** P W show that if the basic data to which the functions are fitted add up and the goodness of fit is close the additivity criterion is approxi- mately satisfied.
REGIONAL CONSUMER EXPENDITURE STUDIES USING (N.F.S.) DATA 203
A further condition is that estimation of the parameters of the function must not be too difficult and, for this reason, it has been necessary to exclude, for the present, the lognormal curve (Fig. If). This function, which is favoured by Aitchison and Brown,('# ch.lz) has considerable intuitive appeal but unfortu- nately the iterative procedure of estimation is extremely time consuming where several variables and a large number of observations are involved.
Finally, the type of function should be assessed for goodness of fit and the significance of the regression coefficients. The test for goodness of fit most commonly applied is to determine the coefficient of determination (J?*), adjusted for degrees of freedom, which measures the proportion of the variation in the dependent variable explained by the independent variables in the formulated model. Strictly speaking the Rz of double log functions and functions where the dependent variable is in natural form are not directly comparable as the pro- portion of the variance of log E explained is being compared with the proportion of the variance of E explained. However Prais and Houthakker(l*# P-'*) found that adjustement of R' to take this into account had little effect when broad groups of commodities were being studied with no low values of E. Of the functions most commonly used in budget analysis, Allen and Bowley(*) found that the linear form (Fig. la) gave a good approximation over a narrow range of income. Subsequent research has shown it to have serious shortcomings at extreme values of income. The inverse or simple hyperbola (Fig. Id) has the desirable properties of the curve cutting the axis at a positive income and rising to a satiety level with income elasticity of expenditure (7) falling as income rises. The log inverse has the acceptable logistic shape and an asymptote, although it passes through the origin. Both these curves were fitted by Prais(lo) to Dutch budget data of the expenditure on butter who concluded that the semi log function (Fig. 1 b) gave marginally better results. This latter function does not have an asymptote but has the desirable properties of cutting the axis at a positive income level and an 7 which declines with rise in income. The double log function (Fig. Ic) was used by Engel(') and applied by Stone(15) to time series data. Intuitively it has the limitations of passing through the origin, a constant elasticity and no asymptote but in many cases it appears to have provided a good fit when applied to budget data. Over a limited range ofthevariablestherestriction of a constant elasticity may not be crucial nor is it likely that an asymptote of expenditure is reached for many food commodities. Goreux(6) argues that the log log inverse function (Fig. le) reflects closely apriori expectations on expendi- ture. Initially as a luxury, expenditure rises rapidly with income. At higher incomes the good is a necessity, 7 declines and eventually becomes negative. Despite the intuitive appeal, Goreux acknowledges that i t is unlikely that any set of budget data will cover the whole range of income.
I t is clear from this brief review that no functional form has been found to fulfil all the requirements and, indeed, it appears likely that no single type of function will be appropriate in explaining the expenditure patterns of all com- modities. In any analysis, i t may therefore be necessary to experiment with alternative forms although there is also a need to develop further tests to compare the goodness of fit by the data to the different functions.
Regional variations in consumption: A study on apples (a) The problem
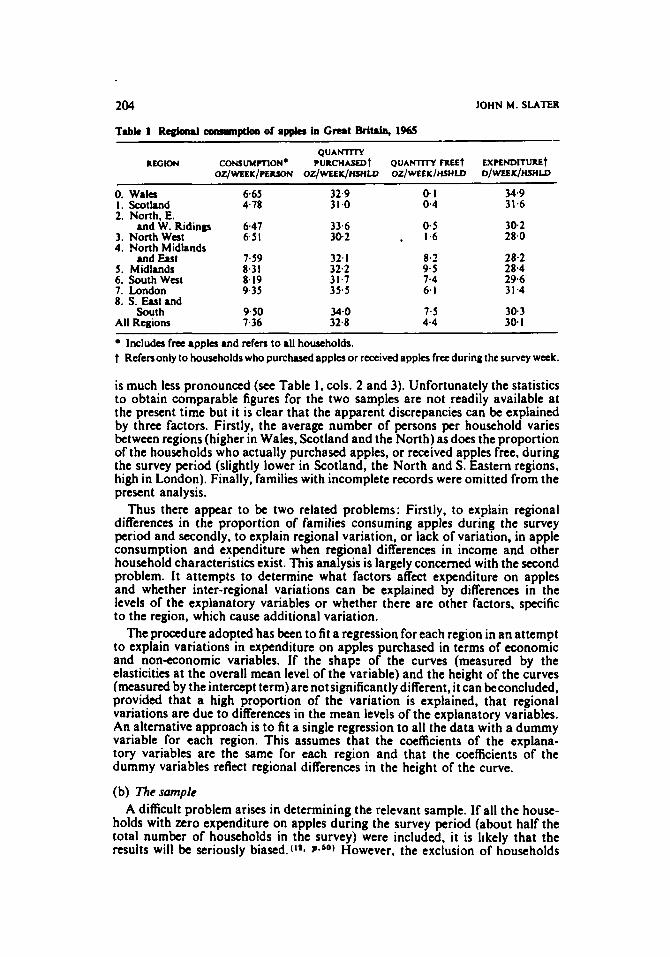
Data from the N.F.S. annual report for 1965(@~ D ) show considerable regional variation in the consumption of apples (see Table I , col. I ) . However. during the course of the analysis it became apparent that, if only those house- holds who purchased apples, or received them free, were considered, the variation
204 JOHN M. SLATER
- Table 1 Regbnal coaarmptbn of appks h Great Britain, 1965
Q U A r U n n REGION CONSUMPTION* PURCHASEDt QUANllTY FREEt EXPENDlTUREt
OZ~~EEU~PEUSON OZ/WLEK/HSHW OZ~WEEK~HSHW D/WEEK/HSHW
0. Wales I . Scotland 2. North, E.
and W. Ridings 3. North West 4. North Midlands
v d East 5. Midlands 6. South W a t 7. London 8. S. East and
South All Regions
665 4.78
6.47 6.5 I
7.59 8.31 8.19 9.35
9.50 7.36
32.9 31.0
33.6 30.2
0- I 34.9 0 4 31.6
0- 5 30.2 1.6 28.0
32. I 32.2 31.7 35.5
34.0 32.8
8.2 28.2 9-5 28.4 7.4 29.6 6. I 31.4
1.5 30.3 4.4 30. I
Includes fra apples and refen to all households. t Refen only to households who purchased apples or received apples f ra during the survey wak.
is much less pronounced (see Table I . cols. 2 and 3). Unfortunately the statistics to obtain comparable figures for the two samples are not readily available at the present time but it is clear that the apparent discrepancies can be explained by threc factors. Firstly, the average number of persons per household varies between regions (higher in Wales, Scotland and the North) as does the proportion of the households who actually purchased apples, or received apples free, during the survey period (slightly lower in Scotland, the North and S. Eastern regions, high in London). Finally, families with incomplete records were omitted from the present analysis.
Thus there appear to be two related problems: Firstly, to explain regional differences in the proportion of families consuming apples during the survey period and secondly, to explain regional variation, or lack of variation, in apple consumption and expenditure when regional differences in income and other household characteristics exist. This analysis is largely concerned with the second problem. It attempts to determine what factors affect expenditure on apples and whether inter-regional variations can be explained by differences in the levels of the explanatory variables or whether there are other factors, specific to the region, which cause additional variation.
The procedure adopted has been to fit a regression for each region in an attempt to explain variations in expenditure on apples purchased in terms of economic and noncconomic variables. If the shapt of the curves (measured by the elasticities at the overall mean level of the variable) and the height of the curves (measured by the intercept term) are not significantly different, it can beconcluded. provided that a high proportion of the variation is explained, that regional variations are due to differences in the mean levels of the explanatory variables. An alternative approach is to fit a single regression to all the data with a dummy variable for each region. This assumes that the coefficients of the explana- tory variables are the same for each region and that the coefficients of the dummy variables reflect regional differences in the height of the curve.
(b) The sample A difficult problem arises in determining the relevant sample. If all the house-
holds with zero expenditure on apples during the survey period (about half the total number of households in the survey) were included, it is hkely that the results will be seriously biased. (lal peso) However, the exclusion of households
REGIONAL CONSUMER EXPENDITURE STUDIES USING (N.F.S.) DATA 205
who consume apples but did not purchase apples during the survey period and the fact that some households will have purchased supplies to cover a period longer than a week also constitutes a bias. It was considered that the former represented the more serious problem and the sample chosen for the analysis contained only those households who purchased apples, or received apples free, during the survey period. This may result in an upward bias in the size of the coefficients.
(c) The Variables Both expenditure and quantity of apples purchased were used as dependent
variables in order that estimates of quality elasticity could be obtained. As only the income of the head of the household and total family income are collected by the N.F.S., the use of total expenditure was ruled out. However. this is not likely to have any seriousimplications as Prais and Houthakker(l*. T*I' la) found the elasticities of fruit expenditure with respect to total expenditure and with respect to income to be 0.88 and 0.90 respectively. Also the problem of a large transitory component and the Summers bias are partially avoided. Total net family income was used in the analysis as it seemed the more relevant variable although it may be subject to more serious errors of measurement when households estimate their income.
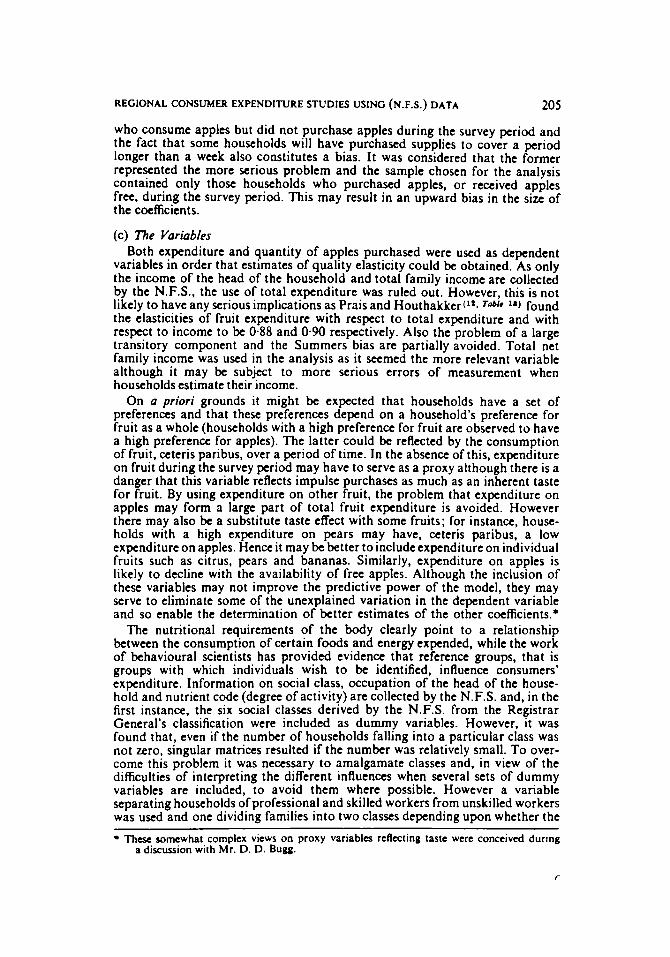
On a priori grounds it might be expected that households have a set of preferences and that these preferences depend on a household's preference for fruit as a whole (households with a high preference for fruit are observed to have a high preference for apples). The latter could be reflected by the consumption of fruit, ceteris paribus, over a period of time. In the absence of this, expenditure on fruit during the survey period may have to serve as a proxy although there is a danger that this variable reflects impulse purchases as much as an inherent taste for fruit. By using expenditure on other fruit, the problem that expenditure on apples may form a large part of total fruit expenditure is avoided. However there may also be a substitute taste effect with some fruits; for instance, house- holds with a high expenditure on pears may have, ceteris paribus, a low expenditure on apples. Hence it may be better to include expenditure on individual fruits such as citrus, pears and bananas. Similarly, expenditure on apples is likely to decline with the availability of free apples. Although the inclusion of these variables may not improve the predictive power of the model, they may serve to eliminate some of the unexplained variation in the dependent variable and so enable the determination of better estimates of the other coefficients.*
The nutritional requirements of the body clearly point to a relationship between the consumption of certain foods and energy expended, while the work of behavioural scientists has provided evidence that reference groups, that is groups with which individuals wish to be identified. influence consumers' expenditure. Information on social class, occupation of the head of the house- hold and nutrient code (degree of activity) are collected by the N.F.S. and, in the first instance, the six social classes derived by the N.F.S. from the Registrar General's classification were included as dummy variables. However, it was found that, even if the number of households falling into a particular class was not zero, singular matrices resulted if the number was relatively small. To over- come this problem i t was necessary to amalgamate classes and, in view of the difficulties of interpreting the different influences when several sets of dummy variables are included, to avoid them where possible. However a variable separating households of professional and skilled workers from unskilled workers was used and one dividing families into two classes depending upon whether the
These somewhat complex views on proxy variables reflecting taste were conceived during a discussion with Mr. D. D. Bugg.
r

JOHN M. SLATER 206
occupation of the head of the household was manual or non manual. Finally a quantitative variable reflecting the activity of the members of the household was constructed by assigning a weight between 0 and 1.5 to each adult based on their nutrient code and a weight of 1.0 to children, adolescents and visitors.*
I t was considered that the number of persons does not adequately reflect the size of the household as an apple consuming unit. The nutritional requirements of different age groups is not very useful in the cast of apples and, as the difficulties of handling the data ruled out, for the present, a more sophisticated approach, an attempt was made to derive a rather crude equivalent adult scale which would reflect the different impact of each age group on household consumption of apples. Weights were assigned to each member of the family according to age as follows: 1 year = 0; I 4 years = 0.25; 5-9 years = 0.75; 10-55 years = 1.00; > 55 years = 0.50 and adjustments were made for meals taken outside the home and visitors. Accepting the validity of the homogeneity hypothesis, for there seems little reason to expect economies of scale in apple consumption, the variables were transformed on to an equivalent adult basis. (d ) The Junct ional form
In this preliminary analysis, the data were fitted to a number of functions but space has restricted a discussion of the results to the double log form. This function gave consistently higher coefficients of determination and allows com- parison with the estimates of income elasticities obtained by the N.F.S.(' Td *)
It also has the convenient property of yielding elasticities directly and these elasticities are constant over the range of the variables. The algebraic form of the double log function can be written:
E. = a Y ~ ~ E , & E , B S E ~ Q , ~ ~ H N C % U where the variables on a per equivalent adult basis are:
E. = Expenditure on apples Eb = Expenditure on bananas Y = Net family income Qf = Quantity of free apples €, = Expenditure on citrus H N C = Household nutrient code EP = Expenditure on pears a and Pi (i = 1-6) are parameters
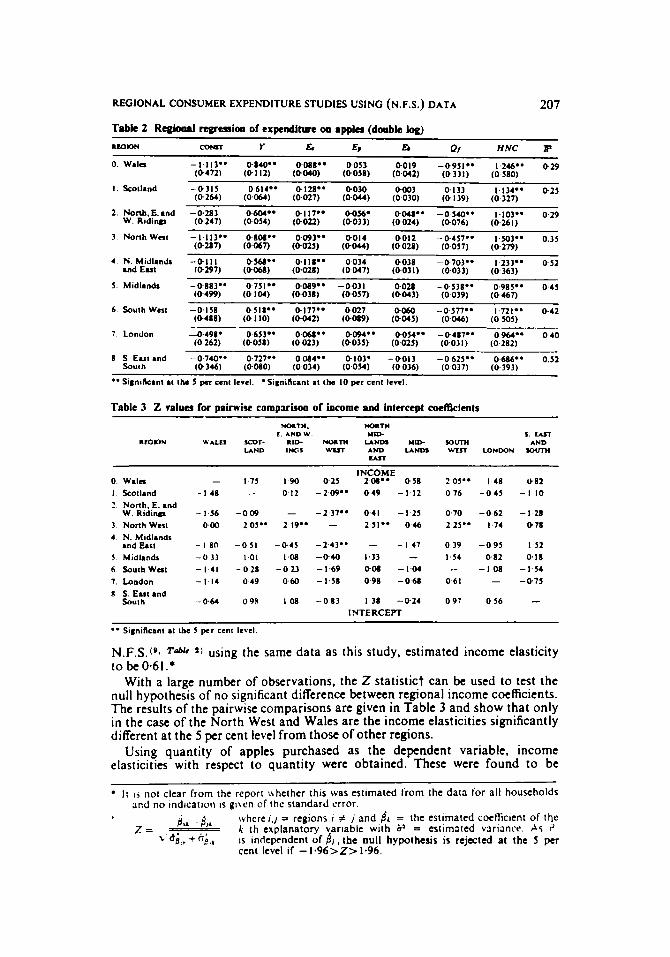
(e) Results of regional regressions The results of the regional regressions using the double log form are presented
in Table 2. The standard errors are given in brackets below the coefficients and those coefficients that are significant at the 5 per cent level are identified by (") and those significant at the 10 per cent level by (*).
The proportion of variation explained ranges from 0.25 to 0.52. These seemingly low figures are not unexpected in view of the shortness of the survey period, the omission of factors such as season and the idiosyncrasies of individual house- holds. To overcome this latter problem requires the inclusion of a complex psychological variable which would reflect why a housewife, when all identi- fiable variables have remained the same, purchases apples one week but not the next, while it may be possible to avoid the problem with little loss of information by grouping the data. Even so, testing whether the explanatory variables exercise any influence on the dependent variable gives F. values significant at the 0.5 per cent level in all equations.
The income coefficients, which in this case are also elasticities, are significant at the 5 per cent level in all regions and range from 0.840 in Wales and 0.808 in the North West to 0.518 in the South West. These results are not widely different from the expenditure elasticities of 0.69 for working class and 0 5 2 for middle class families obtained by Prais and Houthakker(l*. P e l w ) while the
The weightswerr:Kdentary0-S:mod. active0~7S:activeI~O:vcryactiveI~S:andprr~ntI~O.
REGIONAL CONSUMER EXPENDITURE STUDIES USING (N.F.S.) DATA
Table 2 R e g h o d regr=ion of expenditure on apples (double log)
RLOlON CONST Y E.l E? Q Of H N C R
207
0. W a l a - I 113.. 0840" 0088" 0053 0019 -0951" I246" 029 (0472) (0 112) (0040) (0058) (0042) (0331) (0 580)
I . Scotland -0315 0.614.. 0 I Z 8 * * 0030 0003 0133 1.134.. 025 (0.264) (0.060 (0027) (0.044) (0030) (0.139) 10 3271 . .
2. N o n h . E a n d -0283 0604.. 0.117** 00%' 0048.. -0540.. I 103.. 029 W R i d m u (0247) (0054) (0022) (0033) (0024) (0076) (0261)
. . . 4 N Midlands - 0 1 1 1 0S68** QIII** 0034 0038 -0703.. I2)3** 0.51
and Euc 10297) (0068) (0028) (0047) (0.031) (0033) (0 363)
5 Midlanda -01183" 0751" 0089" -0031 0028 -0538.. 0.985" 0.45 (0499) (0 104) (0038) (0057) ( 0 0 4 3 ) (0039) (0467)
(0488) (0110) (0042) (0089) (0045) (0046) (0505) 6. Souih W a t - 0 1 5 8 0518.. 0177" 0027 0060 -0577.. I721" 0.42
7 London 4498. 0653" 0068" 0094'' 0034.. -0487.. 0964.. 040 (0262) (0058) (0023) (0035) (OOU) ( O O J I ) ( 0 2 8 2 )
South (0346) (0080) (0034) ( O O W (0036) (0037) (0 393) 8 S East and -0740'. 0727.. 0084.. 0103. -0013 -0625.. 0686** 052
* * Sl#nikant a i the 5 per cent level *Signi(Sunl at the 10 per ccnl level
Table 3 Z values for paimiw c o m p r r h of income and intercept coeR3cients
INCOME 0. W a l a - 1.75 I 9 0 ou 208.. 0 5 8 205.0 I48 u.82
2 North.E.and I Scotland - I 48 - 0.12 -2.09.. 049 - I 12 076 -04) -1.10
W. Ridinp - 1.56 -009 - -237'' 0.41 -1-25 0.70 -062 -1.28 I N o n h W n i om 205.. 2 19.. - Z S I * * 0.46 225- 1.74 078 4 N. Midlands
and East - I an - 0 5 1 -0.45 -2-43.. - - I47 0 39 -0-95 1.52 - 0 1 1 1.01 1.08 -040 1.33 - 1.54 0.82 0.18 5 Midlands
6 South W a t - I 41 - 0 2 8 -0 .2 ) -1.69 008 -1.04 - - I 08 -1.54 1. London - I 14 049 060 -1 .58 0.98 -068 061 - -075 8 S . E u t a n d
South -0.64 091 I 0 8 -083 1.38 -0.24 097 056 - INTERCEPT
*. Sicnificnnt at the 5 per cent level
N.F.S.(O. Tobk * ) using the same data as this study, estimated income elasticity to be 0.61 .*
With a large number of observations, the 2 statistict can be used to test the null hypothesis of no significant difference between regional income coefficients. The results of the pairwise comparisons are given in Table 3 and show that only in the case of the North West and Wales are the income elasticities significantly different at the 5 per cent level from those of other regions.
Using quantity of apples purchased as the dependent variable, income elasticities with respect to quantity were obtained. These were found to be
I i ij, not clear from the report ithether this was estimated from the data for all households
whcre I .J = regions i # j and 81 = the estimated coefficient of the P th explanatory variable with ii = estimated variance. A 5 9. is independent of 81, the null hypothesis is rejected at the 5 per cent level if - 1.96>Z> 1.96.
and no indication is given of thc standard crror.
z = - j,, -8, . %, +"e,&
208 JOHN M. SLATER
slightly lower than the expenditure elasticities but in no case was the quality elasticity significantly different from zero. This may indicate very little preference for the better quality, higher priced apples or, alternatively, errors in the data may have arisen from persons with low incomes inflating prices to emphasise the Cost of living and persons with high incomes understating prices to emphasise their buying skill.
The coefficients of the citrus variable are all positive and significant and those pear and banana coe5cients which are significant also have a positive sign. As might be expected, when these three variables were replaced by expenditure on fruit other then apples the coefficients with respect to this latter variable were slightly larger and significant at the 5 per cent level in all regions. These results suggest that consumers who buy apples also purchase other fruit. This is what might be expected if expenditure on other fruit is reflecting a taste variable. In the cases of pears and bananas, the lack of significance of the coefficients may indicate an offsetting substitute effect. However, it is also possible that the coefficients are picking up some of the income effect in that both expenditure on apples and expenditure on other fruit are correlated with income.. If this is the case then the income coefiient may be biased downwards.
Except in Wales and Scotland, where few free apples are obtainable, the results indicate that a 1 per cent rise in the quantity of free apples decreases expenditure on apples by about 0.5 per cent the influence being slightly greater in the North Midland and South East regions.
The coefficient of the HNC variable is significant in all regions and suggests that, the more active the family, the higher the expenditure on apples. To the extent that apples are regarded as a healthy and nutritious food this would not be an unexpected result although care must be taken in the interpretation of a variable such as this. The fact that all children are regarded as active may have resulted in a built in bias but this may not be very serious. It is interesting to note that when the dummy variable differentiating between households of manual and non-manual workers was included, in place of the HNC variable, the sign of the coefficient suggested that households of manual workers spend less on apples. These results are not necessarily inconsistent.
In four of the nine regions the intercept term is not significantly different from zero at the 10 per cent level. When Z values were computed (see Table 3) the null hypothesis was rejected only in the pairwise comparison of the coefficient for the North West region with the coefficients for Scotland, the North, East and West Ridings and North Midlands.
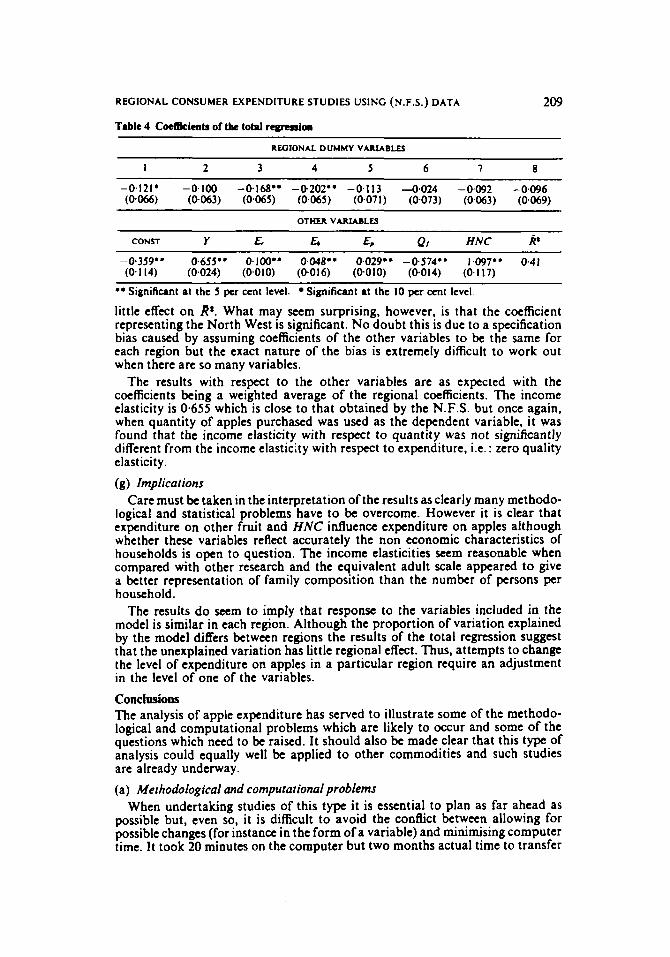
(f) Results of the total regression A total regression for expenditure on apples was fitted with a dummy variable
for each region and Wales as the base regi0n.t The coefficients, together with their standard errors arc shown in Table 4.
With the large number of regions and, unavoidably, some regions with relatively small numbers of observations, multicollinearity between the dummy variables for these regions and the intercept term is inevitable. Also, in view of the lack of significant differences between the intercept coefficient for Wales and the intercept coefficients for the other regions, it is to be expected that few of the regional dummy variables would be significantly different from zero and it is interesting to note that the inclusion of the dummy variables for region had very
I am grateful to Profaror W. J. Thomas for pointing this out. t Stmart('') has shown that the tats made in c ~ ~ a r i a n c c analysir for diffewna bctwan
the intmept terms arc equivalent to the t a t where intmept terms are mpmentd by dummy variables in a singk regression.
REGIONAL CONSUMER EXPENDITURE STUDIES USING (N.F.S.) DATA 209
Table 4 Codfkimts of the total regredon ~~ ~
REGIONAL DUMMY VARIABLES
OTHER VARIABLES
CONST Y E, A 5 E. Pi HNC R*
- 0.359" 0.655" 0.100'* 0.048** 0.029" -0.574" 1.097'' 0.41 (0.1 14) (0.024) (0.010) (0,016) (0.010) (0.014) (0.1 17)
** Significant at the 5 per cent level. Significant at the 10 per cent level
little effect on I*. What may seem surprising, however, is that the coefficient representing the North West is significant. No doubt this is due to a specification bias caused by assuming coefficients of the other variables to be the same for each region but the exact nature of the bias is extremely difficult to work out when there are so many variables.
The results with respect to the other variables are as expected with the coefficients being a weighted average of the regional coefficients. The income elasticity is 0.655 which is close to that obtained by the N.F.S. but once again, when quantity of apples purchased was used as the dependent variable, it was found that the income elasticity with respect to quantity was not significantly different from the income elasticity with respect to expenditure, i t . : zero quality elasticity. (g) Implications
Care must be taken in the interpretation of the results as clearly many methodo- logical and statistical problems have to be overcome. However it is clear that expenditure on other fruit and HNC influence expenditure on apples although whether these variables reflect accurately the non economic characteristics of households is open to question. The income elasticities seem reasonable when compared with other research and the equivalent adult scale appeared to give a better representation of family composition than the number of persons per household.
The results do Seem to imply that response to the variables included in the model is similar in each region. Although the proportion of variation explained by the model differs between regions the results of the total regression suggest that the unexplained variation has little regional effect. Thus, attempts to change the level of expenditure on apples in a particular region require an adjustment in the level of one of the variables. Conclusions The analysis of apple expenditure has served to illustrate some of the methodo- logical and computational problems which are likely to occur and some of the questions which need to be raised. It should also be made clear that this type of analysis could equally well be applied to other commodities and such studies are already underway. (a) Methodological and computational problems
When undertaking studies of this type it is essential to plan as far ahead as possible but, even so, it is difficult to avoid the conflict between allowing for possible changes (for instance in the form of a variable) and minimising computer time. It took 20 minutes on the computer but two months actual time to transfer
2 10 JOHN M. SLATER
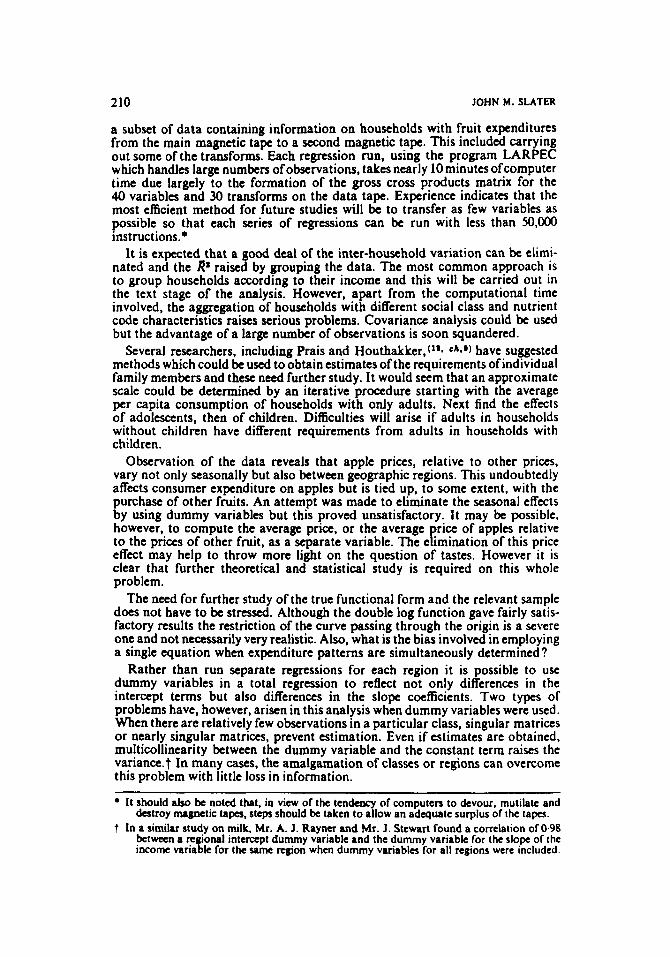
a subset of data containing information on households with fruit expenditures from the main magnetic tape to a second magnetic tape. This included carrying out some of the transforms. Each regression run, using the program LARPEC which handles large numbers of observations, takes nearly 10 minutes ofcomputer time due largely to the formation of the gross cross products matrix for the 40 variables and 30 transforms on the data tape. Experience indicates that the most efficient method for future studies will be to transfer as few variables as possible so that each series of regressions can be run with less than 50,OOO instructions.'
It is expected that a good deal of the inter-household variation can be elimi- nated and the Rl raised by grouping the data. The most common approach is to group households according to their income and this will be carried out in the text stage of the analysis. However, apart from the computational time involved, the aggregation of households with different social class and nutrient code characteristics raises serious problems. Covariance analysis could be used but the advantage of a large number of observations is soon squandered.
Several researchers, including Prais and Houthakker, (lS* c * ~ have suggested methods which could be used to obtain estimates ofthe requirements ofindividual family members and these need further study. It would seem that an approximate scale could be determined by an iterative procedure starting with the average per capita consumption of households with only adults. Next find the effects of adolescents, then of children. Difficulties will arise if adults in households without children have different requirements from adults in households with children.
Observation of the data reveals that apple prices, relative to other prices, vary not only seasonally but also between geographic regions. This undoubtedly affects consumer expenditure on apples but is tied up, to some extent, with the purchase of other fruits. An attempt was made to eliminate the seasonal effects by using dummy variables but this proved unsatisfactory. It may be possible, however, to compute the average price, or the average price of apples relative to the prices of other fruit, as a separate variable. The elimination of this price effect may help to throw more tight on the question of tastes. However i t is clear that further theoretical and statistical study is required on this whole problem.
The need for further study of the true functional form and the relevant sample does not have to be stressed. Although the double log function gave fairly satis- factory results the restriction of the curve passing through the origin is a severe one and not necessarily very realistic. Also, what is the bias involved in employing a single equation when expenditure patterns are simultaneously determined?
Rather than run separate regressions for each region it is possible to use dummy variables in a total regression to reflect not only differences in the intercept terms but also differences in the slope coefficients. Two types of problems have, however, arisen in this analysis when dummy variables were used. When there are relatively few observations in a particular class, singular matrices or nearly singular matrices, prevent estimation. Even if estimates are obtained, multicollinearity between the dummy variable and the constant term raises the variance.? In many cases, the amalgamation of classes or regions can overcome this problem with little loss in information.
It should also be noted that, in vim of the tendency of computers to devour, mutilate and destroy magnetic tapes. steps should be taken to allow an adequate surplus of the tapes.
t In a similar study on milk, Mr. A. J. Rayner and Mr. J . Stewart found a correlation of 0.98 betwan a regional intenrpt dummy variable and the dummy variable for the slope of the income variabk for the same region when dummy variables for all regions were included.
REGIONAL CONSUMER EXPENDITURE STUDIES USING (N.F.S.) DATA 21 I
Interesting research (see for instance 19) is currently being carried out on the utilisation of u priori information on the magnitude of certain parameters (for instance the income elasticity of demand for many commodities is known to lie between 0 and 1.5). The results suggest that the Baysian approach of restricted information may have some application in this type of analysis. As an example, the coefficients of the EP variable in Table 2 which are significant lie between 0.056 and 0.103 while those that are not significant fall well outside this range. I t may be that the true values of these latter coefficients lie within the above range (their variances are in fact large) and a restriction should be placed on them. In a sense, the stronger assumption of identical coefficients is being made when the total regression is used.
Finally, i t is rather surprising to observe the erratic behaviour, over time, of estimates of income elasticity of expenditure for apples as reported by the N.F.S.('. :) This suggests a need to look at the problem over a number of years and to combine the cross-sectional analysis with a time series approach. From the experience gained with the 1965 i t is hoped that the task of transferring the N.F.S. data for other years to magnetic tape will be much easier.
(b) Some questions raised This analysis has concentrated more on methodological problems and the
search for relevant hypotheses than the answering of specific questions. However, it has already been suggested that the estimation of parameters, such as income elasticities, may provide useful information on which projections at the national level can be based. But the trend towards regional planning raises the question as to what relevance this type of analysis might have at the regional level. Certainly. the nature of the model limits its value for prediction but it does serve to draw attention to inherent characteristics of region; for instance, the fact that family size and social class affect food expenditures and that the levels of these variables differ between regions. It is clear that a good deal of work needs to be done on the whole question of "non economic" variables and this raises the question as to what efforts need to be made to improve the collection of information on these variables.
Follow up surveys in specific regions and on specific questions could play a useful part in verifying, or otherwise, some of the hypotheses suggested by the results as well as putting forward new hypotheses on consumer behaviour for testing with data from the larger sample. The departments of marketing will no doubt be contemplating such studies and i t would seem that the N.F.S. is in a unique position to assist this work. However, i t would be unfair to suggest that the N.F.S. should increase its already onerous burden and any specific proposals should necessarily firit be discussed with them together with any improvements in the survey that this analysis may suggest. It may be possible for the N.F.S. to carry out a detailed study of one particular commodity during a survey period in an attempt to answer such questions as the importance of quality and the implications of the findings on national grading schemes. Also there is the question of tastes. Is taste an important determinant of consumer expenditure and if so how is a household's set of preferences built up? If it is found that factors, such as preferences, family size and social class, change only slowly over time then the model used in the case study may have more predictive value.
The problems discussed, together with the questions raised, suggest the direction in which future work should proceed. Work on some of the problems is already underway at Manchester and it is hoped the results of several studies will be brought together in a single publication in the spring of 1969.
212
Refercnccs
DISCUSSION ON PAPER BY 1. M. SWTER
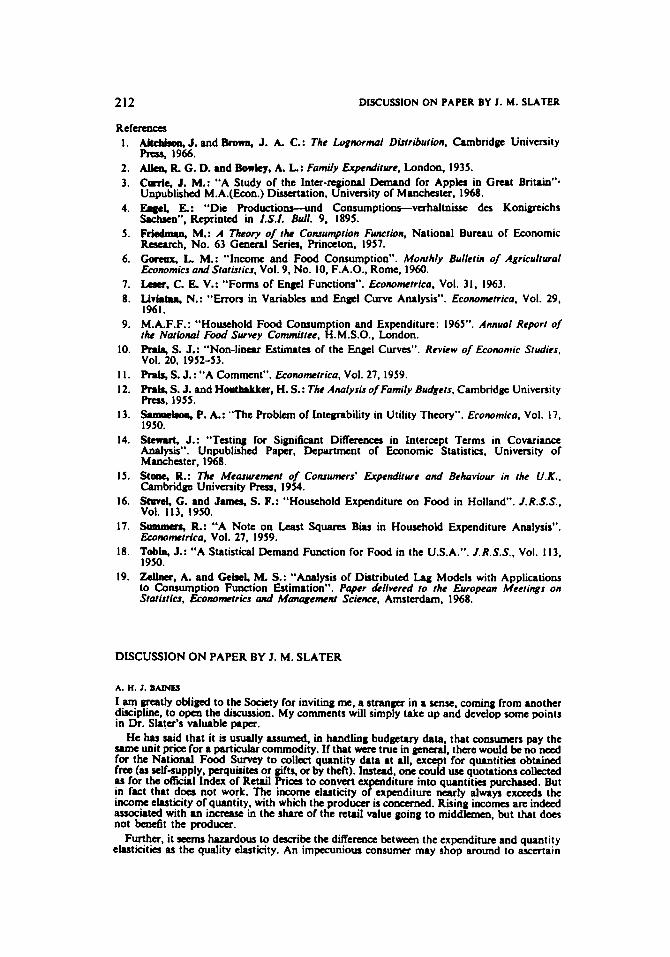
I . Altehbocl, J. and Brown, J. A. C.: The Lognorm1 Distribution, Cambridge University h. 1966.
2. Allen, R. C. D. and Bowky, A. L: Fumily Expenditure, London. 1935. 3. C d e , J. M.: "A Study of the In.tcr-rcgional .Demand for Appks in Great Britain".
Unpublished M.A.(Econ.) Dissertation, University of Manchatcr. 1968. 4. Eogel, E: "Die Produaiolu--und Consumptions-vahaltnissc dcs Konigrcichs
Sacham". Reprinted in I.S.I. Bull. 9. 1895. 5. Frlsdmm, M.: A Theory of the Consumption Function. National Bureau of Economic
Research, No. 63 G d Series. Princeton. 1957. 6. Gueux. L. M.: "Income and Food Consumption". Monthly Bulletin of Agriculturul
Economics undStutistics. Vol. 9. No. 10. F.A.O., Rome, 1960. 7. Leer, C. E. V.: "Forms of Engel Functions". Economrricu. Vol. 31. 1963. 8. UihE.a, N.: "Errors in Variables and Engel Curve Analysis". Economrrricu, Vol. 29,
1961. 9. M.A.F.F.: "Howhold Food Consumption and Expenditure: 1965". Annuul Report o/
the Nationd Food Survey Committee, H.M.S.O., London. 10. R.la, S. J.: "Non-linear Estimates of the Engel Curves". Review of Econonric Studies,
Vol. 20. 1952-53. I I . R.la, S. J. : "A Comment". Econonurricu, Vol. 27, 1959. 12. Pnb, S. J. and Hootimkka, H. S.: The AMlysis of Fumily Budgets. Cambridge University h. 1955.
13. Wmcboa, P. A.: "The Probkm of Integrability in Utility Theory". Economicu, Vol. 17. 1950.
14. Stcmrt, J.: "Testing For Significant Differences in Interapt Terms in Covariance Analysis". Unpublished Paper. Department of Economic Statistics. University of Manchester, 1968.
15. Stme, R.: The Measurement of Consumers' Expenditure und Bchviour in the U.K.. Cambridge University Prus. 1954.
16. Stuvel, C. and James, S. F.: "Household Expenditure on Food in Holland". I.R.S.S.. Vol. 113. 1950.
17. Somwn. R.: "A Notc on k t Squares Bias in Household Expenditure Analysis". Econometrica, Vol. 27, 1959.
18. Tobin. J.: "A Statistical Demand Function for Food in the U.S.A.". J.R.S.S.. Vol. 113. 1950.
19. zellaa, A. and Gebel, M. S.: "Analysis of Distributed Lag Models with Applications to Consumption Function Estimation". Puper dellvered to the Europeun Meetings on Stutbtlcs, Econometrics und Munugemnr Science. Amsterdam. 1968.
DISCUSSION ON PAPER BY J. M. SLATER
A. H. 1. MINES
I am greatly obliged to the Society for inviting me, a stranger in a sense. coming from another discipline, to open the discuuion. My comments will simply take up and develop some points in Dr. Slata's valuabk p a p .
He has said that it is u s d l y assumed. in handling budgetary data, that consumers pay the same unit p r ia for a particular commodity. If that were true in general, t h m would be no need for the National Food Survcy to collect quantity data at all, ex t for quantities obtained free (as self-supply. perquisites or gifts, or by theft). Instead. one cox use quotations collected as for the dficid Index of Retail Rica to convert ex d i t w into quantities purchased. But in fact that d o a not work. The income elasticity o E p m d i t u r c nearly always exceeds the income elasticity of quantity, with which the producer is concerned. Rising incomes arc indad associated with an increase in the share of the retail value going to middlemen, but that does not bendit the producer.
Further. it seems hazardous to describe the difference betmen the expenditure and quantity elasticities as the quality elasticity. An impecunious consumer may shop around to ascertain
DISCUSSION ON PAPER BY 1. M. SLATER 213
the lowest price of a standard article. Another with more money and leu time will not bother. If the articles purchased are identical. where is the quality difference? It x c m s better to all
dP Y d Y -
simply the income elasticity of the price. without assuming that a higher price buys a better quality.
Members will, of course. know that a bau-weighted constant-basket price index tends to drift upwards compared with a currently-weighted consumer price index. I am speaking now of the retail level; a similarly constructed index of producer prices would have a downward. not an upward drift. In the last year or two the divergence be twan the two types of retail p r i a index has increased, probably because of the ending of price maintenance, and a h because of the impracticability of allowing for rapid shifts in demand from one type of shop to another. say from small tobacconists to supermarkets when price cutting on cigarettes was permitted. This strengthens my belief that p r i m collected from vendors cannot be used uncritically for valuation purposes. We need prices from the other side of the counter. from retail purchasers.
The problem of zeros raised on page 204 is difficult because zeros in expenditure arise both from those who never buy the commodity and those who buy it occ3uionally. but not during the survey week. The former are a different population; the latter are in principle part of the population to be studied. Some of us would not buy cigarettes or beer under any circumstances. but one suspefts that very few p m p k are total abstainers from apples, either from motives of health. conscience or taste. Yet it is well known that the Victorian urban working c l a s s rarely bought fresh fruit. It did not get into the 1914 Cost of Living Index. which continued until 1947. The absence of legal control over apples during both the world wars was at least partly due to their unimportance in the family budgets collected in 1904. This bad old habit has left its traces. Ceferis pcrribus. manual workers still spend leu on apples than other households. as Dr. Shter has found, and the rise in real incomes in the past decade has not bccn translated into a rising per cupur consumption of fresh fruit, in spite of the large cross-sectional income elasticities. In the formal demand analysis, after abstracting from price effects, this comes out as a fall in basic underlying demand which is just fast enough to offset the income effect. This reminds one of the White Knight in Alice:
But I was thinking of a plan To dye one's whisken green. And always use so large a fan That they could not be xcn .
In fact the cross-sectional income elasticity may be partly a social class or occupational difference, rather than a purely economic parameter.
I am reminded of a verse in the Song of Songs "Sustain me with cakes of raisins. refresh me with apples". The Shulammite was sutruitred by the processed food. as a necessity. but comforted or refreshed by the fresh food, as a luxury. This particular bride of Solomon (one of 700) was clearly in humble social circumstances. without ready access to an orchard. Indeed. elsewhm she compares her beloved to an apple tree, as something rare and desirable.
&fore leaving the income elasticity, I might raise one eyebrow at the first footnote on p a p 207. It is madeclear on page 135 of the 1965 N.F.S. Report that the income elasticities for particular foods were estimated within the twelve most important. closely defined types of household and then combined. The standard error was not calculated at that time. but later results sug%st that for apples it would be of the order of 0.06.
There is an interesting finding on page 208 following Table 2. which shows that if free apples were not available they would probably not be replaced by p u r c h w . to anything like the same extent (except perhaps in Wales). This casts doubt on the convention by which free food IS valued at the retail price. though one does not KC how else to impute its value.
Turning to page 210. I am tempted to join issue with the suggestion that we should establish the equivalent-adult scale for a given commodity by an iterative process, starting with house- holds consisting of adults only and going on to t h w with adolescents and then to those with children. That is better than assigning man-values arbitrarily. but it docs not allow for economics of scale in large families. or for the effect of children on their parents. I f children have a strong distaste for a particular food, the parents ma well cersc to buy it.even for themselves. In fact, the unit for which the adult-cquivalent size siould be established IS a particular type of family considered as a whole.
The footnote on page 210 throws an interesting light on the dietary rrquirements of com- p u t m . We have had similar difficulties in the past with punched cards which were chewed up.
I think, Mr. Chairman. this paper has taken us nearly as far as is possible with purely cross- sectional data, except that it has not handled regional price differences. When yean other than
214 DLSCUSSION ON PAPER BY J. M. SLATER
1965 come to bc considered. the intercept t a m s in Table 2 wi l l not nccasorily persist. They may bcduein part tostrictly temporaryconditionssochasagoodorbadapplecrop in theregion concerned.
The next steps could well be to distinguish transient from persistent regional d f l e m m . to explain the latter as far as possible in terms of known factors such IS family income and com- position. to see whether the differences k f t unexplained have a geographical pattern or a rrpular trend in time. and then, but only then, to attempt regional projections.
The growth o f our ~1i0d economy may seem painfully slow at p e n t , but i t is faster than the chanp in our social values and customs. Habits established in youth persist into old age, and dietary patterns caused by the penury of the t h i n k may still be observable into the eighties. when they will be ovcrcome by time and mortality rather than by prosperity. one r d h an epigram in the Grak Anthology:
'Rich to no end, I c u m my natal hour Who nought enjoyed when young, denied the means. And nought when old enjoyed, denied the power.'
I nccd hardly cmphasix that the National Food Survey is ready to supply information to mearch workm in the universities. and on different conditions, to market researchers in the food trades; but it is a misuse of the Survey simply to use it to see which group or a t y s are lagging behind national trends so that advertising can bring them into line. I t may, in fact. be better to conantrate on giving peopk more and better varieties of what they a? already enjoying. I t is for the community to deal with the relative poverty of some of our older industrial arcas, and the execrabk environment of almost all; perhaps also with failures in the transport network needed for distribution. But when all that is done.regioruldifferenrnwill not disappear overnight, and it would impoverish our way of life i f they did.
In conclusion, and in relation to a point of basic principk on page 199, members may like to have an example from the current number of Mindof a set of consumer preferences which are rational and consistent but not transitive. I have 9 apples. ranked in order of desirability from I to 9. I also have t h m bran tubs-any opaque container would do, even the urns which used to appear with funereal regularity in textbooks. In the first tub, I place the apples ranked 2nd. 6th and 7th; in the second tub, thosc ranked 1st. 5th and 9th; in the third, thosc ranked 3rd. 4th and 8th. Now I draw OM appk at random from each tub. and call them A, B and C. As a rational man 1 should probably prefer A to B. the odds being 5 to 4. Similarly, I prefer B to C by the same odds. Now common sense suggests that i f A is probably preferred to B and B is probably preferred to C. then A is probably preferred to C. But this is not so. C is, in fact. preferable to A 5 t i m out of 9. I t i s like going downstairs continuously and finding oneself back on the original landing. One has to bc a Zen Buddhist to regard intransitive preferences with equanimity.
COLIN CLARK
I t aqpears that F.A.O. have, amongst other errors, gravely overestimated the world's income elasticity of demand for food. That is bad nem for farmers.
In comparing the different possible consumption functions Dr. Slater should make reference to the work done by Jona and Basu (Form &onomist. 1957). They ran a competition between the different functions and awarded the highest score to the xmi-long relationship.
PROFESOR W. I. THOMW
Although John Slater's paper deals mainly with the results of the doubk-log function, we have, as he has indicated. experimented with several other forms. which usually gave poorer results. In w i n g i t might be mentioned that i t is rccognised that i t is not necessarily legitimate to compue the R nlucs of the log transform of the dependent variabk. as a measure of the Doodmu of fit. with the R obtained for the dependent variable in i t s natural form as in the semi-log or linear function. What is rather disturbing. h o m m . is that the relativities between the R% for different functional forms do not remain very stable across regions. For example, the R obtained for the doubk-log form may bc of about the same value as for the millog form for OM repion, whereas formother region i t m y be marly double the value. One possibk explanation. of course, i s that OM functional form may perform considerably better than another in describing the relationship between variabla over the range of the variables recorded in a particular region but not where the mp of variables is different. I n other words, the con- sumption function may be more compkx than i s being approximated by the relatively simpk forms which we have tested and different forms do not perform equally as well at different ranges of the independent variables.
Even at best the R% are rather low. As John Slater has already signified. there is a large stochastic ekment in the actual purchases of a particular commodity within a given week which is quite unrelated to the variabks being tested. R must be relatively low in thev circum- stancrl. I t would probably be easy to raise the value o f R by using regressions on grouped
DISCUSSION ON PAPER BY 1. M . SLATER 215
data, where the stochastic element would tend to cancel out. but that does not improw the r e d explanatory power of the function used. More attention should k p d to the significpnce of the coefficients obtained than to the value of R' when dealing with individual commodities.
There are a number of arguments as to whether or not to include howholds which d o not consume the particular commodity during a given week. We have more work to d o on this probkm before we publish further studies.
As Mr. Baines has indicated. a lot of work has gone into making the National Food Survey data more readily available for research purposes and, of course. like the National Food Survey itself. we in ManChester are ready to help wherever we can. AU final requests should, however. come through the National Food Survey, rather than to Manchester direct b u s e the data is still the property of the National Food Survey, and not of Manchester University. But if a particular piece of research is more readily done through the use of the Atlas magmtic tapes than through the form in which the data is held by the National Food Survey, we shall be prepared to discuss the problem with them. I t may mean making a modest charge for servicing or computing but this would still often be more economic than working from the N.F.S. tapes.
JOHN M. SLATER
I think Mr. Baines possibly misinterpreted my remarks about price variation in cross-sectional data. I t is assumed that consumers are faced with identical prices and if they choose to pay a higher unit price this is because they are purchasing a better quality product although the N.F.S. would not distinguish it as a different product. A problem arises, however. in that the N.F.S. contains time elements and the data thus contains seasonal as well as geographic and quality price differences.
I am not altogether sure that apples would necessarily have a very significant quality elasticity and certainly some commodities may have very low quality elasticities. However. until I have tried to remove the seasonal and regional price effects. I am not too happy about stressing the quality elasticity results.
One of the difficult problems was in determining whether to u x the total sample or only those households who consumed apples. The method of analysis used here (i.e. without grouping) precludes using a sample with about half the observations scattered along the income axis at zero consumption. However. there may other grounds for choosing a partial sample rather than a grouped total sample. ( I ) Not much information is lost if the proportion of households who do not consume apples does not change significantly from year to year. ( 2 ) Even if the data are grouped it would seem that the assumption is being made that a group of households. A. which consumed apples have identical characteristics-not only in terms of income and family com- position but all other characteristics-to a group of households, B. which did not consume apples but are grouped with A. ( 3 ) Thcrc is also the question of consumers purchasing supplies for more t h a n one week. If a household purchases 3 Ibs of apples in a particular week and some other household does not purchase any. then the group average is 1 4 Ibs. I t may be however that the first household was purchasing its supplics for 3 to 4 weeks or for I ? weeks. I think there are considerable dangers in averaging the data but I do not want to imply that I think the partial sample is the answer. The test between the two a l te rna t iva-or other alternatives-must be as to which will give estimates uhich allow the better prediction.
I was not quite sure as to the arguments relating to income elasticity. However. i t would seem that there are two points here. In a sense. we are trying to remove the variation due to social class and all the other variables to leave the income effect. But it may be that social class effects the slope of the Engel curve and not just the intercept and possibly we should have a function which takes this into account.
Taking Mr. Baines' point that he feels thatwehavegoneas far as wecan go with cross-sectional data, 1 certainly don't agree. I think we have a long way still to go in analysing this type of data and getting rid of some of the methodological. statistical and computational problems. One of the real problems still to be tackled is the question of social cl?ss and taste. We need to determine what are the important social class variables. i.e. what variables reflect the need for affiliation etc.. and how information on these variables can be collected. Also reference is made in my paper (p. 21 I ) to the rather surprising fluctuation over time of income elasticities of expenditure reported by the N.F.S. in 1965. For apples the elasticities vary from 0.60 in 1960 to 0.84 in 1962 and 0.61 in 1965. There is even greater fluctuation for other commodities. One has always assumed income elasticities to change only slowly over time which suggests the need to study more than one year's data. The statistical tests for inter-regional differences need to be improved for i t will be noted that if the standard errors are large we are unlikely to detect any differences in the pairwise comparisons. One alternative is to applv the Chow test which uses a covariance analysis approach to test for significant differences between the relations as a whole rather than the individual coefficients.
With respect to Professor Clark's point on the semi log function. Prais and Houthakker also favoured the semi log function but as Professor Thomas has pointed out. and as I mention
216 DISCUSSION ON PAPER BY I. M. SLATER
b my paper, we did pct consiskntly bc t t a mulu and higher R 4 with the doubk log function. Now whether R is a good measure may k a debaubk point.
Rofeasor Thomu raised a poiot about R4. whrt 1 might suggest is that if doubk log func- t ioosuedtted todatafrocahworegionsmnuyobtun R4ofOJin bothcuabut thefunct ions may haw differrat curvrturu. Now if we Btted I linear function to the two sets of data then we m y get ID R of 0-3 in one cue but. for the data which gave the log function with kss curvature, the R is likely to k much higher. A l t m t i w l y , it would seun that the situtioo he mentions could a h .rise w h a e the data for one nyioo co- 8 wider. range of the yri.bla than the data for mother region. 1 think t h a c potnta arc b u i a l l y similar to thore m i d by Professor Thomu.