regional characterization of longitudinal dt-mri to study ... · regional characterization of...
TRANSCRIPT
Regional characterization of longitudinal DT-MRI to study white matter maturationof the early developing brain
Neda Sadeghia , Marcel Prastawaa , P. Thomas Fletchera , Jason Wolff b , John H. Gilmorec , Guido Geriga
aScientific Computing and Imaging Institute, University of Utah, Salt Lake City, Utah 84112
bCarolina Institute for Developmental Disabilities, University of North Carolina, Chapel Hill, NC 27599
cDepartment of Psychiatry, University of North Carolina, Chapel Hill, NC 27599
Abstract
The human brain undergoes rapid and dynamic development early in life. Assessment of brain growth patternsrelevant to neurological disorders and disease requires a normative population model of growth and variability in orderto evaluate deviation from typical development. In this paper, we focus on maturation of brain white matter as shownin diffusion tensor MRI (DT-MRI), measured by fractional anisotropy (FA), mean diffusivity (MD), as well as axial andradial diffusivities (AD, RD). We present a novel methodology to model temporal changes of white matter diffusionfrom longitudinal DT-MRI data taken at discrete time points. Our proposed framework combines nonlinear modelingof trajectories of individual subjects, population analysis, and testing for regional differences in growth pattern. Wefirst perform deformable mapping of longitudinal DT-MRI of healthy infants imaged at birth, 1 year, and 2 years ofage, into a common unbiased atlas. An existing template of labeled white matter regions is registered to this atlasto define anatomical regions of interest. Diffusivity properties of these regions, presented over time, serve as inputto the longitudinal characterization of changes. We use non-linear mixed effect (NLME) modeling where temporalchange is described by the Gompertz function. The Gompertz growth function uses intuitive parameters related todelay, rate of change, and expected asymptotic value; all descriptive measures which can answer clinical questionsrelated to quantitative analysis of growth patterns. Results suggest that our proposed framework provides descriptiveand quantitative information on growth trajectories that can be interpreted by clinicians using natural language termsthat describe growth. Statistical analysis of regional differences between anatomical regions which are known to maturedifferently demonstrates the potential of the proposed method for quantitative assessment of brain growth and differencesthereof. This will eventually lead to a prediction of white matter diffusion properties and associated cognitive developmentat later stages given imaging data at early stages.
Keywords: Longitudinal brain imaging, early brain development, DTI, Nonlinear Mixed Effect Modeling
1. Introduction
Improved understanding of typical brain developmentduring infancy, an interval characterized by rapid sculpt-ing, organization and vulnerability to exogenous influ-ences, is of a great importance both for clinical and scien-tific research. Many neurobehavioral disorders have theirorigins during neurodevelopment (Huppi, 2008; Gilmoreet al., 2010). Establishing a normative model of earlybrain development is a critical step to understanding thetiming and potential mechanisms of atypical developmentand how intervention might alter such trajectories and im-prove developmental outcomes (Als et al., 2004; Marshet al., 2008). Once normative models are available, theycan inform research and practice concerning children atrisk for neurodevelopmental disorders and may eventu-ally lead to earlier and improved diagnosis and treatment.Longitudinal trajectory-based studies provide a better un-derstanding of human brain development compared to
cross-sectional studies (Karmiloff-Smith, 2010). In cross-sectional data, calculation of the average trajectory maynot be representative for the growth patterns of individualsubjects as this approach is inherently insensitive to indi-vidual developmental differences and cohort effects (Gog-tay et al., 2004). Cross-sectional analysis might falsely re-port magnitude of changes over time or may fail to detectchanges (Casey et al., 2005).
Growth modeling from longitudinal data, on the otherhand, makes use of sets of individual temporal trajectorieswhich results in significantly improved models of growthand growth variability, as longitudinal studies can differen-tiate between cohort and age effects (Diggle et al., 2002).
Previous imaging studies of early brain developmenthave substantially contributed to our current understand-ing of brain development. Some of the studies consideredsize or shape differences (Knickmeyer et al., 2008; Huppi,2008; Xue et al., 2007; Xu et al., 2008), others have looked
Preprint submitted to NeuroImage October 21, 2012
at changes of contrast in MRI (Sadeghi et al., 2010) ordiffusion parameters in DTI (Huppi et al., 1998; Mukher-jee et al., 2002; Hermoye et al., 2006; Gao et al., 2009;Sadeghi et al., 2012; Geng et al., 2012). However, mostof these studies are based on cross-sectional data or chil-dren older than 2 years (Mukherjee et al., 2002; Hermoyeet al., 2006; Dubois et al., 2008; Gao et al., 2009; Fariaet al., 2010). In this study we focus on developing lon-gitudinal models spanning birth to about two years ofage. The models are based on the parameters obtainedfrom diffusion tensor imaging (DTI). DTI-derived diffu-sivity parameters provide relevant information about thematuration of the underlying tissue as they assess watercontent (Huppi, 2008). These measurements are a possi-ble reflection of axonal density and/or degree of myelina-tion (Song et al., 2002; Neil et al., 1998) which correlatewith cognitive functions (Dubois et al., 2006) and early de-velopmental outcomes (Als et al., 2004; Ment et al., 2009;Wolff et al., 2012). In this study we focus on fractionalanisotropy (FA), mean diffusivity (MD), radial (RD) andaxial diffusivity (AD) to explain brain maturation and togain a better understanding of white matter development.Driven by earlier findings that myelination follows a non-linear spatio-temporal pattern (Dubois et al., 2008), ourgoal is to capture these changes in terms of the parametersof the Gompertz function which provides an intuitive pa-rameterization representing delay, growth, and asymptoticvalues for each region.
In contrast to previous studies, we use an explicit growthfunction (the Gompertz function) and a nonlinear mixedeffect modeling scheme (Pinheiro and Bates, 2000). Ina nonlinear mixed effects model, the diffusion parametersare modeled in a hierarchical fashion, with fixed-effect rep-resenting the overall population trend, and random effectassociated with each individual. Nonlinear mixed effectmodels are suited for longitudinal data where each sub-jects has repeated scans with the possibility of missingdata points and uneven spacing between scans of all theindividuals in the group. Unlike most previous studiesof early brain development, we make use of longitudinalimaging where each subject is imaged repeatedly over thefirst few years of life. This enables a more accurate char-acterization of developmental pattern (Giedd et al., 1999).Nonlinear mixed effect model provides a direct way of es-timating individual trajectories along with longitudinallyderived typical developmental curves as illustrated in Fig-ure 2. This leads to the characterization of a normativemodel for healthy developmental patterns and estimationof personalized, individual trajectories of growth, whichis a property that will be desirable for comparison anddiagnostic assessment of individual subjects.
We apply our analysis framework to a set of white materregions that are known to have different patterns of growthto establish normative developmental patterns for each re-gion. Quantitative analysis of diffusion changes in theseregions provide further insight into brain maturation pro-cess and will enable prediction of subject-specific growth
Table 1: Distribution of scans across different time points. N indi-cates the number of subjects with the associated temporal pattern.
Available scans NNeonate scan only 21 year scan only 02 year scan only 0Neonate + 1 year scan 10Neonate + 2 year scan 21 year + 2 year scan 3Neonate + 1 year + 2 year scan 9
trajectory with the potential of detecting pathological de-viation related to brain disorders.
2. Materials and Methods
2.1. Subjects
This study was approved by the Institutional ReviewBoard of the University of North Carolina School ofMedicine. Children analyzed in this study are controlsin an ongoing longitudinal study of early brain develop-ment in high risk children (Geng et al., 2012). A total of26 control subjects were selected for this study. Scans ofthese subjects were obtained at around two-weeks, 1 yearand 2 years. Four of the subjects had sub-optimal scans at1 year that were removed, but their scans for other timepoints were kept. In total, we used 59 datasets, the tem-poral distribution of scan data is shown in table 1. Toensure maximal success rate of scanning, all subjects werefed, swaddled and fitted with ear protection. All subjectswere scanned without sedation during their natural sleep.
2.2. Image Acquisition and Data Processing
All images were acquired using a 3T Allegra head-onlyMR system using a single shot echo-planar spin echo dif-fusion tensor imaging sequence with the following param-eters: TR=5200 ms, TE=73 ms, slice thickness of 2 mmand in-plane resolution of 2x2 mm2. One image withoutdiffusion gradients (b=0) along with 6 gradient directionswith a b-value of 1000 mm3/s were acquired. The se-quence was repeated 5 times for improved single-to-noiseratio. All DWIs were checked and corrected for motionartifacts using the DTIChecker tool 1. Tensor maps werecalculated for each DTI scan using weighted least squarestensor estimation on the images that have been averagedover sequence repeats (Salvador et al., 2005). T2-weightedstructural images were obtained using turbo spin echo se-quence with TR= 7 s, TE=15 and 90 ms, slice thicknessof 1.95 mm and in-plane resolution of 1.25 x1.25 mm2.T2W and baseline DWI of all the subjects’ scans wereskull stripped using Brain Extraction Tool (BET) (Smith,2002).
1http://www.ia.unc.edu/dev/download/dtichecker
2
Due to significant contrast changes in early brain de-velopment, we utilized two registration frameworks: onefor intra-subject and inter-modality registration, and theother for inter-subject registration. For inter-subject regis-tration, we applied the unbiased atlas building frameworkof Joshi et al. (Joshi et al., 2004) based on the Large Defor-mation Diffeomorphic Metric Mapping (LDDMM) (Milleret al., 2002) to the set of T2W images of scans at year 1 toobtain spatial mappings between all subjects through theestimated atlas coordinate system. Intra-subject registra-tion was performed by IRTK software 2 All time pointsof each subject are registered to the unbiased atlas vialinear and non-linear transformations, first by mappingthese images to the year 1 scan and then cascading thetwo transformations for a mapping to the atlas. Detailson the registration methods and parameters are summa-rized in Appendix A. The tensors are registered to the at-las using transformations obtained by registering the DTIbaseline (B0) images to T2W images. Tensors are resam-pled using finite strain reorientation and Riemannian in-terpolation (Alexander et al., 2001; Pennec et al., 2006;Fletcher and Joshi, 2007). After all the images are trans-formed into the atlas space, the tensors are averaged usingthe log-Euclidean method to produce a tensor atlas (Ar-signy et al., 2006). In this study, we extract the mean,axial, radial diffusivity, and fractional anisotropy featuresfrom the registered tensors, MD = λ1+λ2+λ3
3 , AD = λ1,
RD = λ2+λ3
2 and FA =√
12
√(λ1−λ2)2+(λ1−λ3)2+(λ2−λ3)2√
λ21+λ
22+λ
23
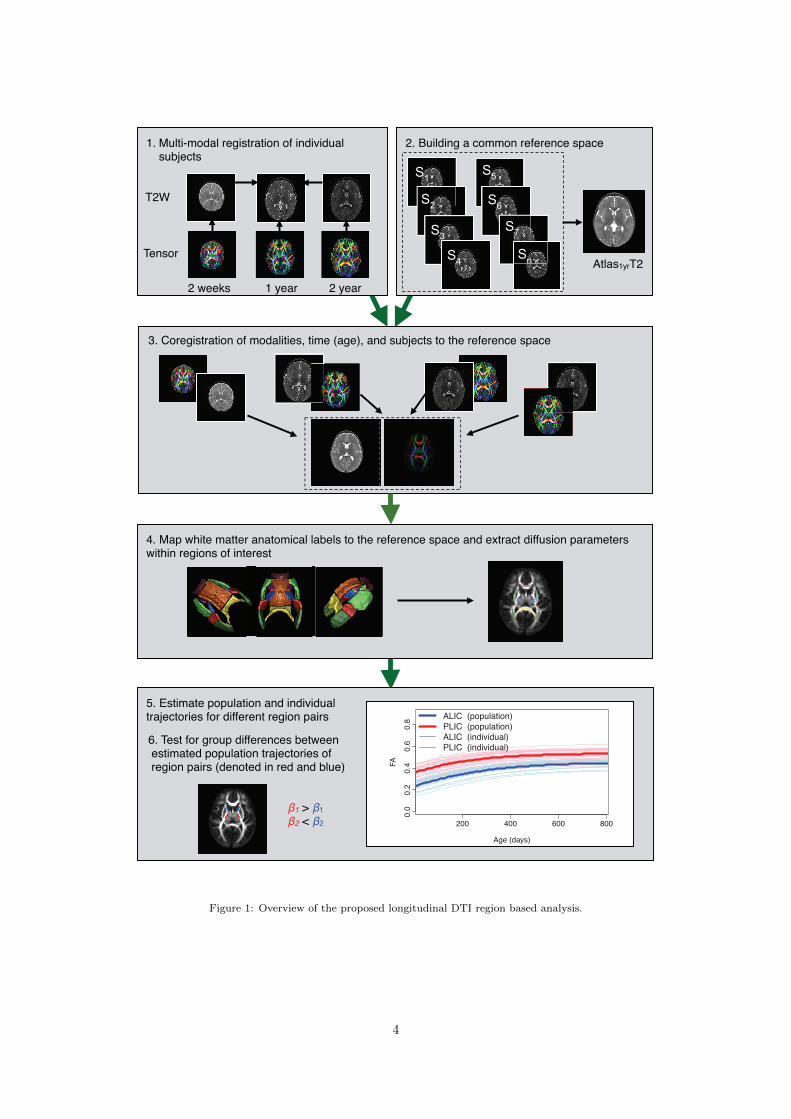
where λi are the eigenvalues of the tensor sorted fromlargest to smallest. Figure 1 shows an overview of ourmethod and analysis workflow.
2.3. Nonlinear Mixed Effects Model
In this subsection, we describe the nonlinear mixed ef-fects model used to analyze the longitudinal DTI data.Compared to a nonlinear least squares (NLS) method, anonlinear mixed effects (NLME) model does not assumethat the sample data points are independent and identi-cally distributed, rather it assumes that there is correlationacross repeated measurements. Also, the average trend es-timated based on the mixed effect model is an average ofindividual trajectories rather than a least squares fit tothe individual data points. This results in better repre-sentation of trajectories in the population as illustrated inFigure 2.
2.3.1. Model Formulation
In the mixed effects model, the observed data is a com-bination of fixed effects which are parameters associated
2http://www.doc.ic.ac.uk/~dr/software, using affine and non-linear registration method of (Rueckert et al., 1999) using normalizedmutual information as the image match metric (Studholme et al.,1999) that appears robust to changing contrast properties in earlybrain development.
Age (days)
RD
0.004
0.005
0.006
0.007
0 200 400 600 800
Age (days)
0 200 400 600 800
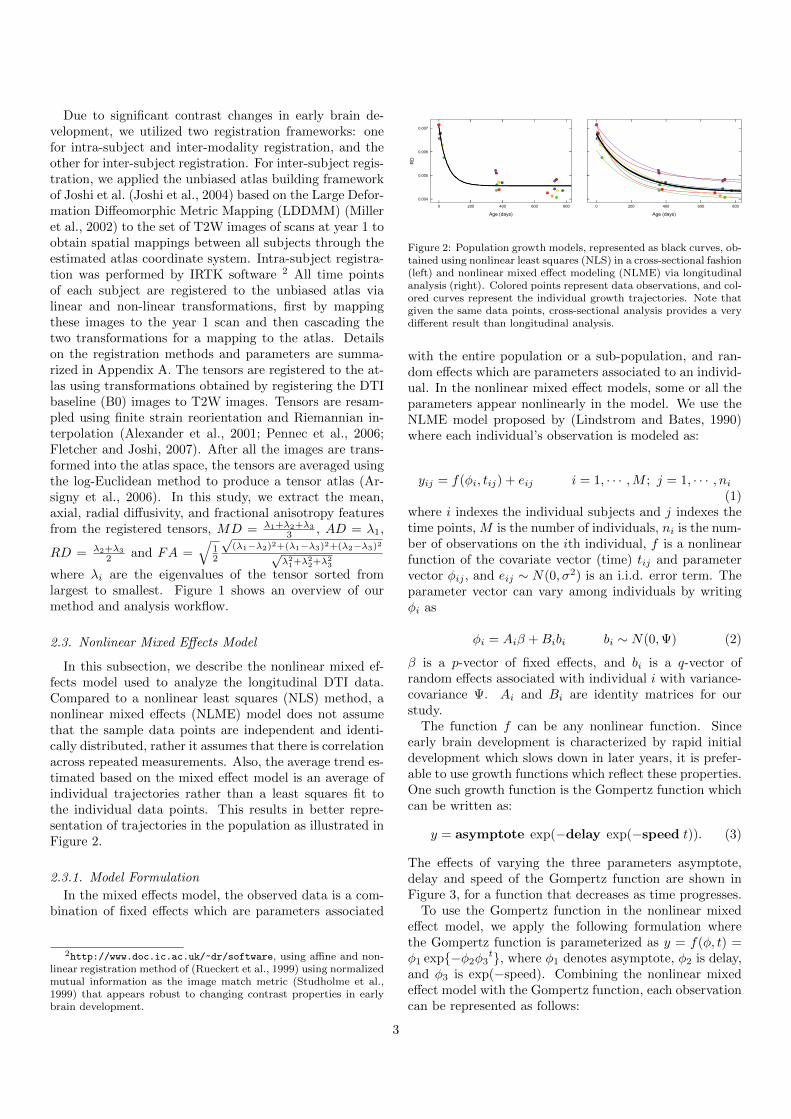
Figure 2: Population growth models, represented as black curves, ob-tained using nonlinear least squares (NLS) in a cross-sectional fashion(left) and nonlinear mixed effect modeling (NLME) via longitudinalanalysis (right). Colored points represent data observations, and col-ored curves represent the individual growth trajectories. Note thatgiven the same data points, cross-sectional analysis provides a verydifferent result than longitudinal analysis.
with the entire population or a sub-population, and ran-dom effects which are parameters associated to an individ-ual. In the nonlinear mixed effect models, some or all theparameters appear nonlinearly in the model. We use theNLME model proposed by (Lindstrom and Bates, 1990)where each individual’s observation is modeled as:
yij = f(φi, tij) + eij i = 1, · · · ,M ; j = 1, · · · , ni(1)
where i indexes the individual subjects and j indexes thetime points, M is the number of individuals, ni is the num-ber of observations on the ith individual, f is a nonlinearfunction of the covariate vector (time) tij and parametervector φij , and eij ∼ N(0, σ2) is an i.i.d. error term. Theparameter vector can vary among individuals by writingφi as
φi = Aiβ +Bibi bi ∼ N(0,Ψ) (2)
β is a p-vector of fixed effects, and bi is a q-vector ofrandom effects associated with individual i with variance-covariance Ψ. Ai and Bi are identity matrices for ourstudy.
The function f can be any nonlinear function. Sinceearly brain development is characterized by rapid initialdevelopment which slows down in later years, it is prefer-able to use growth functions which reflect these properties.One such growth function is the Gompertz function whichcan be written as:
y = asymptote exp(−delay exp(−speed t)). (3)
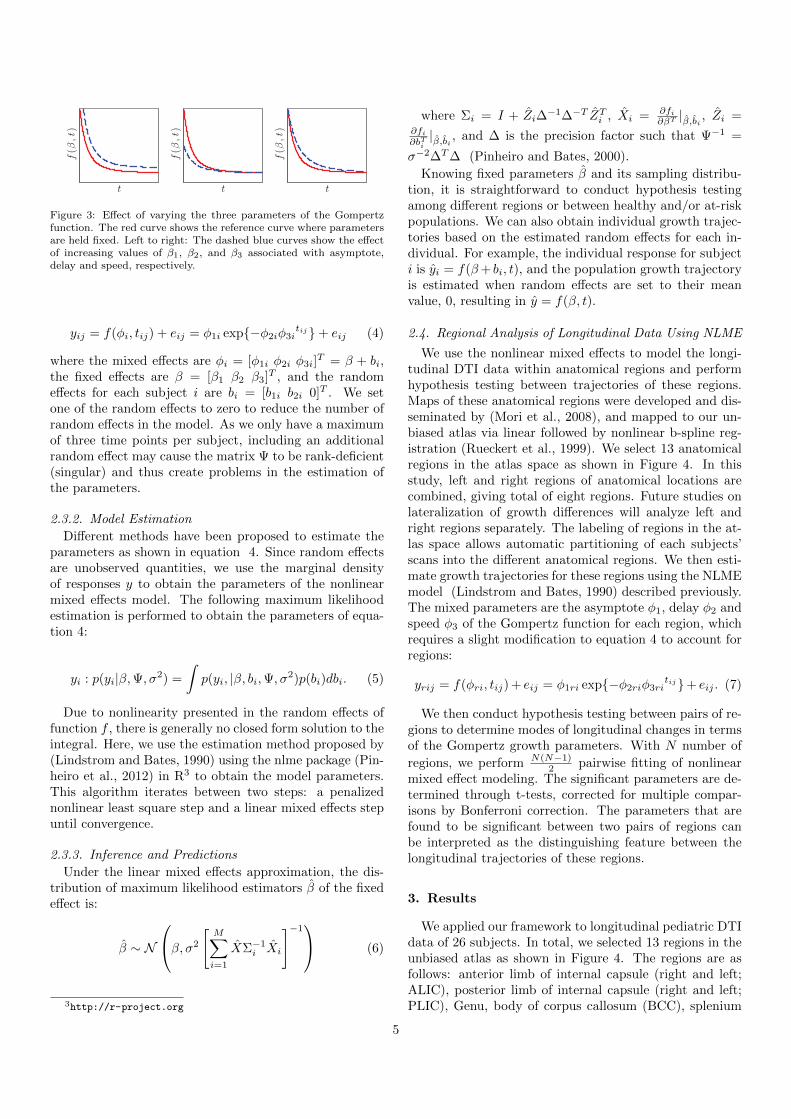
The effects of varying the three parameters asymptote,delay and speed of the Gompertz function are shown inFigure 3, for a function that decreases as time progresses.
To use the Gompertz function in the nonlinear mixedeffect model, we apply the following formulation wherethe Gompertz function is parameterized as y = f(φ, t) =φ1 exp{−φ2φ3t}, where φ1 denotes asymptote, φ2 is delay,and φ3 is exp(−speed). Combining the nonlinear mixedeffect model with the Gompertz function, each observationcan be represented as follows:
3
2. Building a common reference space1. Multi-modal registration of individual subjects
Atlas1yrT2
S1
S2
S3
S4
S5
S6
S7
Sn
3. Coregistration of modalities, time (age), and subjects to the reference space
Tensor
T2W
2 weeks 1 year 2 year
4. Map white matter anatomical labels to the reference space and extract diffusion parameters within regions of interest
5. Estimate population and individual trajectories for different region pairs
6. Test for group differences between estimated population trajectories of region pairs (denoted in red and blue)
β1 > β1
β2 < β2 200 400 600 800
0.0
0.2
0.4
0.6
0.8
Age (days)
FA
ALIC (population)
PLIC (population)
ALIC (individual)
PLIC (individual)
Figure 1: Overview of the proposed longitudinal DTI region based analysis.
4
t
f(β
,t)
t
f(β
,t)
t
f(β
,t)
Figure 3: Effect of varying the three parameters of the Gompertzfunction. The red curve shows the reference curve where parametersare held fixed. Left to right: The dashed blue curves show the effectof increasing values of β1, β2, and β3 associated with asymptote,delay and speed, respectively.
yij = f(φi, tij) + eij = φ1i exp{−φ2iφ3itij}+ eij (4)
where the mixed effects are φi = [φ1i φ2i φ3i]T = β + bi,
the fixed effects are β = [β1 β2 β3]T , and the randomeffects for each subject i are bi = [b1i b2i 0]T . We setone of the random effects to zero to reduce the number ofrandom effects in the model. As we only have a maximumof three time points per subject, including an additionalrandom effect may cause the matrix Ψ to be rank-deficient(singular) and thus create problems in the estimation ofthe parameters.
2.3.2. Model Estimation
Different methods have been proposed to estimate theparameters as shown in equation 4. Since random effectsare unobserved quantities, we use the marginal densityof responses y to obtain the parameters of the nonlinearmixed effects model. The following maximum likelihoodestimation is performed to obtain the parameters of equa-tion 4:
yi : p(yi|β,Ψ, σ2) =
∫p(yi, |β, bi,Ψ, σ2)p(bi)dbi. (5)
Due to nonlinearity presented in the random effects offunction f , there is generally no closed form solution to theintegral. Here, we use the estimation method proposed by(Lindstrom and Bates, 1990) using the nlme package (Pin-heiro et al., 2012) in R3 to obtain the model parameters.This algorithm iterates between two steps: a penalizednonlinear least square step and a linear mixed effects stepuntil convergence.
2.3.3. Inference and Predictions
Under the linear mixed effects approximation, the dis-tribution of maximum likelihood estimators β of the fixedeffect is:
β ∼ N
β, σ2
[M∑i=1
XΣ−1i Xi
]−1 (6)
3http://r-project.org
where Σi = I + Zi∆−1∆−T ZTi , Xi = ∂fi
∂βT |β,bi , Zi =∂fi∂bTi|β,bi , and ∆ is the precision factor such that Ψ−1 =
σ−2∆T∆ (Pinheiro and Bates, 2000).
Knowing fixed parameters β and its sampling distribu-tion, it is straightforward to conduct hypothesis testingamong different regions or between healthy and/or at-riskpopulations. We can also obtain individual growth trajec-tories based on the estimated random effects for each in-dividual. For example, the individual response for subjecti is yi = f(β+ bi, t), and the population growth trajectoryis estimated when random effects are set to their meanvalue, 0, resulting in y = f(β, t).
2.4. Regional Analysis of Longitudinal Data Using NLME
We use the nonlinear mixed effects to model the longi-tudinal DTI data within anatomical regions and performhypothesis testing between trajectories of these regions.Maps of these anatomical regions were developed and dis-seminated by (Mori et al., 2008), and mapped to our un-biased atlas via linear followed by nonlinear b-spline reg-istration (Rueckert et al., 1999). We select 13 anatomicalregions in the atlas space as shown in Figure 4. In thisstudy, left and right regions of anatomical locations arecombined, giving total of eight regions. Future studies onlateralization of growth differences will analyze left andright regions separately. The labeling of regions in the at-las space allows automatic partitioning of each subjects’scans into the different anatomical regions. We then esti-mate growth trajectories for these regions using the NLMEmodel (Lindstrom and Bates, 1990) described previously.The mixed parameters are the asymptote φ1, delay φ2 andspeed φ3 of the Gompertz function for each region, whichrequires a slight modification to equation 4 to account forregions:
yrij = f(φri, tij) + eij = φ1ri exp{−φ2riφ3ritij}+ eij . (7)
We then conduct hypothesis testing between pairs of re-gions to determine modes of longitudinal changes in termsof the Gompertz growth parameters. With N number of
regions, we perform N(N−1)2 pairwise fitting of nonlinear
mixed effect modeling. The significant parameters are de-termined through t-tests, corrected for multiple compar-isons by Bonferroni correction. The parameters that arefound to be significant between two pairs of regions canbe interpreted as the distinguishing feature between thelongitudinal trajectories of these regions.
3. Results
We applied our framework to longitudinal pediatric DTIdata of 26 subjects. In total, we selected 13 regions in theunbiased atlas as shown in Figure 4. The regions are asfollows: anterior limb of internal capsule (right and left;ALIC), posterior limb of internal capsule (right and left;PLIC), Genu, body of corpus callosum (BCC), splenium
5
0 200 400 600
0.1
0.3
0.5
0.7
Age (days)
FA
0 200 400 600
0.0
00
50.0
01
5
Age (days)
MD
(m
m2
s)
ALIC
PLIC
Genu
BCC
Sp
ExCap
RLIC
PTR
ALIC
PLIC
Genu
BCC
Sp
ExCap
RLIC
PTR
ALIC
PLIC
Genu
BCC
Sp
ExCap
RLIC
PTR
ALIC
PLIC
Genu
BCC
Sp
ExCap
RLIC
PTR
ALIC
PLIC
Genu
BCC
Sp
ExCap
RLIC
PTR
ALIC
PLIC
Genu
BCC
Sp
ExCap
RLIC
PTR
ALIC
PLIC
Genu
BCC
Sp
ExCap
RLIC
PTR
0 200 400 600
0.0
00
50.0
01
5
Age (days)
AD
(m
m2
s)
0 200 400 600
0.0
00
50.0
01
5
Age (days)
RD
(m
m2
s)
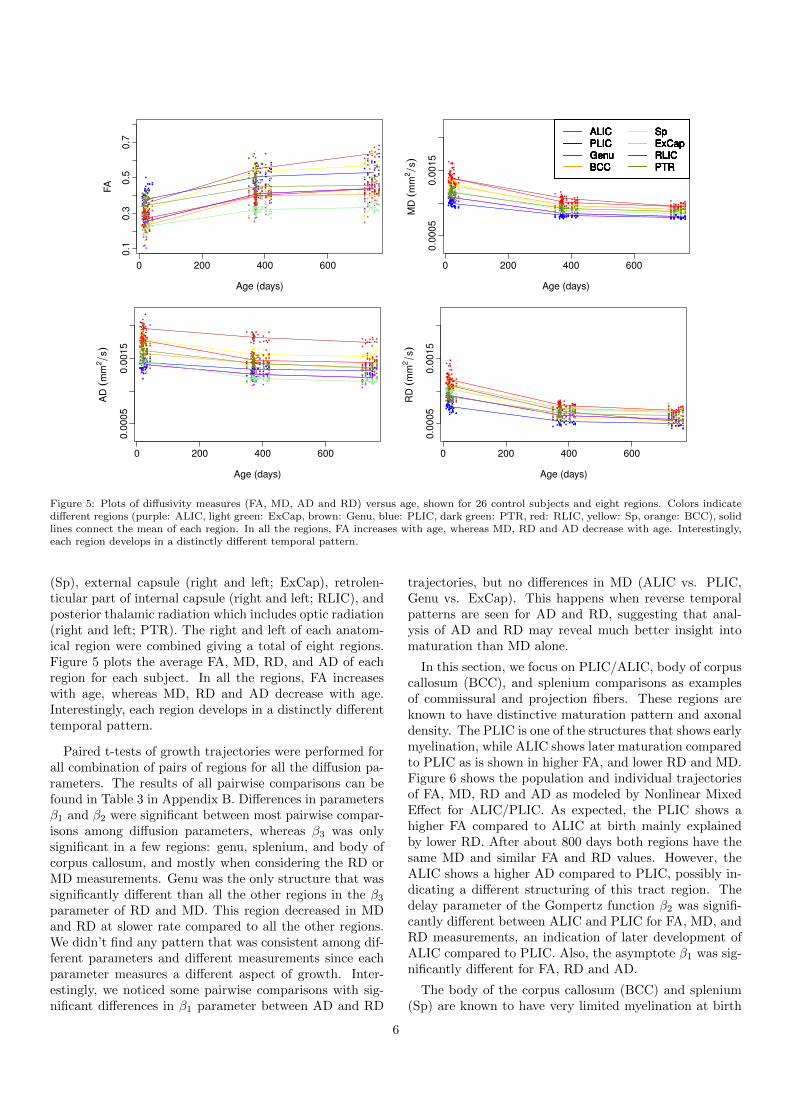
Figure 5: Plots of diffusivity measures (FA, MD, AD and RD) versus age, shown for 26 control subjects and eight regions. Colors indicatedifferent regions (purple: ALIC, light green: ExCap, brown: Genu, blue: PLIC, dark green: PTR, red: RLIC, yellow: Sp, orange: BCC), solidlines connect the mean of each region. In all the regions, FA increases with age, whereas MD, RD and AD decrease with age. Interestingly,each region develops in a distinctly different temporal pattern.
(Sp), external capsule (right and left; ExCap), retrolen-ticular part of internal capsule (right and left; RLIC), andposterior thalamic radiation which includes optic radiation(right and left; PTR). The right and left of each anatom-ical region were combined giving a total of eight regions.Figure 5 plots the average FA, MD, RD, and AD of eachregion for each subject. In all the regions, FA increaseswith age, whereas MD, RD and AD decrease with age.Interestingly, each region develops in a distinctly differenttemporal pattern.
Paired t-tests of growth trajectories were performed forall combination of pairs of regions for all the diffusion pa-rameters. The results of all pairwise comparisons can befound in Table 3 in Appendix B. Differences in parametersβ1 and β2 were significant between most pairwise compar-isons among diffusion parameters, whereas β3 was onlysignificant in a few regions: genu, splenium, and body ofcorpus callosum, and mostly when considering the RD orMD measurements. Genu was the only structure that wassignificantly different than all the other regions in the β3parameter of RD and MD. This region decreased in MDand RD at slower rate compared to all the other regions.We didn’t find any pattern that was consistent among dif-ferent parameters and different measurements since eachparameter measures a different aspect of growth. Inter-estingly, we noticed some pairwise comparisons with sig-nificant differences in β1 parameter between AD and RD
trajectories, but no differences in MD (ALIC vs. PLIC,Genu vs. ExCap). This happens when reverse temporalpatterns are seen for AD and RD, suggesting that anal-ysis of AD and RD may reveal much better insight intomaturation than MD alone.
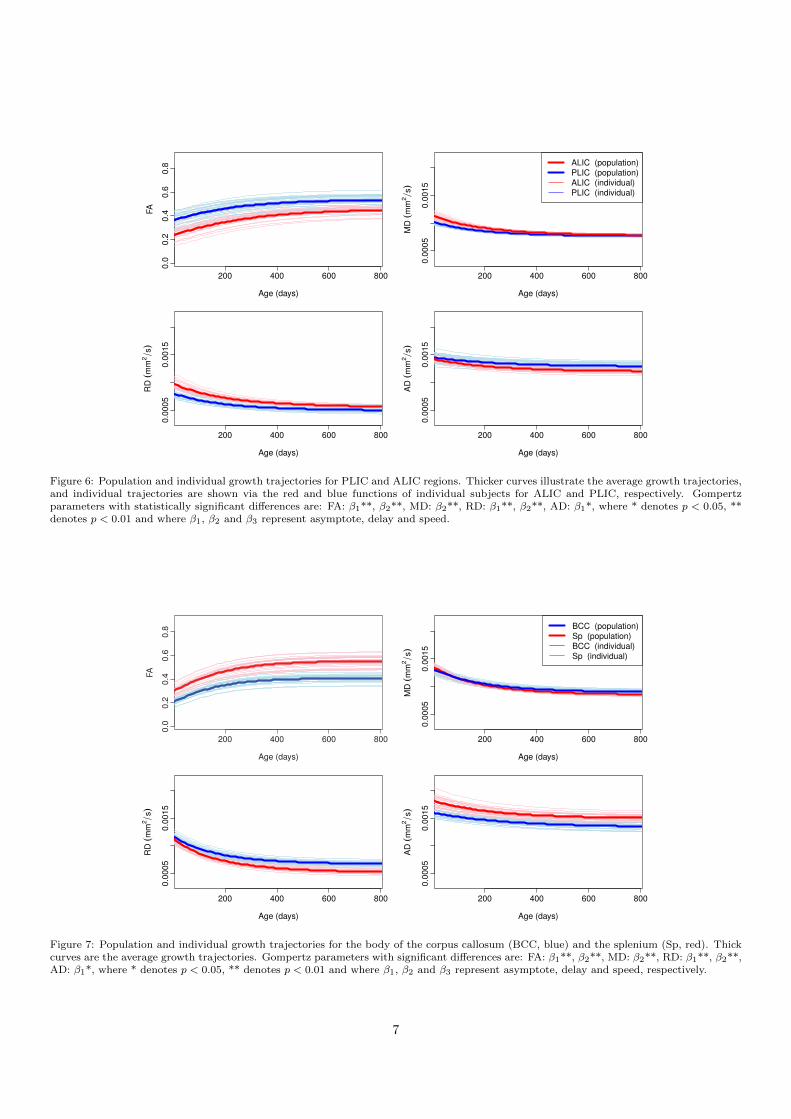
In this section, we focus on PLIC/ALIC, body of corpuscallosum (BCC), and splenium comparisons as examplesof commissural and projection fibers. These regions areknown to have distinctive maturation pattern and axonaldensity. The PLIC is one of the structures that shows earlymyelination, while ALIC shows later maturation comparedto PLIC as is shown in higher FA, and lower RD and MD.Figure 6 shows the population and individual trajectoriesof FA, MD, RD and AD as modeled by Nonlinear MixedEffect for ALIC/PLIC. As expected, the PLIC shows ahigher FA compared to ALIC at birth mainly explainedby lower RD. After about 800 days both regions have thesame MD and similar FA and RD values. However, theALIC shows a higher AD compared to PLIC, possibly in-dicating a different structuring of this tract region. Thedelay parameter of the Gompertz function β2 was signifi-cantly different between ALIC and PLIC for FA, MD, andRD measurements, an indication of later development ofALIC compared to PLIC. Also, the asymptote β1 was sig-nificantly different for FA, RD and AD.
The body of the corpus callosum (BCC) and splenium(Sp) are known to have very limited myelination at birth
6
200 400 600 800
0.0
0.2
0.4
0.6
0.8
Age (days)
FA
200 400 600 800
0.0
005
0.0
015
Age (days)
MD
(m
m2
s)
ALIC (population)
PLIC (population)
ALIC (individual)
PLIC (individual)
200 400 600 800
0.0
005
0.0
015
Age (days)
RD
(m
m2
s)
200 400 600 800
0.0
005
0.0
015
Age (days)
AD
(m
m2
s)
Figure 6: Population and individual growth trajectories for PLIC and ALIC regions. Thicker curves illustrate the average growth trajectories,and individual trajectories are shown via the red and blue functions of individual subjects for ALIC and PLIC, respectively. Gompertzparameters with statistically significant differences are: FA: β1**, β2**, MD: β2**, RD: β1**, β2**, AD: β1*, where * denotes p < 0.05, **denotes p < 0.01 and where β1, β2 and β3 represent asymptote, delay and speed.
200 400 600 800
0.0
0.2
0.4
0.6
0.8
Age (days)
FA
200 400 600 800
0.0
005
0.0
015
Age (days)
MD
(m
m2
s)
BCC (population)
Sp (population)
BCC (individual)
Sp (individual)
200 400 600 800
0.0
005
0.0
015
Age (days)
RD
(m
m2
s)
200 400 600 800
0.0
005
0.0
015
Age (days)
AD
(m
m2
s)
Figure 7: Population and individual growth trajectories for the body of the corpus callosum (BCC, blue) and the splenium (Sp, red). Thickcurves are the average growth trajectories. Gompertz parameters with significant differences are: FA: β1**, β2**, MD: β2**, RD: β1**, β2**,AD: β1*, where * denotes p < 0.05, ** denotes p < 0.01 and where β1, β2 and β3 represent asymptote, delay and speed, respectively.
7
PLIC (blue) vs. ALIC (red) PLIC (blue) vs. Sp (red) PLIC (blue) vs. BCC (red)
200 400 600 800
0.2
0.4
0.6
0.8
FA
200 400 600 800
0.2
0.4
0.6
0.8
Age (days)
FA
200 400 600 800
0.2
0.4
0.6
0.8
Age (days)
FA
200 400 600 800
0.0
00
50
.00
15
Age (days)
RD
(m
m2
s)
200 400 600 800
0.0
00
50
.00
15
Age (days)
RD
(m
m2
s)
200 400 600 800
0.0
00
50
.00
15
Age (days)
RD
(m
m2
s)
200 400 600 800
0.0
00
50
.00
15
Age (days)
AD
(m
m2
s)
200 400 600 800
0.0
00
50
.00
15
Age (days)
AD
(m
m2
s)
200 400 600 800
0.0
00
50
.00
15
Age (days)
AD
(m
m2
s)
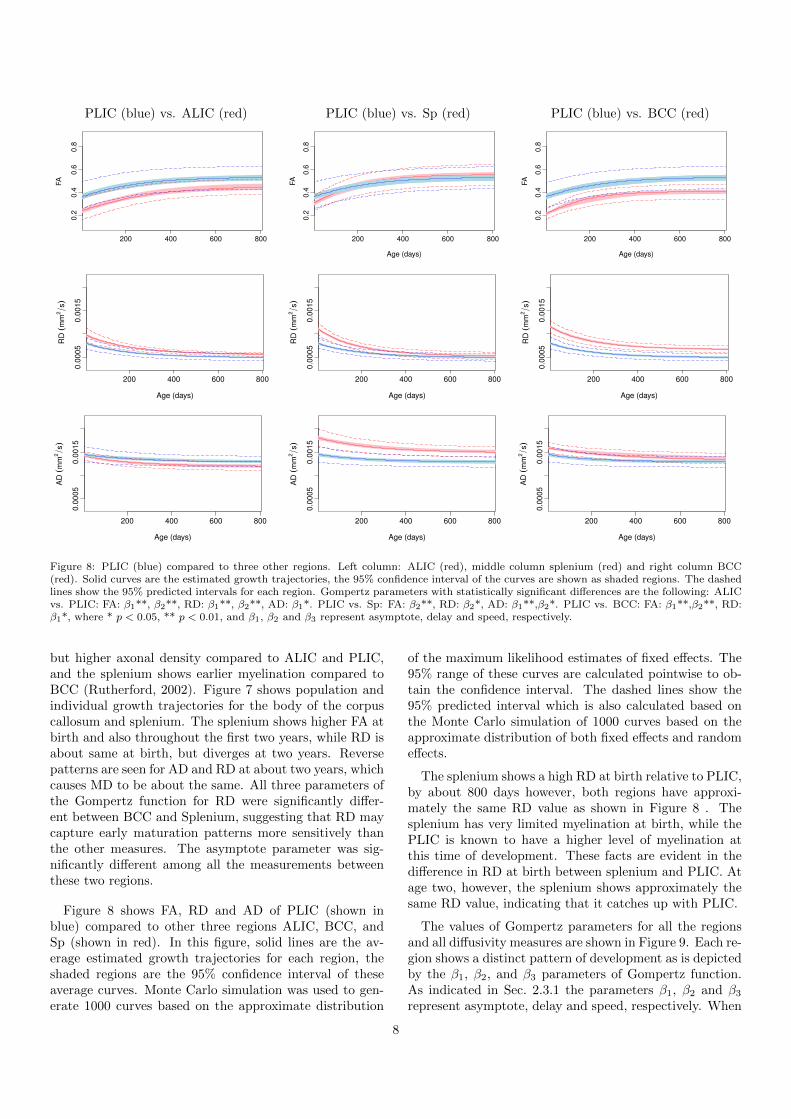
Figure 8: PLIC (blue) compared to three other regions. Left column: ALIC (red), middle column splenium (red) and right column BCC(red). Solid curves are the estimated growth trajectories, the 95% confidence interval of the curves are shown as shaded regions. The dashedlines show the 95% predicted intervals for each region. Gompertz parameters with statistically significant differences are the following: ALICvs. PLIC: FA: β1**, β2**, RD: β1**, β2**, AD: β1*. PLIC vs. Sp: FA: β2**, RD: β2*, AD: β1**,β2*. PLIC vs. BCC: FA: β1**,β2**, RD:β1*, where * p < 0.05, ** p < 0.01, and β1, β2 and β3 represent asymptote, delay and speed, respectively.
but higher axonal density compared to ALIC and PLIC,and the splenium shows earlier myelination compared toBCC (Rutherford, 2002). Figure 7 shows population andindividual growth trajectories for the body of the corpuscallosum and splenium. The splenium shows higher FA atbirth and also throughout the first two years, while RD isabout same at birth, but diverges at two years. Reversepatterns are seen for AD and RD at about two years, whichcauses MD to be about the same. All three parameters ofthe Gompertz function for RD were significantly differ-ent between BCC and Splenium, suggesting that RD maycapture early maturation patterns more sensitively thanthe other measures. The asymptote parameter was sig-nificantly different among all the measurements betweenthese two regions.
Figure 8 shows FA, RD and AD of PLIC (shown inblue) compared to other three regions ALIC, BCC, andSp (shown in red). In this figure, solid lines are the av-erage estimated growth trajectories for each region, theshaded regions are the 95% confidence interval of theseaverage curves. Monte Carlo simulation was used to gen-erate 1000 curves based on the approximate distribution
of the maximum likelihood estimates of fixed effects. The95% range of these curves are calculated pointwise to ob-tain the confidence interval. The dashed lines show the95% predicted interval which is also calculated based onthe Monte Carlo simulation of 1000 curves based on theapproximate distribution of both fixed effects and randomeffects.
The splenium shows a high RD at birth relative to PLIC,by about 800 days however, both regions have approxi-mately the same RD value as shown in Figure 8 . Thesplenium has very limited myelination at birth, while thePLIC is known to have a higher level of myelination atthis time of development. These facts are evident in thedifference in RD at birth between splenium and PLIC. Atage two, however, the splenium shows approximately thesame RD value, indicating that it catches up with PLIC.
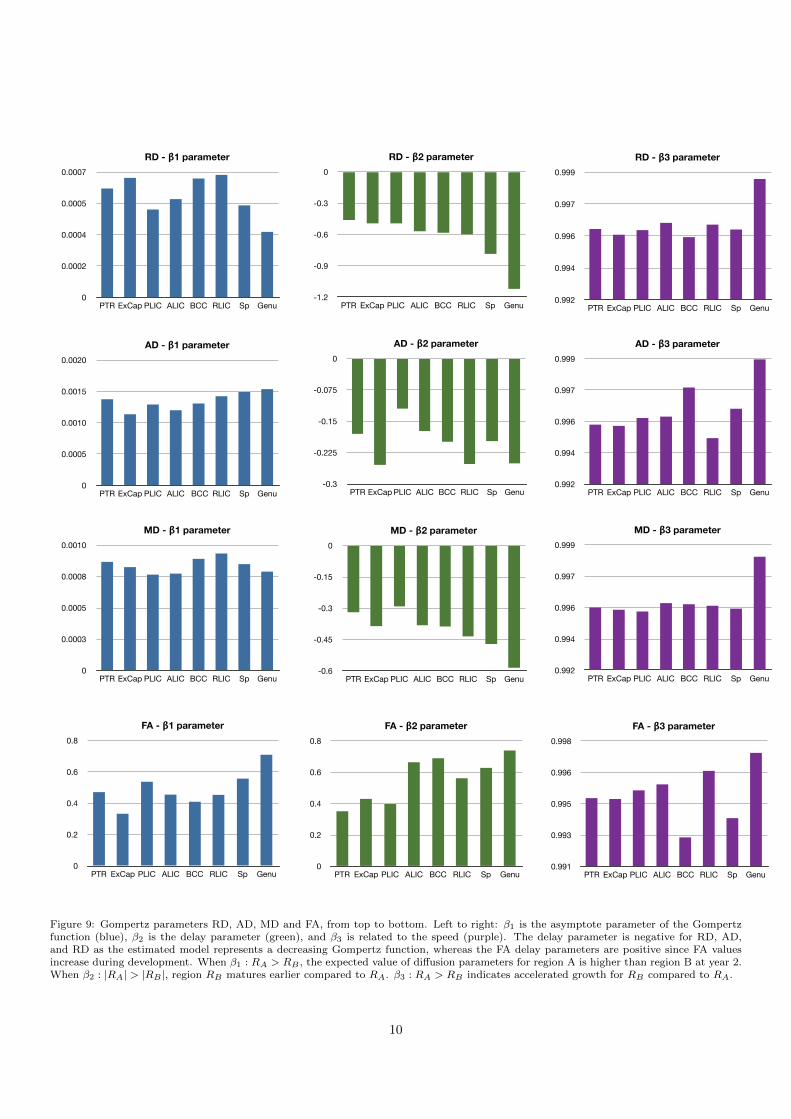
The values of Gompertz parameters for all the regionsand all diffusivity measures are shown in Figure 9. Each re-gion shows a distinct pattern of development as is depictedby the β1, β2, and β3 parameters of Gompertz function.As indicated in Sec. 2.3.1 the parameters β1, β2 and β3represent asymptote, delay and speed, respectively. When
8
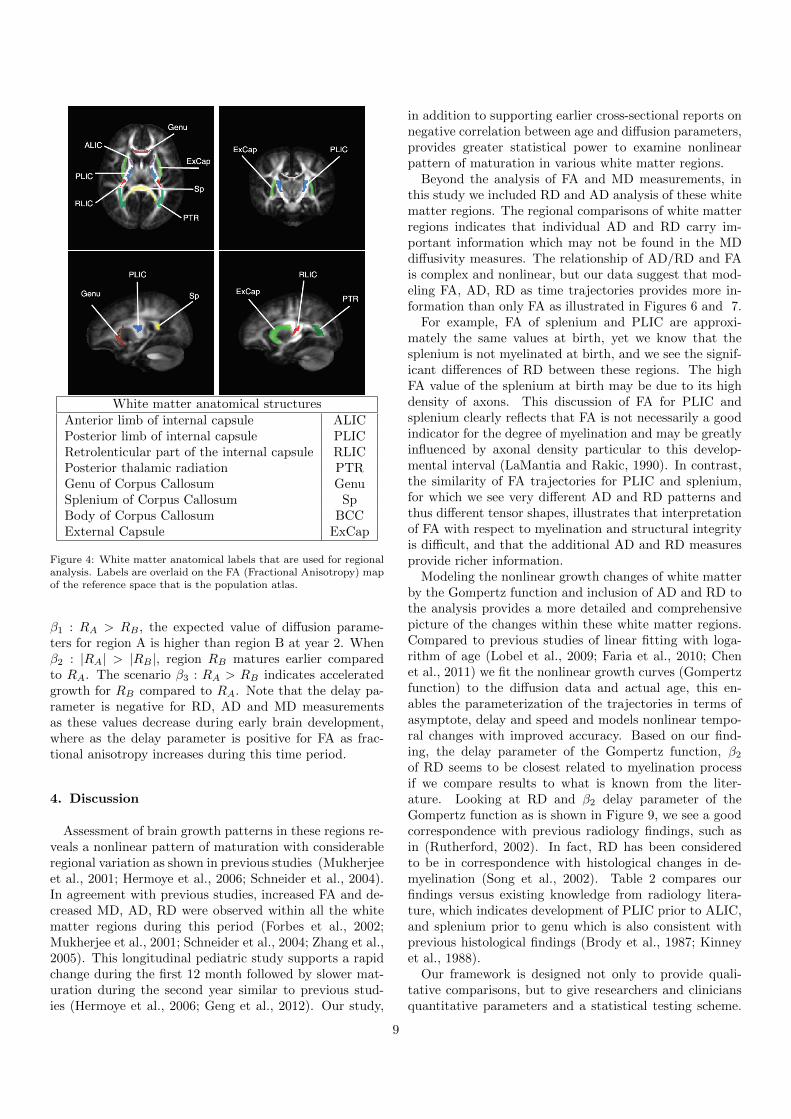
White matter anatomical structuresAnterior limb of internal capsule ALICPosterior limb of internal capsule PLICRetrolenticular part of the internal capsule RLICPosterior thalamic radiation PTRGenu of Corpus Callosum GenuSplenium of Corpus Callosum SpBody of Corpus Callosum BCCExternal Capsule ExCap
Figure 4: White matter anatomical labels that are used for regionalanalysis. Labels are overlaid on the FA (Fractional Anisotropy) mapof the reference space that is the population atlas.
β1 : RA > RB , the expected value of diffusion parame-ters for region A is higher than region B at year 2. Whenβ2 : |RA| > |RB |, region RB matures earlier comparedto RA. The scenario β3 : RA > RB indicates acceleratedgrowth for RB compared to RA. Note that the delay pa-rameter is negative for RD, AD and MD measurementsas these values decrease during early brain development,where as the delay parameter is positive for FA as frac-tional anisotropy increases during this time period.
4. Discussion
Assessment of brain growth patterns in these regions re-veals a nonlinear pattern of maturation with considerableregional variation as shown in previous studies (Mukherjeeet al., 2001; Hermoye et al., 2006; Schneider et al., 2004).In agreement with previous studies, increased FA and de-creased MD, AD, RD were observed within all the whitematter regions during this period (Forbes et al., 2002;Mukherjee et al., 2001; Schneider et al., 2004; Zhang et al.,2005). This longitudinal pediatric study supports a rapidchange during the first 12 month followed by slower mat-uration during the second year similar to previous stud-ies (Hermoye et al., 2006; Geng et al., 2012). Our study,
in addition to supporting earlier cross-sectional reports onnegative correlation between age and diffusion parameters,provides greater statistical power to examine nonlinearpattern of maturation in various white matter regions.
Beyond the analysis of FA and MD measurements, inthis study we included RD and AD analysis of these whitematter regions. The regional comparisons of white matterregions indicates that individual AD and RD carry im-portant information which may not be found in the MDdiffusivity measures. The relationship of AD/RD and FAis complex and nonlinear, but our data suggest that mod-eling FA, AD, RD as time trajectories provides more in-formation than only FA as illustrated in Figures 6 and 7.
For example, FA of splenium and PLIC are approxi-mately the same values at birth, yet we know that thesplenium is not myelinated at birth, and we see the signif-icant differences of RD between these regions. The highFA value of the splenium at birth may be due to its highdensity of axons. This discussion of FA for PLIC andsplenium clearly reflects that FA is not necessarily a goodindicator for the degree of myelination and may be greatlyinfluenced by axonal density particular to this develop-mental interval (LaMantia and Rakic, 1990). In contrast,the similarity of FA trajectories for PLIC and splenium,for which we see very different AD and RD patterns andthus different tensor shapes, illustrates that interpretationof FA with respect to myelination and structural integrityis difficult, and that the additional AD and RD measuresprovide richer information.
Modeling the nonlinear growth changes of white matterby the Gompertz function and inclusion of AD and RD tothe analysis provides a more detailed and comprehensivepicture of the changes within these white matter regions.Compared to previous studies of linear fitting with loga-rithm of age (Lobel et al., 2009; Faria et al., 2010; Chenet al., 2011) we fit the nonlinear growth curves (Gompertzfunction) to the diffusion data and actual age, this en-ables the parameterization of the trajectories in terms ofasymptote, delay and speed and models nonlinear tempo-ral changes with improved accuracy. Based on our find-ing, the delay parameter of the Gompertz function, β2of RD seems to be closest related to myelination processif we compare results to what is known from the liter-ature. Looking at RD and β2 delay parameter of theGompertz function as is shown in Figure 9, we see a goodcorrespondence with previous radiology findings, such asin (Rutherford, 2002). In fact, RD has been consideredto be in correspondence with histological changes in de-myelination (Song et al., 2002). Table 2 compares ourfindings versus existing knowledge from radiology litera-ture, which indicates development of PLIC prior to ALIC,and splenium prior to genu which is also consistent withprevious histological findings (Brody et al., 1987; Kinneyet al., 1988).
Our framework is designed not only to provide quali-tative comparisons, but to give researchers and cliniciansquantitative parameters and a statistical testing scheme.
9
-0.199055357
-1.2
-0.9
-0.6
-0.3
0
PTR ExCap PLIC ALIC BCC RLIC Sp Genu
RD - β2 parameter
0.992
0.994
0.996
0.997
0.999
PTR ExCap PLIC ALIC BCC RLIC Sp Genu
RD - β3 parameter
-0.6
-0.45
-0.3
-0.15
0
PTR ExCap PLIC ALIC BCC RLIC Sp Genu
MD - β2 parameter
0.992
0.994
0.996
0.997
0.999
PTR ExCap PLIC ALIC BCC RLIC Sp Genu
MD - β3 parameter
0
0.2
0.4
0.6
0.8
PTR ExCap PLIC ALIC BCC RLIC Sp Genu
FA - β2 parameter
0.991
0.993
0.995
0.996
0.998
PTR ExCap PLIC ALIC BCC RLIC Sp Genu
FA - β3 parameter
0.992
0.994
0.996
0.997
0.999
PTR ExCap PLIC ALIC BCC RLIC Sp Genu
AD - β3 parameter
-0.3
-0.225
-0.15
-0.075
0
PTR ExCap PLIC ALIC BCC RLIC Sp Genu
AD - β2 parameter
0
0.0005
0.0010
0.0015
0.0020
PTR ExCap PLIC ALIC BCC RLIC Sp Genu
AD - β1 parameter
0
0.0002
0.0004
0.0005
0.0007
PTR ExCap PLIC ALIC BCC RLIC Sp Genu
RD - β1 parameter
0
0.0003
0.0005
0.0008
0.0010
PTR ExCap PLIC ALIC BCC RLIC Sp Genu
MD - β1 parameter
0
0.2
0.4
0.6
0.8
PTR ExCap PLIC ALIC BCC RLIC Sp Genu
FA - β1 parameter
Figure 9: Gompertz parameters RD, AD, MD and FA, from top to bottom. Left to right: β1 is the asymptote parameter of the Gompertzfunction (blue), β2 is the delay parameter (green), and β3 is related to the speed (purple). The delay parameter is negative for RD, AD,and RD as the estimated model represents a decreasing Gompertz function, whereas the FA delay parameters are positive since FA valuesincrease during development. When β1 : RA > RB , the expected value of diffusion parameters for region A is higher than region B at year 2.When β2 : |RA| > |RB |, region RB matures earlier compared to RA. β3 : RA > RB indicates accelerated growth for RB compared to RA.
10
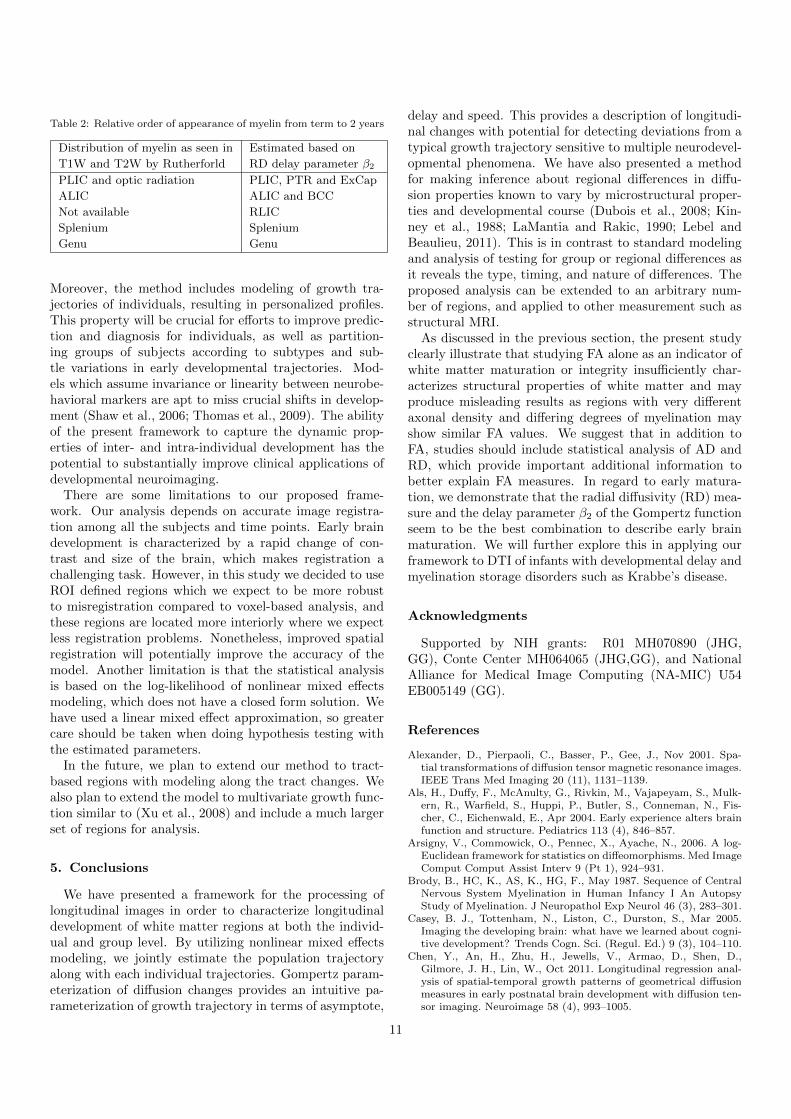
Table 2: Relative order of appearance of myelin from term to 2 years
Distribution of myelin as seen in Estimated based on
T1W and T2W by Rutherforld RD delay parameter β2
PLIC and optic radiation PLIC, PTR and ExCap
ALIC ALIC and BCC
Not available RLIC
Splenium Splenium
Genu Genu
Moreover, the method includes modeling of growth tra-jectories of individuals, resulting in personalized profiles.This property will be crucial for efforts to improve predic-tion and diagnosis for individuals, as well as partition-ing groups of subjects according to subtypes and sub-tle variations in early developmental trajectories. Mod-els which assume invariance or linearity between neurobe-havioral markers are apt to miss crucial shifts in develop-ment (Shaw et al., 2006; Thomas et al., 2009). The abilityof the present framework to capture the dynamic prop-erties of inter- and intra-individual development has thepotential to substantially improve clinical applications ofdevelopmental neuroimaging.
There are some limitations to our proposed frame-work. Our analysis depends on accurate image registra-tion among all the subjects and time points. Early braindevelopment is characterized by a rapid change of con-trast and size of the brain, which makes registration achallenging task. However, in this study we decided to useROI defined regions which we expect to be more robustto misregistration compared to voxel-based analysis, andthese regions are located more interiorly where we expectless registration problems. Nonetheless, improved spatialregistration will potentially improve the accuracy of themodel. Another limitation is that the statistical analysisis based on the log-likelihood of nonlinear mixed effectsmodeling, which does not have a closed form solution. Wehave used a linear mixed effect approximation, so greatercare should be taken when doing hypothesis testing withthe estimated parameters.
In the future, we plan to extend our method to tract-based regions with modeling along the tract changes. Wealso plan to extend the model to multivariate growth func-tion similar to (Xu et al., 2008) and include a much largerset of regions for analysis.
5. Conclusions
We have presented a framework for the processing oflongitudinal images in order to characterize longitudinaldevelopment of white matter regions at both the individ-ual and group level. By utilizing nonlinear mixed effectsmodeling, we jointly estimate the population trajectoryalong with each individual trajectories. Gompertz param-eterization of diffusion changes provides an intuitive pa-rameterization of growth trajectory in terms of asymptote,
delay and speed. This provides a description of longitudi-nal changes with potential for detecting deviations from atypical growth trajectory sensitive to multiple neurodevel-opmental phenomena. We have also presented a methodfor making inference about regional differences in diffu-sion properties known to vary by microstructural proper-ties and developmental course (Dubois et al., 2008; Kin-ney et al., 1988; LaMantia and Rakic, 1990; Lebel andBeaulieu, 2011). This is in contrast to standard modelingand analysis of testing for group or regional differences asit reveals the type, timing, and nature of differences. Theproposed analysis can be extended to an arbitrary num-ber of regions, and applied to other measurement such asstructural MRI.
As discussed in the previous section, the present studyclearly illustrate that studying FA alone as an indicator ofwhite matter maturation or integrity insufficiently char-acterizes structural properties of white matter and mayproduce misleading results as regions with very differentaxonal density and differing degrees of myelination mayshow similar FA values. We suggest that in addition toFA, studies should include statistical analysis of AD andRD, which provide important additional information tobetter explain FA measures. In regard to early matura-tion, we demonstrate that the radial diffusivity (RD) mea-sure and the delay parameter β2 of the Gompertz functionseem to be the best combination to describe early brainmaturation. We will further explore this in applying ourframework to DTI of infants with developmental delay andmyelination storage disorders such as Krabbe’s disease.
Acknowledgments
Supported by NIH grants: R01 MH070890 (JHG,GG), Conte Center MH064065 (JHG,GG), and NationalAlliance for Medical Image Computing (NA-MIC) U54EB005149 (GG).
References
Alexander, D., Pierpaoli, C., Basser, P., Gee, J., Nov 2001. Spa-tial transformations of diffusion tensor magnetic resonance images.IEEE Trans Med Imaging 20 (11), 1131–1139.
Als, H., Duffy, F., McAnulty, G., Rivkin, M., Vajapeyam, S., Mulk-ern, R., Warfield, S., Huppi, P., Butler, S., Conneman, N., Fis-cher, C., Eichenwald, E., Apr 2004. Early experience alters brainfunction and structure. Pediatrics 113 (4), 846–857.
Arsigny, V., Commowick, O., Pennec, X., Ayache, N., 2006. A log-Euclidean framework for statistics on diffeomorphisms. Med ImageComput Comput Assist Interv 9 (Pt 1), 924–931.
Brody, B., HC, K., AS, K., HG, F., May 1987. Sequence of CentralNervous System Myelination in Human Infancy I An AutopsyStudy of Myelination. J Neuropathol Exp Neurol 46 (3), 283–301.
Casey, B. J., Tottenham, N., Liston, C., Durston, S., Mar 2005.Imaging the developing brain: what have we learned about cogni-tive development? Trends Cogn. Sci. (Regul. Ed.) 9 (3), 104–110.
Chen, Y., An, H., Zhu, H., Jewells, V., Armao, D., Shen, D.,Gilmore, J. H., Lin, W., Oct 2011. Longitudinal regression anal-ysis of spatial-temporal growth patterns of geometrical diffusionmeasures in early postnatal brain development with diffusion ten-sor imaging. Neuroimage 58 (4), 993–1005.
11
Diggle, P., Heagerty, P., Liang, K., Zeger, S., 2002. Analysis of Lon-gitudinal Data, second edition Edition. Oxford University Press,New York.
Dubois, J., Dehaene-Lambertz, G., Perrin, M., Mangin, J., Coin-tepas, Y., Duchesnay, E., Le Bihan, D., Hertz-Pannier, L., Jan2008. Asynchrony of the early maturation of white matter bundlesin healthy infants: quantitative landmarks revealed noninvasivelyby diffusion tensor imaging. Hum Brain Mapp 29, 14–27.
Dubois, J., Hertz-Pannier, L., Dehaene-Lambertz, G., Cointepas,Y., Le Bihan, D., May 2006. Assessment of the early organizationand maturation of infants’ cerebral white matter fiber bundles: afeasibility study using quantitative diffusion tensor imaging andtractography. Neuroimage 30, 1121–1132.
Faria, A., Zhang, J., Oishi, K., Li, X., Jiang, H., Akhter, K., Her-moye, L., Lee, S. K., Hoon, A., Stashinko, E., Miller, M. I., vanZijl, P. C., Mori, S., Aug 2010. Atlas-based analysis of neurodevel-opment from infancy to adulthood using diffusion tensor imagingand applications for automated abnormality detection. Neuroim-age 52, 415–428.
Fletcher, P., Joshi, S., 2007. Riemannian geometry for the statisticalanalysis of diffusion tensor data. Signal Process 87(2), 250–262.
Forbes, K. P., Pipe, J. G., Bird, C. R., Feb 2002. Changes in brainwater diffusion during the 1st year of life. Radiology 222 (2), 405–409.
Gao, W., Lin, W., Chen, Y., Gerig, G., Smith, J., Jewells, V.,Gilmore, J., Feb 2009. Temporal and spatial development of ax-onal maturation and myelination of white matter in the developingbrain. AJNR Am J Neuroradiol 30 (2), 290–296.
Geng, X., Gouttard, S., Sharma, A., Gu, H., Styner, M., Lin, W.,Gerig, G., Gilmore, J. H., July 2012. Quantitative tract-basedwhite matter development from birth to age 2years. Neuroimage61, 542–557.
Giedd, J. N., Blumenthal, J., Jeffries, N. O., Castellanos, F. X.,Liu, H., Zijdenbos, A., Paus, T., Evans, A. C., Rapoport, J. L.,Oct 1999. Brain development during childhood and adolescence:a longitudinal MRI study. Nat. Neurosci. 2 (10), 861–863.
Gilmore, J., Kang, C., Evans, D., Wolfe, H., Smith, J., Lieberman, J.,Lin, W., Hamer, R., Styner, M., Gerig, G., Sep 2010. Prenatal andneonatal brain structure and white matter maturation in childrenat high risk for schizophrenia. Am J Psychiatry 167 (9), 1083–1091.
Gogtay, N., Giedd, J. N., Lusk, L., Hayashi, K. M., Greenstein, D.,Vaituzis, A. C., Nugent, T. F., Herman, D. H., Clasen, L. S., Toga,A. W., Rapoport, J. L., Thompson, P. M., May 2004. Dynamicmapping of human cortical development during childhood throughearly adulthood. Proc. Natl. Acad. Sci. U.S.A. 101 (21), 8174–8179.
Hermoye, L., Saint-Martin, C., Cosnard, G., Lee, S. K., Kim, J.,Nassogne, M. C., Menten, R., Clapuyt, P., Donohue, P. K., Hua,K., Wakana, S., Jiang, H., van Zijl, P. C., Mori, S., Jan 2006. Pedi-atric diffusion tensor imaging: normal database and observationof the white matter maturation in early childhood. Neuroimage29 (2), 493–504.
Huppi, P., Oct 2008. Neuroimaging of brain development–discoveringthe origins of neuropsychiatric disorders? Pediatr Res 64, 325.
Huppi, P., Maier, S., Peled, S., Zientara, G., Barnes, P., Jolesz,F., Volpe, J. J., Oct 1998. Microstructural development of humannewborn cerebral white matter assessed in vivo by diffusion tensormagnetic resonance imaging. Pediatr Res 44 (4), 584–590.
Joshi, S., Davis, B., Jomier, M., Gerig, G., 2004. Unbiased diffeomor-phic atlas construction for computational anatomy. Neuroimage23, S151–160.
Karmiloff-Smith, A., Jun 2010. Neuroimaging of the developingbrain: taking ”developing” seriously. Hum Brain Mapp 31 (6),934–941.
Kinney, H., Brody, B., Kloman, A., Gilles, F., May 1988. Sequence ofcentral nervous system myelination in human infancy II Patternsof myelination in autopsied infants. J Neuropathol Exp Neurol47 (3), 217–234.
Knickmeyer, R., Gouttard, S., Kang, C., Evans, D., Wilber, K.,Smith, J., Hamer, R., Lin, W., Gerig, G., Gilmore, J., Nov 2008.
A structural MRI study of human brain development from birthto 2 years. J Neurosci 28, 12176–12182.
LaMantia, A., Rakic, P., Jul 1990. Axon overproduction and elimi-nation in the corpus callosum of the developing rhesus monkey. JNeurosci 10 (7), 2156–2175.
Lebel, C., Beaulieu, C., Jul 2011. Longitudinal development of hu-man brain wiring continues from childhood into adulthood. J Neu-rosci 31 (30), 10937–10947.
Lindstrom, M., Bates, D., Sep 1990. Nonlinear mixed effects modelsfor repeated measures data. Biometrics 46, 673–687.
Lobel, U., Sedlacik, J., Gullmar, D., Kaiser, W. A., Reichenbach,J. R., Mentzel, H. J., Apr 2009. Diffusion tensor imaging: thenormal evolution of ADC, RA, FA, and eigenvalues studied inmultiple anatomical regions of the brain. Neuroradiology 51 (4),253–263.
Marsh, R., Gerber, A., Peterson, B., Nov 2008. Neuroimaging studiesof normal brain development and their relevance for understandingchildhood neuropsychiatric disorders. J Am Acad Child AdolescPsychiatry 47 (11), 1233–1251.
Ment, L., Hirtz, D., Huppi, P., Nov 2009. Imaging biomarkers ofoutcome in the developing preterm brain. Lancet Neurol 8 (11),1042–1055.
Miller, M., Trouve, A., Younes, L., 2002. On the metrics and euler-lagrange equations of computational anatomy. Annu Rev BiomedEng 4, 375–405.
Mori, S., Oishi, K., Jiang, H., Jiang, L., Li, X., Akhter, K., Hua, K.,Faria, A., Mahmood, A., Woods, R., Toga, A., Pike, G., Neto,P., Evans, A., Zhang, J., Huang, H., Miller, M., van Zijl, P.,Mazziotta, J., Apr 2008. Stereotaxic white matter atlas based ondiffusion tensor imaging in an ICBM template. Neuroimage 40,570–582.
Mukherjee, P., Miller, J., Shimony, J., Conturo, T., Lee, B., Almli,C., McKinstry, R., Nov 2001. Normal brain maturation duringchildhood: developmental trends characterized with diffusion-tensor MR imaging. Radiology 221 (2), 349–358.
Mukherjee, P., Miller, J., Shimony, J., Philip, J., Nehra, D., Snyder,A., Conturo, T., Neil, J., McKinstry, R., Oct 2002. Diffusion-tensor MR imaging of gray and white matter development duringnormal human brain maturation. AJNR Am J Neuroradiol 23 (9),1445–1456.
Neil, J., Shiran, S., McKinstry, R., Schefft, G., Snyder, A., Almli,C., Akbudak, E., Aronovitz, J., Miller, J., Lee, B., Conturo, T.,Oct 1998. Normal brain in human newborns: apparent diffusioncoefficient and diffusion anisotropy measured by using diffusiontensor MR imaging. Radiology 209 (1), 57–66.
Pennec, X., Fillard, P., Ayache, N., January 2006. A riemannianframework for tensor computing. Int J Comput Vis 66(1), 41–66.
Pinheiro, J., Bates, D., 2000. Mixed-Effects Models in S and S-Plus.Springer.
Pinheiro, J., Bates, D., DebRoy, S., Sarkar, D., R Core Team, 2012.nlme: Linear and Nonlinear Mixed Effects Models. R packageversion 31-104.
Rueckert, D., Sonoda, L., Hayes, C., Hill, D., Leach, M., Hawkes,D., Aug 1999. Nonrigid registration using free-form deformations:application to breast MR images. IEEE Trans Med Imaging 18 (8),712–721.
Rutherford, M. (Ed.), 2002. MRI of the Neonatal Brain. WB Saun-ders.
Sadeghi, N., Prastawa, M., Fletcher, P., Gilmore, J., Lin, W., Gerig,G., 2012. Statistical growth modeling of longitudinal dt-mri forregional characterization of early brain development. In: Proceed-ings of IEEE ISBI 2012. pp. 1507–1510.
Sadeghi, N., Prastawa, M., Gilmore, J., Lin, W., Gerig, G., 2010.Spatio-temporal analysis of early brain development. In: Proceed-ings IEEE Asilomar Conference on Signals, Systems and Comput-ers. pp. 777–781.
Salvador, R., Pena, A., Menon, D., Carpenter, T., Pickard, J., Bull-more, E., Feb 2005. Formal characterization and extension of thelinearized diffusion tensor model. Hum Brain Mapp 24 (2), 144–155.
Schneider, J. F., Il’yasov, K. A., Hennig, J., Martin, E., Apr
12
2004. Fast quantitative diffusion-tensor imaging of cerebral whitematter from the neonatal period to adolescence. Neuroradiology46 (4), 258–266.
Shaw, P., Greenstein, D., Lerch, J., Clasen, L., Lenroot, R., Gogtay,N., Evans, A., Rapoport, J., Giedd, J., Mar 2006. Intellectual abil-ity and cortical development in children and adolescents. Nature440 (7084), 676–679.
Smith, S. M., Nov 2002. Fast robust automated brain extraction.Hum Brain Mapp 17 (3), 143–155.
Song, S., Sun, S., Ramsbottom, M., Chang, C., Russell, J., Cross,A., Nov 2002. Dysmyelination revealed through MRI as increasedradial (but unchanged axial) diffusion of water. Neuroimage 17 (3),1429–1436.
Studholme, C., Hill, D., Hawkes, D., et al., 1999. An overlap in-variant entropy measure of 3d medical image alignment. Patternrecognition 32 (1), 71–86.
Thomas, M., Annaz, D., Ansari, D., Scerif, G., Jarrold, C.,Karmiloff-Smith, A., Apr 2009. Using developmental trajectoriesto understand developmental disorders. J Speech Lang Hear Res52 (2), 336–358.
Wolff, J., Gu, H., Gerig, G., Elison, J., Styner, M., Gouttard, S.,Botteron, K., Dager, S., Dawson, G., Estes, A., Evans, A., Ha-zlett, H., Kostopoulos, P., McKinstry, R. C., Paterson, S., Schultz,R., Zwaigenbaum, L., Piven, J., Feb 2012. Differences in WhiteMatter Fiber Tract Development Present From 6 to 24 Monthsin Infants With Autism. Am J Psychiatry.
Xu, S., Styner, M., Gilmore, J., Gerig, G., June 2008. MultivariateNonlinear Mixed Model to Analyze Longitudinal Image Data:MRIStudy of Early Brain Development. In: MMBIA. IEEE Comp Soc,pp. 1–8.
Xue, H., Srinivasan, L., Jiang, S., Rutherford, M., Edwards, A.,Rueckert, D., Hajnal, J. V., 2007. Automatic cortical segmenta-tion in the developing brain. In: IPMI. pp. 257–269.
Zhang, L., Thomas, K. M., Davidson, M. C., Casey, B. J., Heier,L. A., Ulu?, A. M., Jan 2005. MR quantitation of volume anddiffusion changes in the developing brain. AJNR Am J Neuroradiol26 (1), 45–49.
Appendix A. Summary of Registration Parameters
Intra-subject and inter-modality registration
We use the IRTK software (Rueckert et al., 1999) to per-form intra-subject and inter-modality registration. Theregistration method is a multi-scale approach using B-spline transformation, where we use the normalized mu-tual information image match metric. We use three dif-ferent scales and discretize the image intensity histogramsinto 64 bins. In this study, the B-spline transforms areparametrized using 14 x 14 x 14 control points.
Inter-subject registration
We construct an unbiased atlas (Joshi et al., 2004)and the associated inter-subject registration using theLarge Deformation Diffeomorphic Metric Mapping (LD-DMM) (Miller et al., 2002) that minimizes the followingobjective function:
argminv:φt=vt(φ)
1
σ2
∑i
||I − Ii ◦ φ−1i ||
2L2 +
∑i
∫ T
t=o
||vit||2v (8)
where I is the image atlas, Ii is the image of subject i,φi is the mapping relating subject i to the atlas that is
parametrized using the velocity vi. Regularity of the map-ping φ is enforced by minimizing
||vt||2v =< Lv, v >,L = α∇2 + β∇+ γI
where L is the Navier-Stokes operator. In this study, weuse α = .01, β = .01, γ = .001, and σ = 1.
Appendix B. Summary of p-values of pairwise com-parisons
Table 3 provides the result of pairwise testing of all whitematter regions and all the diffusivity measurements.
13

Table 3: Results of pairwise testing of all white matter regions and all diffusivity measures. Gompertz parameters with significant differencesare denoted by * for p < .05 and ** for p < 0.01. Non significant parameters are indicated by “ns”.
Alic Plic Genu BCC Sp ExCap Rlic PTRAlic FA β∗∗
1 , β∗∗2 β∗∗
1 β∗∗1 β∗∗
1 β∗∗1 ns β∗∗
2
MD NA β∗∗2 β∗∗
2 ,β∗∗3 β∗∗
1 β∗∗1 ,β∗∗
2 β∗∗1 β∗∗
1 ,β∗2 β∗∗
1 ,β∗∗2
RD β∗∗1 ,β∗∗
2 β∗∗1 ,β∗∗
2 ,β∗∗3 β∗∗
1 β∗∗2 β∗∗
1 ,β∗∗2 β∗∗
1 β∗1 ,β
∗∗2
AD β∗1 ns ns β∗∗
1 β∗∗1 ,β∗∗
2 β∗∗1 ,β∗∗
2 β∗∗1
Plic FA β∗∗1 , β∗∗
2 β∗∗1 , β∗∗
2 β∗∗1 , β∗∗
2 β∗∗2 β∗∗
1 β∗1 ,β
∗2 ns
MD β∗∗2 NA β∗∗
2 ,β∗∗3 β∗∗
1 ,β∗∗2 β∗∗
1 ,β∗∗2 β∗∗
1 ,β∗∗2 β∗∗
1 ,β∗∗2 β∗∗
1
RD β∗∗1 ,β∗∗
2 β∗1 ,β
∗∗2 ,β∗∗
3 β∗1 β∗
2 β∗1 β∗∗
1 ,β∗2 β∗∗
1
AD β∗1 β∗∗
1 ,β∗∗3 ns β∗∗
1 ,β∗2 β∗∗
1 ,β∗∗2 β∗∗
1 ,β∗∗2 ns
Genu FA β∗∗1 β∗∗
1 ,β∗∗2 β∗∗
1 β∗∗1 ,β∗∗
3 β∗∗1 ,β∗∗
2 β∗∗1 ,β∗∗
2 β∗∗1 ,β∗∗
2
MD β∗∗2 , β∗∗
3 β∗∗2 ,β∗∗
3 NA β∗∗2 ,β∗∗
3 β∗∗3 β∗∗
2 ,β∗∗3 β∗∗
3 β∗∗2 ,β∗∗
3
RD β∗∗1 ,β∗∗
2 ,β∗∗3 β∗∗
1 ,β∗∗2 ,β∗∗
3 β∗∗1 ,β∗∗
2 ,β∗∗3 β∗∗
3 β∗∗1 ,β∗∗
2 ,β∗∗3 β∗∗
1 ,β∗∗3 β∗∗
1 ,β∗∗3
AD ns β∗∗1 ,β∗∗
3 ns β∗∗1 β∗∗
1 ,β∗∗2 ,β∗∗
3 β∗∗3 ns
BCC FA β∗∗1 β∗∗
1 ,β∗∗2 β∗∗
1 β∗∗1 β∗∗
1 ,β∗∗2 β∗
2 β∗∗2
MD β∗∗1 β∗∗
1 ,β∗∗2 β∗∗
2 ,β∗∗3 NA β∗∗
1 ,β∗∗2 β∗∗
1 ns β∗∗2
RD β∗∗1 β∗
1 β∗∗1 ,β∗∗
2 ,β∗∗3 β∗∗
1 ,β∗∗2 ,β∗∗
3 β∗1 β∗∗
1 ,β∗∗2 ,β∗∗
3 β∗∗1 ,β∗∗
3
AD ns ns ns β∗∗1 β∗∗
1 ,β∗∗2 ns ns
Sp FA β∗∗1 β∗∗
2 β∗∗1 ,β∗∗
3 β∗∗1 β∗∗
1 ,β∗∗2 β∗∗
1 β∗1 ,β
∗∗2
MD β∗∗1 , β∗∗
2 β∗∗1 ,β∗∗
2 β∗∗3 β∗∗
1 ,β∗∗2 NA β∗
1 ,β∗∗2 β∗
1 β∗∗2
RD β∗∗2 β∗
2 β∗∗3 β∗∗
1 ,β∗∗2 ,β∗∗
3 β∗∗1 ,β∗∗
2 β∗∗1 ,β∗∗
2 β∗∗1 ,β∗∗
2
AD β∗∗1 β∗∗
1 ,β∗2 β∗∗
1 β∗∗1 β∗∗
1 ,β∗∗2 ns ns
ExCap FA β∗∗1 β∗∗
1 β∗∗1 ,β∗∗
2 β∗∗1 ,β∗∗
2 β∗∗1 ,β∗∗
2 β∗∗1 β∗∗
1
MD β∗∗1 β∗∗
1 , β∗∗2 β∗∗
2 ,β∗∗3 β∗∗
1 β∗1 ,β
∗∗2 NA β∗∗
1 β∗∗1 ,β∗∗
2
RD β∗∗1 , β∗∗
2 β∗∗1 β∗∗
1 ,β∗∗2 ,β∗∗
3 β∗∗1 β∗∗
1 ,β∗∗2 β∗∗
2 β∗∗1
AD β∗∗1 , β∗∗
2 β∗∗1 , β∗∗
2 β∗∗3 β∗∗
1 ,β∗∗2 β∗∗
1 ,β∗∗2 β∗
1 β∗∗1 ,β∗∗
2
Rlic FA ns β∗1 , β
∗2 β∗∗
1 , β∗∗2 β∗
2 β∗∗1 β∗∗
1 β∗∗2
MD β∗∗1 , β∗
2 β∗∗1 , β∗∗
2 β∗∗3 ns β∗
1 β∗∗1 NA β∗∗
1 ,β∗∗2
RD β∗∗1 , β∗∗
1 , β∗2 β∗∗
1 , β∗∗3 β∗∗
1 , β∗∗2 ,β∗∗
3 β∗∗1 , β∗∗
2 β∗∗2 β∗∗
1 ,β∗∗2
AD β∗∗1 , β∗∗
2 β∗∗1 , β∗∗
2 β∗∗3 ns ns β∗∗
1 β∗∗2
PTR FA β∗∗2 ns β∗∗
1 ,β∗2 β∗∗
2 β∗1 ,β
∗∗2 β∗∗
1 β∗∗2
MD β∗∗2 , β∗∗
3 β∗∗1 β∗∗
1 ,β∗∗2 β∗∗
2 β∗∗2 β∗∗
1 ,β∗∗2 β∗∗
1 ,β∗∗2 NA
RD β∗1 , β
∗∗2 β∗∗
1 β∗∗1 ,β∗∗
3 β∗∗1 , β∗∗
3 β∗∗1 , β∗∗
2 β∗∗1 β∗∗
1 , β∗∗2
AD β∗∗1 ns ns ns ns β∗∗
1 ,β∗∗2 β∗∗
2 β∗∗2
14