regents retreat data
TRANSCRIPT
Utah System of Higher Educat ion
Context:Higher Education in Utah
Available online: http://higheredutah.org/news/presentations/
David L. BuhlerCommissioner of Higher Education
November 14, 2014
Utah System of Higher Educat ion
Contents
• 66 by 2020 Slide 3• High School Pipeline Slide 6• College Readiness Slide 10• USHE Students Slide 13• College Completion Slide 20• Cost & Efficiency Slide 24• Affordability Slide 30• Use of Technology Slide 34• Benefits of Higher Education Slide 40
Utah System of Higher Educat ion
66% by 2020
Utah System of Higher Educat ion
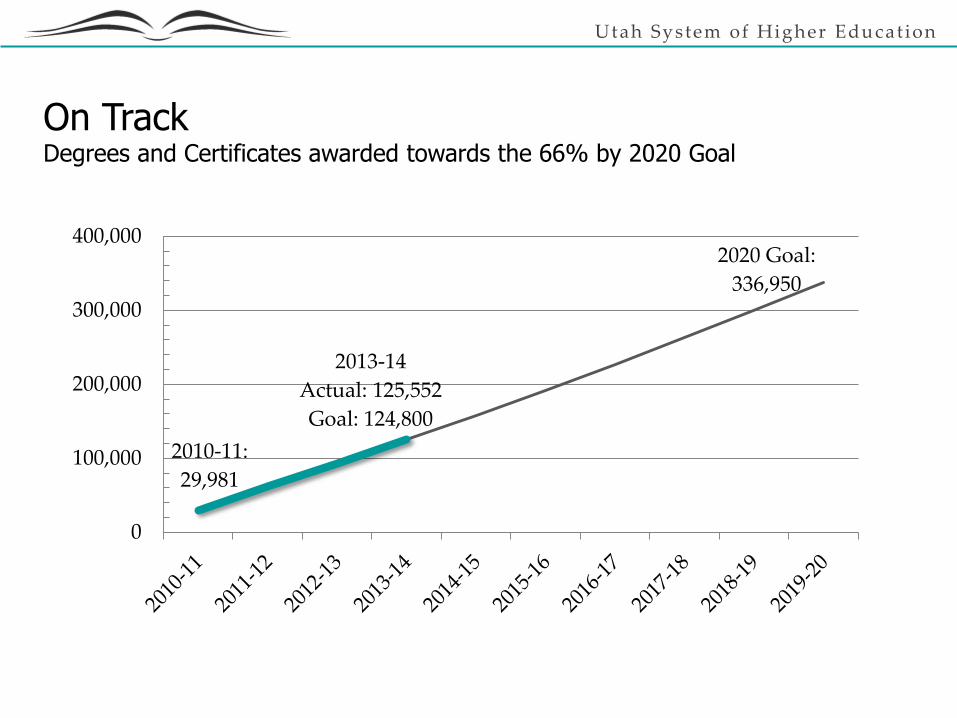
On TrackDegrees and Certificates awarded towards the 66% by 2020 Goal
2020 Goal:
336,950
2010-11:
29,981
2013-14
Actual: 125,552
Goal: 124,800
0
100,000
200,000
300,000
400,000
Utah System of Higher Educat ion
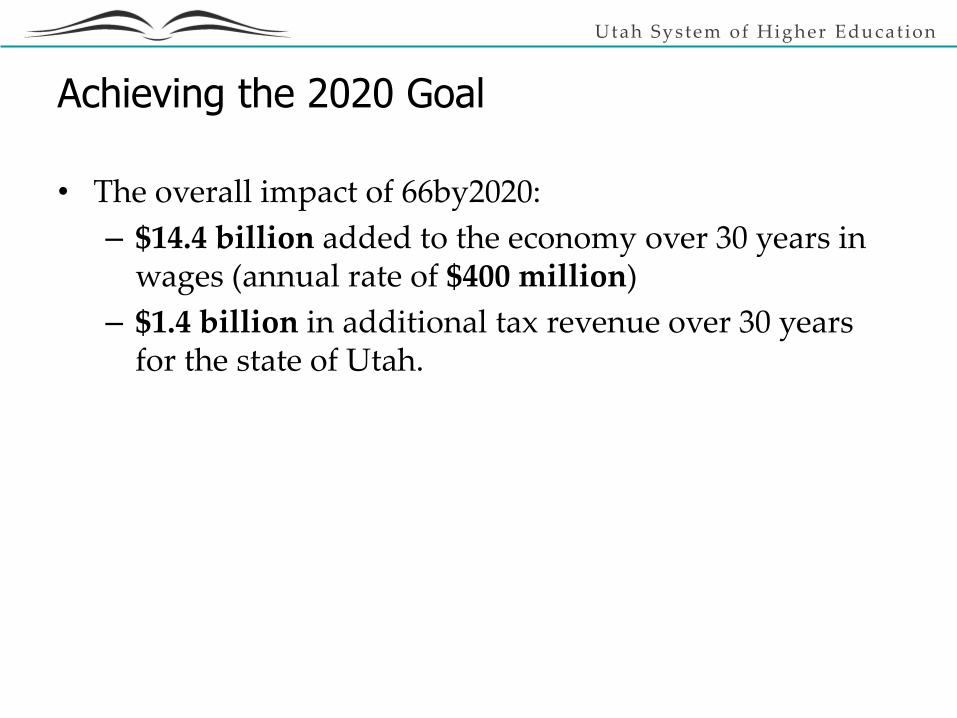
Achieving the 2020 Goal
• The overall impact of 66by2020:
– $14.4 billion added to the economy over 30 years in wages (annual rate of $400 million)
– $1.4 billion in additional tax revenue over 30 years for the state of Utah.

Utah System of Higher Educat ion
THE HIGH SCHOOL PIPELINE
Utah System of Higher Educat ion
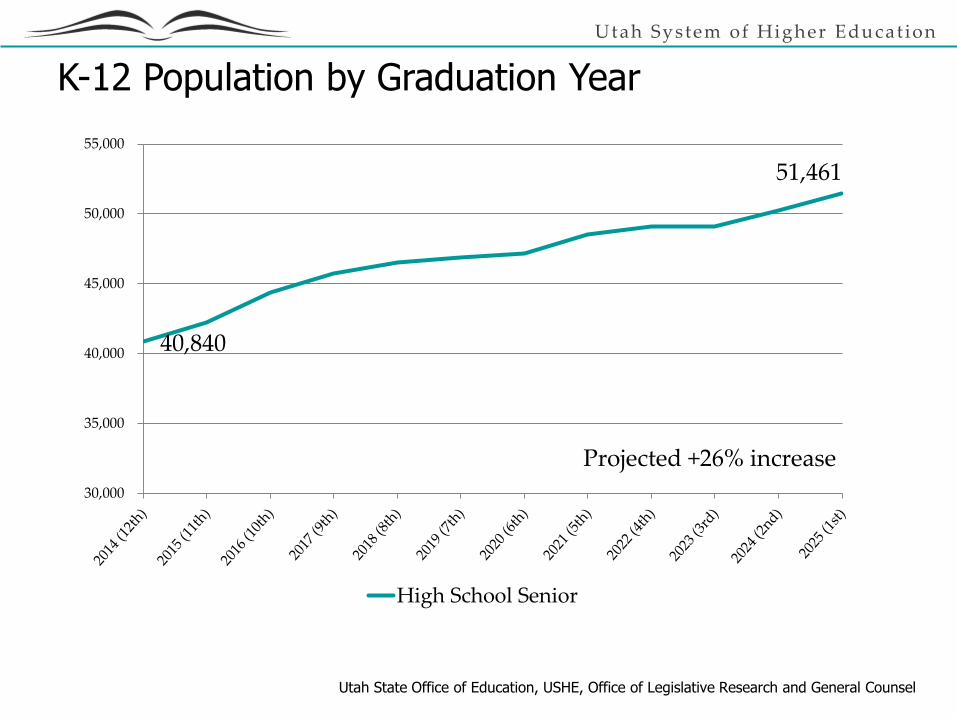
40,840
51,461
30,000
35,000
40,000
45,000
50,000
55,000
High School Senior
K-12 Population by Graduation Year
Utah State Office of Education, USHE, Office of Legislative Research and General Counsel
Projected +26% increase
Utah System of Higher Educat ion
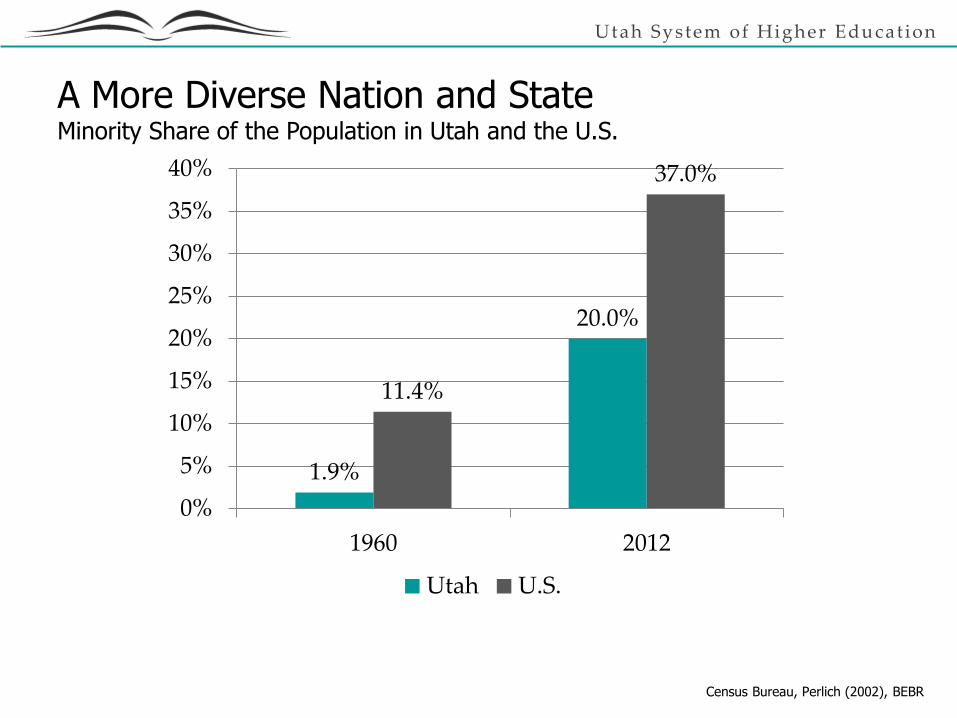
A More Diverse Nation and StateMinority Share of the Population in Utah and the U.S.
Census Bureau, Perlich (2002), BEBR
1.9%
20.0%
11.4%
37.0%
0%
5%
10%
15%
20%
25%
30%
35%
40%
1960 2012
Utah U.S.
Utah System of Higher Educat ion
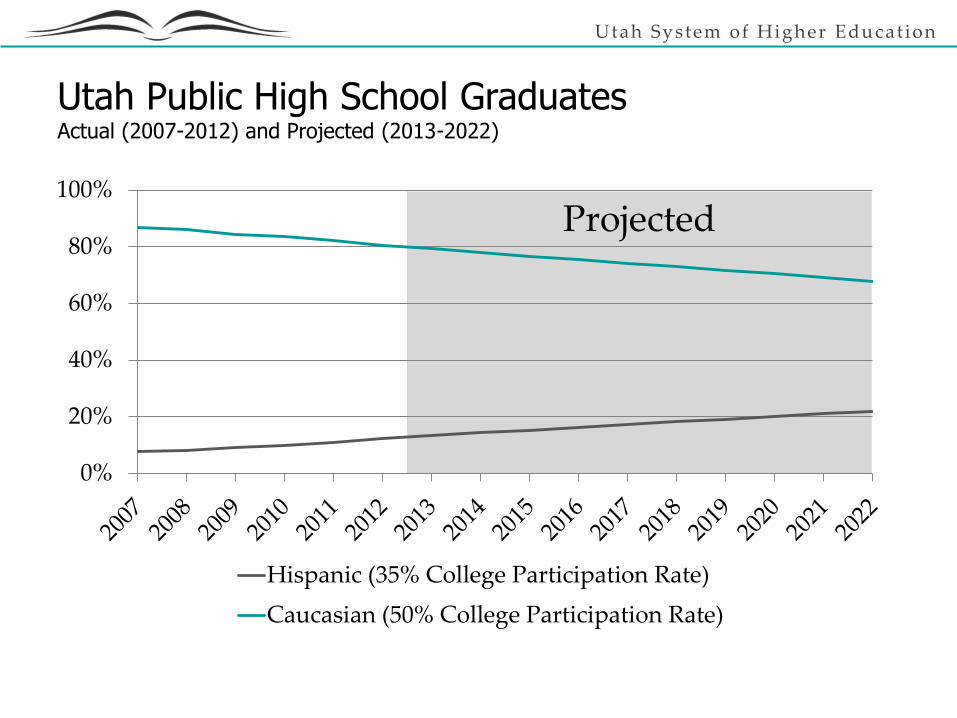
Projected
Utah Public High School GraduatesActual (2007-2012) and Projected (2013-2022)
0%
20%
40%
60%
80%
100%
Hispanic (35% College Participation Rate)
Caucasian (50% College Participation Rate)

Utah System of Higher Educat ion
COLLEGE READINESS
Utah System of Higher Educat ion
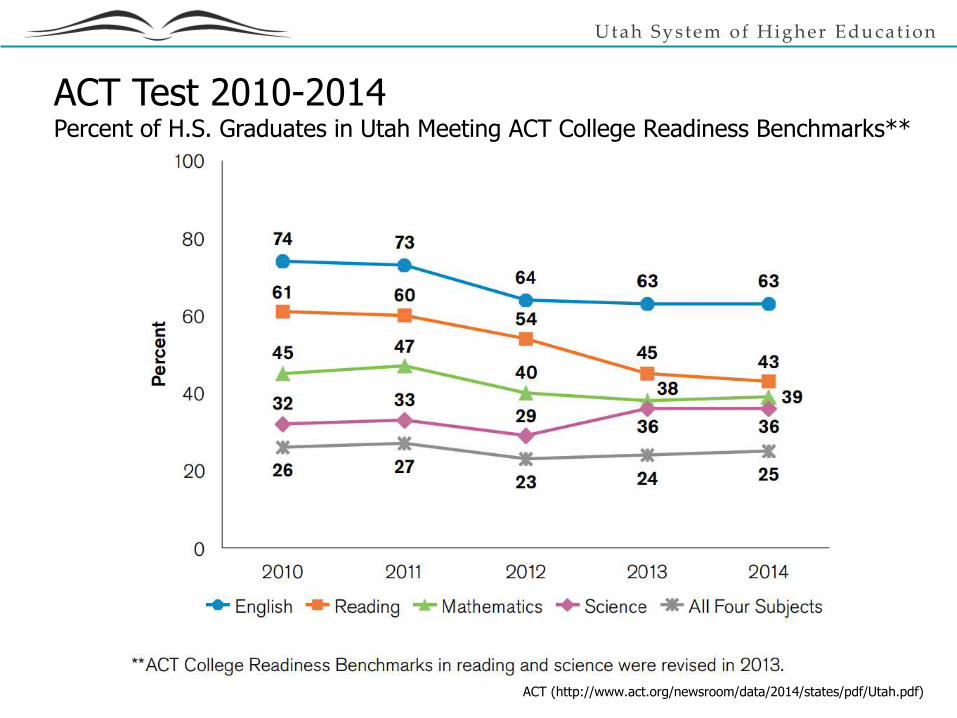
ACT (http://www.act.org/newsroom/data/2014/states/pdf/Utah.pdf)
ACT Test 2010-2014Percent of H.S. Graduates in Utah Meeting ACT College Readiness Benchmarks**
Utah System of Higher Educat ion
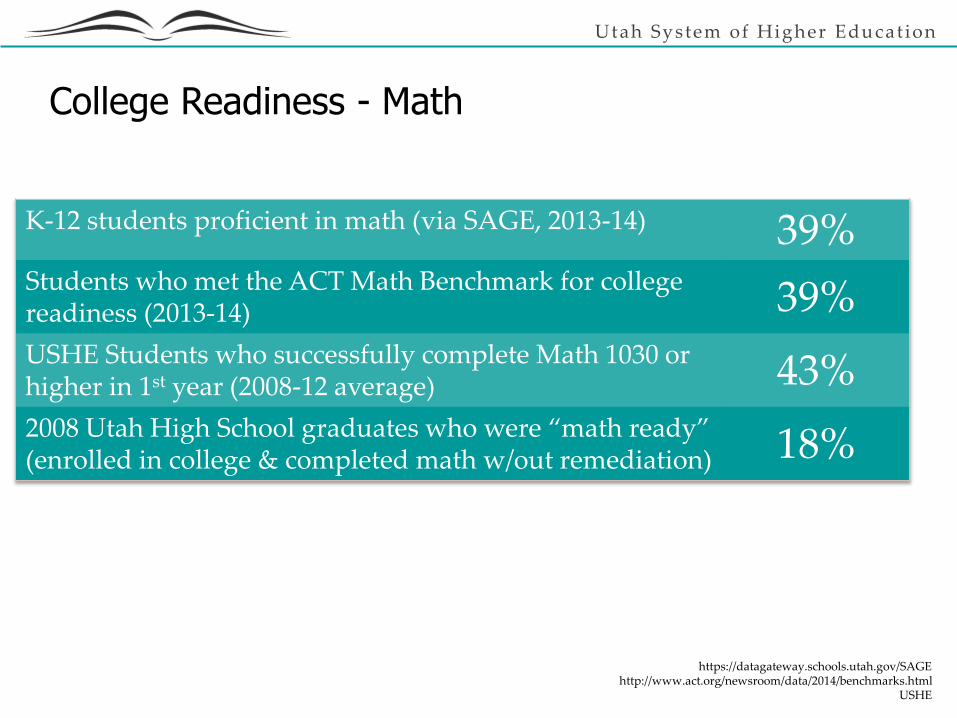
College Readiness - Math
https://datagateway.schools.utah.gov/SAGEhttp://www.act.org/newsroom/data/2014/benchmarks.html
USHE
K-12 students proficient in math (via SAGE, 2013-14) 39%Students who met the ACT Math Benchmark for college readiness (2013-14) 39%USHE Students who successfully complete Math 1030 or higher in 1st year (2008-12 average) 43%2008 Utah High School graduates who were “math ready” (enrolled in college & completed math w/out remediation) 18%

Utah System of Higher Educat ion
USHE STUDENTS
Utah System of Higher Educat ion
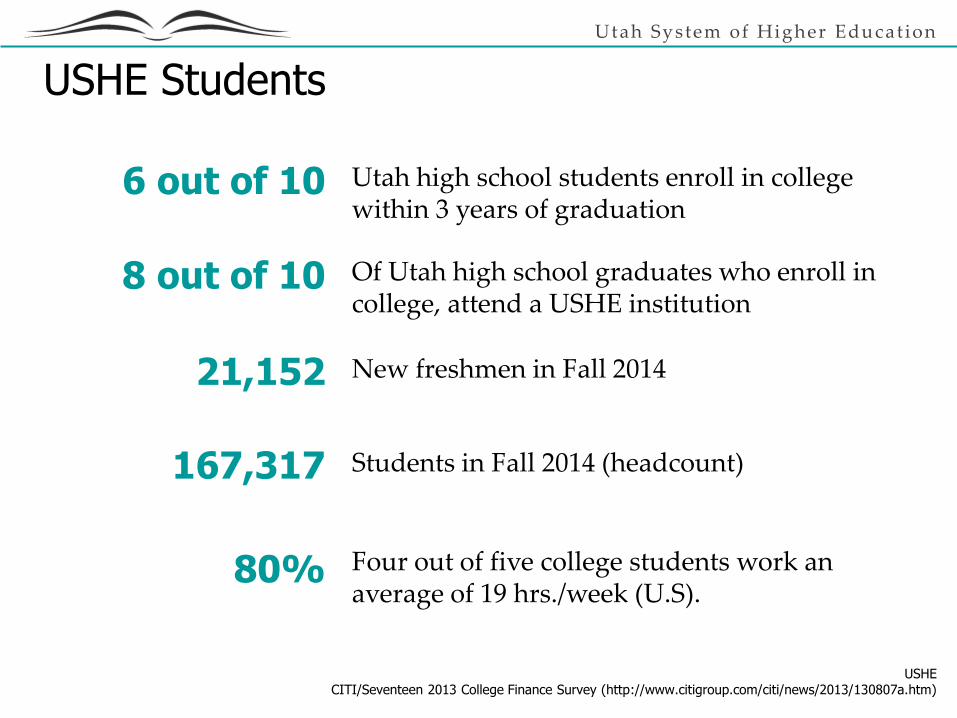
USHE Students
Of Utah high school graduates who enroll in college, attend a USHE institution
Students in Fall 2014 (headcount)
8 out of 10
167,317
New freshmen in Fall 201421,152
Utah high school students enroll in college within 3 years of graduation
6 out of 10
Four out of five college students work an average of 19 hrs./week (U.S).
80%
USHECITI/Seventeen 2013 College Finance Survey (http://www.citigroup.com/citi/news/2013/130807a.htm)
Utah System of Higher Educat ion
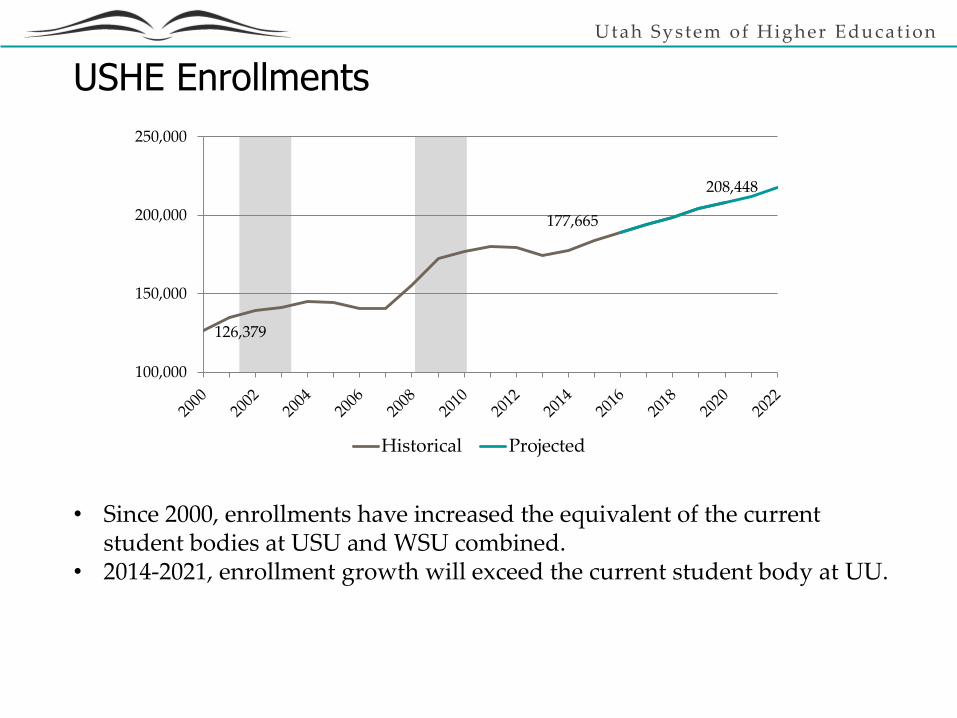
126,379
177,665
208,448
100,000
150,000
200,000
250,000
Historical Projected
• Since 2000, enrollments have increased the equivalent of the current student bodies at USU and WSU combined.
• 2014-2021, enrollment growth will exceed the current student body at UU.
USHE Enrollments
Utah System of Higher Educat ion
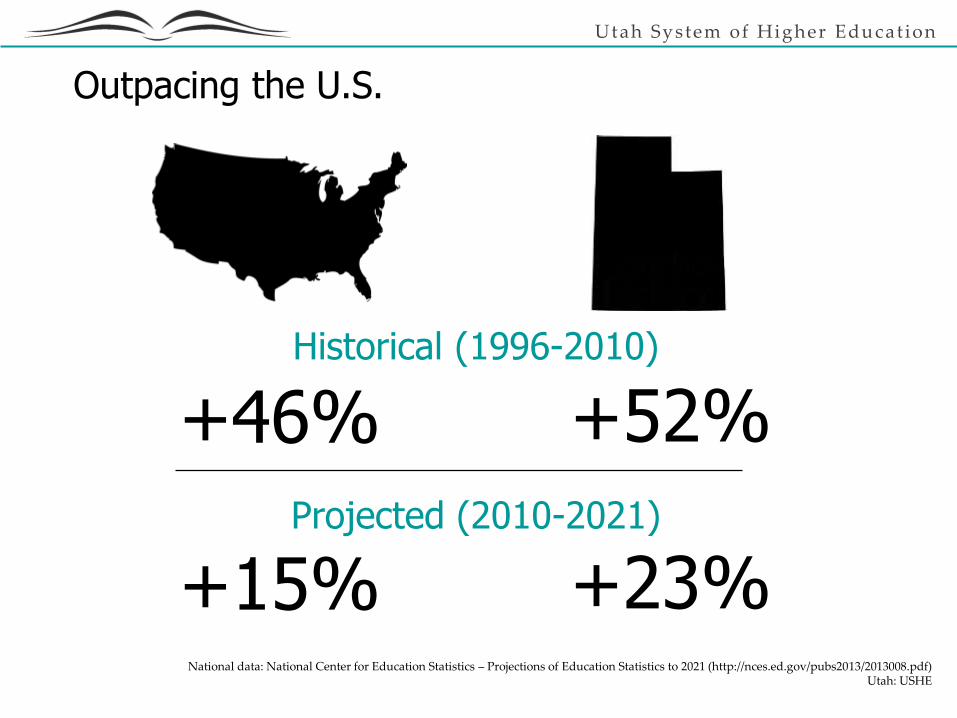
Outpacing the U.S.
Projected (2010-2021)
+15% +23%National data: National Center for Education Statistics – Projections of Education Statistics to 2021 (http://nces.ed.gov/pubs2013/2013008.pdf)
Utah: USHE
Historical (1996-2010)
+46% +52%
Utah System of Higher Educat ion
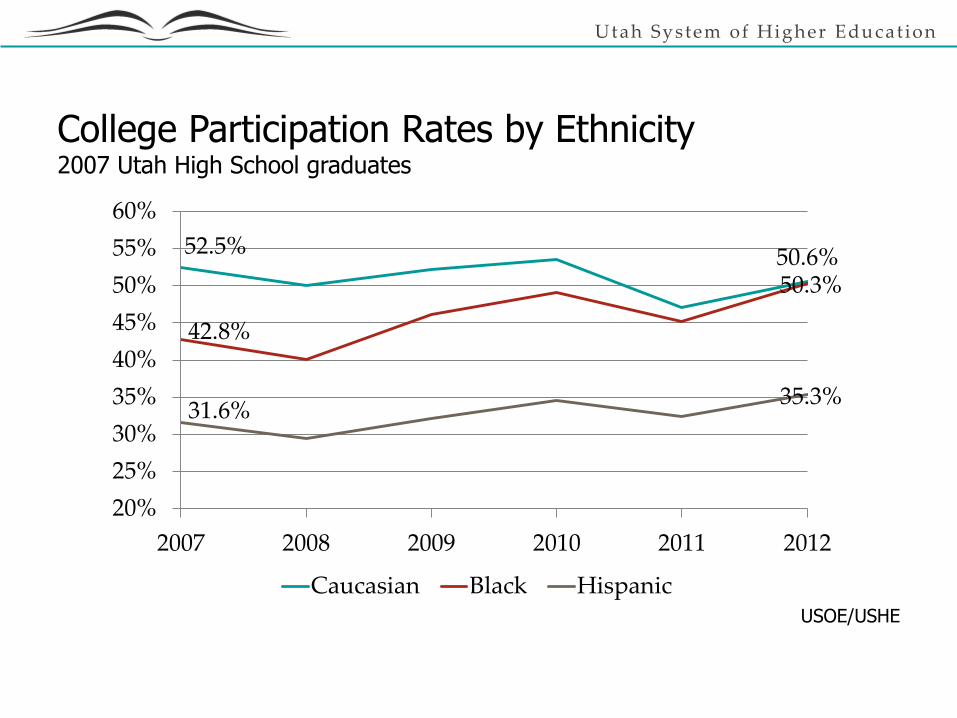
College Participation Rates by Ethnicity2007 Utah High School graduates
USOE/USHE
52.5% 50.6%
42.8%
50.3%
31.6%35.3%
20%
25%
30%
35%
40%
45%
50%
55%
60%
2007 2008 2009 2010 2011 2012
Caucasian Black Hispanic
Utah System of Higher Educat ion
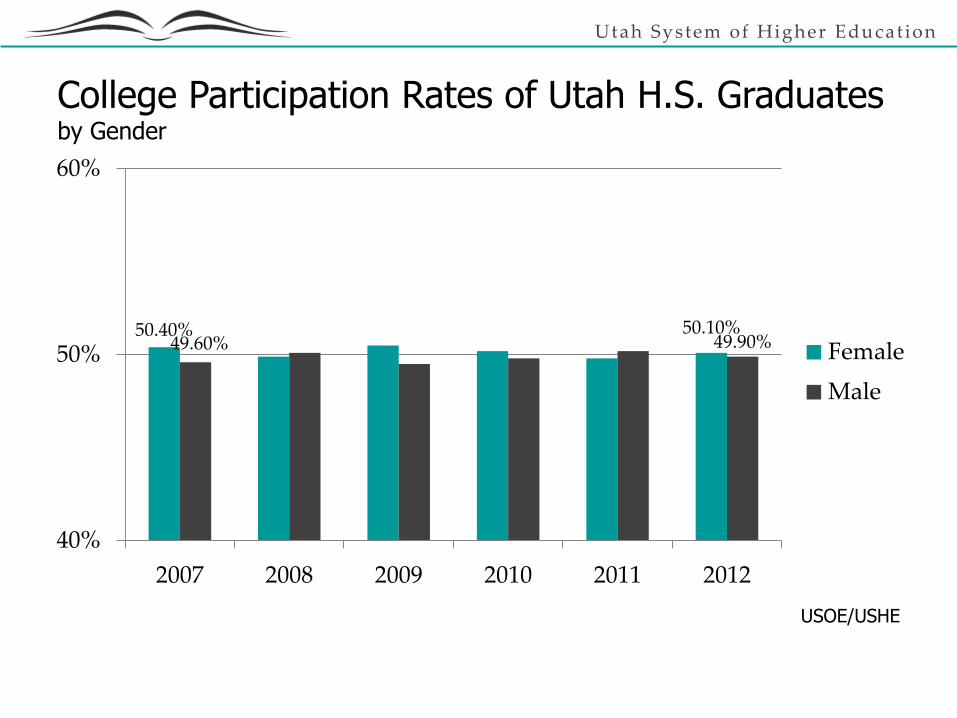
College Participation Rates of Utah H.S. Graduatesby Gender
USOE/USHE
50.40% 50.10%49.60% 49.90%
40%
50%
60%
2007 2008 2009 2010 2011 2012
Female
Male
Utah System of Higher Educat ion
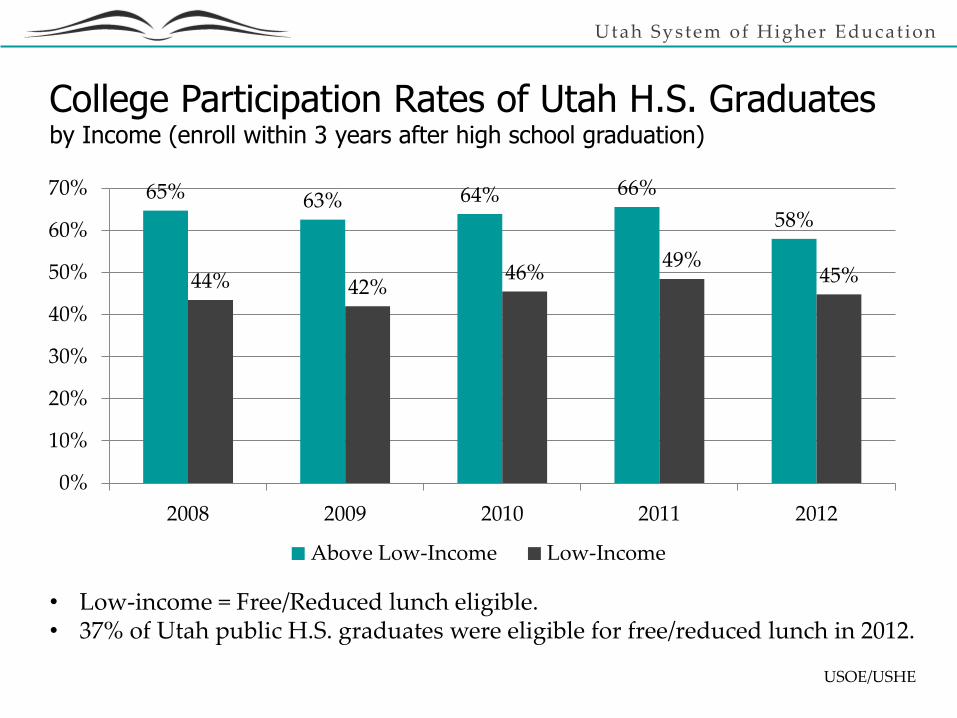
College Participation Rates of Utah H.S. Graduatesby Income (enroll within 3 years after high school graduation)
USOE/USHE
65% 63% 64% 66%
58%
44% 42%46%
49%45%
0%
10%
20%
30%
40%
50%
60%
70%
2008 2009 2010 2011 2012
Above Low-Income Low-Income
• Low-income = Free/Reduced lunch eligible. • 37% of Utah public H.S. graduates were eligible for free/reduced lunch in 2012.
Utah System of Higher Educat ion
COLLEGE COMPLETION
Utah System of Higher Educat ion
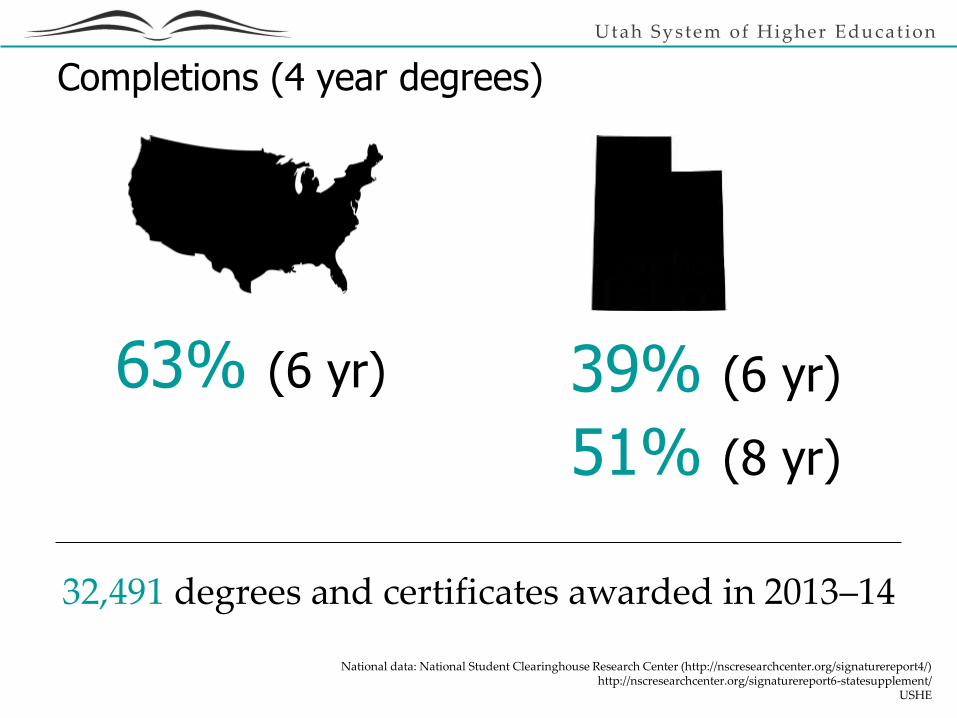
Completions (4 year degrees)
63% (6 yr) 39% (6 yr)
51% (8 yr)
National data: National Student Clearinghouse Research Center (http://nscresearchcenter.org/signaturereport4/)http://nscresearchcenter.org/signaturereport6-statesupplement/
USHE
32,491 degrees and certificates awarded in 2013–14
Utah System of Higher Educat ion
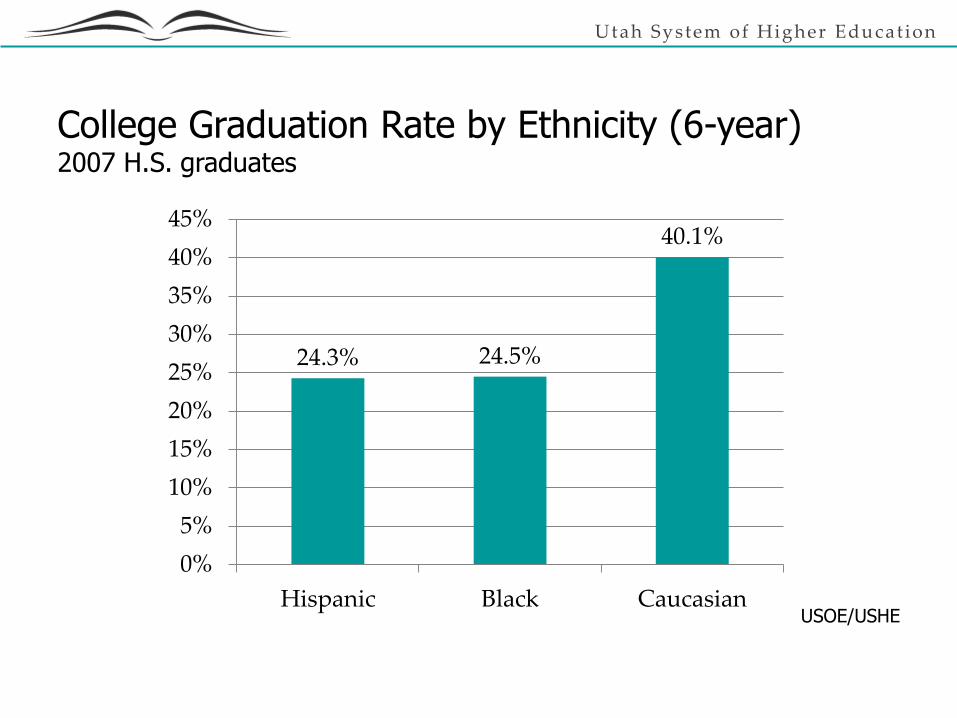
College Graduation Rate by Ethnicity (6-year)2007 H.S. graduates
USOE/USHE
24.3% 24.5%
40.1%
0%
5%
10%
15%
20%
25%
30%
35%
40%
45%
Hispanic Black Caucasian
Utah System of Higher Educat ion
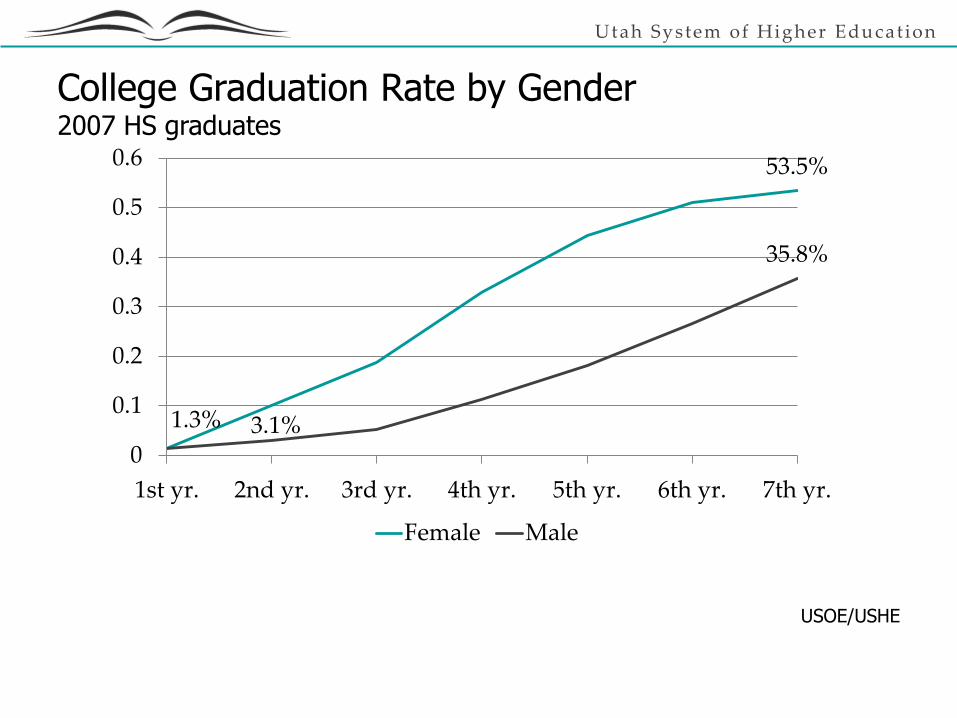
College Graduation Rate by Gender2007 HS graduates
USOE/USHE
1.3%
53.5%
3.1%
35.8%
0
0.1
0.2
0.3
0.4
0.5
0.6
1st yr. 2nd yr. 3rd yr. 4th yr. 5th yr. 6th yr. 7th yr.
Female Male
Utah System of Higher Educat ion
COST EFFICIENCY
Utah System of Higher Educat ion
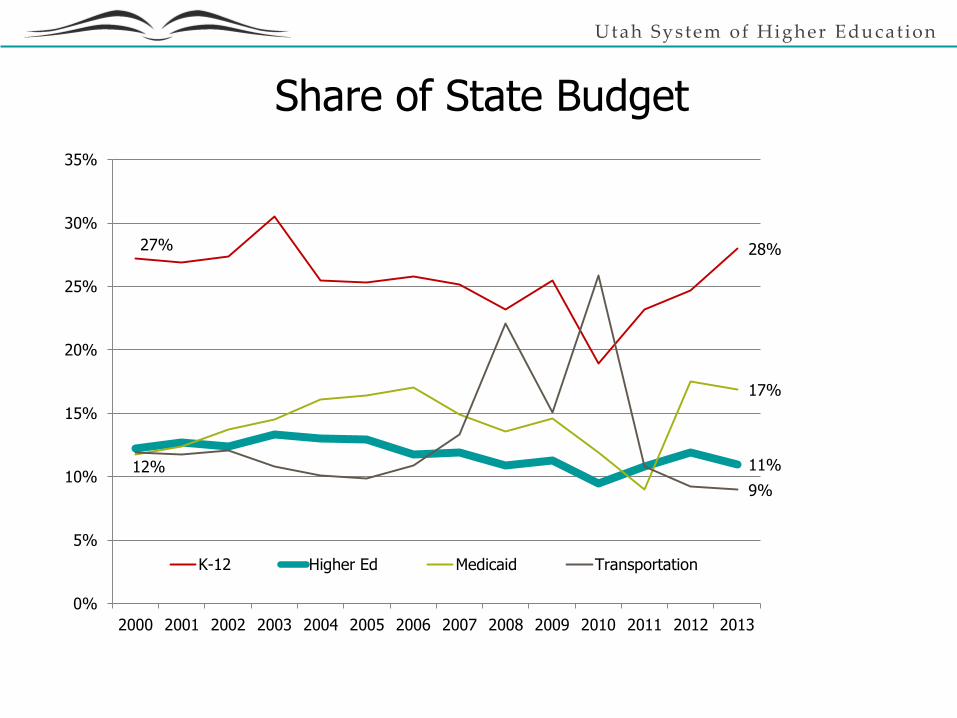
Share of State Budget
27% 28%
11%12%
17%
9%
0%
5%
10%
15%
20%
25%
30%
35%
2000 2001 2002 2003 2004 2005 2006 2007 2008 2009 2010 2011 2012 2013
K-12 Higher Ed Medicaid Transportation
Utah System of Higher Educat ion
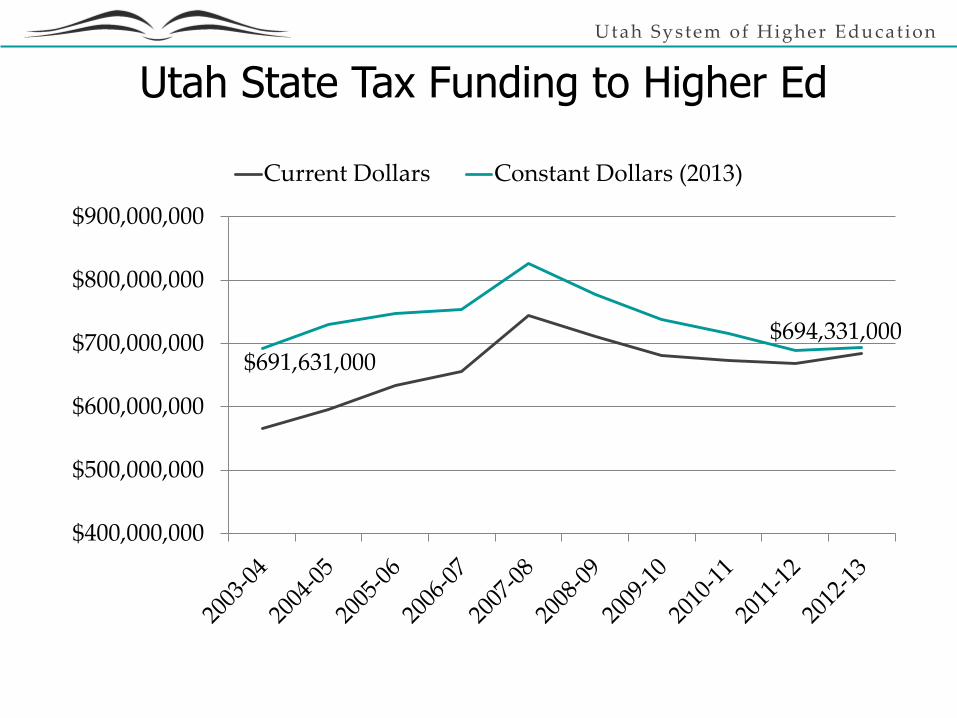
Utah State Tax Funding to Higher Ed
$691,631,000
$694,331,000
$400,000,000
$500,000,000
$600,000,000
$700,000,000
$800,000,000
$900,000,000
Current Dollars Constant Dollars (2013)
Utah System of Higher Educat ion
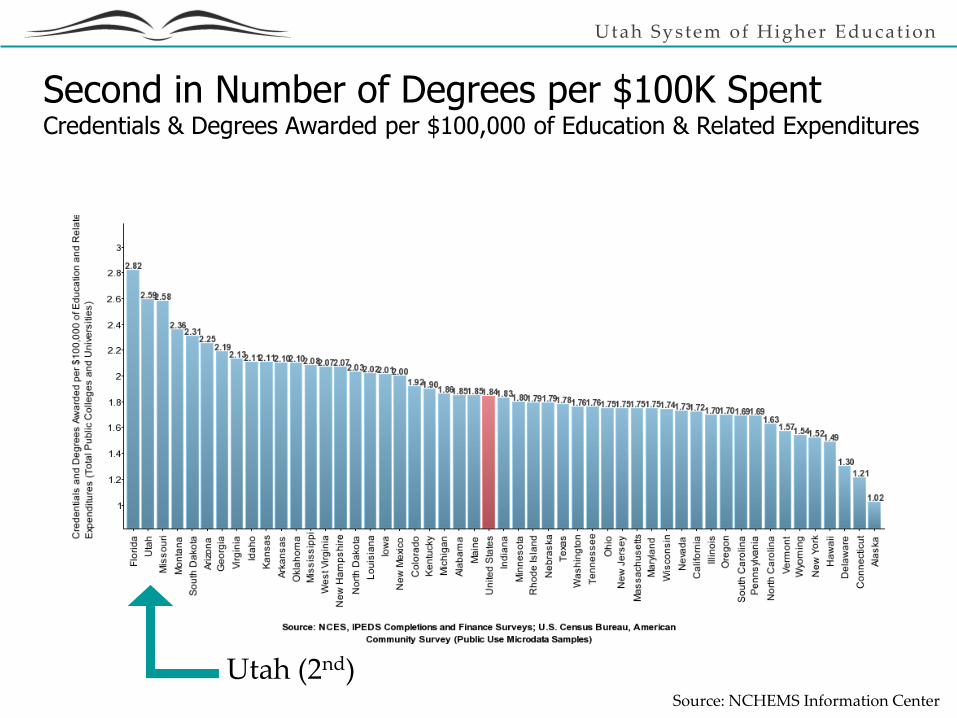
Source: NCHEMS Information Center
Utah (2nd)
Second in Number of Degrees per $100K SpentCredentials & Degrees Awarded per $100,000 of Education & Related Expenditures
Utah System of Higher Educat ion
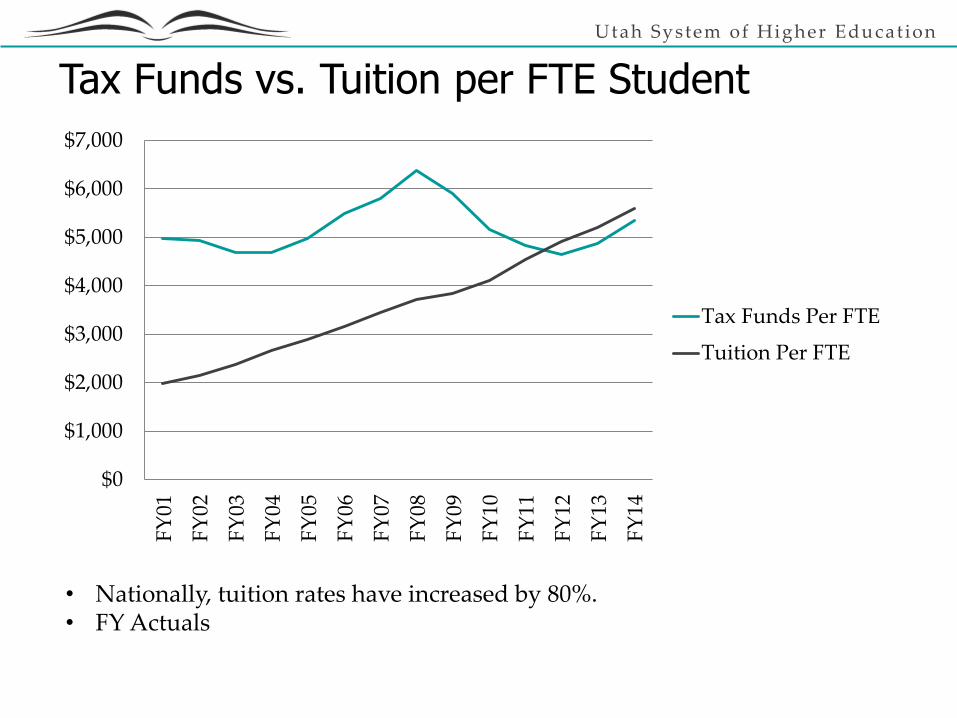
Tax Funds vs. Tuition per FTE Student
$0
$1,000
$2,000
$3,000
$4,000
$5,000
$6,000
$7,000F
Y01
FY
02
FY
03
FY
04
FY
05
FY
06
FY
07
FY
08
FY
09
FY
10
FY
11
FY
12
FY
13
FY
14
Tax Funds Per FTE
Tuition Per FTE
• Nationally, tuition rates have increased by 80%.• FY Actuals

Utah System of Higher Educat ion
FY2008
Tax Funds
63%
Tuition
37%
FY2013
Tax Funds
48%
Tuition
52%
Utah Average Tuition & State Funding SupportFunding per Student FTE
FY2015*
Tax Funds
51%
Tuition
49%
*Budgeted

Utah System of Higher Educat ion
AFFORDABILITY
Utah System of Higher Educat ion
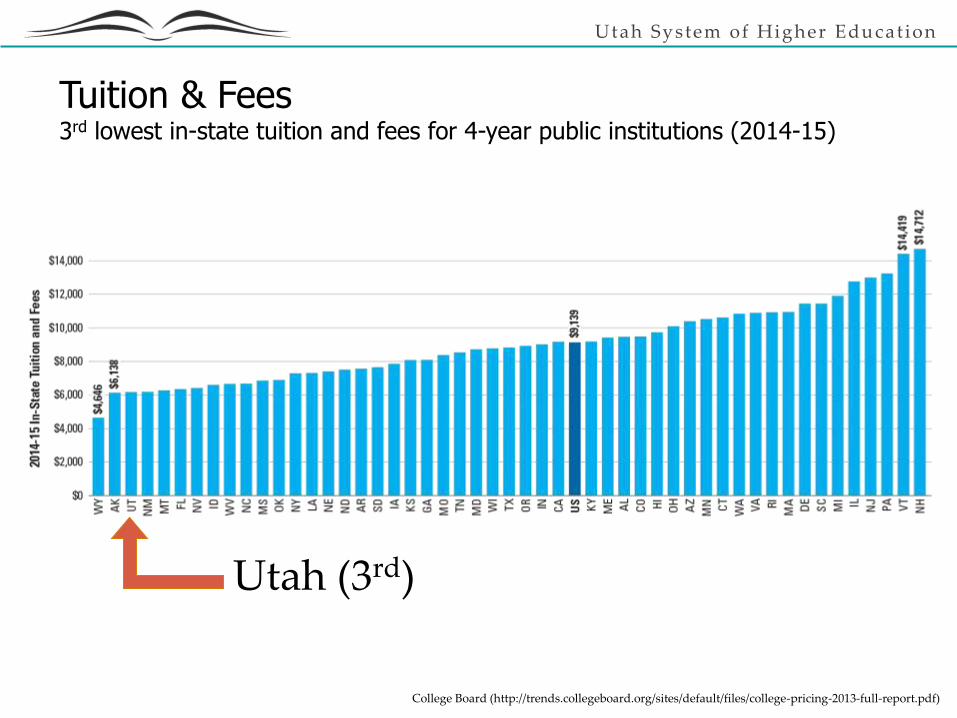
Tuition & Fees3rd lowest in-state tuition and fees for 4-year public institutions (2014-15)
Utah (3rd)
College Board (http://trends.collegeboard.org/sites/default/files/college-pricing-2013-full-report.pdf)
Utah System of Higher Educat ion
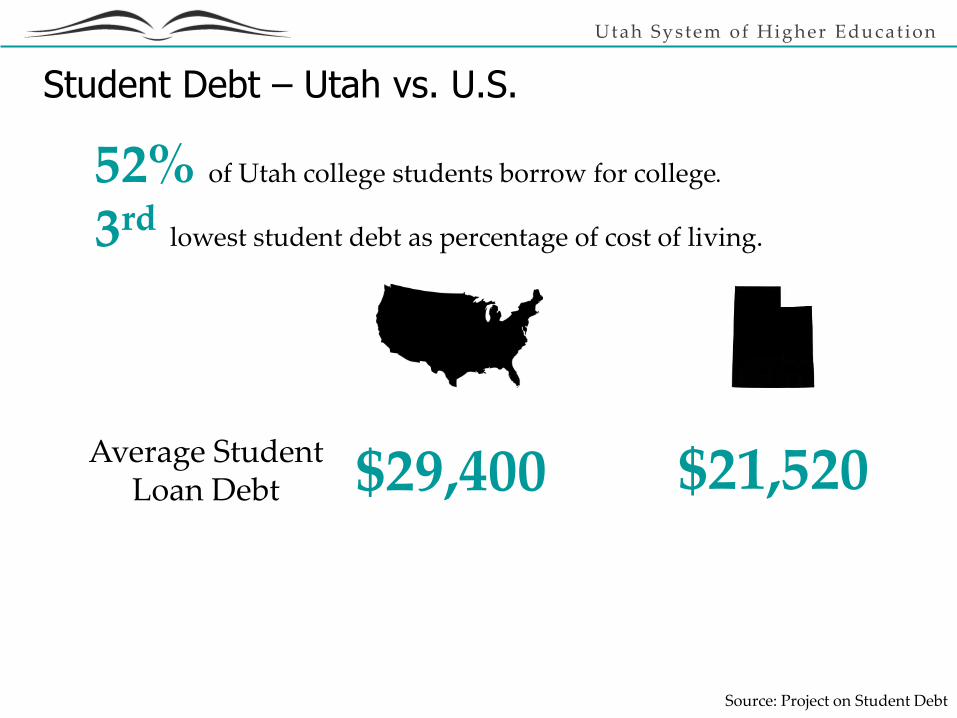
Student Debt – Utah vs. U.S.
Source: Project on Student Debt
52% of Utah college students borrow for college.
3rdlowest student debt as percentage of cost of living.
Average Student Loan Debt $29,400 $21,520
Utah System of Higher Educat ion
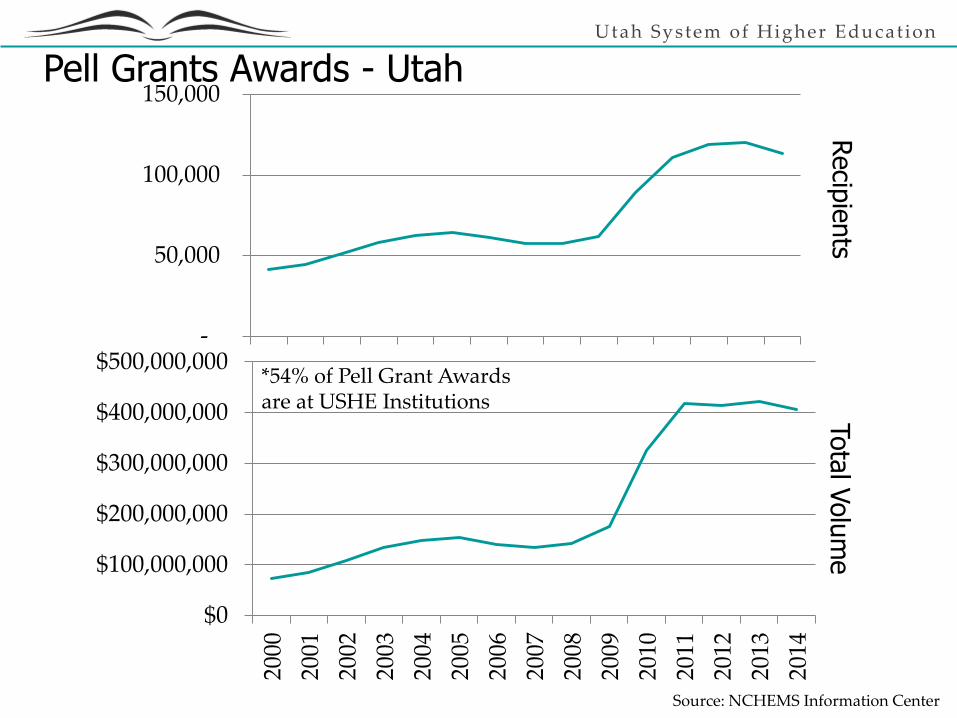
Source: NCHEMS Information Center
Pell Grants Awards - Utah
-
50,000
100,000
150,000
$0
$100,000,000
$200,000,000
$300,000,000
$400,000,000
$500,000,000
2000
2001
2002
2003
2004
2005
2006
2007
2008
2009
2010
2011
2012
2013
2014
Recip
ients
Tota
l Volu
me
*54% of Pell Grant Awards are at USHE Institutions
Utah System of Higher Educat ion
USE OF TECHNOLOGY
Utah System of Higher Educat ion
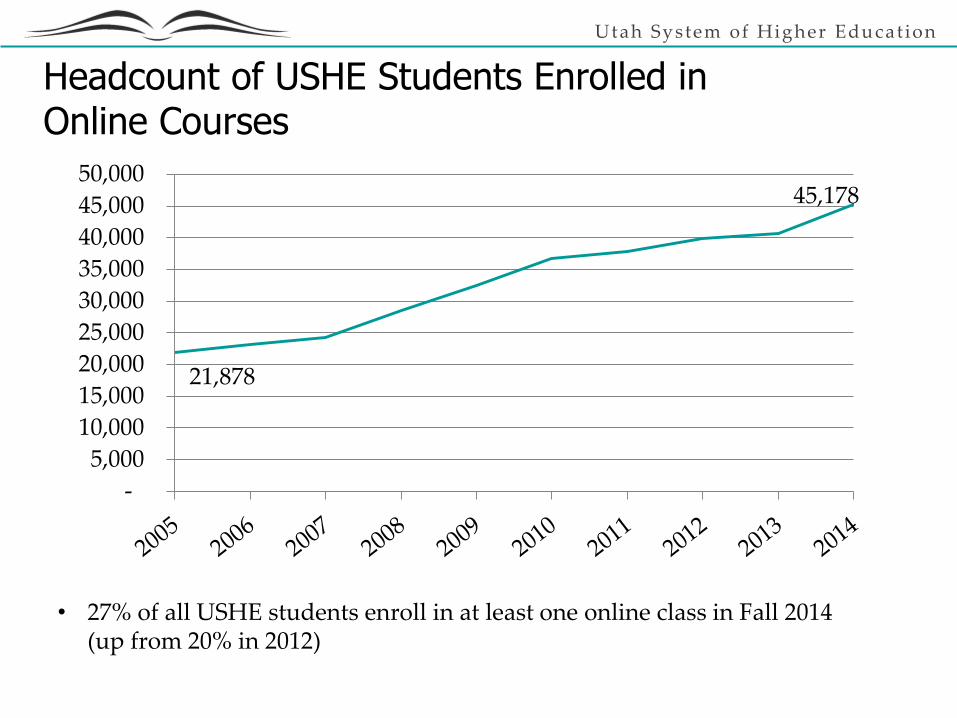
21,878
45,178
-
5,000
10,000
15,000
20,000
25,000
30,000
35,000
40,000
45,000
50,000
• 27% of all USHE students enroll in at least one online class in Fall 2014(up from 20% in 2012)
Headcount of USHE Students Enrolled inOnline Courses
Utah System of Higher Educat ion
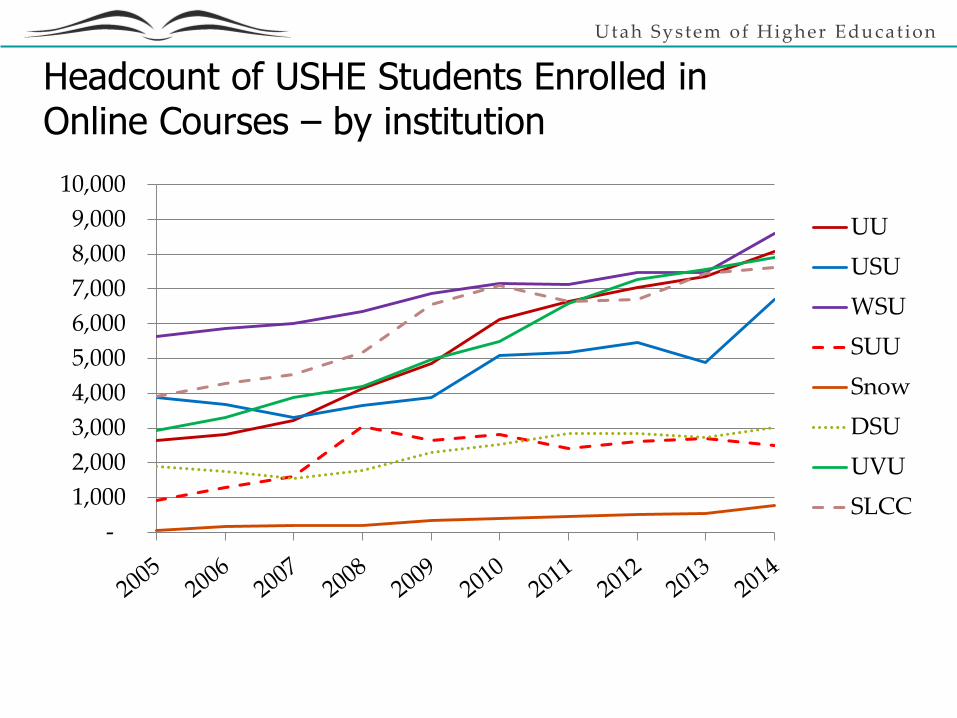
Headcount of USHE Students Enrolled inOnline Courses – by institution
-
1,000
2,000
3,000
4,000
5,000
6,000
7,000
8,000
9,000
10,000
UU
USU
WSU
SUU
Snow
DSU
UVU
SLCC
Utah System of Higher Educat ion
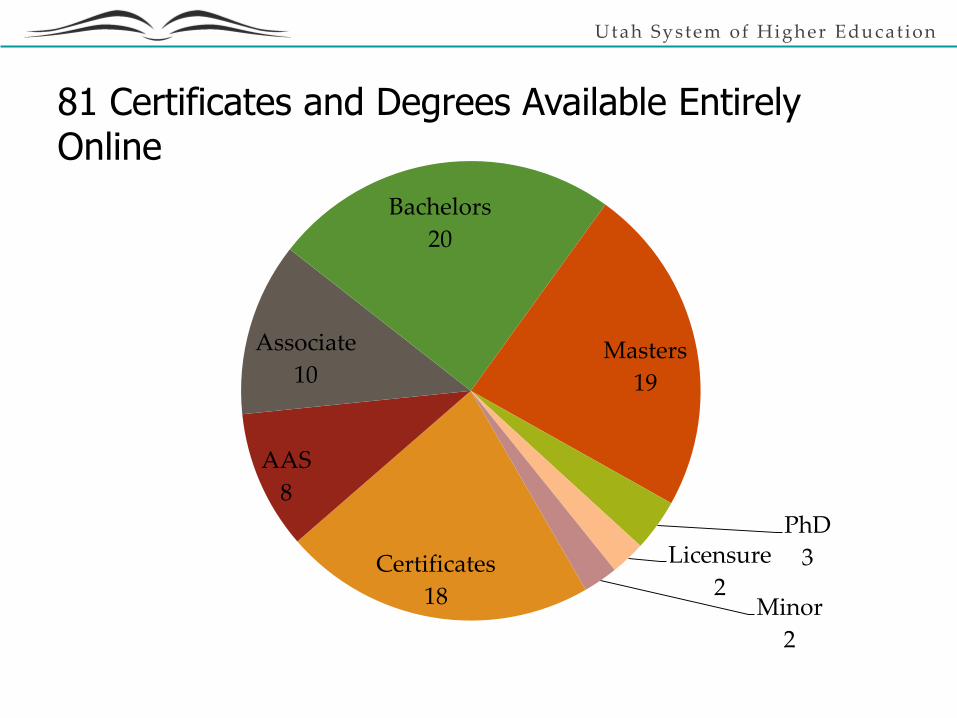
Certificates
18
AAS
8
Associate
10
Bachelors
20
Masters
19
PhD
3Licensure
2Minor
2
81 Certificates and Degrees Available Entirely Online
Utah System of Higher Educat ion
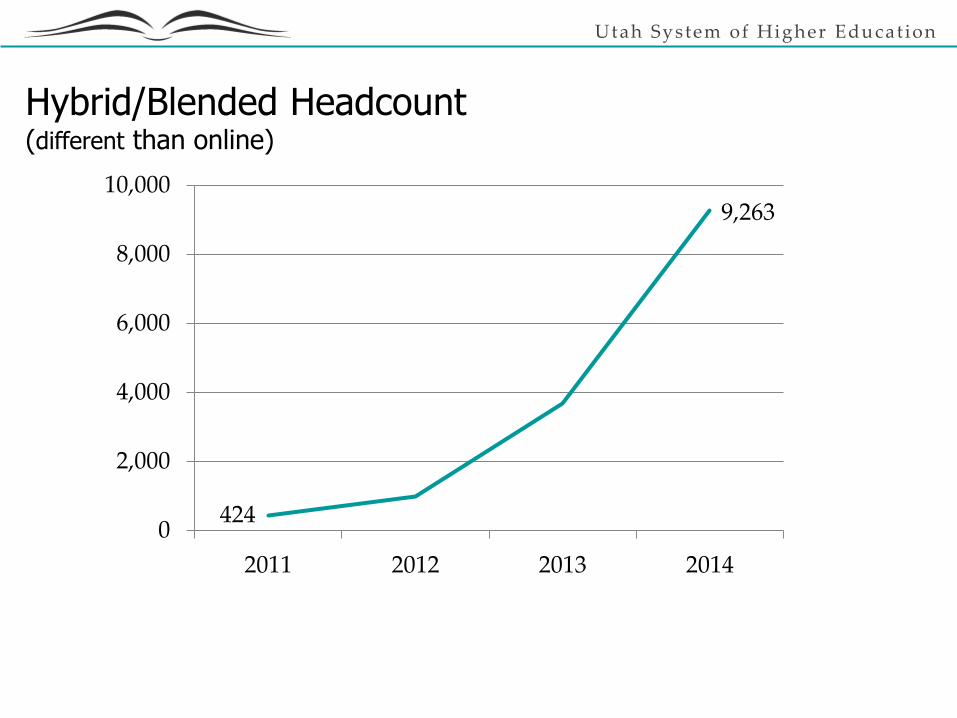
Hybrid/Blended Headcount(different than online)
424
9,263
0
2,000
4,000
6,000
8,000
10,000
2011 2012 2013 2014
Utah System of Higher Educat ion
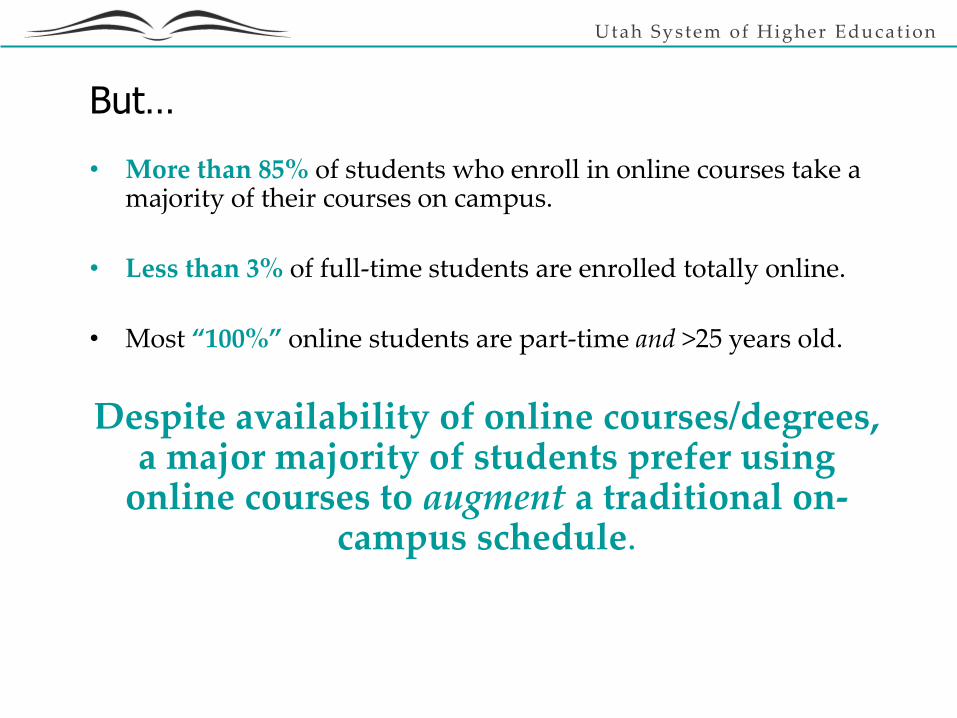
But…
• More than 85% of students who enroll in online courses take a majority of their courses on campus.
• Less than 3% of full-time students are enrolled totally online.
• Most “100%” online students are part-time and >25 years old.
Despite availability of online courses/degrees, a major majority of students prefer using
online courses to augment a traditional on-campus schedule.

Utah System of Higher Educat ion
BENEFITS OF HIGHER EDUCATION
Utah System of Higher Educat ion
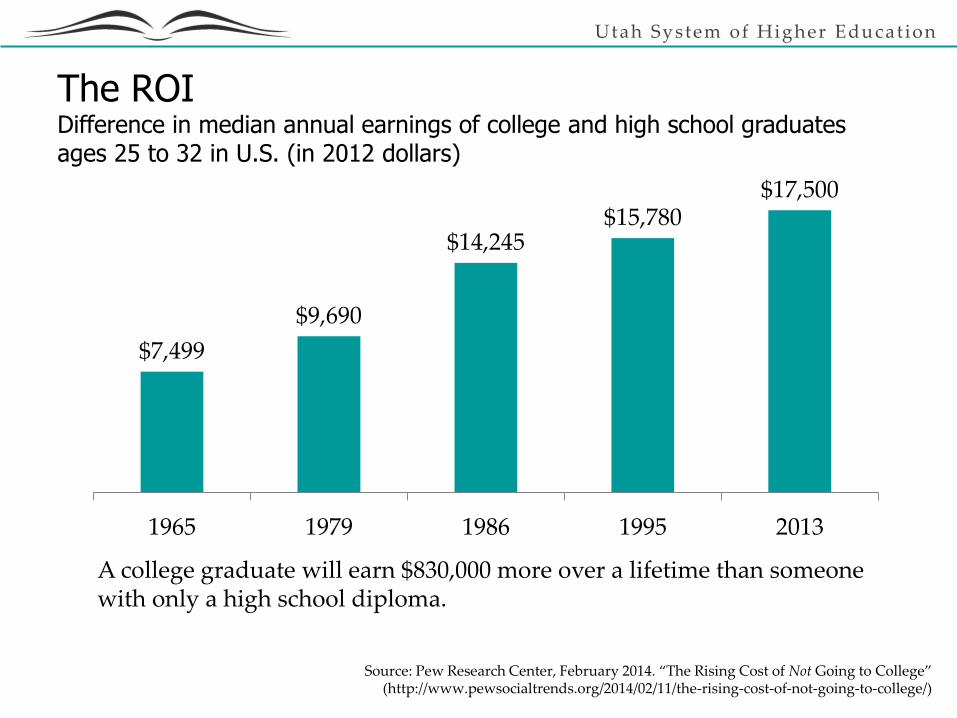
The ROIDifference in median annual earnings of college and high school graduates ages 25 to 32 in U.S. (in 2012 dollars)
Source: Pew Research Center, February 2014. “The Rising Cost of Not Going to College” (http://www.pewsocialtrends.org/2014/02/11/the-rising-cost-of-not-going-to-college/)
$7,499
$9,690
$14,245 $15,780
$17,500
1965 1979 1986 1995 2013
A college graduate will earn $830,000 more over a lifetime than someone with only a high school diploma.
Utah System of Higher Educat ion
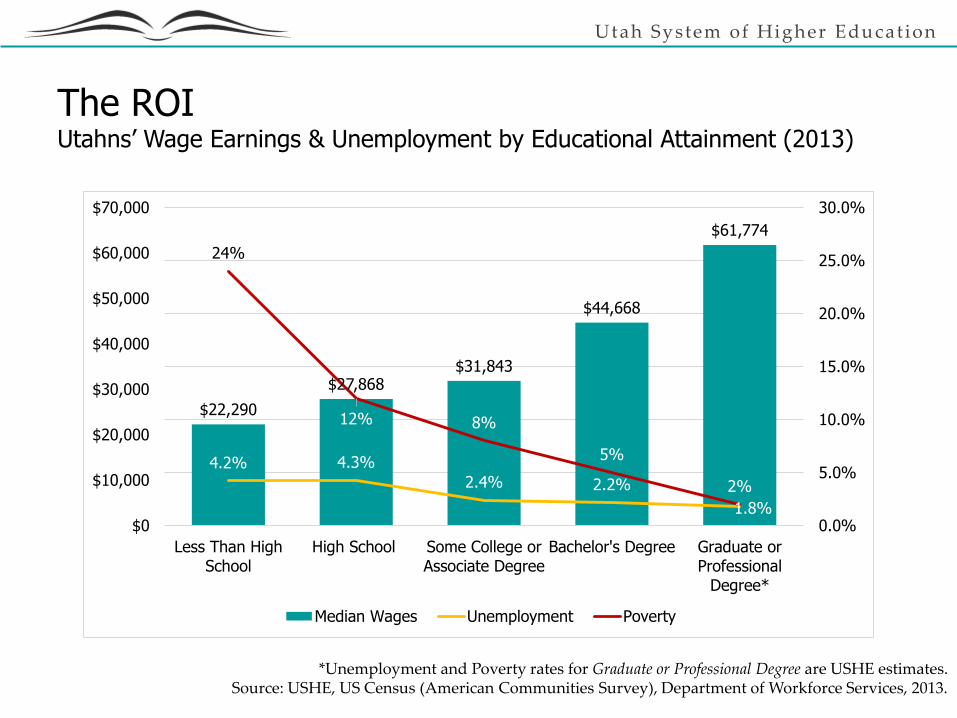
*Unemployment and Poverty rates for Graduate or Professional Degree are USHE estimates.Source: USHE, US Census (American Communities Survey), Department of Workforce Services, 2013.
$22,290
$27,868$31,843
$44,668
$61,774
4.2% 4.3%
2.4% 2.2%
1.8%
24%
12% 8%
5%
2%
$0
$10,000
$20,000
$30,000
$40,000
$50,000
$60,000
$70,000
Less Than HighSchool
High School Some College orAssociate Degree
Bachelor's Degree Graduate orProfessional
Degree*
0.0%
5.0%
10.0%
15.0%
20.0%
25.0%
30.0%
Median Wages Unemployment Poverty
The ROIUtahns’ Wage Earnings & Unemployment by Educational Attainment (2013)
Utah System of Higher Educat ion
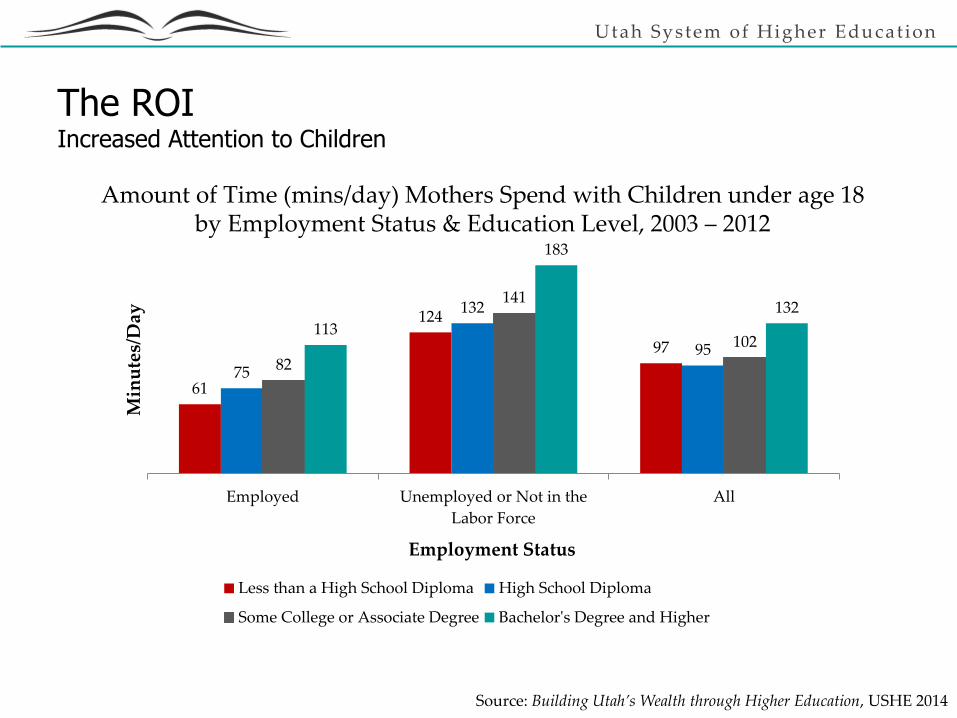
Source: Building Utah’s Wealth through Higher Education, USHE 2014
61
124
97
75
132
9582
141
102113
183
132
Employed Unemployed or Not in the
Labor Force
All
Min
ute
s/D
ay
Employment Status
Less than a High School Diploma High School Diploma
Some College or Associate Degree Bachelor's Degree and Higher
Amount of Time (mins/day) Mothers Spend with Children under age 18 by Employment Status & Education Level, 2003 – 2012
The ROIIncreased Attention to Children
Utah System of Higher Educat ion
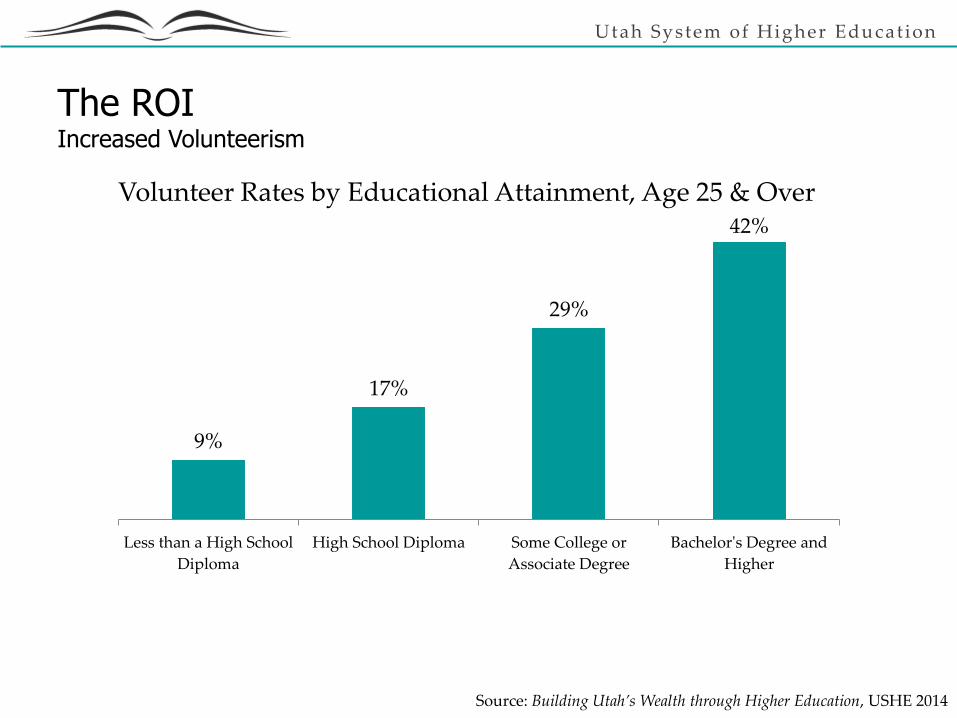
Source: Building Utah’s Wealth through Higher Education, USHE 2014
9%
17%
29%
42%
Less than a High School
Diploma
High School Diploma Some College or
Associate Degree
Bachelor's Degree and
Higher
Volunteer Rates by Educational Attainment, Age 25 & Over
The ROIIncreased Volunteerism
Utah System of Higher Educat ion
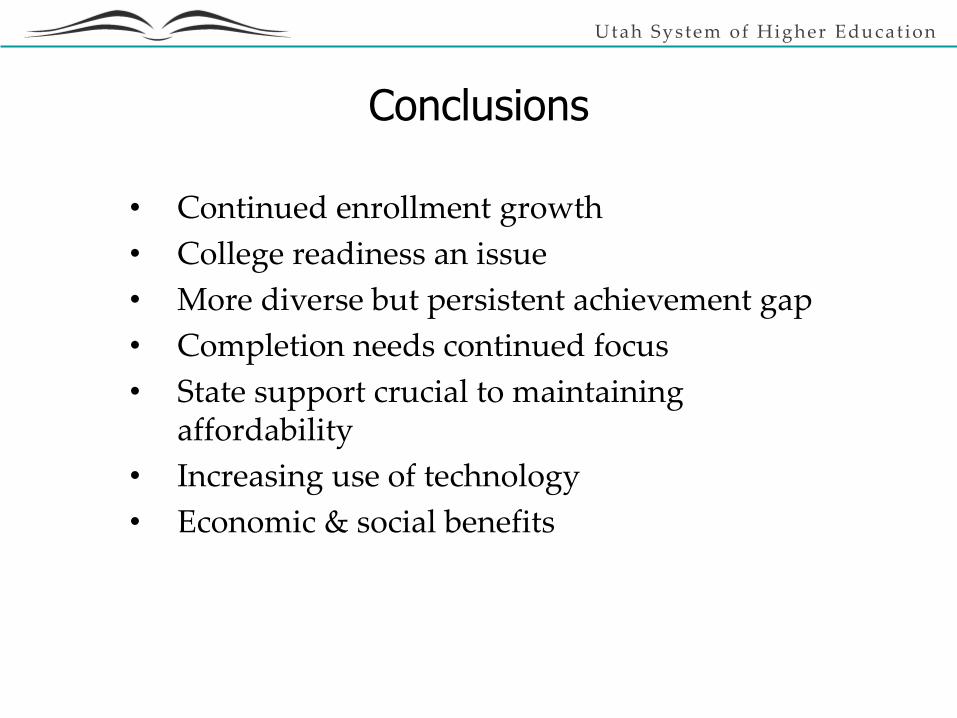
Conclusions
• Continued enrollment growth
• College readiness an issue
• More diverse but persistent achievement gap
• Completion needs continued focus
• State support crucial to maintaining affordability
• Increasing use of technology
• Economic & social benefits

Utah System of Higher Educat ion
Opening Graphic