reformers and wreckers - reform | reform is an …€¦ · 2 reformers and wreckers reform reform...
TRANSCRIPT
Reformers and wreckers
Dale BassettThomas CawstonAndrew HaldenbyPatrick Nolan
Nick SeddonWill TannerKimberley Trewhitt
September 2011

1
Reformers and wreckers
The authorsDale Bassett is Research Director at Reform.
Thomas Cawston is a Senior Researcher at Reform.
Andrew Haldenby is Director at Reform.
Patrick Nolan is Chief Economist at Reform.
Nick Seddon is Deputy Director at Reform.
Will Tanner is a Researcher at Reform.
Kimberley Trewhitt is a Researcher at Reform.

2
Reformers and wreckers
ReformReform is an independent, non-party think tank whose mission is to set out a better way to deliver public services and economic prosperity. Reform is a registered charity, the Reform Research Trust, charity no. 1103739. This publication is the property of the Reform Research Trust.
We believe that by reforming the public sector, increasing investment and extending choice, high quality services can be made available for everyone.
Our vision is of a Britain with 21st Century healthcare, high standards in schools, a modern and efficient transport system, safe streets, and a free, dynamic and competitive economy.
Reformers and wreckers
Dale BassettThomas CawstonAndrew HaldenbyPatrick NolanNick SeddonWill TannerKimberley Trewhitt
September 2011

Contents
Executive summary 5
1. Case studies 8
2. The exception rather than the rule 35
3. Policy debate 46
4. A high productivity public sector – recommendations 54
5. References 60
6. Annex 69
Executive summary
This report presents evidence from eight case studies of successful public service reform in the UK and overseas. They show that reform of the workforce is an essential means of improving public services as well as reducing their costs. The case studies suggest that the key outcomes of successful workforce reform are:
> Reduced headcount. Successful reform achieves more productive public services. When budgets are constrained, higher productivity delivers a higher quality, better developed and smaller workforce. For example, between 1997 and 2007, Merseyside Fire and Rescue Service reduced the number of fulltime firefighters by nearly 40 per cent while reducing the number of fires and fire deaths. Between April 2010 and March 2011, Birmingham City Council reduced the size of its workforce by nearly 10 per cent, reduced contract agency use by 32 per cent and overtime by 37 per cent.
> New types of role beyond the traditional definitions of “front line” workers. The examples of excellent healthcare in the Indian healthcare system set out in this report are based on specialisation in cardiac care and optical care. Doctors carry out high numbers of operations, supported by skilled teams, and so achieve higher rates of quality. In the cardiac Narayana Hrudayalaya hospital in Bangalore, the complication rate is typically 1.7 per cent. By comparison, in the UK, the re-operation rate for bleeding or other problems was 4.9 per cent for 2004-08.
> Continuous professional development (CPD). Effective CPD is less common in the public sector but is a much faster way to improve the quality of staff than improved recruitment alone. For example, following the introduction of a comprehensive CPD programme at Denbigh High School in Luton in the 1990s, the proportion of children achieving the standard benchmark at age 16 has risen from 27 per cent of pupils in 1998 to 100 per cent in 2010 (achievement of five GCSEs at grades A*-C). The school also outperforms the average on the new English Baccalaureate measure.
> Reduction in sickness absence. Sickness absence is not inevitable. It can be reduced by effective management. Between 1995 and 2008, Merseyside Fire and Rescue Service reduced the average sickness absence from 19 shifts per firefighter to just under five, saving £2 million per year.
> Reduced costs. As well as reduced headcount, successful reform reduces costs associated with wasted effort and poor performance. Greater Manchester Police’s reforms have saved £20 million while reducing the time taken to investigate a crime from 50 days to 15 days. Birmingham City Council’s reduction in headcount saved £56 million in 2010-11.
The exception rather than the ruleUnfortunately the efforts of these excellent public sector managers remain the exception rather than the rule. Commonly, public sector managers oversee a corrosive employment culture where poor performance is tolerated and good performance is unrewarded. Employers are much more likely to resist external appointment and to pay by length of service rather than performance. Evidence shows:
> Only 8 per cent of private sector organisations pay by length of service, compared to 57 per cent of public sector organisations.
> Only 7 per cent of private sector service organisations operate a pay spine, compared to 64 per cent of public service organisations
> 38 per cent of public sector organisations offer bonus and incentive schemes, compared to 81 per cent of private sector service organisations.
> On most recent figures, the average job tenure in the public sector is 10.1 years compared to 7.7 years in the private sector. On average, teachers have worked for 23 years when they retire and police officers nearly 25 years.
> Only 25 per cent of job vacancies in the private sector are filled internally, compared to 45 per cent of public sector organisations.
> 9.6 working days are lost in absence in the public sector per year, compared to 6.6 in the private sector. Public sector workers are much less satisfied with their employment than private sector workers.
5
Reformers and wreckersExecutive summary
6
Reformers and wreckersExecutive summary
The public sector workforce is by far the greatest cost of UK public services. In 2010-11, the cost of the public service workforce accounted for £200 billion of the near £700 billion of public spending. Any genuine reform programme for public services must mean a new settlement for the public sector workforce.
Policy debateThe strikes of June 2011 have brought the reform of the public service workforce to the top of the political agenda. The goal of policy should be a high productivity public sector. A high productivity public sector would deliver greater value to taxpayers and would justify higher wages for public sector workers.
The agenda for the 2011 TUC conference shows that the leaders of the trade union movement actually favour a low productivity public sector. Its recommendation of wider national bargaining would reduce the ability of managers to link pay and performance. Its recommendation of a toleration of sickness absence would reduce the output of the public sector and increase management costs. In the former Prime Minister Tony Blair’s contrast between “reformers and wreckers”, it amounts to a wreckers’ charter. The Government should reject these recommendations.
The TUC should accept reductions in public sector employment because they are manageable. The Office for Budget Responsibility has forecast public sector job losses of 400,000 by 2016. Research shows:
> Because of high levels of turnover in the public sector, reducing headcount by 400,000 can be achieved in five years by not replacing just 11 per cent of workers who leave.
> 400,000 job losses represents just eight weeks of job losses in the private sector.
RecommendationsThis report makes several recommendations to Government and also acts as a submission to the second stage of the Winsor Review. Its recommendations are:
Headcount and pay > All of Government needs to adopt the Home Office’s argument that the quality of service is not
determined by the number of public servants employed. Ministers should support public service managers who reduce front line headcount and pay for the right reasons.
> The Government should abandon the ban on salaries above the level of the Prime Ministers’ salary. It is an own goal which is entirely contradictory to the goal of a high productivity public sector. The transformation of public services will need committed leaders with reasonable salaries.
Whitehall > The Government should reverse its decision to ban government departments from taking
consultancy advice. It is another own goal to restrict the pool of skills available to Ministers as they face the considerable challenge of reforming public services.
NHS > Negotiate pay locally. NHS consultants and GPs are among the best paid in the world, yet
productivity, quality and responsiveness vary significantly. National contracts make it impossible to innovate with performance related pay, while merit awards and incentives in the Quality and Outcomes Framework have demonstrated very poor value for money.
> Make clinicians financially accountable. Clinicians are responsible for using medical resources, but rarely accountable for the costs of delivery. Some Foundation Trusts have identified the costs of individual procedures and units (“service line management”, “patient level costing”) but there is still significant variation in health spending on similar procedures.
> Use existing flexibilities. NHS Trusts, PCTs and Foundation Trusts are free to depart from Agenda for Change. However so far only Southend Foundation Trust has developed alternative terms and conditions.

7
Reformers and wreckersExecutive summary
Schools > Abolish the School Teachers’ Review Body and give all schools autonomy to set pay and conditions
for all staff. The Government has already rightly abolished the School Support Staff Negotiating Body.
> End the remaining regulations into the size and quality of the teaching workforce, for example those to be overseen by the new Teaching Agency. The Government’s reforms to performance management are a step forward but do not represent the fundamental shift in the responsibility for teaching performance from government to schools.
Police > Give senior police officers flexibility over pay, to reflect the role staff are performing, their value
(determined by a range of factors including experience, skills and commitment) and how well they perform.
> Support senior officers who impose more rigorous and quantifiable performance measurement than currently. For example, it makes little sense for police officers to undergo a fitness test on recruitment but not again during their employment.
> Make much greater use of shorter commissions. The police service is jeopardising its own quality by making it difficult for excellent people to enter and leave policing more flexibly.
> Allow compulsory redundancy for officers as well as staff. Because of reductions in police staff, forces are likely to be more dominated by police officers by the end of this Parliament, reversing the recent improvements in workforce mix.
> Reform officers’ pensions to remove the financial penalty for early retirement.
> Make the national apparatus of pay negotiation redundant given the changes above.

8
Reformers and wreckersCase studies
8
1Case studies
Surrey Police Greater Manchester PoliceNHS North WestCardiac care in Narayana Hrudayalaya Hospital, BangaloreOphthalmology at Aravind Eye CareDenbigh High SchoolBirmingham City CouncilMerseyside Fire and Rescue
Reformers and wreckersCase studies
9
Reformers and wreckersSurrey Police
Surrey Police
Challenges 1Over the past decade police forces in England and Wales have been focused, both by internal police direction and central government mandate, on improving operational efficiency in order to release greater resources to the front line.2 While a proportion of these savings have been identified through back office functions, the fact that the workforce commands the vast majority of spending has meant that forces have increasingly turned to workforce reform for long-term sustainable savings.3
The challenge for the police service is therefore to reduce spending on the workforce without reducing either police effectiveness or public confidence.4 In 2005, the Association of Chief Police Officers argued that “the police workforce is in many ways obsolete with inefficient and restrictive practices causing waste and suppressing latent capacity”, advocating instead the modernisation of working practices to meet public need and a greater alignment of tasks to skills and rewards.5
Within this, successive reports have identified a number of key areas for improvement: streamlining management, including the use of overtime; reducing the use of warranted officers for non-essential roles; and introducing greater flexibility in police shift patterns.6
Method
Transforming the workforce mixIn 2004, Surrey Police moved from a traditional Criminal Investigation Department (CID) model to a mixed team approach in which activity is better aligned with specialist skills and powers. Within the new model, warranted CID officers complete activities for which their skills and powers demanded, while civilian staff have assumed many non-essential policing duties. Within the 60 new mixed investigative teams, two civilian staff assumed investigative duties previously undertaken by officers, led by a detective constable and a police staff coordinator.7
The civilianisation of police roles within front line policing operations, such as crime investigation, has been recognised by a number of reviews and bodies, including the National Policing Improvement Agency,8 the Audit Commission and Her Majesty’s Inspectorate of the Constabulary,9 as a highly effective means of releasing police officers to the front line while improving value for money, outcomes and public confidence.
1 Audit Commission, Her Majesty’s Inspectorate of Constabulary, and Wales Audit Office (2010), Sustaining value for money in the police service, p. 37.
2 In 1999, the previous Labour Government introduced police efficiency targets to improve efficiency by two per cent a year, encouraging Chief Constables to re-invest savings in the front line. These continued throughout Labour’s time in power, including proposals in the 2009 Policing White Paper for police forces to find £70 million a year in savings from more effective deployment and management specifically. For more information see: Home Office (1999), Annual Report; and Home Office (2009), Protecting the public: Supporting the police to succeed.
3 House of Commons Home Affairs Select Committee (2010), Fifth report of session 2009-10: Police Service Strength, 19 January, p. 13: “given that 88 per cent of police budgets are spent on the workforce...the service should pursue innovative means of delivery that can allow it to operate with a reduced workforce, if necessary, as a means of managing spending cuts”.
4 Audit Commission (2010), Developing transformational efficiency in Surrey, 20 July.5 Association of Chief Police Officers (2005), Draft ACPO vision for workforce modernisation: The missing component of
police reform, 12 October.6 In 2004, the Home Office Study of Police Resource Management and Rostering Arrangements found that a well-designed
variable shift arrangement “can provide up to 70 per cent more officers on duty than a shift pattern with flat supply”. 7 Audit Commission (2010), Developing transformational efficiency in Surrey, 20 July.8 National Policing Improvement Agency (2010), Changing the Workforce Mix: VfM Toolkit 5.1, p. 3: “A number of forces
working with the NPIA have been able to achieve financial savings and efficiency improvements, whilst improving customer satisfaction. They have done so by re-designing business processes and changing the workforce mix in front line operational functions, such as crime investigation.”
9 Audit Commission, Her Majesty’s Inspectorate of Constabulary, and Wales Audit Office (2010), Sustaining value for money in the police service, pp. 35-37: “Some police forces have already improved performance and saved money by changing the workforce mix. There are more opportunities to make decisions about saving money and redeploying police officers.”
“Some police forces have already improved performance and saved money by changing the workforce mix. There are more opportunities to make decisions about saving money and redeploying police officers.”1
10
Reformers and wreckersSurrey Police
Streamlining management and command structureIn 2010, Surrey Police announced a review of leadership posts as part of wider structural changes within the force. The review of leadership posts aims to save £8.4 million over five years.10 Chief Constable Mark Rowley has set out his desire to reduce management costs by nearly half.11 In addition, Surrey Police moved to a single functional command structure in April 2010, in order to reduce duplication and streamline the service.12
As warranted officers are servants of the crown and cannot be made redundant, Surrey Police has also reduced the number of senior positions by implementing the controversial regulation A19 in order to force senior officers to retire after 30 years of service.13 14
Resources aligned to demandThe introduction of a new CID workforce mix has allowed Surrey Police to better align policing activity with demand. Surrey Police altered the resource mix and shift patterns of CID teams according to demand, matching skills and powers to task. Surrey Police has also investigated the possibility of introducing a variable shift pattern to give greater flexibility to the workforce. However, the stringency of current officer terms and conditions have prevented successful implementation at this time.15
In addition, Surrey Police and Surrey Police Authority developed an initiative, named ‘Surrey Public First’, in 2007 in order to focus resources upon key local issues and improve public confidence in the police.16 In 2009, Surrey Police Authority agreed force proposals for an Operational Policing Review, in order to improve performance against local priorities, embed neighbourhood policing, reorganise the organisation and property estate, and reduce costs in order to recruit up to 200 extra constables by April 2012.17
Outcomes18
Improved public confidenceSince moving to a more flexible, demand-led approach, Surrey Police has recorded extremely high public confidence. For instance, the introduction of mixed teams has led to a three times increase in the number of follow-up visits with victims, enabling a better service for victims and their families.19 Surveys of public confidence in the police record as much as 86.5 per cent of local people having confidence in the police.20
A more effective police serviceThe move to mixed CID teams has led to significant improvements in the quality of volume crime investigation in Surrey. The new mixed team approach has increased the efficiency of the CID teams by 42 per cent since implementation and reduced the length of time taken to investigate undetected crimes from 47 to 36 days.21 In addition, response rates to Grade 1 incidents within target time rose from 76 per cent to 81 per cent.
10 Audit Commission (2010), Developing transformational efficiency in Surrey, 20 July.11 Rowley, M. (2011), Surrey Police, bureaucracy and the front line, Daily Telegraph, 15 April.12 Audit Commission (2010), Developing transformational efficiency in Surrey, 20 July.13 BBC Online (2010), “Police ‘may force officers to retire to cut costs’”, 4 November. 14 Under Provision A19 of Police Pensions Regulations 1987, these powers can only be used if officers’ continued service
“would not be in the general interests of efficiency”.15 In 2010, Surrey Police moved from the largely discredited 5 week Ottawa shift arrangement of 8 to 10 hour shifts, to a
30 week split-shift pattern consisting of 4 hour shifts, 2 hours off. These changes were estimated to reduce 21 police officer posts, realising a saving of £1 million over three years. However, it has had to revert to the Ottawa shift pattern after current regulations made it unworkable. The move towards a more variable shift pattern is in line with Home Office studies of police working practices, including a 2004 study which found that a well-designed variable shift arrangement “can provide up to 70 per cent more officers on duty than a shift pattern with flat supply”. Home Office (2004), Study of Police Resource Management and Rostering Arrangements.
16 Surrey Police Authority (2009), Chief Constable’s report to the police authority, 10 December.17 Ibid.18 Her Majesty’s Inspectorate of Constabulary (2010), Police authority inspection report: Surrey Police, September 2010,
p. 10. 19 ACPO (2005), Draft ACPO vision for workforce modernisation: The missing component of police reform, 12 October.20 Surrey Police Authority (2009), Chief Constable’s report to the police authority, 10 December.21 National Policing Improvement Agency, Home Office and Deloitte (2010), The National Workforce Modernisation
Programme: Evaluation of demonstration sites: Final Report.
“Recent external evaluations of workforce modernisation cite improvements in performance and customer satisfaction and substantial financial savings.”18
“Surrey is a high-performing force and the county is one of the safest in the country. Public confidence levels in policing are high.”25
11
Reformers and wreckersSurrey Police
Serious crime reduced by more than 20 per cent between 2006 and 2009, with the force on course for further reductions.22 Overall, crime reduced by more than 5 per cent between 2008 and 2010, and has a crime rate “consistently below that of the average for similar forces”.23 While this is not to say that police activity is the sole driver of falling crime, the most recent inspection of Surrey Police Authority by Her Majesty’s Inspectorate of Constabulary states that “Surrey is a high-performing force and the county is one of the safest in the country”.24
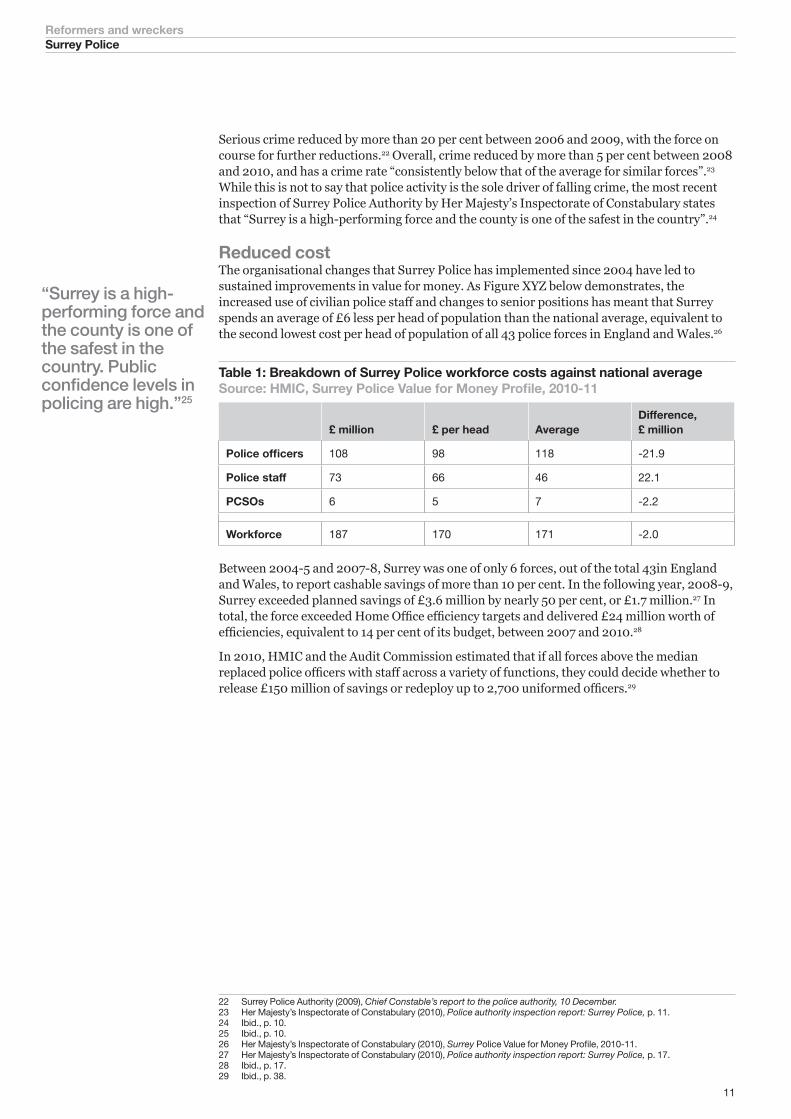
Reduced cost 25The organisational changes that Surrey Police has implemented since 2004 have led to sustained improvements in value for money. As Figure XYZ below demonstrates, the increased use of civilian police staff and changes to senior positions has meant that Surrey spends an average of £6 less per head of population than the national average, equivalent to the second lowest cost per head of population of all 43 police forces in England and Wales.26
Table 1: Breakdown of Surrey Police workforce costs against national averageSource: HMIC, Surrey Police Value for Money Profile, 2010-11
£ million £ per head AverageDifference, £ million
Police officers 108 98 118 -21.9
Police staff 73 66 46 22.1
PCSOs 6 5 7 -2.2
Workforce 187 170 171 -2.0
Between 2004-5 and 2007-8, Surrey was one of only 6 forces, out of the total 43in England and Wales, to report cashable savings of more than 10 per cent. In the following year, 2008-9, Surrey exceeded planned savings of £3.6 million by nearly 50 per cent, or £1.7 million.27 In total, the force exceeded Home Office efficiency targets and delivered £24 million worth of efficiencies, equivalent to 14 per cent of its budget, between 2007 and 2010.28
In 2010, HMIC and the Audit Commission estimated that if all forces above the median replaced police officers with staff across a variety of functions, they could decide whether to release £150 million of savings or redeploy up to 2,700 uniformed officers.29
22 Surrey Police Authority (2009), Chief Constable’s report to the police authority, 10 December.23 Her Majesty’s Inspectorate of Constabulary (2010), Police authority inspection report: Surrey Police, p. 11.24 Ibid., p. 10.25 Ibid., p. 10. 26 Her Majesty’s Inspectorate of Constabulary (2010), Surrey Police Value for Money Profile, 2010-11.27 Her Majesty’s Inspectorate of Constabulary (2010), Police authority inspection report: Surrey Police, p. 17.28 Ibid., p. 17. 29 Ibid., p. 38.
“QUEST has made performance improvement part of everyday business in GMP. It’s changed our culture. But most importantly, QUEST has helped us to give a better service to the people of Manchester. It’s a simple as that.”30
12
Reformers and wreckersGreater Manchester Police
Greater Manchester Police
The challenge 30Historically, Greater Manchester Police (GMP) has been a force with a reputation for a relentless focus on output, such as the numbers of arrests or the numbers of detections, and a daunting ‘performance regime’ to underpin that focus. However, up to 2008 the system was not translating into sustainable performance improvement. In 2009, GMP was rated 42nd of 43 forces in the baseline assessments by Her Majesty’s Inspectorate of Constabulary. The system of work, coupled with a strong focus on traditional performance measures and a high crime workload, was leading to a demoralised workforce and driving a culture that incentivised perverse behaviours.31 A number of issues, such as inefficient deployment of officers for neighbourhood policing and the incorrect grading of calls from the public, were of particular cause for concern.32
In November 2008, GMP commissioned Operation QUEST, a joint Home Office and KPMG programme of systems and process re-engineering, in order to improve operational performance and identify productivity savings for reinvestment into frontline policing. In doing so, it was also expected to drive a change in cultural norms and start to embed continuous improvement as a way of doing business. The programme was piloted in two policing Divisions, Salford and Tameside, before being rolled out to the remaining 10 Divisions in 2010 and 2011.
Methods
Neighbourhood-based policingIn December 2009, GMP introduced the ‘New Policing Model’, which redesigned the force approach around neighbourhood policing in order to make the force more effective and responsive to the public.33 This included the creation of new Neighbourhood Investigation Units to increase efficiencies in investigating crime and strengthen neighbourhood policing. Within the units, police staff would undertake all secondary investigations, aside from those taken by the Volume Crime Team and the CID Main Office, thereby releasing officers onto front line duties.34
In addition, PCSOs complete a neighbourhood survey every quarter in each ward in Salford. This involves a direct approach to residents to seek their views on local priorities, the product of which is used to inform the setting of local priorities.35
Streamlined response coordinationAt the heart of Operation QUEST was the creation of a ‘Hub’ in each Division, including a full-time intelligence desk to supply live-time tasking and coordination of police activity, and a customer service desk to provide direct contact and support for victims and reporters of crime.36
The Hub enables each Division to access a comprehensive overview to assess threats, harm and risks in real time and to streamline activity to ensure a quick and effective response.37 The customer service desk aims to reduce officer workload by conducting telephone resolution of Grade 4 incidents not requiring deployment and scheduling surgeries for cases that warrant
30 Peter Fahy, QPM, Chief Constable, Greater Manchester Police. Reform (2011), Value for money in policing: From efficiency to transformation, p. 13.
31 Reform (2011), Value for money in policing: From efficiency to transformation.32 Her Majesty’s Inspectorate of Constabulary (2008),Greater Manchester Policing: Neighbourhood Policing, Citizen Focus
Policing, pp. 14-23.33 Launching the scheme, Chief Constable Peter Fahy said: “The model starts from the principle that we have to put more into
solving neighbourhood level problems overall, to provide a better service to the public and over time to reduce the demand placed on this force”. Brief: The Voice of Greater Manchester Police (2009), ‘A model approach to policing’, December, p. 1.
34 Her Majesty’s Inspectorate of Constabulary (2010), Inspection of Salford Basic Command Unit, Greater Manchester Police, p. 34.
35 Ibid., p. 34. 36 Brief: The Voice of Greater Manchester Police (2009), “A model approach to policing”, December, p. 1.37 Ibid., p. 1.
13
Reformers and wreckersGreater Manchester Police
further resolution.38 Further development of this approach, including the successful implementation of the New Policing Model across all 12 GMP Divisions, has incorporated greater use of the Hub as the driving force of a more responsive, neighbourhood-based service.39
Continuous improvement 40In addition, GMP invested in long-term, sustainable improvement by building capability and training officers and staff in the QUEST methodology. The programme employed a bottom-up approach to service transformation, actively involving front line practitioners in the process and harnessing strong senior leadership in order to embed changes and give the organisation the skills and processes to sustain improvement for itself.
Outcomes
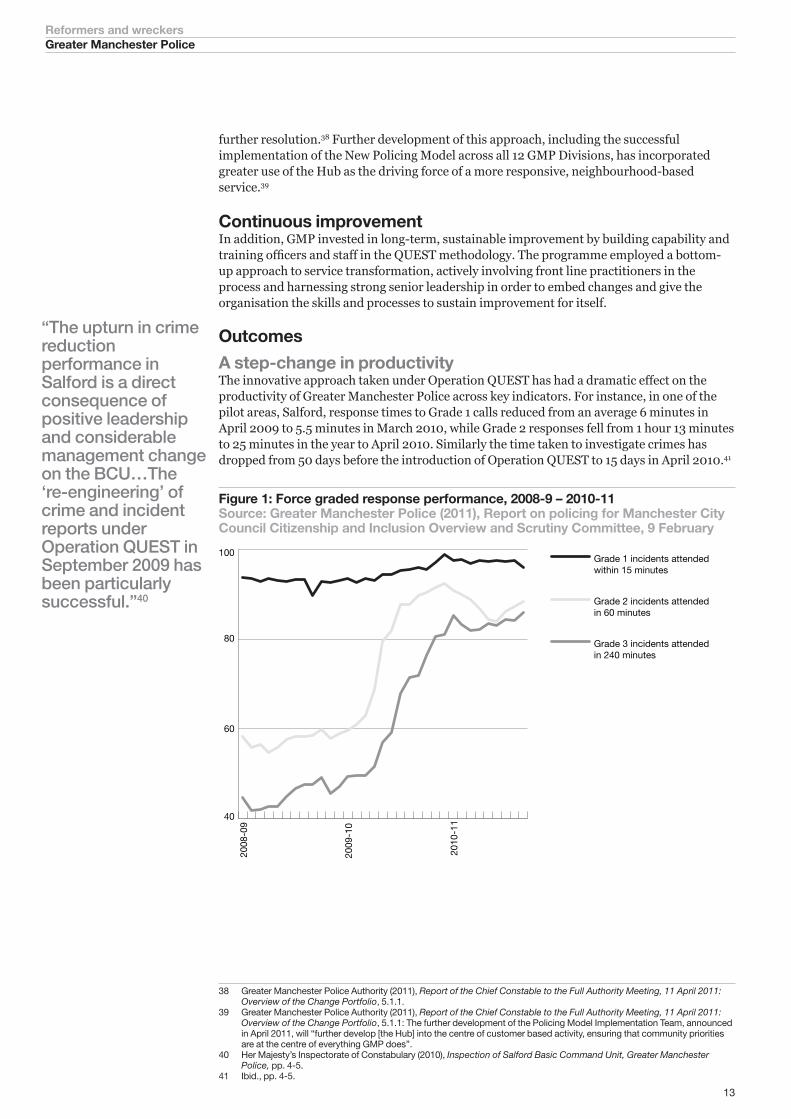
A step-change in productivityThe innovative approach taken under Operation QUEST has had a dramatic effect on the productivity of Greater Manchester Police across key indicators. For instance, in one of the pilot areas, Salford, response times to Grade 1 calls reduced from an average 6 minutes in April 2009 to 5.5 minutes in March 2010, while Grade 2 responses fell from 1 hour 13 minutes to 25 minutes in the year to April 2010. Similarly the time taken to investigate crimes has dropped from 50 days before the introduction of Operation QUEST to 15 days in April 2010.41
Figure 1: Force graded response performance, 2008-9 – 2010-11Source: Greater Manchester Police (2011), Report on policing for Manchester City Council Citizenship and Inclusion Overview and Scrutiny Committee, 9 February
40
60
80
100
Grade 3 incidents attended in 240 minutes
Grade 2 incidents attended in 60 minutes
Grade 1 incidents attended within 15 minutes
2010
-11
2009
-10
2008
-09
38 Greater Manchester Police Authority (2011), Report of the Chief Constable to the Full Authority Meeting, 11 April 2011: Overview of the Change Portfolio, 5.1.1.
39 Greater Manchester Police Authority (2011), Report of the Chief Constable to the Full Authority Meeting, 11 April 2011: Overview of the Change Portfolio, 5.1.1: The further development of the Policing Model Implementation Team, announced in April 2011, will “further develop [the Hub] into the centre of customer based activity, ensuring that community priorities are at the centre of everything GMP does”.
40 Her Majesty’s Inspectorate of Constabulary (2010), Inspection of Salford Basic Command Unit, Greater Manchester Police, pp. 4-5.
41 Ibid., pp. 4-5.
“The upturn in crime reduction performance in Salford is a direct consequence of positive leadership and considerable management change on the BCU…The ‘re-engineering’ of crime and incident reports under Operation QUEST in September 2009 has been particularly successful.”40
14
Reformers and wreckersGreater Manchester Police
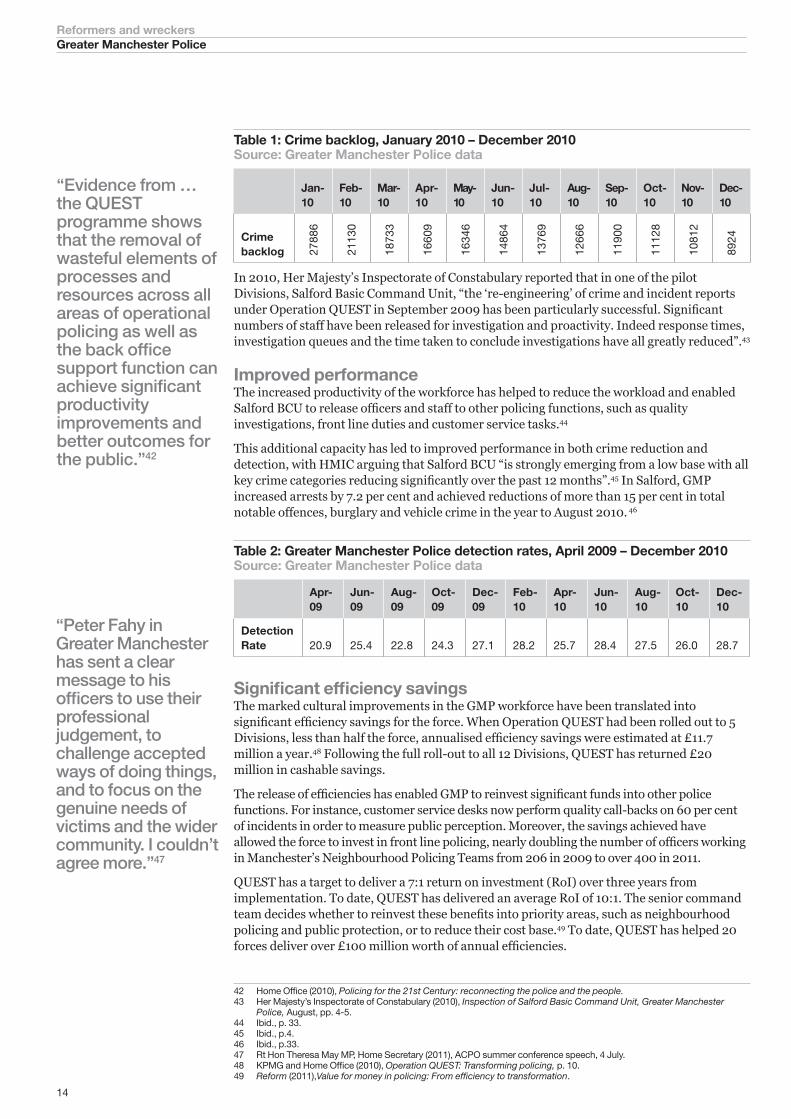
Table 1: Crime backlog, January 2010 – December 2010 42Source: Greater Manchester Police data
Jan- 10
Feb- 10
Mar- 10
Apr- 10
May- 10
Jun- 10
Jul- 10
Aug- 10
Sep- 10
Oct- 10
Nov- 10
Dec- 10
Crime backlog 27
886
2113
0
1873
3
1660
9
1634
6
1486
4
1376
9
1266
6
1190
0
1112
8
1081
2
8924
In 2010, Her Majesty’s Inspectorate of Constabulary reported that in one of the pilot Divisions, Salford Basic Command Unit, “the ‘re-engineering’ of crime and incident reports under Operation QUEST in September 2009 has been particularly successful. Significant numbers of staff have been released for investigation and proactivity. Indeed response times, investigation queues and the time taken to conclude investigations have all greatly reduced”.43
Improved performanceThe increased productivity of the workforce has helped to reduce the workload and enabled Salford BCU to release officers and staff to other policing functions, such as quality investigations, front line duties and customer service tasks.44
This additional capacity has led to improved performance in both crime reduction and detection, with HMIC arguing that Salford BCU “is strongly emerging from a low base with all key crime categories reducing significantly over the past 12 months”.45 In Salford, GMP increased arrests by 7.2 per cent and achieved reductions of more than 15 per cent in total notable offences, burglary and vehicle crime in the year to August 2010. 46
Table 2: Greater Manchester Police detection rates, April 2009 – December 2010Source: Greater Manchester Police data
Apr-09
Jun-09
Aug-09
Oct-09
Dec-09
Feb-10
Apr-10
Jun-10
Aug-10
Oct-10
Dec-10
Detection Rate 20.9 25.4 22.8 24.3 27.1 28.2 25.7 28.4 27.5 26.0 28.7
Significant efficiency savings 47The marked cultural improvements in the GMP workforce have been translated into significant efficiency savings for the force. When Operation QUEST had been rolled out to 5 Divisions, less than half the force, annualised efficiency savings were estimated at £11.7 million a year.48 Following the full roll-out to all 12 Divisions, QUEST has returned £20 million in cashable savings.
The release of efficiencies has enabled GMP to reinvest significant funds into other police functions. For instance, customer service desks now perform quality call-backs on 60 per cent of incidents in order to measure public perception. Moreover, the savings achieved have allowed the force to invest in front line policing, nearly doubling the number of officers working in Manchester’s Neighbourhood Policing Teams from 206 in 2009 to over 400 in 2011.
QUEST has a target to deliver a 7:1 return on investment (RoI) over three years from implementation. To date, QUEST has delivered an average RoI of 10:1. The senior command team decides whether to reinvest these benefits into priority areas, such as neighbourhood policing and public protection, or to reduce their cost base.49 To date, QUEST has helped 20 forces deliver over £100 million worth of annual efficiencies.
42 Home Office (2010), Policing for the 21st Century: reconnecting the police and the people.43 Her Majesty’s Inspectorate of Constabulary (2010), Inspection of Salford Basic Command Unit, Greater Manchester
Police, August, pp. 4-5. 44 Ibid., p. 33.45 Ibid., p.4.46 Ibid., p.33.47 Rt Hon Theresa May MP, Home Secretary (2011), ACPO summer conference speech, 4 July.48 KPMG and Home Office (2010), Operation QUEST: Transforming policing, p. 10. 49 Reform (2011),Value for money in policing: From efficiency to transformation.
“Evidence from … the QUEST programme shows that the removal of wasteful elements of processes and resources across all areas of operational policing as well as the back office support function can achieve significant productivity improvements and better outcomes for the public.”42
“Peter Fahy in Greater Manchester has sent a clear message to his officers to use their professional judgement, to challenge accepted ways of doing things, and to focus on the genuine needs of victims and the wider community. I couldn’t agree more.”47
15
Reformers and wreckersNHS North West
NHS North West
Challenges Health systems around the world are increasingly engaging in skill mix redesign. Changing medical needs and the drive to develop patient-centred integrated care, as well as the high cost of trained physicians and workforce shortages, have created a growing interest in modernising the workforce. There has been particular interest in the mix of doctors and nurses, and moving away from traditional assumptions on professional abilities.50 New clinical roles, such as specialist and advanced nurses, have been introduced, and a greater focus on maximising the skills of clinical teams as opposed to autonomous practitioners.
Through changing the skill mix of the workforce healthcare providers can deliver more patient centred specialist care, and support greater innovation and service redesign. Whilst the available evidence on skill mix in health systems has its limitations,51 there is reason to believe that, particularly when looking at the overlap between doctors and nurses, there is scope to improve effectiveness and efficiency through substituting one caregiver for another.52 53 With the system-wide need to achieve greater value for money in health spending many NHS organisations have developed work force plans based on reforming their skill mix to achieve greater productivity.54
In the past decade there has been an interest within the NHS in developing new clinical roles, to supplement and improve the existing health workforce.55 Since 2000, NHS North West has sought to improve productivity and care quality through changing the skill mix and introducing new medical roles into the healthcare in the region.56 NHS North West is the largest strategic health authority outside London, and the region with the greatest challenges in terms of health deprivation, health inequalities and demographic change.57 The workforce represents between 60 and 70 per cent of the region’s £11 billion annual expenditure on health.58
New roles were developed as part of a wider strategic plan for workforce change, while the strategic health authority developed partnerships with higher education institutions to create new training and qualifications. The “Delivering the workforce” project saw the health authority create the infrastructure for workforce modernisation, with providers responsible for introducing new clinicians into their workforce and managing the skill mix.59
Introducing new clinical roles was intended to support greater innovation in services allowing more cost effective care and substituting clinicians for non-medical care givers, freeing up clinical resources. Ten years on NHS North West has done more than any other strategic health authority to change its skill mix, however the number of new roles in post remains small and the impact has been limited.
50 OECD (2004), Skill-mix and policy change in the health workforce: Nurses in advanced roles. 51 World Health Organization, Skill mix in the health care workforce: reviewing the evidence, 2002, p. 578.52 Ibid., p. 578.53 Laurant, M. et al (2010), Revision of professional roles and quality improvement: a review of the evidence, The Health
Foundation. 54 NHS Employers (2010), “Flexible workforce: strategic planning to reduce costs and improve quality”.55 Laurant, M. et al (2010), Revision of professional roles and quality improvement: a review of the evidence, The Health
Foundation.56 Swift, J. (2010), Skill mix and role redesign, the North West way, presentation at NHS Confederation conference, 12 May. 57 NHS North West (2008), The Workforce, Education Commissioning and Education and Learning Strategy. 58 Ibid. 59 Swift, J. (2010), Skill mix and role redesign, the North West way, presentation at NHS Confederation conference, 12 May.
16
Reformers and wreckersNHS North West
Method
Non-medical consultantsIn 2000, the ‘non-medical consultant’ (NMC) role was introduced in order to improve service and quality by strengthening clinical leadership within the NHS. Within NHS North West there are estimated to be 146 NMCs in post, with 1,212 in post nationally.60 Though only small in number, the role of non-medical consultant practitioners in the North West appears to have had a positive impact on service development and delivery in the region.61
In their roles, NMCs are required to spend time engaged in the functions of leadership, expert clinical practice and advice, education, and development and research, although the division of time between these activities is not equal, or in fact consistent. Within some clinical areas, NMCs are awarded doctoral level certification after four to five years of training.
Though the scheme has not necessarily increased retention rates for clinical staff as intended62, the evidence suggests that in the North West NMCs have added real value to their organisations. Participants in the scheme are making significant contributions locally, and in some cases nationally, driving and supporting quality improvements, innovation, productivity and prevention. However, for schemes such as this to be a wider success, evidence of the role’s impact needs to be shared widely, assisting other organisations in determining their own requirements for NMCs. It is also clear that the success and impact of the NMC role is primarily dependent upon the individual and organisation in which they work. Against great successes, examples of weak workforce planning and a lack of adequate mentoring, support and supervision, highlight that the scheme would benefit from stronger leadership with clear guidance over expectations and outcomes.63
Non-medical consultantsSince 2002, the strategic health authority has sought to increase the number of Assistant Practitioners (APs). There are now 1,200 in post across the region and a further 750 in training.64 Assistant Practitioners are more extensively used in the North West than any other regions, with 84 per cent of trusts in the region having ward based APs compared to 35 per cent in London and 57 per cent in the North East.65 Assistant Practitioners are healthcare workers with a level of knowledge and skill beyond that of traditional healthcare assistants, who carry out tasks previously delivered by a registered professional, which gives them more time to spend on complex cases.66 The creation of a career tailored Foundation Degree in the region has been essential in encouraging the recruitment of Assistant Practitioners.67 As well as freeing up clinical resources, evaluations of Assistant Practitioners have shown they have improved the skill mix of clinical teams and the communication between services.68 Assistant Practitioners have also had an important impact as patient advocates.
At Stockport Foundation Trust, Assistant Practitioners have been introduced to provide care for stroke rehabilitation.69 The Assistant Practitioner carries out a range of therapies according to personalised treatment plans developed by an Occupational Therapist. He or she works with different teams in order to deliver all aspects of the patient’s treatment plan. By working across services, the Assistant Practitioner improves communication and fosters collaboration with other services. The Assistant Practitioner’s job is to finds ways of making
60 These statistics are taken from the NHS Workforce Census statistics (2009), however this number may not be accurate as a result of the approval process being devolved down to SHA level, and there no longer being a central source of this data.
61 NHS North West (2010), A. Daley & C. Mullen Ten Years on – An Evaluation of the Non-Medical Consultant role in the North West.
62 Between 29 per cent and 36 per cent of NMCs surveyed suggested that they had intentions to move on within four years.63 Where NMCs were linked to a university, there is a positive impact on performance and service.64 NHS North West (2011), Allied Health Professions Network, www.ahpn.nhs.uk. Accessed 31 August 2011.65 Spilsbury, K. (2010), Introduction and development of assistant practitioner roles, presentation to the Royal College of
Nursing, January 29. 66 Benson, L. (2005), Delivering the workforce: Evaluation of the introduction of assistant practitioners in 14 pilot sites in
Greater Manchester, Third Interim Report, Manchester Business School; Benson, L. and L. Smith (2006), Delivering the workforce: Evaluation of the introduction of assistant practitioners in seven sites in Greater Manchester, Second Report, Manchester Business School.
67 Selfe, J. et al (2008), Assistant Practitioner Foundation Degree Evaluation Report, University of Central Lancashire. 68 Benson, L. (2005), Delivering the workforce: Evaluation of the introduction of assistant practitioners in 14 pilot sites in
Greater Manchester, Third Interim Report, Manchester Business School; Benson, L. and L. Smith (2006), Delivering the workforce: Evaluation of the introduction of assistant practitioners in seven sites in Greater Manchester, Second Report, Manchester Business School.
69 NHS North West Case Study: http://www.whnt.nhs.uk/document_uploads/Clinical_skills/Case%20Study-Assistant%2023%202%2010.pdf
17
Reformers and wreckersNHS North West
patients more independent, for example, by creating a replicated ‘home environment’ on the ward. When patients are supported to become independent, they are often discharged early which increases the number of available beds. This has led to a reduction in the average length of stay from 30.6 days in 2008 to 25.9 days in 2009.
Advanced practitionersAnother clinical role that was introduced in the North West was the Advanced Practitioner.70 The aim was to use these new clinicians, who are specialist and experienced non-medical professionals, to support more patient centred care and develop improvement in service delivery. Advanced practitioners would work alongside consultants, bringing a more holisitic perspective to diagnosing, treating and developing care plans for patients. The strategic health authority created supporting infrastructure and partnerships across NHS organisations to assist local trusts in introducing new roles, and also worked in partnership with higher education institutes in the region to create Master level qualifications for the new roles. Since their introduction in 2005 there are now 240 Advanced Practitioners in the region with a further 140 in training.71
Non-medical prescribingWith established forums and regional development groups, the North West of England probably has the best developed non-medical prescribing structure,72 and it has the highest level of active non-medical prescribers in the country.73 Non-medical prescribers are making a positive impact on the NHS, improving patient access to medication,74 reducing patient waiting times,75 and reducing costs and the strain on medical practitioners.76 Most medical practitioners responded positively about the contribution of non-medical prescribers to patient outcomes,77 with 82 per cent suggesting that they saved them clinical time.78 However the extent of non-medical prescribing remains very limited. Where new clinical roles have been introduced, such as Advanced Practitioners, they have made little progress in taking over the management of medicine. Evidence of efficiency is still weak.79
Benchmarking workforceThe eWin portal was launched by NHS North West last June. By February 2011, the web portal, which was designed to help providers maximise the productivity and efficiency of their workforces, had been subscribed to by more than 90 per cent of NHS North West organisations, including primary care, mental health, acute and ambulance trusts, and the strategic health authority.80 One of the main components of the system is a benchmarking database which allows organisations to assess their performance against both set benchmarks and other organisations in areas such as grade mix, absence, and turnover rates. Robert Sumpter, who led the project, commented that this part of the system was a powerful motivator that drove innovation.81
The eWin portal also includes a Grade Mix tool, which calculates the potential cost savings of possible workforce configuration changes. Using this tool, NHS North West has identified the potential cost saving of £11.4 million through a reduction of 5 per cent in the Band 5 workforce and an increase of the same number of staff in the Band 4 workforce.82
70 Acton Shapiro (2009), Evaluating the Implementation and Impact of Advanced Practitioners across Greater Manchester – Summary of Findings. Also see, Swift, J. (2009), “Advanced Practitioners”, Health Service Journal, 24 August.
71 NHS North West (2011), Allied Health Professions Network, www.ahpn.nhs.uk. Accessed 31 August 2011.72 NHS North West (2010), An evaluation of the scope and practice of Non medical prescribing in the North West, p. 12. 73 Ibid., 13.74 Ibid., 13, 20.75 Ibid., 15.76 Ibid., 19.77 Ibid.78 Ibid.79 Ibid., 20.80 The Guardian (2011), “Trusts compare staff performance through workforce portal”, February.81 Health Service Journal (2010), “NHS: working smart to improve productivity”, November.82 Ewin website, Skill Mix: Reprofiling the North West workforce.
18
Reformers and wreckersNHS North West
Outcomes
Improved skill mixNHS North West has been the most innovative and successful SHA in modernising its skill mix. Evaluations of the introduction of new roles in the North West show improved access to services and reduced waiting times. Evaluations of the role have suggested that Advanced Practitioners have improved quality, productivity, access to services and patient experience.83 For example, Bolton PCT used Advanced Practitioners to support a coordinated approach to care of older people in care homes and reduce unnecessary hospital admissions, while in Salford PCT they were used to improve access in primary care and reduce pressure on GPs.
Yet mixed resultsHowever the evidence for improved productivity is limited, anecdotal or indirect. Where they have been effectively introduced, there is a great deal of satisfaction with Non-Medical Consultants, Assistant Practitioners and Advanced Practitioners, and an appreciation that they have improved the delivery of care. However their impact is varied. The evaluations highlight the importance of organisational readiness and culture, with some employers only providing limited support to new roles and failing to integrate them into the workforce.84 Consequently new clinical roles were not used to their maximum advantage and ability, and were often used to fill other roles.85 New roles were not always successfully linked with service development and few providers reached a “critical mass” to really use new clinicians to transform services.86.
Reform hamstrung by national frameworksDespite initiatives to increase the diversity of clinicians, the North West’s workforce has been primarily driven by national frameworks. Workforce targets, such as the NHS Plan, have seen a significant increase in doctors and nurses over the past decade. The impact of new clinical roles has also been limited by high cost, inflexible and traditional business models, such as acute hospitals. With traditional delivery of healthcare remaining entrenched workforce redesign has not enabled a wider redesign of health services.
83 Acton Shapiro (2009), Evaluating the Implementation and Impact of Advanced Practitioners across Greater Manchester – Summary of Findings.
84 Acton Shapiro (2009), Evaluating the Implementation and Impact of Advanced Practitioners across Greater Manchester – Summary of Findings.
85 Ibid.86 Ibid.
19
Reformers and wreckersCardiac care in Narayana Hrudayalaya Hospital, Bangalore
Cardiac care in Narayana Hrudayalaya Hospital, Bangalore
Challenges 87In India, the dual pressures of poverty and a large population make effective healthcare delivery especially challenging.88 There is no national health system and health spending accounts for 4.2 per cent of GDP, compared to 9.8 per cent of GDP in the UK.89 Private health spending represents 73.8 per cent of health spending, the highest proportion in the world, in comparison private spending represents 18.3 per cent of all UK health spending. Of private spending on health in India, 90 per cent is out of pocket, with two out of five hospital interventions paid for by individual loans or the sale of assets.90
The large rural population of India means that access to healthcare is low, with less than one doctor per 1,000 people and 1.1 hospital beds per 1,000 people.91 Although 72 per cent of India’s population lives in rural areas, 80 per cent of doctors, 75 per cent of dispensaries and 60 per cent of hospitals are in urban areas.92 In addition, 78 per cent of health infrastructure is secondary care services, with 11 per cent primary and 11 per cent tertiary. The primary care network suffers from severe staff shortages with most clinicians preferring to live and work in urban areas.
Increasing the health resources of the nation requires substantial investment. To achieve the target of two beds per 1,000 population by 2025, an additional 1.75 million beds are needed.93 Similarly, to reach a ratio of one medical doctor per 1,000 individuals by 2025, an additional 700,000 doctors will be required.94
Heart diseaseIndians are generally three times more susceptible than Europeans to heart attacks. Every year, 2.5 million people require heart surgeries, yet the combined capacity of Indian hospitals totals less that 90,000 surgeries a year. 95
Method
“Walmart approach”India needs low cost, high productivity care. Focused business models delivering specialist care have allowed health providers to dramatically reduce costs and maximize work force productivity. Narayana’s guiding mission is to bring high cost and complex healthcare to the poor. There is a sense among the medical and non-medical staff of belonging to the institution and ownership of its objectives. Narayana Hrudayalaya was established in 2001 by the world renowned heart surgeon Dr Devi Shetty. It has since become Asia’s largest cardiac center and attracts patients from 76 countries. The 1,000 bed cardiac hospital is part of 5,000 “health city” spread over 25 acres in Bangalore in South India. Organizing health care at such scale has enabled to Narayana to achieve higher volumes at lower costs and better quality.
Specialisation Narayana Hrudayalaya delivers a limited range of medical services, but at far larger scale. This lowers costs and improves outcomes. Narayana’s 1,000 bed heart hospital performs 35 heart surgeries a day on average and a maximum of 60 a day in its 24 operating theatres.96 Machines, equipment and facilities – a large proportion of cardiac surgery costs – are used at
87 Dr Devi Shetty, in Reform (2011), A lot more for a lot less.88 The World Bank estimates that GDP per capita in India is $1,192, compared to GDP per capita of $35,165 in the UK. 89 World Health Organisation (2009); OECD (2010), Health data.90 Kothandaraman, P. and S. Mookerjee (2007), “Healthcare for All: Narayana Hrudayalaya, Bangalore”, Growing Inclusive
Markets, United Nations Development Programme. 91 Ibid. The UK has an average 2.7 doctors per 1,000 population and an average 3.3 hospital beds per 1,000 population. 92 KPMG (2011), Indian Healthcare System Overview. 93 Ibid.94 Ibid.95 Dr Devi Shetty, in Reform (2011), A lot more for a lot less. 96 Ibid.
“When doctors are not aware about the cost implications they always tend to ask for the fastest scanner and the most expensive medicine. But there is a limit…In one week you can teach them about finance. It is not very difficult. And it will be very hard for a finance man to learn about medicine. So it’s much easier for a doctor to be taught about finance management.”87
20
Reformers and wreckersCardiac care in Narayana Hrudayalaya Hospital, Bangalore
a much higher rate, bringing down per unit costs. By comparison the largest specialist heart hospital in England has 270 beds and 5 operating theatres, and has 58 operating sessions a week.97 As Dr. Devi Shetty argued at Reform’s health conference A lot more for a lot less, “Healthcare is all about numbers. When we do 60 major heart surgeries a day your results will always get better.”98
Intensive work 99Doctors at Narayana are paid the Indian average, but work to a much higher level of productivity. Heart surgeons at Narayana perform an average of two or three procedures a day, six days a week. They typically work 60 to 70 hours a week.100 35 per cent of surgeons’ pay is based on performance.101 NHS surgeons would normally undertake 150-200 procedures a year, and under the consultant contract, hospital consultants’ basic salary is based on 40 hours a week of ten programmed activities of four hours, additional programmed activities beyond 40 hours a week are paid for at plain-time or premium time rates.102
Maximizing consultant time and low skilled staffWhile healthcare in the NHS and the West in a high skilled industry, Indian innovators have challenged professional assumptions about what functions different health workers can perform.103 Narayana’s workforce is led by 42 internationally trained and experienced consultant surgeons.104 Senior doctors occupy similar roles to the NHS, providing consultations for patients, meeting surgical candidates, leading operations and discharging patients. However their productivity is significantly higher. Surgeons do between 1-5 operations and 70-100 consultations a day. Consultant productivity is maximised through using their time effectively and the support of lower skilled staff.105 Junior surgeons would open and close surgical procedures while consultants would only do the most complex part of the operation. Allowing them to spend one hour on a six hour operation, and often do two procedures at once. In addition Narayana make much greater use of pre-graduate doctors and low skilled staff, often in the form of non-clinical employees trained in specific tasks.106
Financial responsibility and clinical leadershipAt Narayana clinical leadership is a reality, doctors are accountable for the costs and quality of healthcare as well as the benefits. Clinicians, as well as managers, are focused on financial management. At Narayana profit and loss is studied daily. At 12.00 pm every doctor and administrator gets an SMS text message with the profit and loss account of the previous day.107 The high level of standardisation of surgical procedures ensures the consistency of costs.
Key to the high level of outcomes in Narayana is harnessing the competitive nature of doctors.108 Transparency of outputs and outcomes for each surgeon is monitored, shared and peer pressure creates the incentives for constant improvement. Data is used to create and improve clinical guidelines and a decision aid for surgeons. Waiting times and outcomes for operations are measured for each surgeon. Lower level clinicians are accountable for specific clinical procedures and outcomes, for example nurse managers are responsible for monitoring and reducing the rate of bed sores, while specialist intensive care practitioners are accountable for the performance of the ICU.
97 Papworth NHS Foundation Trust (2010), Annual Report.98 Dr Devi Shetty, in Reform (2011), A lot more for a lot less. 99 Ibid. 100 Anand, G. (2009), “The Henry Ford of Heart Surgery”, The Wall Street Journal, 21 November.101 The Society for Cardiothoracic Surgery in Great Britain & Ireland (2008), Sixth National Adult Cardiac Surgical Database
Report 2008.102 National Audit Office (2007), Pay Modernisation: A new contract for NHS consultants in England. 103 See Fulton, D. et al (2011),” Health workforce skill mix and task shifting in low income countries: a review of recent
evidence”, Human Resources for Health, Vol 9. 104 Narayana Hrudayalaya (2011), narayanahospitals.com.105 Khanna, T. et al (2005), “Narayana Hrudayalaya Heart Hospital: Cardiac Care for the Poor”, Harvard Business School.106 India Knowledge (2010),“Narayana Hrudayalaya: A Model for Accessible, Affordable Health Care?” Wharton School.107 Dr Devi Shetty, in Reform (2011), A lot more for a lot less. 108 Ibid.
“We have a lot of rules and regulations about what is a quality of every person involved in the healthcare. When somebody does an appendix operation the person who hands over the instrument has to be a BSc in Nursing. Is it required for that qualified person to do this?”99
21
Reformers and wreckersCardiac care in Narayana Hrudayalaya Hospital, Bangalore
Technology and community servicesThe use of telecare to bring expert medical care to the local level remains limited in the NHS. In the developed world consultants have been reluctant to maximise productivity through technology and working outside the hospital. Dr Shetty has developed community cardiac services to improve access for the rural poor. Smaller Coronary Care Units (CCUs) are linked to the major cardiac centres and GPs are trained to provide checks and administer basic treatment. Hospital based specialists provide consultations through the internet and videoconferencing. To date 53,000 patients have been treated this way. Only 1 per cent of cases treated in CCUs require surgery.109
Outcomes 110
Low costNarayana delivers cardiac care at a cost lower than any other hospital in India and at a fraction of what it would cost elsewhere in the world. In the NHS, the tariff cost for cardiac surgery ranges from £8,226 to £11,757 depending on the level of complexity.111 In India, cardiac surgeries typically cost around US$5,000-US$7,000 (£3,100-£4,340).112 At Narayana Hrudayalaya, surgeries cost less than US$1,800 (£1,116), irrespective of the complexity of the procedure or the length of hospitalisation.113
High qualityNarayana’s mortality rate of around 2 per cent and hospital-acquired infection rate of 2.8 per 1,000 ICU days are comparable to the best hospitals across the world. 114 There is a 1.4 per cent mortality rate within 30 days of coronary artery bypass graft surgery, one of the most common procedures, compared with an average of 1.9 per cent in the U.S.115 According the European Association for Cardio Thoracic Surgery the mortality rate for England was 1.8 per cent, while the European average is 2.4 per cent.116 The complication rate is 1.7 per cent, by comparison in the UK the re-operation for bleeding or other problems is 4.9 per cent for 2004-8. Narayana’s performance would be even better if justified for risk.
109 Khanna, T. et al (2005), “Narayana Hrudayalaya Heart Hospital: Cardiac Care for the Poor”, Harvard Business School; Dr Devi Shetty, in Reform (2011), A lot more for a lot less.
110 Ibid. 111 Department of Health (2011), NHS Payment by Results 2010-11: National Tariff Information; National Audit Office (2010)
Management of NHS Hospital Productivity.112 Dr Devi Shetty, in Reform (2011), A lot more for a lot less. 113 Ibid.114 India Knowledge (2010),“Narayana Hrudayalaya: A Model for Accessible, Affordable Health Care?” Wharton School.115 Anand, G. (2009), “The Henry Ford of Heart Surgery”, The Wall Street Journal, 21 November. 116 Eurpean Association for Cardio Thoracic Surgery (2010), EACTS Adult Cardiac Surgical Database. Individual Country Report for England.
“At 12.00pm every doctor – every senior doctor, every administrator gets the SMS with the profit and loss account of the previous day. We keep an eye on the profit and loss account (P&L) on a daily basis. If you get the P&L account at the end of the month, it is a post mortem. The patient is dead. If you get the P&L account on a daily basis, it’s a diagnosis and you can treat.”110
22
Reformers and wreckersOphthalmology at Aravind Eye Care
Ophthalmology at Aravind Eye Care
Challenges 117
India has more blind people than any other country, the majority of which is caused unnecessarily by cataracts. Of India’s population of 1.2 billion, 12 million, including 300,000 children, are blind. Around 80 per cent of blindness in India is caused by cataracts. There are just 2 million cataract surgeries every year for an estimated 3.8 million people a year developing cataracts.118 To clear the current backlog India must deliver 5 million eye surgeries a year for a decade.119 In most Indian hospitals the cost of treating cataracts is out of reach for most of the population.
Method
Clinical leadership and missionAravind was set up and is managed by doctors all motivated by the objective of eliminating needless blindness. The hospitals guiding values have created a focus on equity, standardization, compassionate patient centered care, affordability and accountability which is shared by the clinical leaders.120 From its inception Aravind’s guiding slogan was “do more, get less”, and a relentless focus on cost control and clinical achievement drives the system to this day.121 This mission has enabled Aravind’s leaders to perfect the model of healthcare delivery.
SpecialisationThe founder of Aravind based healthcare delivery on the “McDonald’s” approach of developing a process driven model of achieving consistency, quality and affordability.122 Established in 1976, Aravind now operates 4,000 beds in 5 hospitals in the Tamil Nadu region of south India. In addition Aravind runs 39 primary eye care centers and over 2,500 screening camps per year. Aravind Eye Care has specialised and delivers over 315,000 eye surgeries a year. In addition, 2.6 million patients receive out-patient care.123 The largest NHS eye hospital delivers 30,000 surgical operations and 400,000 outpatient admissions each year.124 Diagnosis, referral and procedure are performed quickly as part of a streamlined process and a highly organized pathway.
Doctors are recruited on their commitment over skills and intensively trained in the key opthamological procedures needed by Aravind. While many other hospitals slowly introduce new doctors to surgery, Aravind’s post graduate medical training gets junior doctors performing cataracts in their first year.125 80 per cent of the medical workforce are trained at Aravind. Medical officers rotate through Aravind’s core services, including research, outpatient care, telecare consultations and community services, as well as surgery. The best performers are allowed to specialize. Rather than using financial incentives, to retain the best staff Aravind bring senior doctors into leadership positions.
117 Prahalad, C. (2003), “The Fortune at the Bottom of the Pyramid”, Indian Institute of Management, Ahmedabad.118 Rangan, V. and R. Thulasiraj (2007), “Making sight affordable: Innovations Case Narrative: The Aravind Eye Care System”,
Innovations, MIT.119 Rangan, V. (2006), “Making healthcare affordable for all: A proposed model for transferring technology”, innovations, MIT.120 Ramachandran, J. (2004), “Compassionate, High Quality Health Care at Low Cost: The Aravind Model”, IIMB
Management Review, Vol. 16. 121 Ibid. 122 Ledner, C. (2001), “The perfect vision of Dr V”, Fast Economy, February. 123 Kibasi, T. (2011), “Innovation in healthcare delivery: the power of technology”, The Future of Healthcare in European
Conference, May. 124 Moorfields Eye Hospital NHS Foundation Trust (2010), Annual Report. 125 Ramachandran, J. (2004), “Compassionate, High Quality Health Care at Low Cost: The Aravind Model”, IIMB
Management Review, Vol. 16.
“In many hospitals, many of these functions (especially refraction testing) are carried out by doctors. We seek to maximize the doctors’ contribution by helping them to devote their time mainly to medical advising. Tests that can be done by paramedical staff are done by paramedical staff only. Our counsellors are highly trained to help the patients to make informed decisions, so that doctors are not required to spend their time on such matters.” Dr Aravind Srinivasan117
23
Reformers and wreckersOphthalmology at Aravind Eye Care
Intensive workAravind’s 160 consultants represent 1 per cent of India’s ophthalmologists but perform 5 per cent of total eye surgeries. Doctors at Aravind do 25-40 procedures a day and 2,600 operations a year. This is against a national average of just 400 in India.126 This allows Aravind to perform 850-1000 surgeries each day. There is an assembly line system of operating at Aravind, and surgeons switch between two operating tables with support from staff. 70 per cent of activities in surgery are done by a team of 4 nurses, who prepare a second patient on one table while the surgeon operates on his first patient on the other.127 128 The process is standardised with the use of key skills and discretionary elements reduced to a minimum. Surgeons subspecialise into different procedures.
Lower cost specialist staffWhile healthcare in the NHS and the West in a high skilled industry, Indian innovators have challenged professional assumptions about what functions different health workers can perform. “Task shifting” is an important feature of healthcare in the developing world to address shortages of medical professionals and make health services more affordable.129Aravind maximises doctors’ time by providing them with a high level of trained support. Ophthalmic assistants receive a two-year bespoke training programme and are trained to excel in particular roles on the patient pathway. They specialise in outpatient services, attending wards, assisting surgeons, refraction, patient counselling, housekeeping, and medical records.130 Trained paramedics carry out some of the more routine and repetitive tasks such as taking various measurements, conducting diagnostic tests, and preparing patients.131 Trained counsellors explain diagnosis, treatment options and payment to patients. Consultant Ophthalmologists can concentrate on clinical and surgical care.
TransparencyAravind has invested heavily in IT. Registration and scheduling are computerised, leaving clinicians to focus on treatment. The system generates daily schedules, taking into account that days admissions and patient preferences and planned treatment.132 Patient diagnosis and treatment details are computerized and can be easily accessed by doctors across Aravind sites. Waiting times are monitored in real time and activity. The daily patient demand is forecast based on past trends.133
According to Dr Ravindran, Chairman of Aravind, “transparency promotes a culture of excellence”. Data on inputs and outcomes allow Aravind to benchmark itself against hospitals in India and worldwide. This drives improvement in cost and quality. Staff performance is also closely managed. At Aravind variations in clinical procedures are monitored, the number of complications are recorded on a daily basis and assessed each week. Each complication is graded according to severity and each surgeon is ranked according to their severity scale.134
126 Rangan, V. and R. Thulasiraj (2007), “Making sight affordable: Innovations Case Narrative: The Aravind Eye Care System”, innovations, MIT.
127 Tidd, J. et al (2005), “Aravind Eye Clinics”, Managing Innovation.128 Ravindran, R. and R. Thulasiraj (2006), “Aravind Eye Care System: Developing sustainable eye care”, Cataract and
Refractive Surgery Today, March.129 Fulton, D. et al (2011), “Health workforce skill mix and task shifting in low income countries: a recent review of evidence”,
Human Resources for Health, Vol 9. 130 Rangan, V. and R. Thulasiraj (2007), “Making sight affordable: Innovations Case Narrative: The Aravind Eye Care System”,
innovations, MIT.131 Ibid.132 Prahalad, C. (2003), “The Fortune at the Bottom of the Pyramid”, Indian Institute of Management, Ahmedabad. 133 Ramachandran, J. (2004), “Compassionate, High Quality Health Care at Low Cost: The Aravind Model”, IIMB
Management Review, Vol. 16.134 Prahalad, C. (2003), “The Fortune at the Bottom of the Pyramid”, Indian Institute of Management, Ahmedabad.
24
Reformers and wreckersOphthalmology at Aravind Eye Care
Community outreach and telecareAs well as providing high volume surgical services at the central hub in Madurai, Aravind has set up 39 primary care centers and runs over 2,500 eye camps each year to provide eye care service to the rural population.135 Each day Aravind might run 5-6 outreach camps allowing them to examine as many as 1,500 people, of which 300 are transported to the hospital for surgery. Each primary care centers is manned by 4 highly trained paramedics supported by doctors through telemedicine. This system provides 500-600 telemedicine consultations each day.136
Outcomes
Low cost and high qualityThe Aravind Eye Care System is now the largest, most productive eye care facility worldwide. At Aravind the average cost of a basic cataract surgery is around $30 compared to the Indian average of $75-100. There is a constant strive to improve performance and further drive the cost down. This volume is achieved with no loss in quality, with the infection rate per 10,000 Aravind patients was 4, compared to the 6 in the NHS.137
135 Gazzard, G. and R. Elek (2010), “Aravind Eye Care System”, presentation to board on 25 November, Moorfields Eye Hospital NHS Foundation Trust.
136 Ibid.137 Ibid.

25
Reformers and wreckersDenbigh High School
25
Denbigh High School
Challenges 138Denbigh High School is an outstanding school with approximately 1120 students between the ages of 11 and 16. The school’s motto is: “High achievement for all is our shared responsibility”.139 It became an academy in 2010 as a result of its outstanding school status. It has a decade long record of year on year achievement and has transformed from being a poorly performing school to its current position under the leadership of Dame Yasmin Bevan. The challenges faced when Dame Yasmin began her role as headteacher are set out below.
Poor Attainment and poor expectations In 1993, just 17 per cent of students achieved the equivalent of five or more GCSEs at grade A* - C. Nationally, the figure was 43.8 per cent.140
When Yasmin Bevan joined Denbigh High School as headteacher in 1991, the challenge was to establish why attainment was so low in a community where education was valued.141 In her own words: “In 1991 the school was on its knees. It wasn’t loved or valued by the community and was generally dismissed by everyone…Many parents wanted their children to succeed but lacked confidence in the school and were unable to articulate their aspirations. This made them passive and accepting of low standards”. 142
For 89 per cent of Denbigh High School’s students, English is an additional language, with Bengali and Urdu being the most commonly spoken of the 54 languages spoken at the school. 95 per cent of pupils are from minority ethnic backgrounds with 28.6 per cent eligible for free school meals143 (higher than the national average). Pupil mobility is high (14 per cent in 2004), with many refugee and asylum seeker pupils taken.
As Stuart Moore, a classroom teacher at the time Yasmin Bevan arrived as headteacher, has commented on the attitude among teachers in the early 1990s: “As the intake had changed they just lowered their expectations and decided that because the children had English as a second language, they couldn’t possibly expect them to do well at GCSEs.”144 As the 1995 Ofsted report also noted, there was some resistance among existing teachers when the senior leadership set about introducing a programme to improve standards in the school. The report states: “Planning such a programme is at an early stage and does not consistently receive the necessary underpinning support from all middle managers.”145
Standard of teaching In 1995 Ofsted recorded 64 per cent of the teaching at Denbigh High School as “satisfactory”.146 In the same year, Ofsted noted that “The quality of learning ranges from very good to poor with sixty-nine per cent of lessons sound or better at Key Stage 4 and thirty-one per cent with shortcomings, five per cent of which are serious.” 147 In 1999, Ofsted found that “There is too much unsatisfactory teaching” and that although the quality of teaching had improved since 1995, it was still a key issue.148 Denbigh High School also had very high staff turnover.149 From 1991 to 1999, three quarters of the staff had changed, with 20 per cent of classes being taught by either supply teachers or non-specialists, leading to poorer quality of teaching. In the 1999 Ofsted Inspection report it was noted that “Of the lessons where teaching was unsatisfactory about one third were taught by temporary or supply teachers and
138 The Teaching Awards (2006), “Inspiring Minds: Ten Case Studies of Teaching Award Head Teachers”. 139 Denbigh High School, Core value statement. 140 Office for National Statistics (2006), Education and Training Highlights.141 Times Educational Supplement (2004), “Believe they can fly”.142 The Teaching Awards (2006), “Inspiring Minds: Ten Case Studies of Teaching Award Head Teachers”. 143 Department for Education website http://www.education.gov.uk/inyourarea/schools/school_8214104.shtml 144 Times Educational Supplement (2004), “Believe they can fly”.145 Ofsted (1995), Inspection Report: Denbigh High School. 146 Ibid.147 Ibid.148 Ibid.149 Ofsted (1995), Inspection Report: Denbigh High School: “There have been a considerable number of staff changes in the
past few years. Since 1996, 37 teachers have left the school and 23 have been appointed.”
“In 1991 the school was on its knees. It wasn’t loved or valued by the community and was generally dismissed by everyone… Many parents wanted their children to succeed but lacked confidence in the school and were unable to articulate their aspirations. This made them passive and accepting of low standards”.138
26
Reformers and wreckersDenbigh High School
about one third by non-specialists.” Teachers with a passion for and deep knowledge of their subject are more likely to communicate that enthusiasm to pupils, as well as having a better understanding of the subject.150
Lack of leadership 151
When Yasmin Bevan arrived at the school as headteacher it had had acting heads for seven terms (more than two academic years). As Reform has previously written, “The leaderhip of any organisation sets the culture and formulates the working structures that reinforce that culture. Headteachers need to create a culture of high performance, accountability and ongoing improvement.”152 This is supported by evidence from the National Audit Office, which has noted that “the headteacher is key to sustaining performance and improvement in any school”.153
The 1995 Ofsted report commented that “The recently appointed headteacher…provides positive and pusposeful leadership. The headteacher has a strong commitment to the schools and, together with the governing body, has established a clear set of priorities of which raising pupil attainment is one of the key goals.”154
Method The school set about improving the quality of teaching, key to raising attainment in schools. As previous Reform research has noted, a substantial body of academic evidence shows that teacher quality is the single biggest influence on pupils’ educational progress.155 As found in McKinsey and Company’s study on the world’s best education systems, “The quality of an education system cannot exceed the quality of its teachers.”156 This is an approach the current Government supports and it has directed much of its efforts towards measures to improve the quality of teaching.157
CPD StrategyDenbigh High School has put into place a comprehensive and systematic CPD strategy in order to raise the quality of teaching at the school and embed a culture of constant self improvement.158 The school places a strong focus on lesson observations and feedback. In addition, the observation is ongoing and ad hoc. Observation is a crucial form of peer and self assessment. This is often neglected in schools where staff training and development are not valued so highly (for example see Open University research which has found that only 25 per cent of teachers report that they are regularly observed in classroom practice159).
The school has developed and runs in-house training programmes (also available to other schools), which place emphasis on lesson observation and on one to one coaching by outstanding teachers for teachers seeking to improve.
Rigorous Self-Assessment & ImprovementThe continuing professional development and performance management systems at the school are closely linked and feed into each other, and performance management and CPD are personalised teacher by teacher. Since 1997, staff performance at the school has been graded by senior management, with this information feeding into the CPD programmes for staff, when areas for improvement are identified. As Ofsted has noted: “The best results occur where CPD is central to the school’s improvement planning. Schools which integrate performance management, school self-review and development, and CPD into a coherent cycle of planning improve the quality of teaching and raise standards.”160
150 Bassett, D. et al (2010), Every teacher matters, Reform. 151 McKinsey & Company (2007), How the world’s best performing school systems come out on top. 152 Bassett, D. et al (2010), Every teacher matters, Reform. 153 National Audit Office (2006), Improving poorly performing schools in England. 154 Ofsted (1995), Inspection Report: Denbigh High School. 155 Bassett, D. et al (2010), Every teacher matters, Reform. 156 McKinsey & Company (2007), How the world’s best performing school systems come out on top. 157 Department for Education (2010), The importance of teaching: Schools White Paper. 158 Denbigh High School (2011), “Continuing Professional Development and Support”.159 Bassett, D. et al (2010), Every teacher matters, Reform. 160 House of Commons Children Schools and Families Committee (2010), Training of teachers.
“The quality of an education system cannot exceed the quality of its teachers.”151
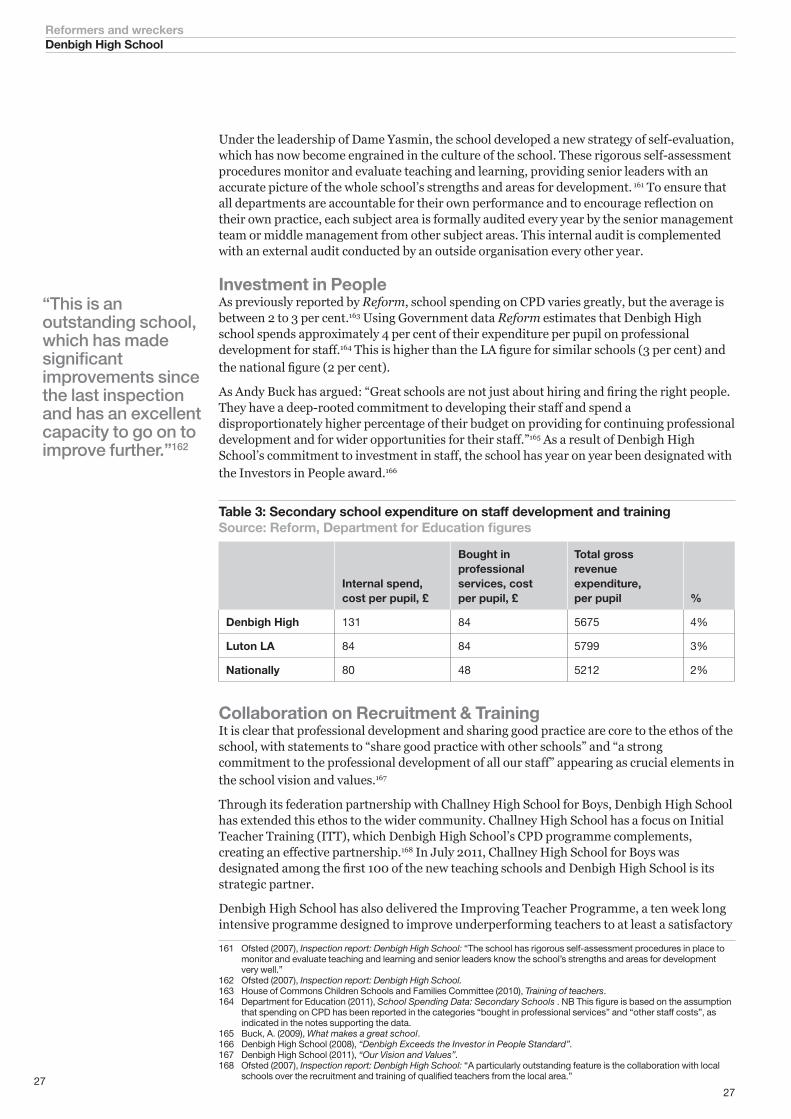
27
Reformers and wreckersDenbigh High School
27
Under the leadership of Dame Yasmin, the school developed a new strategy of self-evaluation, which has now become engrained in the culture of the school. These rigorous self-assessment procedures monitor and evaluate teaching and learning, providing senior leaders with an accurate picture of the whole school’s strengths and areas for development. 161 To ensure that all departments are accountable for their own performance and to encourage reflection on their own practice, each subject area is formally audited every year by the senior management team or middle management from other subject areas. This internal audit is complemented with an external audit conducted by an outside organisation every other year.
Investment in People 162
As previously reported by Reform, school spending on CPD varies greatly, but the average is between 2 to 3 per cent.163 Using Government data Reform estimates that Denbigh High school spends approximately 4 per cent of their expenditure per pupil on professional development for staff.164 This is higher than the LA figure for similar schools (3 per cent) and the national figure (2 per cent).
As Andy Buck has argued: “Great schools are not just about hiring and firing the right people. They have a deep-rooted commitment to developing their staff and spend a disproportionately higher percentage of their budget on providing for continuing professional development and for wider opportunities for their staff.”165 As a result of Denbigh High School’s commitment to investment in staff, the school has year on year been designated with the Investors in People award.166
Table 3: Secondary school expenditure on staff development and trainingSource: Reform, Department for Education figures
Internal spend, cost per pupil, £
Bought in professional services, cost per pupil, £
Total gross revenue expenditure, per pupil %
Denbigh High 131 84 5675 4%
Luton LA 84 84 5799 3%
Nationally 80 48 5212 2%
Collaboration on Recruitment & TrainingIt is clear that professional development and sharing good practice are core to the ethos of the school, with statements to “share good practice with other schools” and “a strong commitment to the professional development of all our staff” appearing as crucial elements in the school vision and values.167
Through its federation partnership with Challney High School for Boys, Denbigh High School has extended this ethos to the wider community. Challney High School has a focus on Initial Teacher Training (ITT), which Denbigh High School’s CPD programme complements, creating an effective partnership.168 In July 2011, Challney High School for Boys was designated among the first 100 of the new teaching schools and Denbigh High School is its strategic partner.
Denbigh High School has also delivered the Improving Teacher Programme, a ten week long intensive programme designed to improve underperforming teachers to at least a satisfactory
161 Ofsted (2007), Inspection report: Denbigh High School: “The school has rigorous self-assessment procedures in place to monitor and evaluate teaching and learning and senior leaders know the school’s strengths and areas for development very well.”
162 Ofsted (2007), Inspection report: Denbigh High School.163 House of Commons Children Schools and Families Committee (2010), Training of teachers. 164 Department for Education (2011), School Spending Data: Secondary Schools . NB This figure is based on the assumption
that spending on CPD has been reported in the categories “bought in professional services” and “other staff costs”, as indicated in the notes supporting the data.
165 Buck, A. (2009), What makes a great school.166 Denbigh High School (2008), “Denbigh Exceeds the Investor in People Standard”. 167 Denbigh High School (2011), “Our Vision and Values”.168 Ofsted (2007), Inspection report: Denbigh High School: “A particularly outstanding feature is the collaboration with local
schools over the recruitment and training of qualified teachers from the local area.”
“This is an outstanding school, which has made significant improvements since the last inspection and has an excellent capacity to go on to improve further.”162
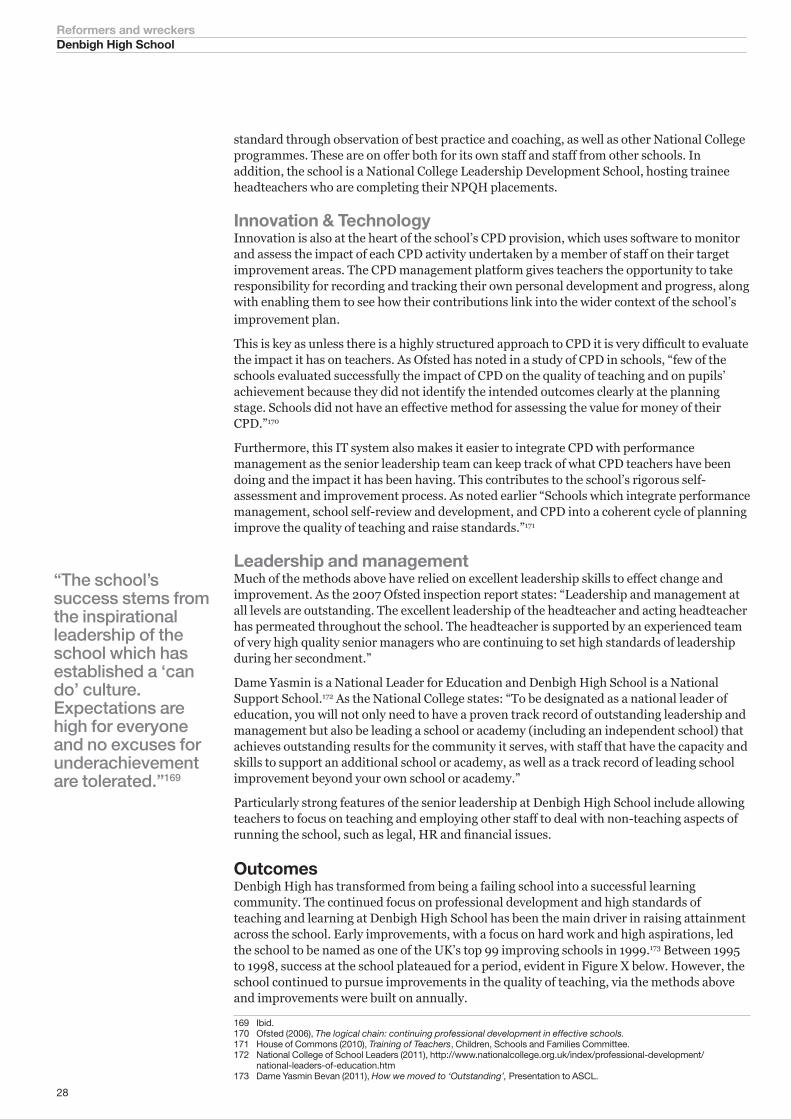
28
Reformers and wreckersDenbigh High School
standard through observation of best practice and coaching, as well as other National College programmes. These are on offer both for its own staff and staff from other schools. In addition, the school is a National College Leadership Development School, hosting trainee headteachers who are completing their NPQH placements.
Innovation & Technology 169Innovation is also at the heart of the school’s CPD provision, which uses software to monitor and assess the impact of each CPD activity undertaken by a member of staff on their target improvement areas. The CPD management platform gives teachers the opportunity to take responsibility for recording and tracking their own personal development and progress, along with enabling them to see how their contributions link into the wider context of the school’s improvement plan.
This is key as unless there is a highly structured approach to CPD it is very difficult to evaluate the impact it has on teachers. As Ofsted has noted in a study of CPD in schools, “few of the schools evaluated successfully the impact of CPD on the quality of teaching and on pupils’ achievement because they did not identify the intended outcomes clearly at the planning stage. Schools did not have an effective method for assessing the value for money of their CPD.”170
Furthermore, this IT system also makes it easier to integrate CPD with performance management as the senior leadership team can keep track of what CPD teachers have been doing and the impact it has been having. This contributes to the school’s rigorous self-assessment and improvement process. As noted earlier “Schools which integrate performance management, school self-review and development, and CPD into a coherent cycle of planning improve the quality of teaching and raise standards.”171
Leadership and management Much of the methods above have relied on excellent leadership skills to effect change and improvement. As the 2007 Ofsted inspection report states: “Leadership and management at all levels are outstanding. The excellent leadership of the headteacher and acting headteacher has permeated throughout the school. The headteacher is supported by an experienced team of very high quality senior managers who are continuing to set high standards of leadership during her secondment.”
Dame Yasmin is a National Leader for Education and Denbigh High School is a National Support School.172 As the National College states: “To be designated as a national leader of education, you will not only need to have a proven track record of outstanding leadership and management but also be leading a school or academy (including an independent school) that achieves outstanding results for the community it serves, with staff that have the capacity and skills to support an additional school or academy, as well as a track record of leading school improvement beyond your own school or academy.”
Particularly strong features of the senior leadership at Denbigh High School include allowing teachers to focus on teaching and employing other staff to deal with non-teaching aspects of running the school, such as legal, HR and financial issues.
OutcomesDenbigh High has transformed from being a failing school into a successful learning community. The continued focus on professional development and high standards of teaching and learning at Denbigh High School has been the main driver in raising attainment across the school. Early improvements, with a focus on hard work and high aspirations, led the school to be named as one of the UK’s top 99 improving schools in 1999.173 Between 1995 to 1998, success at the school plateaued for a period, evident in Figure X below. However, the school continued to pursue improvements in the quality of teaching, via the methods above and improvements were built on annually.
169 Ibid.170 Ofsted (2006), The logical chain: continuing professional development in effective schools.171 House of Commons (2010), Training of Teachers, Children, Schools and Families Committee. 172 National College of School Leaders (2011), http://www.nationalcollege.org.uk/index/professional-development/
national-leaders-of-education.htm 173 Dame Yasmin Bevan (2011), How we moved to ‘Outstanding’, Presentation to ASCL.
“The school’s success stems from the inspirational leadership of the school which has established a ‘can do’ culture. Expectations are high for everyone and no excuses for underachievement are tolerated.”169
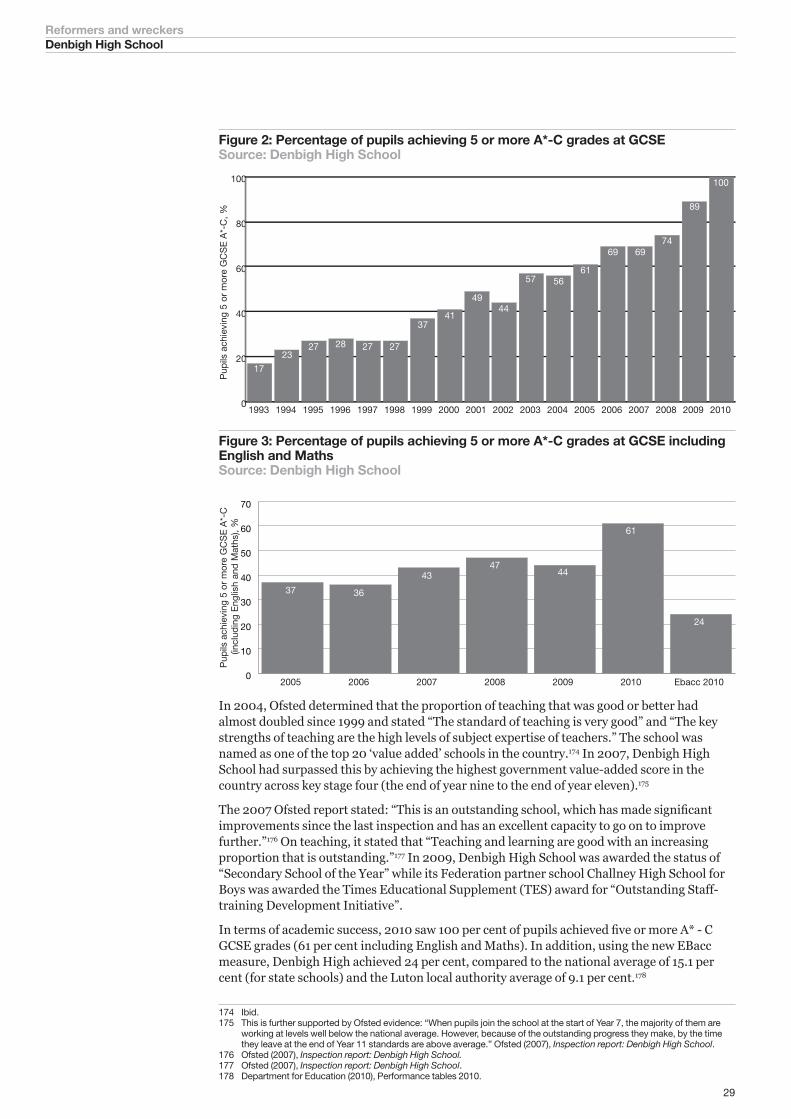
29
Reformers and wreckersDenbigh High School
Figure 2: Percentage of pupils achieving 5 or more A*-C grades at GCSE Source: Denbigh High School
0
20
40
60
80
100
17
2327 28 27 27
3741
4944
57 5661
69 6974
89
100
1993 1994 1995 1996 1997 1998 1999 2000 2001 2002 2003 2004 2005 2006 2007 2008 2009 2010
Pup
ils a
chie
ving
5 o
r m
ore
GC
SE
A*-
C, %
Figure 3: Percentage of pupils achieving 5 or more A*-C grades at GCSE including English and MathsSource: Denbigh High School
0
10
20
30
40
50
60
70
2005 2006 2007 2008 2009 2010 Ebacc 2010
Pup
ils a
chie
ving
5 o
r m
ore
GC
SE
A*-
C
(incl
udin
g E
nglis
h an
d M
aths
), %
37 36
4347
44
61
24
In 2004, Ofsted determined that the proportion of teaching that was good or better had almost doubled since 1999 and stated “The standard of teaching is very good” and “The key strengths of teaching are the high levels of subject expertise of teachers.” The school was named as one of the top 20 ‘value added’ schools in the country.174 In 2007, Denbigh High School had surpassed this by achieving the highest government value-added score in the country across key stage four (the end of year nine to the end of year eleven).175
The 2007 Ofsted report stated: “This is an outstanding school, which has made significant improvements since the last inspection and has an excellent capacity to go on to improve further.”176 On teaching, it stated that “Teaching and learning are good with an increasing proportion that is outstanding.”177 In 2009, Denbigh High School was awarded the status of “Secondary School of the Year” while its Federation partner school Challney High School for Boys was awarded the Times Educational Supplement (TES) award for “Outstanding Staff-training Development Initiative”.
In terms of academic success, 2010 saw 100 per cent of pupils achieved five or more A* - C GCSE grades (61 per cent including English and Maths). In addition, using the new EBacc measure, Denbigh High achieved 24 per cent, compared to the national average of 15.1 per cent (for state schools) and the Luton local authority average of 9.1 per cent.178
174 Ibid.175 This is further supported by Ofsted evidence: “When pupils join the school at the start of Year 7, the majority of them are
working at levels well below the national average. However, because of the outstanding progress they make, by the time they leave at the end of Year 11 standards are above average.” Ofsted (2007), Inspection report: Denbigh High School.
176 Ofsted (2007), Inspection report: Denbigh High School. 177 Ofsted (2007), Inspection report: Denbigh High School. 178 Department for Education (2010), Performance tables 2010.
30
Reformers and wreckersBirmingham City Council
Birmingham City Council
Challenges 179Local authorities spend an average 50 per cent of their budgets on the workforce annually, making it the single largest area of expenditure for councils.180 Despite this, the Audit Commission and others have repeatedly warned that in most councils, workforce recruitment, development and retention are not managed strategically and that workforce issues are treated as operational and entirely separate from the needs of the council.181 This is reinforced by the fact that both the 2007 and 2010 Local Government Workforce Strategies proposed the strategic integration of workforce planning and the implementation of performance reward structures as key reforms to modernise the local government workforce.182
In previous years, Birmingham City Council, the largest unitary council in Europe, has suffered from a disjointed and inefficient human resources strategy for its c. 55,000 staff.183 In 2004, the Audit Commission rated the HR function of the council as “fair”, on the scale of poor, fair, good to excellent, noting “inconsistent application of policies across the council” and recording that “staff appraisals have been inconsistently undertaken across the council”.184 In 2006, Birmingham City Council launched an unprecedented 10-year strategy to transform its business processes to improve value for money and deliver better outcomes for users.185
As a result of both changes to the grant funding regime and the local government settlement in the October Spending Review, Birmingham City Council will have to meet budgetary reductions of more than £330 million between 2011-12 and 2013-14, including £212 million needed in 2011-12.186
Method
Improving workforce information In 2009, Birmingham City Council launched the Excellence in People Management (EPM) programme to enable a cultural shift towards intelligent workforce management.187 188
At the heart of the EPM programme was the development of a new people management toolkit and SAP Human Resources system in order to improve the quality and availability of information available to both managers and employees.189 This system includes a single workforce database to provide up-to-date and consistent information, and an online ‘People Solutions’ facility to provide managers and employees with information such as employment policies, guidance on workforce issues and management information from their desktop consoles.
Effective people managementThe move towards a more informed management approach to the workforce was complimented by ‘Bridging the gap’, a workforce planning framework designed to model future needs and eliminate waste.190 In practice this has been implemented by managing vacancies more effectively, not creating new posts unless essential to the business, and re-designing services and processes to make them more efficient.191
179 Audit Commission (2010), Annual Audit Letter: Birmingham City Council 2009/10.180 Audit Commission (2008), Tomorrow’s people: Building a local government workforce for the future, p. 19. 181 Audit Commission (2008), Tomorrow’s people: Building a local government workforce for the future, p. 59.182 Local Government Association Group (2007), Local Government Workforce Strategy; Local Government Association
Group (2010), Delivering through people: Local Government Workforce Strategy 2010.183 Rudge, A. (2011), in Reform (2011), Localism and the public services revolution. 184 Audit Commission (2004), Inspection report: Human resources, Birmingham City Council, p. 4. 185 http://www.birmingham.gov.uk/btsp186 Audit Commission (2010), Annual Audit Letter: Birmingham City Council 2009/10.187 Audit Commission (2010), Annual Audit Letter: Birmingham City Council 2009/10.188 Birmingham City Council (2009), Report of Cabinet Member for Equalities and Human Resources to the City Council,
June: The EPM programme set out to “maximise the value the organisation achieves from the workforce”.189 Birmingham City Council (2009), Report of Cabinet Member for Equalities and Human Resources to the City Council.190 Rudge, A., in Reform (2011), Localism and the public services revolution.191 Rudge, A., in Reform (2011), Localism and the public services revolution.
“EPM’s overall purpose is to improve performance and achieve the optimum workforce for the Council. The Council’s investment has provided managers with the tools to deliver this and drive better service productivity.”179
31
Reformers and wreckersBirmingham City Council
In addition, Birmingham City Council developed the employee engagement programme, BEST (Belief, Excellence, Success and Trust), in order to involve staff in improvement and support a cultural shift towards a high-productivity workforce.192 The scheme empowers front line leaders to organise workshops and offers funding for ideas to improve front line delivery.
In March 2011, the council agreed the Birmingham Contract, a framework for council employees’ terms and conditions aimed at eliminating inconsistent overtime and bonus practices between areas and thus introducing more flexibility to the workforce.193
Embedding performance into practiceIn March 2008, following extensive discussion with trade unions and the workforce and despite some industrial action, Birmingham City Council agreed a new pay and grading package.194 The agreement set the basis for an improvement programme in order to find new, more flexible approaches to the workforce.
A key component of the EPM programme was the introduction of an organisation wide performance appraisal programme. This includes an appraisal framework for all employees, through regular Performance and Development Reviews (PDRs), the results of which feed into both pay progression and management decision-making.195
Outcomes
More efficient managementThe workforce reforms undertaken by Birmingham City Council have resulted in far more efficient and effective management of council staff. In particular, the development of the ‘People Solutions’ portal for managers has enabled staff to complete day-to-day tasks online based on real-time people management information. It is estimated that 95 per cent of staff now access people management facilities at their desktop computers, equating to 1.4 million transactions received and processed in the year to April 2011.196
In its latest Annual Audit Letter on Birmingham City Council, the Audit Commission noted: “EPM’s overall purpose is to improve performance and achieve the optimum workforce for the Council. The Council’s investment has provided managers with the tools to deliver this and drive better service productivity.”197
An engaged, productive workforceThe BEST programme has been especially successful at engaging staff in their work and giving clear guidance over specific roles within the organization. More than 30,000 staff members have attended BEST workshops to motivate and engage staff in the service redesign, and staff surveys suggest that staff motivation has increased by 30 per cent as a result.198 There is evidence to indicate that the re-engagement of staff that has been seen has saved £17m through improved productivity.199
Reduced costThe use of intelligent workforce planning, through ‘Bridging the Gap’, has resulted in efficiency savings of £4.4 million in the first year.200 This cost saving stems primarily from the successful reduction of the council workforce headcount, leading to a £56 million reduction in spend between April 2010 and March 2011.201 Overall, the number of staff employed by the council has decreased by 4,500 people from April 2009 to March 2011, with no major
192 Birmingham City Council (2009), Report of Cabinet Member for Equalities and Human Resources to the City Council.193 Werran, J. (2011), ‘Birmingham rages over wage cuts, but shelves offshoring plans’, www.localgov.co.uk, 25 July.194 Birmingham City Council (2008), Report of Cabinet Member for Equalities and Human Resources to the City Council.195 Birmingham City Council (2010), The Annual Report of Cabinet Member for Equalities and Human Resources to the City
Council.196 Rudge, A., Presentation to conference, Reform (2011), Localism and the public services revolution.197 Audit Commission (2010), Annual Audit Letter: Birmingham City Council 2009/10.198 Local Government Improvement and Development (2010), Good practice library: The BEST programme: Improving
employee engagement in Birmingham City Council, http://www.idea.gov.uk/idk/core/page.do?pageId=9308021, accessed 25 July 2011.
199 Local Government Association (2009), Local Government Workforce Strategy: Update, Spring/Summer, p. 4. 200 Birmingham City Council (2010), The Annual Report of the Cabinet Member for Equalities and Human Resources to the
City Council, 15 June.201 Rudge, A., Presentation to conference, Reform (2011), Localism and the public services revolution.
“People are the heart of this organisation…we would build a council which is peopled using the talents, creativity, energy and commitment in serving and improving the public services.”
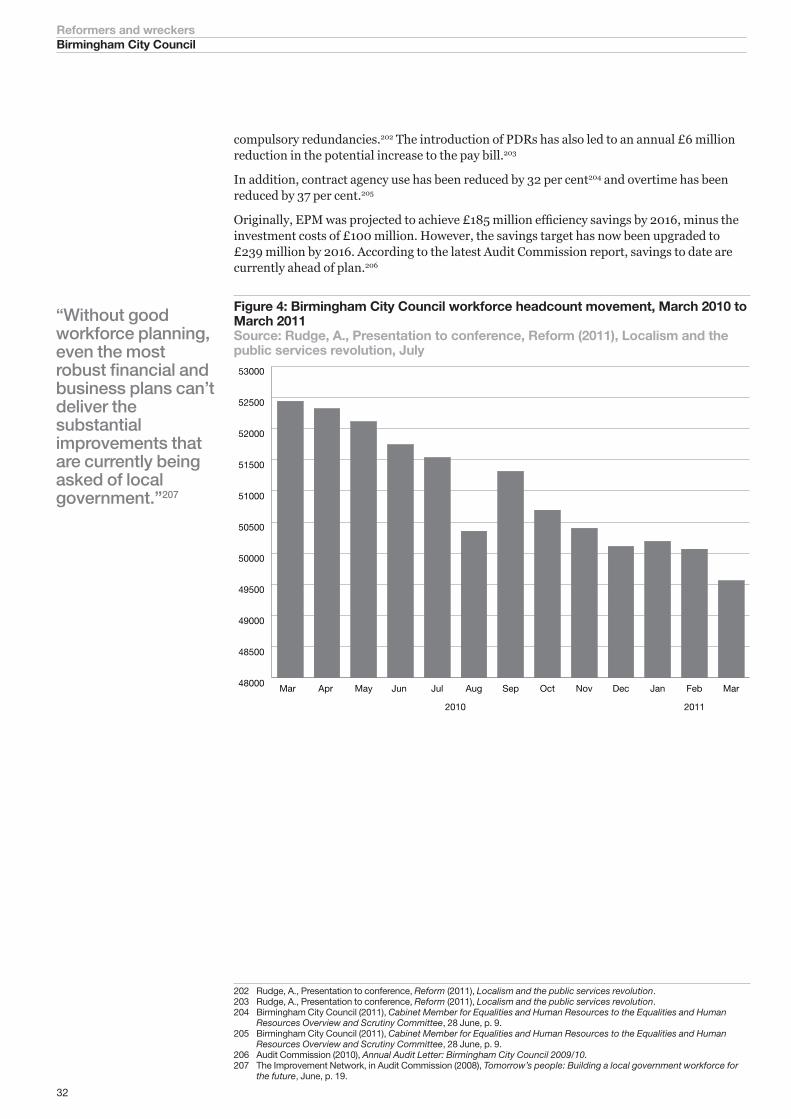
32
Reformers and wreckersBirmingham City Council
compulsory redundancies.202 The introduction of PDRs has also led to an annual £6 million reduction in the potential increase to the pay bill.203
In addition, contract agency use has been reduced by 32 per cent204 and overtime has been reduced by 37 per cent.205
Originally, EPM was projected to achieve £185 million efficiency savings by 2016, minus the investment costs of £100 million. However, the savings target has now been upgraded to £239 million by 2016. According to the latest Audit Commission report, savings to date are currently ahead of plan.206
Figure 4: Birmingham City Council workforce headcount movement, March 2010 to March 2011Source: Rudge, A., Presentation to conference, Reform (2011), Localism and the public services revolution, July
48000
48500
49000
49500
50000
50500
51000
51500
52000
52500
53000
MarFebJanDecNovOctSepAugJulJun MayApr Mar
2010 2011
207
202 Rudge, A., Presentation to conference, Reform (2011), Localism and the public services revolution.203 Rudge, A., Presentation to conference, Reform (2011), Localism and the public services revolution.204 Birmingham City Council (2011), Cabinet Member for Equalities and Human Resources to the Equalities and Human
Resources Overview and Scrutiny Committee, 28 June, p. 9.205 Birmingham City Council (2011), Cabinet Member for Equalities and Human Resources to the Equalities and Human
Resources Overview and Scrutiny Committee, 28 June, p. 9. 206 Audit Commission (2010), Annual Audit Letter: Birmingham City Council 2009/10.207 The Improvement Network, in Audit Commission (2008), Tomorrow’s people: Building a local government workforce for
the future, June, p. 19.
“Without good workforce planning, even the most robust financial and business plans can’t deliver the substantial improvements that are currently being asked of local government.”207
33
Reformers and wreckersMerseyside Fire and Rescue
Merseyside Fire and Rescue
Challenge 208 Merseyside Fire and Rescue Service (FRS) has traditionally been characterised by high levels of fire officers and spending. In 2000, Merseyside FRS was the most expensive metropolitan fire authority in the country in per capita terms, in large part because the service employed more fire fighters per head of population than anywhere else in the western world.209 However, despite this significant expenditure, outcomes were poor. In 2003, the number of primary fires per 10,000 of the population was 58.9, significantly higher than the national average of 34.5, 210 while the rate of hoax calls, 1.6 per 1,000 of the population, was more than double the national average of 0.8.211 The service did not meet performance targets and the number of fire deaths per capita exceeded anywhere else in the western world.212
In addition, the service had a poor reputation with regards to the workforce. In 1994-95, the service had the worst sickness rate of any fire and rescue service, comprising 19 shifts lost per full-time firefighter a year, and firefighters were underemployed for large amounts of time due to inflexible shift patterns.213 The service also had problems with significant industrial relations issues around reforms to the workforce.214
The overwhelming challenge that Merseyside faced was the need to radically improve outcomes whilst simultaneously addressing inefficiencies to reduce the unsustainable level of expenditure.
Method
From reaction to preventionIn 1999, Merseyside FRS transformed its strategy and focus from reaction to prevention, becoming the first fire service in the country to take organised action to prevent domestic fires.215 Chief Fire Officer Tony McGuirk reorganised the workforce away from reactive fire-fighting, towards proactive efforts such as conducting fire safety checks and installing smoke alarms. Speaking at a Reform conference last year, Tony McGuirk spoke of the new attitude that was instilled at the time: “From tomorrow we will change. We will visit every single home and knock on the door and walk in, we will fit smoke alarms and we will prevent fire, from tomorrow.”216
Between 1999 and 2010, Merseyside fire officers, working in conjunction with the police, completed 862,300 Home Fire Safety Checks217, ensuring that almost two thirds of homes in Merseyside had had a Home Fire Safety Check and a smoke alarm installed.218
208 McGuirk, T., Chief Fire Officer, Merseyside Fire and Rescue Service, in Audit Commission (2007), Seeing the light: innovation in local public services, p. 2.
209 Merseyside Fire and Rescue Service (2011), Merseyside Fire and Rescue Authority Budget and Financial Plan, 2011/12, p. 17; This high spending level remained throughout the early 2000s, with per capita spending of £44.07 in 2003-04, significantly higher than the national average of £36.83.
210 Audit Commission (2005), Fire and Rescue Comprehensive Performance Assessment: Merseyside Fire and Rescue Authority, p. 15.
211 Ibid. 212 Ibid.213 Audit Commission (2007), Seeing the light: innovation in local public services, p. 2.214 Merseyside Fire and Rescue Service (2011), Merseyside Fire and Rescue Authority Budget and Financial Plan, 2011/12215 Audit Commission (2007), Seeing the light: innovation in local public services: Merseyside Fire and Rescue Authority:
Embedding Community Fire Safety, p. 1.216 McGuirk, T., Chief Fire Officer, Merseyside Fire Service, in Reform (2010), The first hundred days, p. 134.217 Merseyside Fire and Rescue Service (2010), Annual Report 2010, p. 4.218 Audit Commission (2009), Merseyside Fire and Rescue Authority: Organisational Assessment.
“By staying with conventional approaches it is entirely predictable that there would be the conventional results of unnecessary fire deaths and injuries. We decided to be innovative.”208
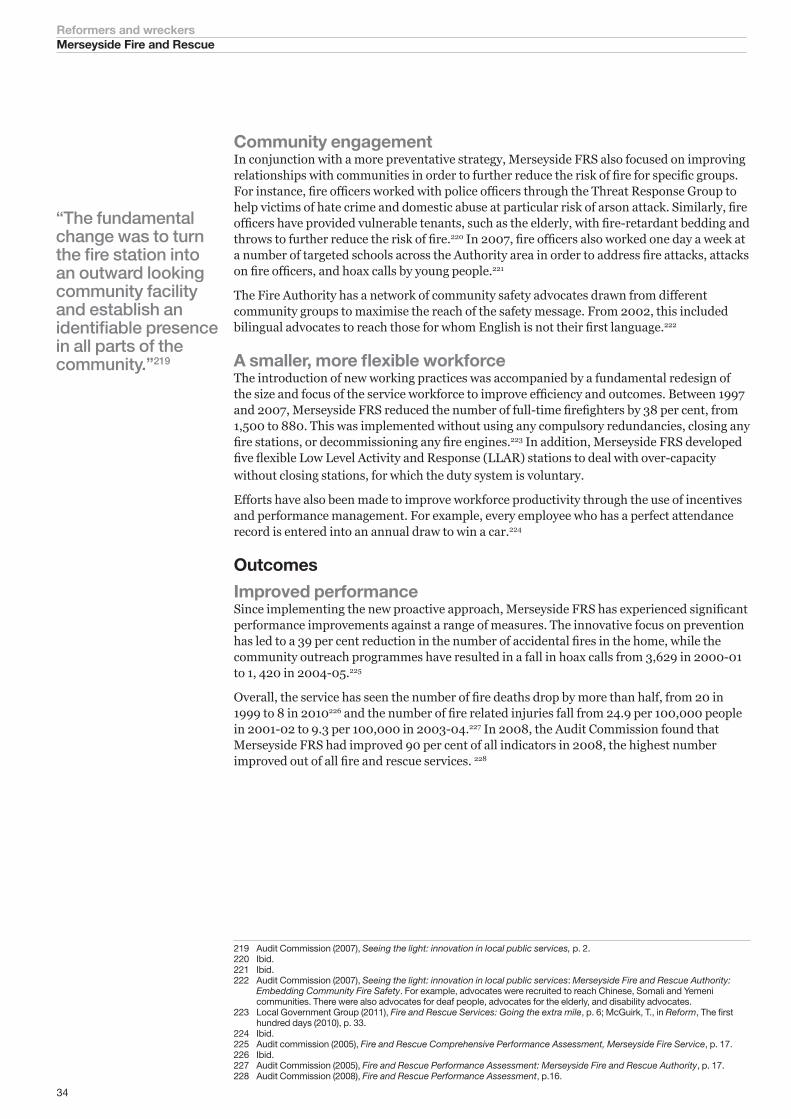
34
Reformers and wreckersMerseyside Fire and Rescue
Community engagement 219In conjunction with a more preventative strategy, Merseyside FRS also focused on improving relationships with communities in order to further reduce the risk of fire for specific groups. For instance, fire officers worked with police officers through the Threat Response Group to help victims of hate crime and domestic abuse at particular risk of arson attack. Similarly, fire officers have provided vulnerable tenants, such as the elderly, with fire-retardant bedding and throws to further reduce the risk of fire.220 In 2007, fire officers also worked one day a week at a number of targeted schools across the Authority area in order to address fire attacks, attacks on fire officers, and hoax calls by young people.221
The Fire Authority has a network of community safety advocates drawn from different community groups to maximise the reach of the safety message. From 2002, this included bilingual advocates to reach those for whom English is not their first language.222
A smaller, more flexible workforceThe introduction of new working practices was accompanied by a fundamental redesign of the size and focus of the service workforce to improve efficiency and outcomes. Between 1997 and 2007, Merseyside FRS reduced the number of full-time firefighters by 38 per cent, from 1,500 to 880. This was implemented without using any compulsory redundancies, closing any fire stations, or decommissioning any fire engines.223 In addition, Merseyside FRS developed five flexible Low Level Activity and Response (LLAR) stations to deal with over-capacity without closing stations, for which the duty system is voluntary.
Efforts have also been made to improve workforce productivity through the use of incentives and performance management. For example, every employee who has a perfect attendance record is entered into an annual draw to win a car.224
Outcomes
Improved performanceSince implementing the new proactive approach, Merseyside FRS has experienced significant performance improvements against a range of measures. The innovative focus on prevention has led to a 39 per cent reduction in the number of accidental fires in the home, while the community outreach programmes have resulted in a fall in hoax calls from 3,629 in 2000-01 to 1, 420 in 2004-05.225
Overall, the service has seen the number of fire deaths drop by more than half, from 20 in 1999 to 8 in 2010226 and the number of fire related injuries fall from 24.9 per 100,000 people in 2001-02 to 9.3 per 100,000 in 2003-04.227 In 2008, the Audit Commission found that Merseyside FRS had improved 90 per cent of all indicators in 2008, the highest number improved out of all fire and rescue services. 228
219 Audit Commission (2007), Seeing the light: innovation in local public services, p. 2.220 Ibid. 221 Ibid. 222 Audit Commission (2007), Seeing the light: innovation in local public services: Merseyside Fire and Rescue Authority:
Embedding Community Fire Safety. For example, advocates were recruited to reach Chinese, Somali and Yemeni communities. There were also advocates for deaf people, advocates for the elderly, and disability advocates.
223 Local Government Group (2011), Fire and Rescue Services: Going the extra mile, p. 6; McGuirk, T., in Reform, The first hundred days (2010), p. 33.
224 Ibid.225 Audit commission (2005), Fire and Rescue Comprehensive Performance Assessment, Merseyside Fire Service, p. 17.226 Ibid.227 Audit Commission (2005), Fire and Rescue Performance Assessment: Merseyside Fire and Rescue Authority, p. 17.228 Audit Commission (2008), Fire and Rescue Performance Assessment, p.16.
“The fundamental change was to turn the fire station into an outward looking community facility and establish an identifiable presence in all parts of the community.”219
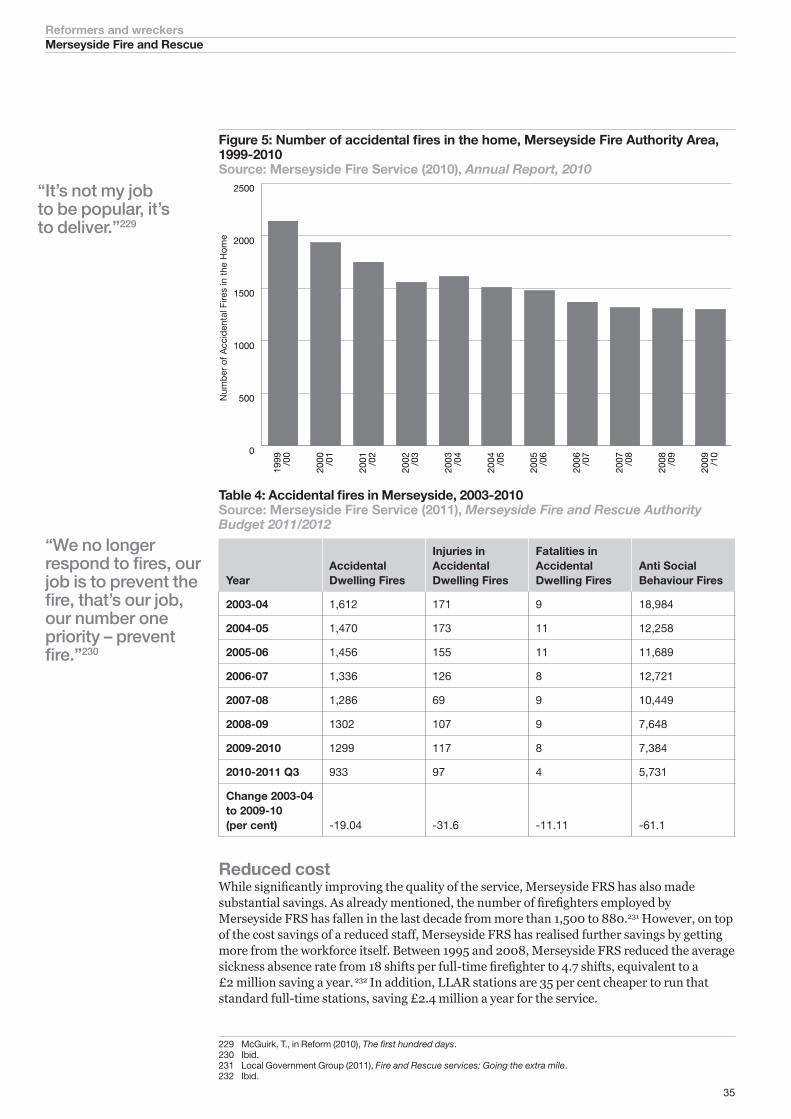
35
Reformers and wreckersMerseyside Fire and Rescue
Figure 5: Number of accidental fires in the home, Merseyside Fire Authority Area, 1999-2010Source: Merseyside Fire Service (2010), Annual Report, 2010
0
500
1000
1500
2000
2500
1999 /00
2000 /01
2001 /02
2002 /03
2003 /04
2004 /05
2005 /06
2006 /07
2007 /08
2008 /09
2009 /10
Num
ber
of A
ccid
enta
l Fire
s in
the
Hom
e
Table 4: Accidental fires in Merseyside, 2003-2010 229Source: Merseyside Fire Service (2011), Merseyside Fire and Rescue Authority Budget 2011/2012
YearAccidental Dwelling Fires
Injuries in Accidental Dwelling Fires
Fatalities in Accidental Dwelling Fires
Anti Social Behaviour Fires
2003-04 1,612 171 9 18,984
2004-05 1,470 173 11 12,258
2005-06 1,456 155 11 11,689
2006-07 1,336 126 8 12,721
2007-08 1,286 69 9 10,449
2008-09 1302 107 9 7,648
2009-2010 1299 117 8 7,384
2010-2011 Q3 933 97 4 5,731
Change 2003-04 to 2009-10 (per cent) -19.04 -31.6 -11.11 -61.1
Reduced cost 230While significantly improving the quality of the service, Merseyside FRS has also made substantial savings. As already mentioned, the number of firefighters employed by Merseyside FRS has fallen in the last decade from more than 1,500 to 880.231 However, on top of the cost savings of a reduced staff, Merseyside FRS has realised further savings by getting more from the workforce itself. Between 1995 and 2008, Merseyside FRS reduced the average sickness absence rate from 18 shifts per full-time firefighter to 4.7 shifts, equivalent to a £2 million saving a year. 232 In addition, LLAR stations are 35 per cent cheaper to run that standard full-time stations, saving £2.4 million a year for the service.
229 McGuirk, T., in Reform (2010), The first hundred days. 230 Ibid. 231 Local Government Group (2011), Fire and Rescue services: Going the extra mile.232 Ibid.
“We no longer respond to fires, our job is to prevent the fire, that’s our job, our number one priority – prevent fire.”230
“It’s not my job to be popular, it’s to deliver.”229

36
Reformers and wreckersMerseyside Fire and Rescue
Overall, Merseyside FRS have saved £111 million since they began their programme of reform.233 In 2008, the Audit Commission noted that Merseyside FSR was one of only three services to have achieved the level of “performing strongly”, the highest rating, in the management of resources three years in a row, rating Merseyside the most efficient fire service in the country.234
Merseyside FRS has now fallen from the most expensive metropolitan fire authority per head of population to the third most expensive,235 spending the lowest amount per activity out of all the metropolitan fire authorities in the UK.236
233 Ibid.234 Audit Commission (2008), Fire and Rescue Performance Assessment. 235 Merseyside Fire and Rescue Service (2011), Merseyside Fire and Rescue Authority Budget and Financial Plan, 2011/12.236 Ibid.
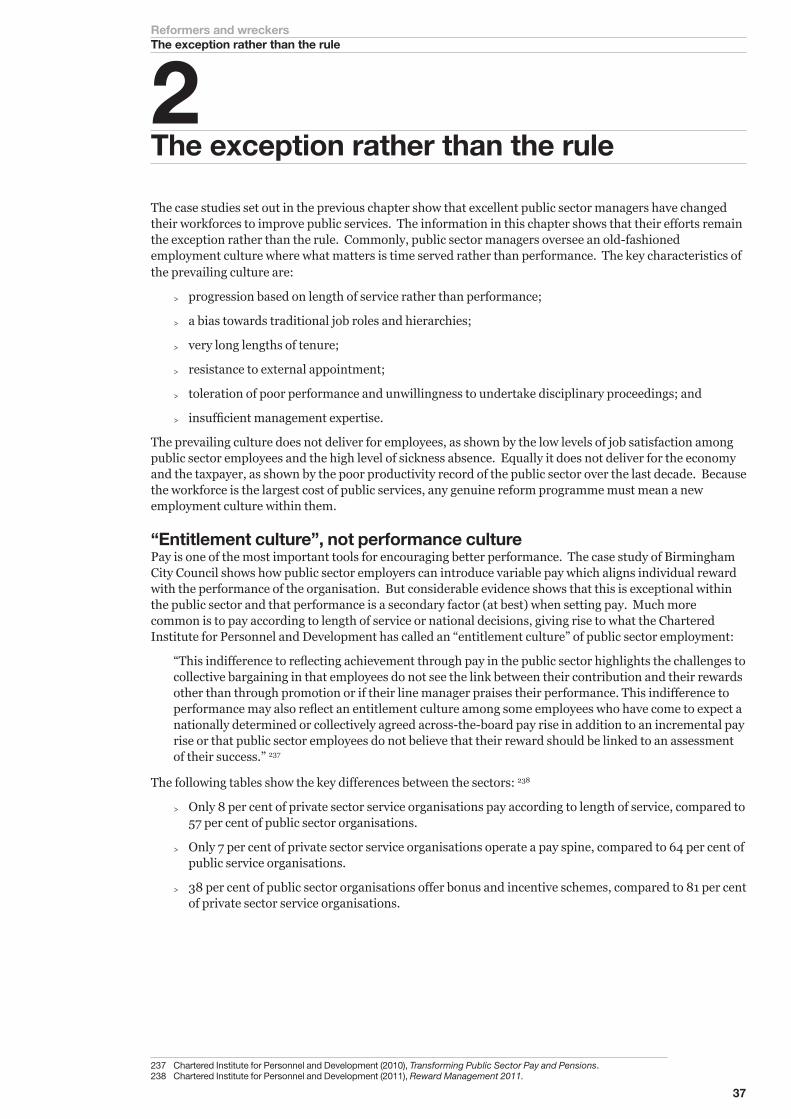
37
Reformers and wreckersThe exception rather than the rule
2 The exception rather than the rule
The case studies set out in the previous chapter show that excellent public sector managers have changed their workforces to improve public services. The information in this chapter shows that their efforts remain the exception rather than the rule. Commonly, public sector managers oversee an old-fashioned employment culture where what matters is time served rather than performance. The key characteristics of the prevailing culture are:
> progression based on length of service rather than performance;
> a bias towards traditional job roles and hierarchies;
> very long lengths of tenure;
> resistance to external appointment;
> toleration of poor performance and unwillingness to undertake disciplinary proceedings; and
> insufficient management expertise.
The prevailing culture does not deliver for employees, as shown by the low levels of job satisfaction among public sector employees and the high level of sickness absence. Equally it does not deliver for the economy and the taxpayer, as shown by the poor productivity record of the public sector over the last decade. Because the workforce is the largest cost of public services, any genuine reform programme must mean a new employment culture within them.
“Entitlement culture”, not performance culturePay is one of the most important tools for encouraging better performance. The case study of Birmingham City Council shows how public sector employers can introduce variable pay which aligns individual reward with the performance of the organisation. But considerable evidence shows that this is exceptional within the public sector and that performance is a secondary factor (at best) when setting pay. Much more common is to pay according to length of service or national decisions, giving rise to what the Chartered Institute for Personnel and Development has called an “entitlement culture” of public sector employment:
“This indifference to reflecting achievement through pay in the public sector highlights the challenges to collective bargaining in that employees do not see the link between their contribution and their rewards other than through promotion or if their line manager praises their performance. This indifference to performance may also reflect an entitlement culture among some employees who have come to expect a nationally determined or collectively agreed across-the-board pay rise in addition to an incremental pay rise or that public sector employees do not believe that their reward should be linked to an assessment of their success.” 237
The following tables show the key differences between the sectors: 238
> Only 8 per cent of private sector service organisations pay according to length of service, compared to 57 per cent of public sector organisations.
> Only 7 per cent of private sector service organisations operate a pay spine, compared to 64 per cent of public service organisations.
> 38 per cent of public sector organisations offer bonus and incentive schemes, compared to 81 per cent of private sector service organisations.
237 Chartered Institute for Personnel and Development (2010), Transforming Public Sector Pay and Pensions. 238 Chartered Institute for Personnel and Development (2011), Reward Management 2011.
38
Reformers and wreckersThe exception rather than the rule
Table 5: Basis for base pay progression between sectors (percentage of respondents), 2011Source: Chartered Institute for Personnel and Development (2011), Reward Management 2011
Private sector servicesVoluntary, community and not-for-profit Public services
Individual performance 74.3 36.8 30.7
Market rates 66.2 50.0 15.4
Competencies 46.1 24.6 27.6
Skills 39.1 32.5 16.2
Employee potential / value / retention 41.2 19.3 11.4
Length of service 8.3 22.8 57.0
Table 6: Base pay structures (percentage of respondents), 2011Source: Chartered Institute for Personnel and Development (2011), Reward Management 2011
Private sector servicesVoluntary, community and not-for-profit Public services
Individual pay rates 37.5 36.8 30.7
Broad-banded pay structures 26.1 15.1 20.3
Pay spines 6.5 37.3 64.1
Career grade structures 25.7 11.1 4.6
Narrow-graded pay structures 11.9 11.9 11.0
Table 7: Organisations offering bonus and incentive schemes, by sector (percentage of respondents), 2011Source: Chartered Institute for Personnel and Development (2011), Reward Management 2011
Private sector servicesVoluntary, community and not-for-profit Public services
Organisations 81.2 27.3 38.3
Not only the CIPD but also academic authors have found that performance related pay and reward systems can stimulate employee performance and increase labour productivity.239 240 They also help to retain and recruit effective staff.241
239 For example, Khan, C. M. et al (2001), “Performance-based Wages in Tax Collection: The Brazilian Tax Collection Reform and its Effects” The Economic Journal Vol. 111 No.468, 188–205; See also OECD (2002), “Strengthening the pay-performance link in Government – A case study for Korea”.
240 Gielen, A. et al (2006), Performance related pay and labor productivity, Discussion Paper No. 2211, Forschungsinstitut zur Zukunft der Arbeit Institute for the Study of Labor.
241 For a summary of existing literature, see: Prentice, G. et al (2007), Performance pay in the public sector: A review of the issues evidence, Office of Manpower Economics.
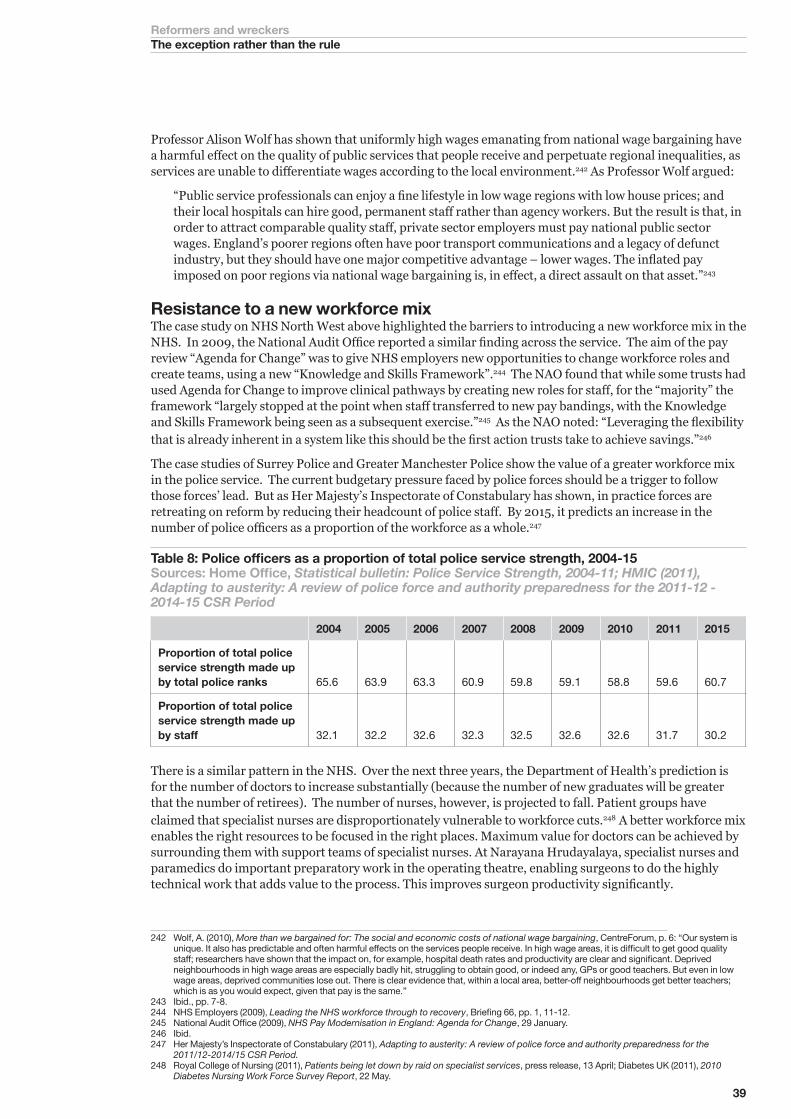
39
Reformers and wreckersThe exception rather than the rule
Professor Alison Wolf has shown that uniformly high wages emanating from national wage bargaining have a harmful effect on the quality of public services that people receive and perpetuate regional inequalities, as services are unable to differentiate wages according to the local environment.242 As Professor Wolf argued:
“Public service professionals can enjoy a fine lifestyle in low wage regions with low house prices; and their local hospitals can hire good, permanent staff rather than agency workers. But the result is that, in order to attract comparable quality staff, private sector employers must pay national public sector wages. England’s poorer regions often have poor transport communications and a legacy of defunct industry, but they should have one major competitive advantage – lower wages. The inflated pay imposed on poor regions via national wage bargaining is, in effect, a direct assault on that asset.”243
Resistance to a new workforce mixThe case study on NHS North West above highlighted the barriers to introducing a new workforce mix in the NHS. In 2009, the National Audit Office reported a similar finding across the service. The aim of the pay review “Agenda for Change” was to give NHS employers new opportunities to change workforce roles and create teams, using a new “Knowledge and Skills Framework”.244 The NAO found that while some trusts had used Agenda for Change to improve clinical pathways by creating new roles for staff, for the “majority” the framework “largely stopped at the point when staff transferred to new pay bandings, with the Knowledge and Skills Framework being seen as a subsequent exercise.”245 As the NAO noted: “Leveraging the flexibility that is already inherent in a system like this should be the first action trusts take to achieve savings.”246
The case studies of Surrey Police and Greater Manchester Police show the value of a greater workforce mix in the police service. The current budgetary pressure faced by police forces should be a trigger to follow those forces’ lead. But as Her Majesty’s Inspectorate of Constabulary has shown, in practice forces are retreating on reform by reducing their headcount of police staff. By 2015, it predicts an increase in the number of police officers as a proportion of the workforce as a whole.247
Table 8: Police officers as a proportion of total police service strength, 2004-15Sources: Home Office, Statistical bulletin: Police Service Strength, 2004-11; HMIC (2011), Adapting to austerity: A review of police force and authority preparedness for the 2011-12 - 2014-15 CSR Period
2004 2005 2006 2007 2008 2009 2010 2011 2015
Proportion of total police service strength made up by total police ranks 65.6 63.9 63.3 60.9 59.8 59.1 58.8 59.6 60.7
Proportion of total police service strength made up by staff 32.1 32.2 32.6 32.3 32.5 32.6 32.6 31.7 30.2
There is a similar pattern in the NHS. Over the next three years, the Department of Health’s prediction is for the number of doctors to increase substantially (because the number of new graduates will be greater that the number of retirees). The number of nurses, however, is projected to fall. Patient groups have claimed that specialist nurses are disproportionately vulnerable to workforce cuts.248 A better workforce mix enables the right resources to be focused in the right places. Maximum value for doctors can be achieved by surrounding them with support teams of specialist nurses. At Narayana Hrudayalaya, specialist nurses and paramedics do important preparatory work in the operating theatre, enabling surgeons to do the highly technical work that adds value to the process. This improves surgeon productivity significantly.
242 Wolf, A. (2010), More than we bargained for: The social and economic costs of national wage bargaining, CentreForum, p. 6: “Our system is unique. It also has predictable and often harmful effects on the services people receive. In high wage areas, it is difficult to get good quality staff; researchers have shown that the impact on, for example, hospital death rates and productivity are clear and significant. Deprived neighbourhoods in high wage areas are especially badly hit, struggling to obtain good, or indeed any, GPs or good teachers. But even in low wage areas, deprived communities lose out. There is clear evidence that, within a local area, better-off neighbourhoods get better teachers; which is as you would expect, given that pay is the same.”
243 Ibid., pp. 7-8. 244 NHS Employers (2009), Leading the NHS workforce through to recovery, Briefing 66, pp. 1, 11-12.245 National Audit Office (2009), NHS Pay Modernisation in England: Agenda for Change, 29 January.246 Ibid.247 Her Majesty’s Inspectorate of Constabulary (2011), Adapting to austerity: A review of police force and authority preparedness for the
2011/12-2014/15 CSR Period.248 Royal College of Nursing (2011), Patients being let down by raid on specialist services, press release, 13 April; Diabetes UK (2011), 2010
Diabetes Nursing Work Force Survey Report, 22 May.
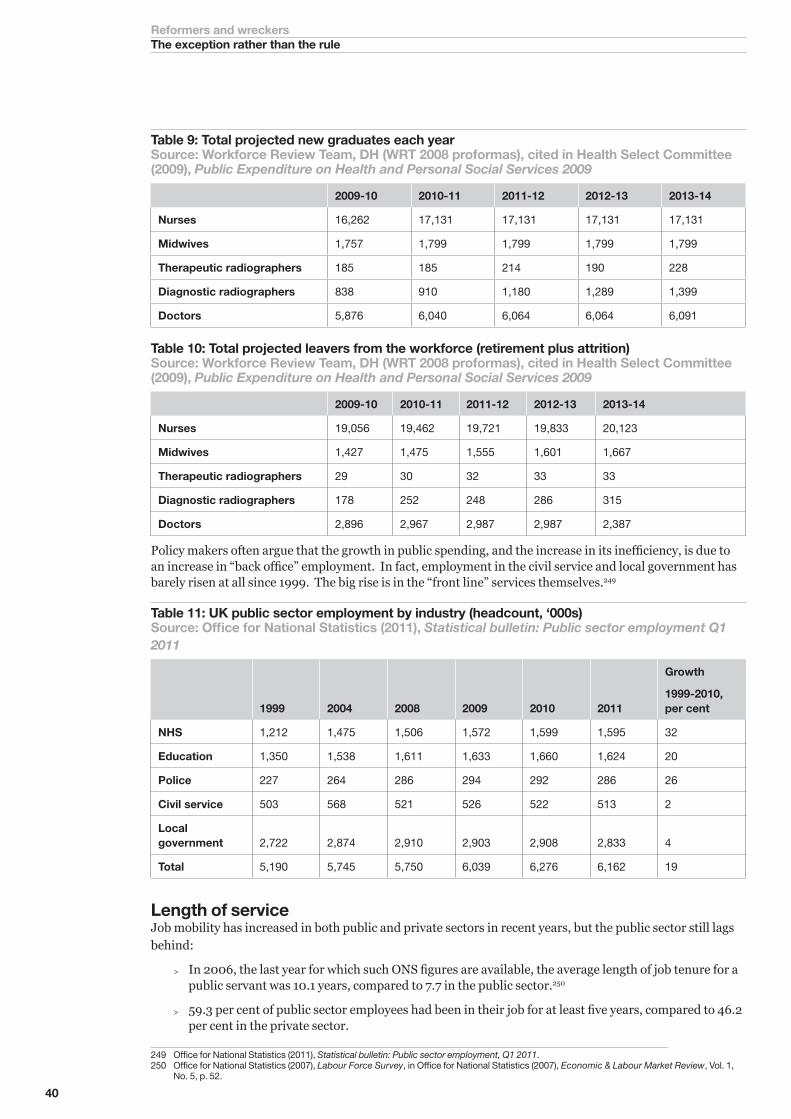
40
Reformers and wreckersThe exception rather than the rule
Table 9: Total projected new graduates each yearSource: Workforce Review Team, DH (WRT 2008 proformas), cited in Health Select Committee (2009), Public Expenditure on Health and Personal Social Services 2009
2009-10 2010-11 2011-12 2012-13 2013-14
Nurses 16,262 17,131 17,131 17,131 17,131
Midwives 1,757 1,799 1,799 1,799 1,799
Therapeutic radiographers 185 185 214 190 228
Diagnostic radiographers 838 910 1,180 1,289 1,399
Doctors 5,876 6,040 6,064 6,064 6,091
Table 10: Total projected leavers from the workforce (retirement plus attrition)Source: Workforce Review Team, DH (WRT 2008 proformas), cited in Health Select Committee (2009), Public Expenditure on Health and Personal Social Services 2009
2009-10 2010-11 2011-12 2012-13 2013-14
Nurses 19,056 19,462 19,721 19,833 20,123
Midwives 1,427 1,475 1,555 1,601 1,667
Therapeutic radiographers 29 30 32 33 33
Diagnostic radiographers 178 252 248 286 315
Doctors 2,896 2,967 2,987 2,987 2,387
Policy makers often argue that the growth in public spending, and the increase in its inefficiency, is due to an increase in “back office” employment. In fact, employment in the civil service and local government has barely risen at all since 1999. The big rise is in the “front line” services themselves.249
Table 11: UK public sector employment by industry (headcount, ‘000s)Source: Office for National Statistics (2011), Statistical bulletin: Public sector employment Q1 2011
1999 2004 2008 2009 2010 2011
Growth
1999-2010, per cent
NHS 1,212 1,475 1,506 1,572 1,599 1,595 32
Education 1,350 1,538 1,611 1,633 1,660 1,624 20
Police 227 264 286 294 292 286 26
Civil service 503 568 521 526 522 513 2
Local government 2,722 2,874 2,910 2,903 2,908 2,833 4
Total 5,190 5,745 5,750 6,039 6,276 6,162 19
Length of serviceJob mobility has increased in both public and private sectors in recent years, but the public sector still lags behind:
> In 2006, the last year for which such ONS figures are available, the average length of job tenure for a public servant was 10.1 years, compared to 7.7 in the public sector.250
> 59.3 per cent of public sector employees had been in their job for at least five years, compared to 46.2 per cent in the private sector.
249 Office for National Statistics (2011), Statistical bulletin: Public sector employment, Q1 2011. 250 Office for National Statistics (2007), Labour Force Survey, in Office for National Statistics (2007), Economic & Labour Market Review, Vol. 1,
No. 5, p. 52.
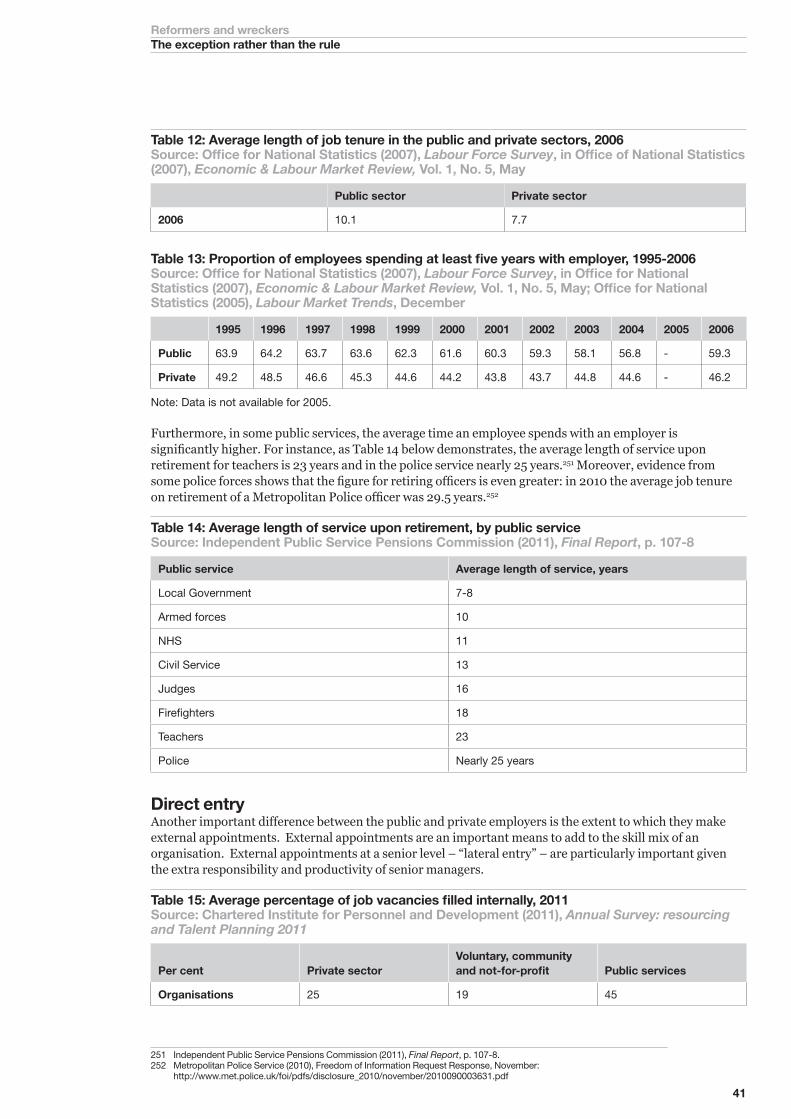
41
Reformers and wreckersThe exception rather than the rule
Table 12: Average length of job tenure in the public and private sectors, 2006Source: Office for National Statistics (2007), Labour Force Survey, in Office of National Statistics (2007), Economic & Labour Market Review, Vol. 1, No. 5, May
Public sector Private sector
2006 10.1 7.7
Table 13: Proportion of employees spending at least five years with employer, 1995-2006Source: Office for National Statistics (2007), Labour Force Survey, in Office for National Statistics (2007), Economic & Labour Market Review, Vol. 1, No. 5, May; Office for National Statistics (2005), Labour Market Trends, December
1995 1996 1997 1998 1999 2000 2001 2002 2003 2004 2005 2006
Public 63.9 64.2 63.7 63.6 62.3 61.6 60.3 59.3 58.1 56.8 - 59.3
Private 49.2 48.5 46.6 45.3 44.6 44.2 43.8 43.7 44.8 44.6 - 46.2
Note: Data is not available for 2005.
Furthermore, in some public services, the average time an employee spends with an employer is significantly higher. For instance, as Table 14 below demonstrates, the average length of service upon retirement for teachers is 23 years and in the police service nearly 25 years.251 Moreover, evidence from some police forces shows that the figure for retiring officers is even greater: in 2010 the average job tenure on retirement of a Metropolitan Police officer was 29.5 years.252
Table 14: Average length of service upon retirement, by public service Source: Independent Public Service Pensions Commission (2011), Final Report, p. 107-8
Public service Average length of service, years
Local Government 7-8
Armed forces 10
NHS 11
Civil Service 13
Judges 16
Firefighters 18
Teachers 23
Police Nearly 25 years
Direct entryAnother important difference between the public and private employers is the extent to which they make external appointments. External appointments are an important means to add to the skill mix of an organisation. External appointments at a senior level – “lateral entry” – are particularly important given the extra responsibility and productivity of senior managers.
Table 15: Average percentage of job vacancies filled internally, 2011Source: Chartered Institute for Personnel and Development (2011), Annual Survey: resourcing and Talent Planning 2011
Per cent Private sector Voluntary, community and not-for-profit Public services
Organisations 25 19 45
251 Independent Public Service Pensions Commission (2011), Final Report, p. 107-8.252 Metropolitan Police Service (2010), Freedom of Information Request Response, November: http://www.met.police.uk/foi/pdfs/disclosure_2010/november/2010090003631.pdf
42
Reformers and wreckersThe exception rather than the rule
There is resistance to external appointment in some parts of the public sector, notably the police service, as shown by the discussion over the potential appointment of Bill Bratton as a chief constable for a UK force.253 In 2010, the Public Administration Select Committee found that senior civil servants feared that core organisational values could be diluted by an influx of outside recruits who do not share the same public service ethos,254 despite evidence that private sector recruits are no less committed to public service than lifelong employees.255
These concerns seem overdone considering the successful use of external appointment in other public services. In Australia, external appointment was a key means to improve the Australian Defence Service.256 In the UK, external appointment is being used to improve the teaching workforce. In particular, the Graduate Teacher Programme enables people with experience in other careers to enter the teaching profession at a high level after an initial year of training, while the Transition to Teaching programme similarly assists high-performing employees to make a mid-to late career change into teaching.257 In addition, the Government has announced plans to promote ex-military personnel in becoming teachers through the Troops to Teachers scheme, after it has proved successful in the United States.258
While the Police Federation and the Association of Chief Police Officers have been vocal in their opposition to direct entry into the police,259 teaching unions have largely supported the recruitment of teachers from other walks of life. In 2009, the Association of School and College Leaders told MPs: “It is important to retain a range of entry routes into teaching to attract those at different stages of their life and current career. Paid routes into teaching such as the Graduate Teacher Programme are attractive alternatives for those considering a career change.”260
Toleration of poor performanceA 2006 employee report found that 63 per cent of government organisations are seen to tolerate poor performance of staff, compared to 39 per cent across the economy as a whole.261 In addition, Deloitte have found that 75 per cent of public sector employees believe that their junior or middle-ranking line managers are poorly equipped to confront poor performance due to a lack of skills and experience. As Deloitte argued, “Over time, this has created a culture of permissiveness in some areas, where cursory performance measures undermine the credibility of the appraisals process”.262
This culture of permissiveness is demonstrated by the comparatively tentative approach to disciplinary action among public sector employers. According to research by the CIPD, public sector organisations shy away from disciplining poor performing staff, averaging just one formal disciplinary case per 364 employees, compared to one case per 119 employees in the private sector.263 When they do undertake formal action, public services employers also take far longer to deal with disciplinary and grievance cases, averaging 21 days of management time on every disciplinary case and 12 days on every grievance case. This compares to 11.5 days and 6.7 days for private services employers.264
253 For example, The Guardian (2011), “David Cameron: foreign police chief could run UK force to tackle corruption”, The Guardian, 20 July.254 House of Commons Public Administration Select Committee (2010), Outsiders and Insiders: External Appointments to the Senior Civil
Service.255 Deloitte (2008),Transfusion: Private to Public. Views on the delivery challenge from senior civil servants recruited directly from the private
sector, p. 2.256 The Australian Defence Service (ADS) has like many other public sector workforces, experienced difficulties in recruiting skilled and specialised
workers. In order to address capacity shortfalls, they have introduced a recruitment drive which gives appropriate recognition to the civilian skills and permitting lateral recruitment of servicemen and women without prior military experience. They have also introduced an ‘Overseas Lateral Transfer Scheme’ for foreign nationals with suitable military experience and specific skill sets. ADS (2007) Report of the Defence-Industry Joint Training Task Force.
257 http://www.tda.gov.uk/get-into-teaching/teacher-training-options/gtp.aspx. Accessed 26 August 2011; http://www.tda.gov.uk/get-into-teaching/transition-to-teach.aspx. Accessed 26 August 2011.
258 Department for Education (2010), The Importance of Teaching: Schools White Paper.259 For example: BBC Online (2011), ‘England riots: Police hit out at ‘supercop’ Bill Bratton plan’, 14 August; Mirror (2011), ‘Police condemn move
for ‘supercop’, 13 August.260 House of Commons Children, Schools and Families Select Committee (2009), Training of teachers, Memorandum submitted by the
Association of School and College Leaders.261 Ibid., p. 5. 262 Deloitte (2008), Bold moves: Using human capital to strengthen public-sector performance, p. 7. 263 Chartered Institute for Personnel and Development (2010), Building productive public sector workplaces: Improving people management,
p. 9.264 Ibid., p. 9
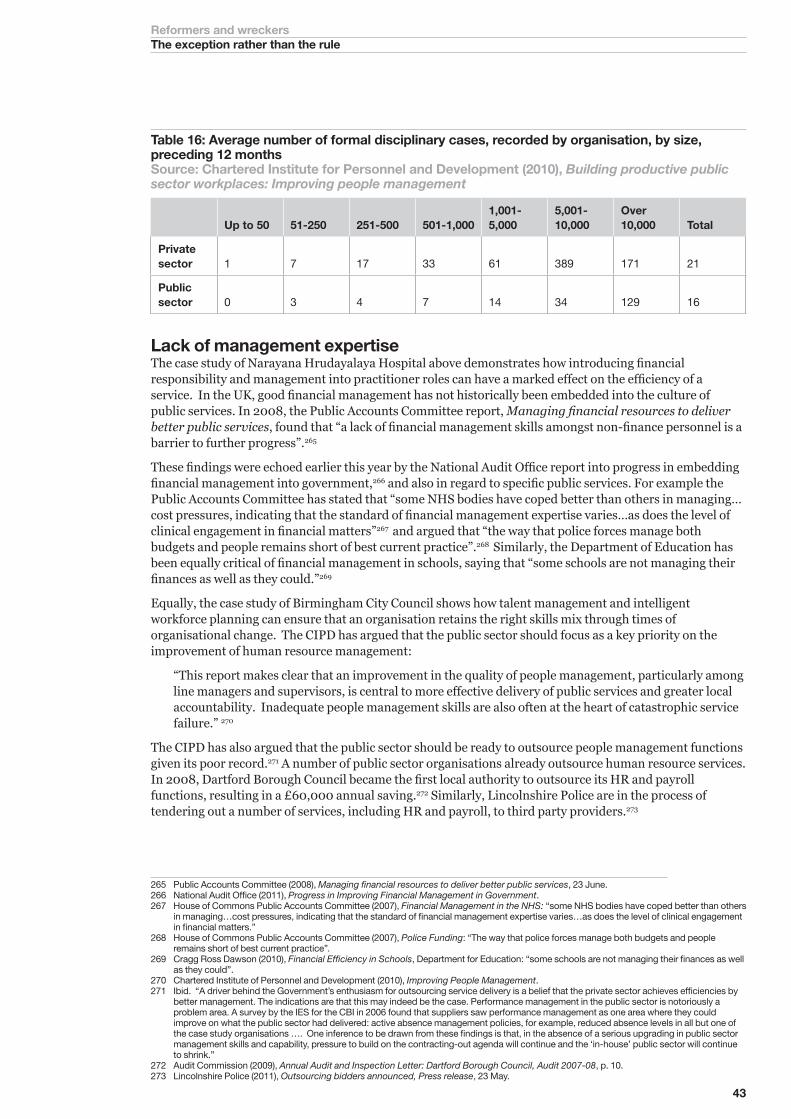
43
Reformers and wreckersThe exception rather than the rule
Table 16: Average number of formal disciplinary cases, recorded by organisation, by size, preceding 12 monthsSource: Chartered Institute for Personnel and Development (2010), Building productive public sector workplaces: Improving people management
Up to 50 51-250 251-500 501-1,0001,001-5,000
5,001-10,000
Over 10,000 Total
Private sector 1 7 17 33 61 389 171 21
Public sector 0 3 4 7 14 34 129 16
Lack of management expertiseThe case study of Narayana Hrudayalaya Hospital above demonstrates how introducing financial responsibility and management into practitioner roles can have a marked effect on the efficiency of a service. In the UK, good financial management has not historically been embedded into the culture of public services. In 2008, the Public Accounts Committee report, Managing financial resources to deliver better public services, found that “a lack of financial management skills amongst non-finance personnel is a barrier to further progress”.265
These findings were echoed earlier this year by the National Audit Office report into progress in embedding financial management into government,266 and also in regard to specific public services. For example the Public Accounts Committee has stated that “some NHS bodies have coped better than others in managing…cost pressures, indicating that the standard of financial management expertise varies…as does the level of clinical engagement in financial matters”267 and argued that “the way that police forces manage both budgets and people remains short of best current practice”.268 Similarly, the Department of Education has been equally critical of financial management in schools, saying that “some schools are not managing their finances as well as they could.”269
Equally, the case study of Birmingham City Council shows how talent management and intelligent workforce planning can ensure that an organisation retains the right skills mix through times of organisational change. The CIPD has argued that the public sector should focus as a key priority on the improvement of human resource management:
“This report makes clear that an improvement in the quality of people management, particularly among line managers and supervisors, is central to more effective delivery of public services and greater local accountability. Inadequate people management skills are also often at the heart of catastrophic service failure.” 270
The CIPD has also argued that the public sector should be ready to outsource people management functions given its poor record.271 A number of public sector organisations already outsource human resource services. In 2008, Dartford Borough Council became the first local authority to outsource its HR and payroll functions, resulting in a £60,000 annual saving.272 Similarly, Lincolnshire Police are in the process of tendering out a number of services, including HR and payroll, to third party providers.273
265 Public Accounts Committee (2008), Managing financial resources to deliver better public services, 23 June.266 National Audit Office (2011), Progress in Improving Financial Management in Government.267 House of Commons Public Accounts Committee (2007), Financial Management in the NHS: “some NHS bodies have coped better than others
in managing…cost pressures, indicating that the standard of financial management expertise varies…as does the level of clinical engagement in financial matters.”
268 House of Commons Public Accounts Committee (2007), Police Funding: “The way that police forces manage both budgets and people remains short of best current practice”.
269 Cragg Ross Dawson (2010), Financial Efficiency in Schools, Department for Education: “some schools are not managing their finances as well as they could”.
270 Chartered Institute of Personnel and Development (2010), Improving People Management.271 Ibid. “A driver behind the Government’s enthusiasm for outsourcing service delivery is a belief that the private sector achieves efficiencies by
better management. The indications are that this may indeed be the case. Performance management in the public sector is notoriously a problem area. A survey by the IES for the CBI in 2006 found that suppliers saw performance management as one area where they could improve on what the public sector had delivered: active absence management policies, for example, reduced absence levels in all but one of the case study organisations …. One inference to be drawn from these findings is that, in the absence of a serious upgrading in public sector management skills and capability, pressure to build on the contracting-out agenda will continue and the ‘in-house’ public sector will continue to shrink.”
272 Audit Commission (2009), Annual Audit and Inspection Letter: Dartford Borough Council, Audit 2007-08, p. 10. 273 Lincolnshire Police (2011), Outsourcing bidders announced, Press release, 23 May.

44
Reformers and wreckersThe exception rather than the rule
Dissatisfied staffIn 2009, in a report for the Department for Business, Innovation and Skills, David MacLeod found that organisations with engaged employees delivered higher performance and innovation.274 For this reason, it is of great concern that public sector employees are clearly less engaged with their organisations than the private sector.
Table 17: Employee satisfaction indicators by sector, percentageSource: Chartered Institute of Personnel and Development, Employee Outlook, Summer 2011
Per cent Public sector Private sector Voluntary sector
Net employee engagement with their organisation -12 10 13
Net employee satisfaction with managers -10 28 17
At the same time, sickness absence in the public sector remains significantly higher than in the public sector:275
> The CIPD’s 2010 Absence management survey finds that levels of absence in the public sector stand at 9.6 days lost per employee per year compared to 6.6 days in the private sector.276
> In the final quarter of last year, 3.1 per cent of public sector employees were absent due to sickness, while just 2.1 per cent of private sector workers were absent.277
Table 18: Average level of employee absence, by sectorSource: Chartered Institute for Personnel and Development (2010), Annual absence management survey 2010, p. 8.
Average working time lost per year, per cent
Average number of days lost per employee per year
Public sector 4.2 9.6
Private sector services 2.9 6.6
Non-profit organisations 3.6 8.3
There is no straightforward explanation for the absence gap between the public and private sectors. However, the CIPD have noted that there is “a fundamental difference in management culture and absence management practice between the public and private services…public sector employers are less likely than private sector organisations to:
> refer to disciplinary procedures in absence policies;
> discipline or dismiss employees for unacceptable levels of absence;
> restrict sick pay to help manage absence;
> use absence records when selecting for redundancy;
> take account of individuals’ attendance records in conducting employee appraisals.”278
Occupational sick pay schemes in the public sector are also considerably more generous than in the private sector. According to the CIPD, over two thirds of public sector employers provide full pay for more than 20 weeks compared with one fifth in private sector services.279
The cost of this absence to the UK economy is estimated at £17 billion in 2010.280
274 Macleod, D. and Clarke, N. (2009), Engaging for success: Enhancing performance through employee engagement, A report to Government: “Engagement, going to the heart of the workplace relationship between the employee and employer, can be a key to unlocking productivity and to transforming the working lives of many people whom Monday morning is an especially low point of the week.”
275 CBI and Pfizer (2011), Healthy returns? Absence and workplace health survey 2011.276 Chartered Institute for Personnel and Development (2010), Annual absence management survey 2010, p. 8. 277 Office for National Statistics (2011), Sickness absence in the labour market.278 Ibid., p. 7. 279 Ibid., p. 4. 280 CBI and Pfizer (2011), Healthy returns? Absence and workplace health survey 2011.
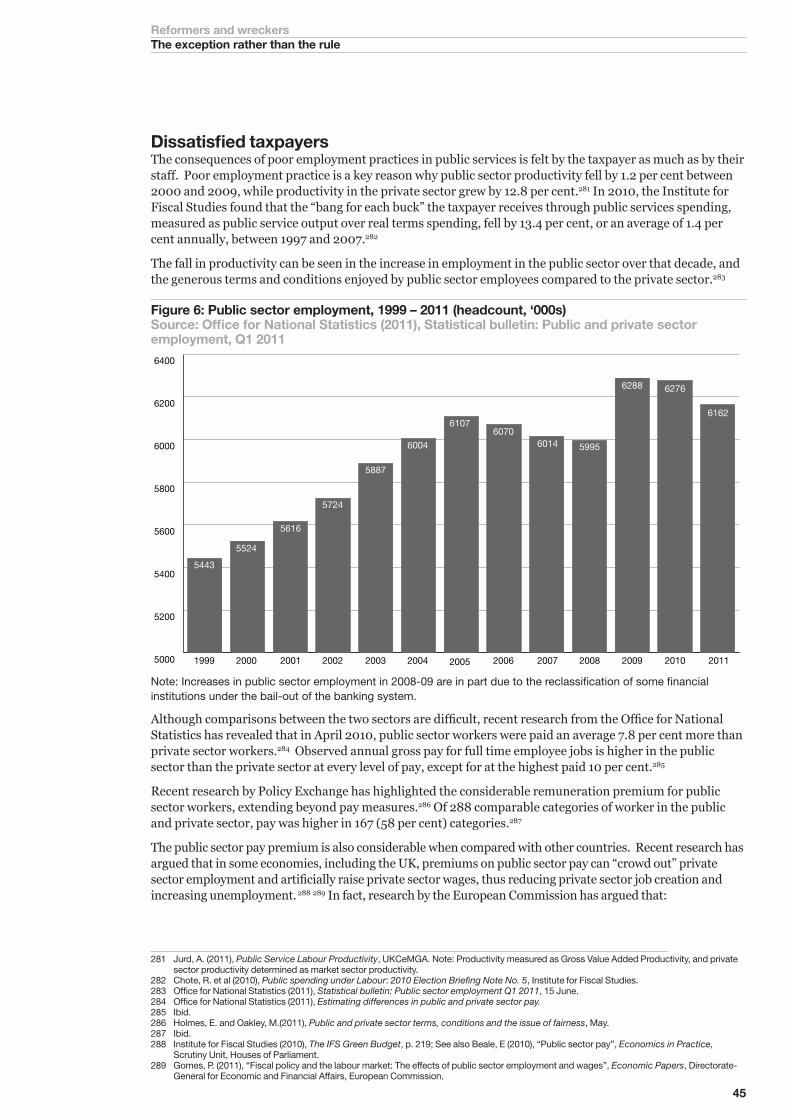
45
Reformers and wreckersThe exception rather than the rule
Dissatisfied taxpayersThe consequences of poor employment practices in public services is felt by the taxpayer as much as by their staff. Poor employment practice is a key reason why public sector productivity fell by 1.2 per cent between 2000 and 2009, while productivity in the private sector grew by 12.8 per cent.281 In 2010, the Institute for Fiscal Studies found that the “bang for each buck” the taxpayer receives through public services spending, measured as public service output over real terms spending, fell by 13.4 per cent, or an average of 1.4 per cent annually, between 1997 and 2007.282
The fall in productivity can be seen in the increase in employment in the public sector over that decade, and the generous terms and conditions enjoyed by public sector employees compared to the private sector.283
Figure 6: Public sector employment, 1999 – 2011 (headcount, ‘000s)Source: Office for National Statistics (2011), Statistical bulletin: Public and private sector employment, Q1 2011
5000
5200
5400
5600
5800
6000
6200
6400
1999 2000 2001 2002 2003 2004 2005 2006 2007 2008 2009 2010 2011
5443
5524
5616
5724
5887
6004
61076070
6014 5995
6288 6276
6162
Note: Increases in public sector employment in 2008-09 are in part due to the reclassification of some financial institutions under the bail-out of the banking system.
Although comparisons between the two sectors are difficult, recent research from the Office for National Statistics has revealed that in April 2010, public sector workers were paid an average 7.8 per cent more than private sector workers.284 Observed annual gross pay for full time employee jobs is higher in the public sector than the private sector at every level of pay, except for at the highest paid 10 per cent.285
Recent research by Policy Exchange has highlighted the considerable remuneration premium for public sector workers, extending beyond pay measures.286 Of 288 comparable categories of worker in the public and private sector, pay was higher in 167 (58 per cent) categories.287
The public sector pay premium is also considerable when compared with other countries. Recent research has argued that in some economies, including the UK, premiums on public sector pay can “crowd out” private sector employment and artificially raise private sector wages, thus reducing private sector job creation and increasing unemployment. 288 289 In fact, research by the European Commission has argued that:
281 Jurd, A. (2011), Public Service Labour Productivity, UKCeMGA. Note: Productivity measured as Gross Value Added Productivity, and private sector productivity determined as market sector productivity.
282 Chote, R. et al (2010), Public spending under Labour: 2010 Election Briefing Note No. 5, Institute for Fiscal Studies.283 Office for National Statistics (2011), Statistical bulletin: Public sector employment Q1 2011, 15 June.284 Office for National Statistics (2011), Estimating differences in public and private sector pay.285 Ibid. 286 Holmes, E. and Oakley, M.(2011), Public and private sector terms, conditions and the issue of fairness, May.287 Ibid.288 Institute for Fiscal Studies (2010), The IFS Green Budget, p. 219; See also Beale, E (2010), “Public sector pay”, Economics in Practice,
Scrutiny Unit, Houses of Parliament.289 Gomes, P. (2011), “Fiscal policy and the labour market: The effects of public sector employment and wages”, Economic Papers, Directorate-
General for Economic and Financial Affairs, European Commission.
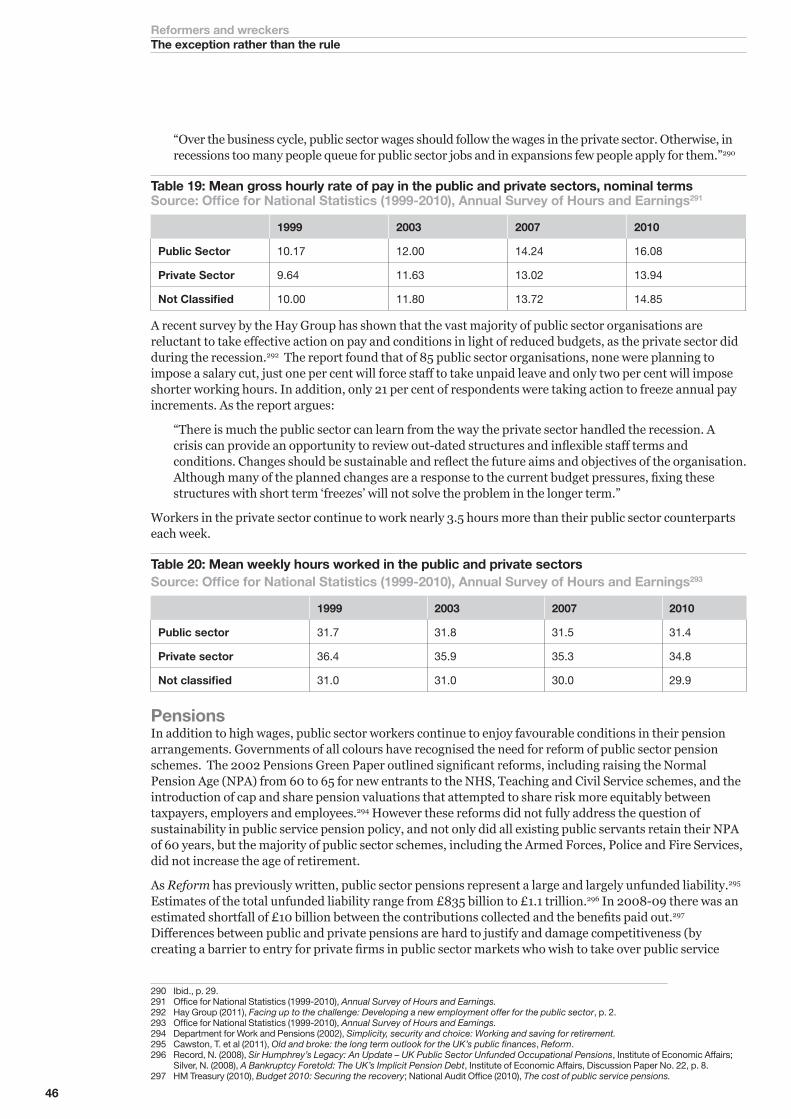
46
Reformers and wreckersThe exception rather than the rule
“Over the business cycle, public sector wages should follow the wages in the private sector. Otherwise, in recessions too many people queue for public sector jobs and in expansions few people apply for them.”290
Table 19: Mean gross hourly rate of pay in the public and private sectors, nominal termsSource: Office for National Statistics (1999-2010), Annual Survey of Hours and Earnings291
1999 2003 2007 2010
Public Sector 10.17 12.00 14.24 16.08
Private Sector 9.64 11.63 13.02 13.94
Not Classified 10.00 11.80 13.72 14.85
A recent survey by the Hay Group has shown that the vast majority of public sector organisations are reluctant to take effective action on pay and conditions in light of reduced budgets, as the private sector did during the recession.292 The report found that of 85 public sector organisations, none were planning to impose a salary cut, just one per cent will force staff to take unpaid leave and only two per cent will impose shorter working hours. In addition, only 21 per cent of respondents were taking action to freeze annual pay increments. As the report argues:
“There is much the public sector can learn from the way the private sector handled the recession. A crisis can provide an opportunity to review out-dated structures and inflexible staff terms and conditions. Changes should be sustainable and reflect the future aims and objectives of the organisation. Although many of the planned changes are a response to the current budget pressures, fixing these structures with short term ‘freezes’ will not solve the problem in the longer term.”
Workers in the private sector continue to work nearly 3.5 hours more than their public sector counterparts each week.
Table 20: Mean weekly hours worked in the public and private sectorsSource: Office for National Statistics (1999-2010), Annual Survey of Hours and Earnings293
1999 2003 2007 2010
Public sector 31.7 31.8 31.5 31.4
Private sector 36.4 35.9 35.3 34.8
Not classified 31.0 31.0 30.0 29.9
PensionsIn addition to high wages, public sector workers continue to enjoy favourable conditions in their pension arrangements. Governments of all colours have recognised the need for reform of public sector pension schemes. The 2002 Pensions Green Paper outlined significant reforms, including raising the Normal Pension Age (NPA) from 60 to 65 for new entrants to the NHS, Teaching and Civil Service schemes, and the introduction of cap and share pension valuations that attempted to share risk more equitably between taxpayers, employers and employees.294 However these reforms did not fully address the question of sustainability in public service pension policy, and not only did all existing public servants retain their NPA of 60 years, but the majority of public sector schemes, including the Armed Forces, Police and Fire Services, did not increase the age of retirement.
As Reform has previously written, public sector pensions represent a large and largely unfunded liability.295 Estimates of the total unfunded liability range from £835 billion to £1.1 trillion.296 In 2008-09 there was an estimated shortfall of £10 billion between the contributions collected and the benefits paid out.297 Differences between public and private pensions are hard to justify and damage competitiveness (by creating a barrier to entry for private firms in public sector markets who wish to take over public service
290 Ibid., p. 29. 291 Office for National Statistics (1999-2010), Annual Survey of Hours and Earnings.292 Hay Group (2011), Facing up to the challenge: Developing a new employment offer for the public sector, p. 2. 293 Office for National Statistics (1999-2010), Annual Survey of Hours and Earnings.294 Department for Work and Pensions (2002), Simplicity, security and choice: Working and saving for retirement.295 Cawston, T. et al (2011), Old and broke: the long term outlook for the UK’s public finances, Reform. 296 Record, N. (2008), Sir Humphrey’s Legacy: An Update – UK Public Sector Unfunded Occupational Pensions, Institute of Economic Affairs;
Silver, N. (2008), A Bankruptcy Foretold: The UK’s Implicit Pension Debt, Institute of Economic Affairs, Discussion Paper No. 22, p. 8.297 HM Treasury (2010), Budget 2010: Securing the recovery; National Audit Office (2010), The cost of public service pensions.
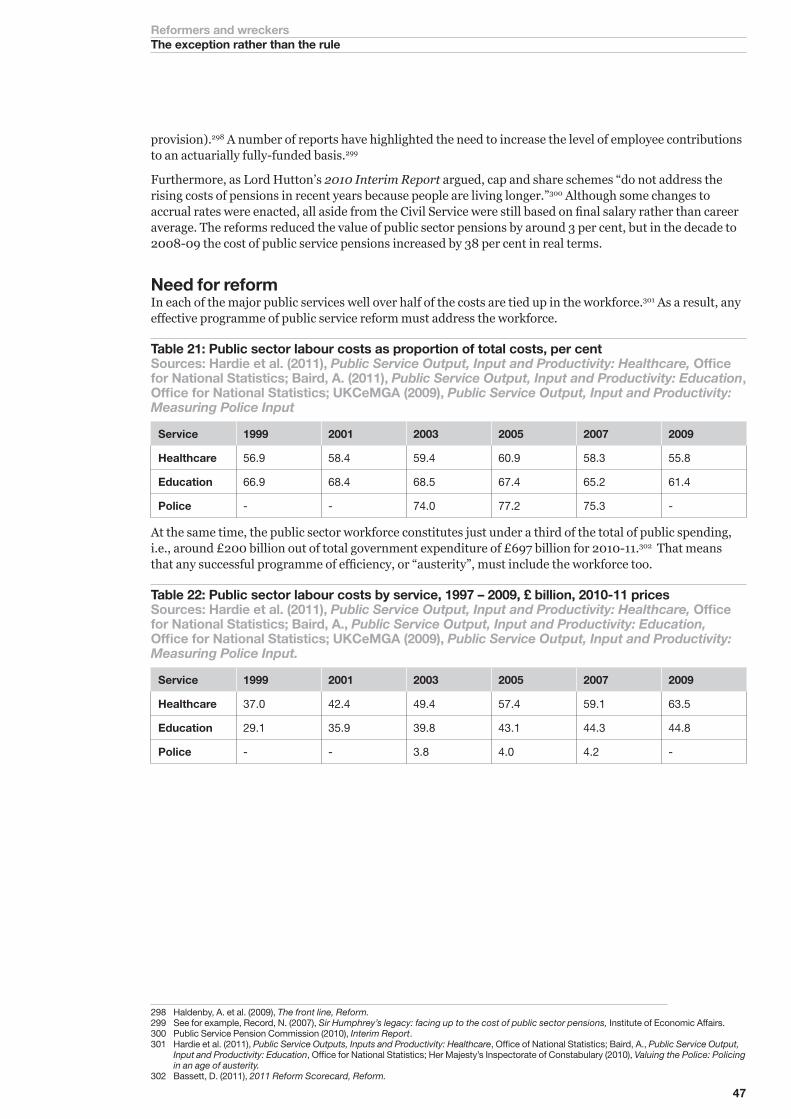
47
Reformers and wreckersThe exception rather than the rule
provision).298 A number of reports have highlighted the need to increase the level of employee contributions to an actuarially fully-funded basis.299
Furthermore, as Lord Hutton’s 2010 Interim Report argued, cap and share schemes “do not address the rising costs of pensions in recent years because people are living longer.”300 Although some changes to accrual rates were enacted, all aside from the Civil Service were still based on final salary rather than career average. The reforms reduced the value of public sector pensions by around 3 per cent, but in the decade to 2008-09 the cost of public service pensions increased by 38 per cent in real terms.
Need for reformIn each of the major public services well over half of the costs are tied up in the workforce.301 As a result, any effective programme of public service reform must address the workforce.
Table 21: Public sector labour costs as proportion of total costs, per centSources: Hardie et al. (2011), Public Service Output, Input and Productivity: Healthcare, Office for National Statistics; Baird, A. (2011), Public Service Output, Input and Productivity: Education, Office for National Statistics; UKCeMGA (2009), Public Service Output, Input and Productivity: Measuring Police Input
Service 1999 2001 2003 2005 2007 2009
Healthcare 56.9 58.4 59.4 60.9 58.3 55.8
Education 66.9 68.4 68.5 67.4 65.2 61.4
Police - - 74.0 77.2 75.3 -
At the same time, the public sector workforce constitutes just under a third of the total of public spending, i.e., around £200 billion out of total government expenditure of £697 billion for 2010-11.302 That means that any successful programme of efficiency, or “austerity”, must include the workforce too.
Table 22: Public sector labour costs by service, 1997 – 2009, £ billion, 2010-11 pricesSources: Hardie et al. (2011), Public Service Output, Input and Productivity: Healthcare, Office for National Statistics; Baird, A., Public Service Output, Input and Productivity: Education, Office for National Statistics; UKCeMGA (2009), Public Service Output, Input and Productivity: Measuring Police Input.
Service 1999 2001 2003 2005 2007 2009
Healthcare 37.0 42.4 49.4 57.4 59.1 63.5
Education 29.1 35.9 39.8 43.1 44.3 44.8
Police - - 3.8 4.0 4.2 -
298 Haldenby, A. et al. (2009), The front line, Reform.299 See for example, Record, N. (2007), Sir Humphrey’s legacy: facing up to the cost of public sector pensions, Institute of Economic Affairs.300 Public Service Pension Commission (2010), Interim Report.301 Hardie et al. (2011), Public Service Outputs, Inputs and Productivity: Healthcare, Office of National Statistics; Baird, A., Public Service Output,
Input and Productivity: Education, Office for National Statistics; Her Majesty’s Inspectorate of Constabulary (2010), Valuing the Police: Policing in an age of austerity.
302 Bassett, D. (2011), 2011 Reform Scorecard, Reform.
48
Reformers and wreckersPolicy debate
3Policy debate
Both the Government and the trade union movement have made important contributions to the policy debate over the last year. The trade union contribution will form the agenda of the TUC Congress in September 2011. Judged by the evidence of the case studies in this report, the TUC agenda would both weaken the performance of public services and decrease their efficiency. In the former Prime Minister Tony Blair’s contrast between “reformers and wreckers,” it amounts to a wrecker’s charter.303 It would be the wrong approach for public services in times of generous public spending increases, let alone in conditions of austerity. The projected job losses in the public sector are manageable and public sector pensions will remain generous even after reform.
The Government’s policies announced so far are a mixed package. There are clearly reforming measures, in particular the flexible employment of teachers at academies and free schools and the Winsor Review of policing terms and conditions. But there are also centralising measures, for example new performance management regulations for the great majority of state schools. Most importantly, many Ministers still argue that more staff necessarily mean better services. They also argue that public sector pay should be set regardless of performance and should have arbitrary limits such as the Prime Minister’s salary. These measures point to a low productivity public sector in the same way as the TUC recommendations.
Wreckers not reformersThe agenda of the TUC Congress for September 2011 is hostile to the example of success set out in the case studies in this report.304 In general, it is based on the view that the size of public sector employment is what matters rather than its quality. It also takes the view that greater flexibility in the public sector, in particular in schools, is to be opposed and that value for money is a secondary question. It even argues that managers should be ready to overlook sickness absence, contrary to managers’ duty of care for their employees.
This programme would provide active opposition to the successful managers described in the first chapter. It would reinforce the outdated culture of employment described in the second chapter.
303 Prime Minister Tony Blair raised the idea of “reformers and wreckers” in his speech to the Labour Party Local Government and Women’s Conference in Cardiff on 3 February 2002. “Our strategy is to build up the public services. Theirs is to knock them down. Reformers versus wreckers. That is the battle for this Parliament and it is one that we must win.”
304 Trades Union Congress (2011), Motions and nominations, 143rd annual Trades Union Congress, 12-14 September, London.
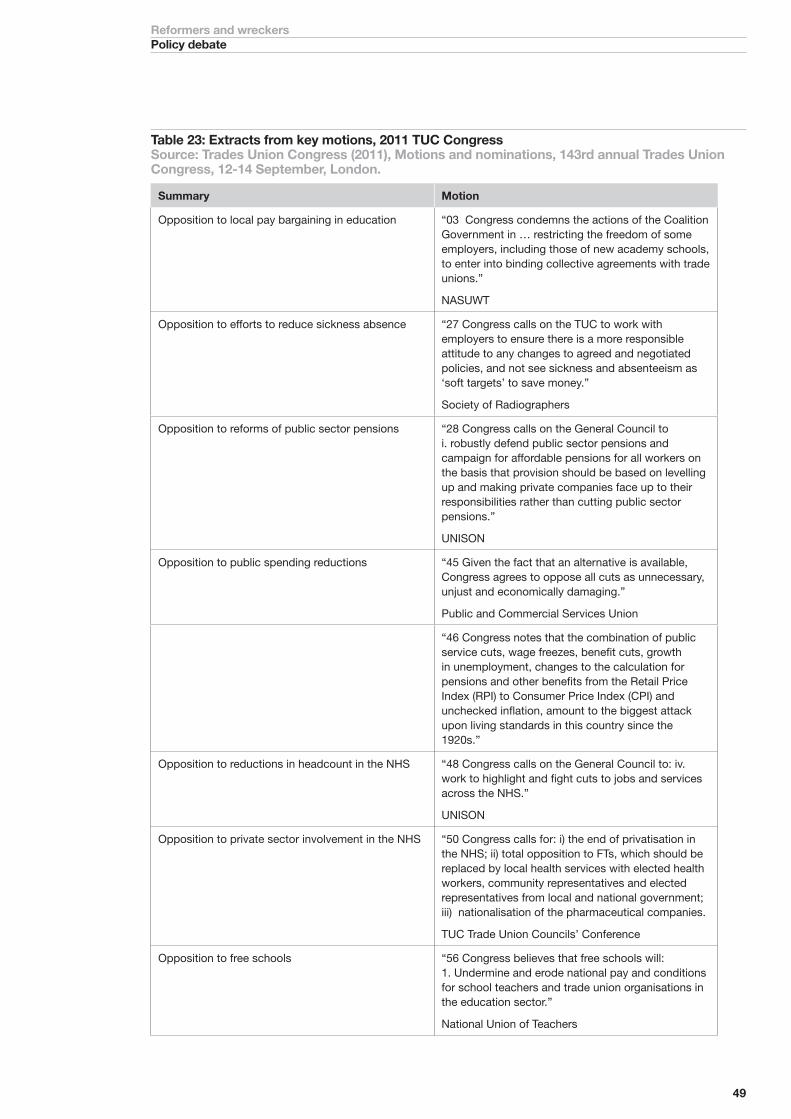
49
Reformers and wreckersPolicy debate
Table 23: Extracts from key motions, 2011 TUC CongressSource: Trades Union Congress (2011), Motions and nominations, 143rd annual Trades Union Congress, 12-14 September, London.
Summary Motion
Opposition to local pay bargaining in education “03 Congress condemns the actions of the Coalition Government in … restricting the freedom of some employers, including those of new academy schools, to enter into binding collective agreements with trade unions.”
NASUWT
Opposition to efforts to reduce sickness absence “27 Congress calls on the TUC to work with employers to ensure there is a more responsible attitude to any changes to agreed and negotiated policies, and not see sickness and absenteeism as ‘soft targets’ to save money.”
Society of Radiographers
Opposition to reforms of public sector pensions “28 Congress calls on the General Council to i. robustly defend public sector pensions and campaign for affordable pensions for all workers on the basis that provision should be based on levelling up and making private companies face up to their responsibilities rather than cutting public sector pensions.”
UNISON
Opposition to public spending reductions “45 Given the fact that an alternative is available, Congress agrees to oppose all cuts as unnecessary, unjust and economically damaging.”
Public and Commercial Services Union
“46 Congress notes that the combination of public service cuts, wage freezes, benefit cuts, growth in unemployment, changes to the calculation for pensions and other benefits from the Retail Price Index (RPI) to Consumer Price Index (CPI) and unchecked inflation, amount to the biggest attack upon living standards in this country since the 1920s.”
Opposition to reductions in headcount in the NHS “48 Congress calls on the General Council to: iv. work to highlight and fight cuts to jobs and services across the NHS.”
UNISON
Opposition to private sector involvement in the NHS “50 Congress calls for: i) the end of privatisation in the NHS; ii) total opposition to FTs, which should be replaced by local health services with elected health workers, community representatives and elected representatives from local and national government; iii) nationalisation of the pharmaceutical companies.
TUC Trade Union Councils’ Conference
Opposition to free schools “56 Congress believes that free schools will: 1. Undermine and erode national pay and conditions for school teachers and trade union organisations in the education sector.”
National Union of Teachers
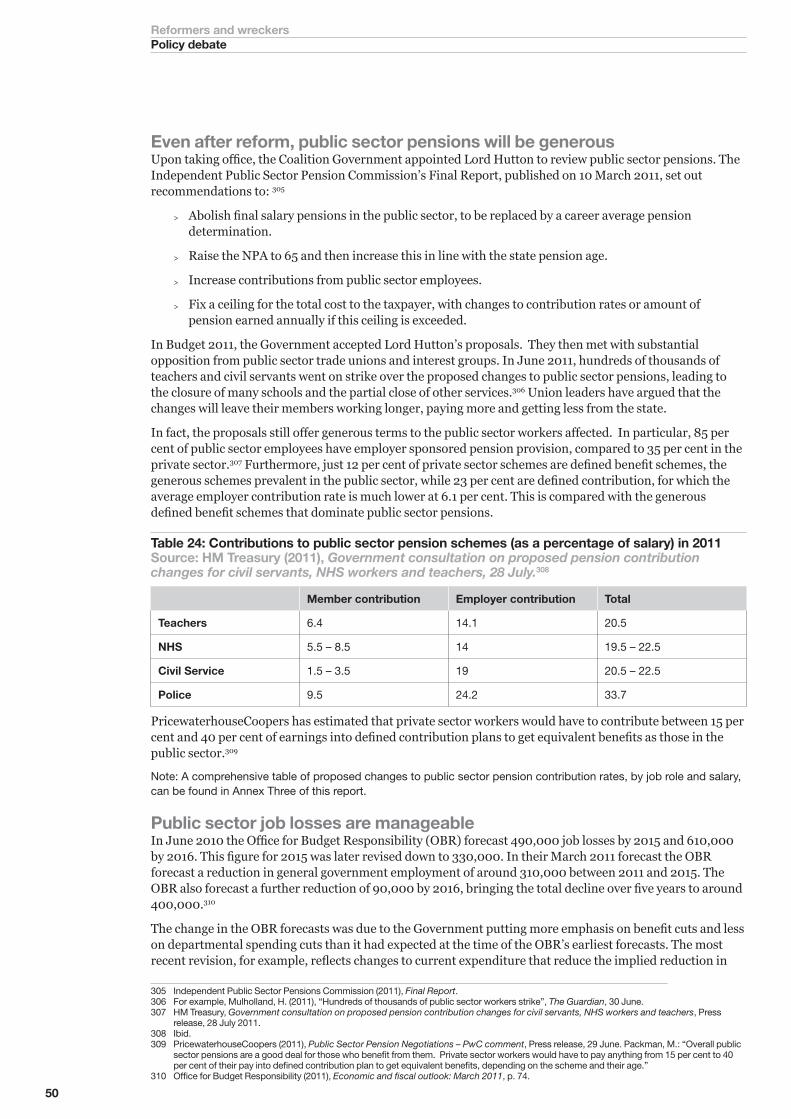
50
Reformers and wreckersPolicy debate
Even after reform, public sector pensions will be generousUpon taking office, the Coalition Government appointed Lord Hutton to review public sector pensions. The Independent Public Sector Pension Commission’s Final Report, published on 10 March 2011, set out recommendations to: 305
> Abolish final salary pensions in the public sector, to be replaced by a career average pension determination.
> Raise the NPA to 65 and then increase this in line with the state pension age.
> Increase contributions from public sector employees.
> Fix a ceiling for the total cost to the taxpayer, with changes to contribution rates or amount of pension earned annually if this ceiling is exceeded.
In Budget 2011, the Government accepted Lord Hutton’s proposals. They then met with substantial opposition from public sector trade unions and interest groups. In June 2011, hundreds of thousands of teachers and civil servants went on strike over the proposed changes to public sector pensions, leading to the closure of many schools and the partial close of other services.306 Union leaders have argued that the changes will leave their members working longer, paying more and getting less from the state.
In fact, the proposals still offer generous terms to the public sector workers affected. In particular, 85 per cent of public sector employees have employer sponsored pension provision, compared to 35 per cent in the private sector.307 Furthermore, just 12 per cent of private sector schemes are defined benefit schemes, the generous schemes prevalent in the public sector, while 23 per cent are defined contribution, for which the average employer contribution rate is much lower at 6.1 per cent. This is compared with the generous defined benefit schemes that dominate public sector pensions.
Table 24: Contributions to public sector pension schemes (as a percentage of salary) in 2011Source: HM Treasury (2011), Government consultation on proposed pension contribution changes for civil servants, NHS workers and teachers, 28 July.308
Member contribution Employer contribution Total
Teachers 6.4 14.1 20.5
NHS 5.5 – 8.5 14 19.5 – 22.5
Civil Service 1.5 – 3.5 19 20.5 – 22.5
Police 9.5 24.2 33.7
PricewaterhouseCoopers has estimated that private sector workers would have to contribute between 15 per cent and 40 per cent of earnings into defined contribution plans to get equivalent benefits as those in the public sector.309
Note: A comprehensive table of proposed changes to public sector pension contribution rates, by job role and salary, can be found in Annex Three of this report.
Public sector job losses are manageableIn June 2010 the Office for Budget Responsibility (OBR) forecast 490,000 job losses by 2015 and 610,000 by 2016. This figure for 2015 was later revised down to 330,000. In their March 2011 forecast the OBR forecast a reduction in general government employment of around 310,000 between 2011 and 2015. The OBR also forecast a further reduction of 90,000 by 2016, bringing the total decline over five years to around 400,000.310
The change in the OBR forecasts was due to the Government putting more emphasis on benefit cuts and less on departmental spending cuts than it had expected at the time of the OBR’s earliest forecasts. The most recent revision, for example, reflects changes to current expenditure that reduce the implied reduction in
305 Independent Public Sector Pensions Commission (2011), Final Report.306 For example, Mulholland, H. (2011), “Hundreds of thousands of public sector workers strike”, The Guardian, 30 June.307 HM Treasury, Government consultation on proposed pension contribution changes for civil servants, NHS workers and teachers, Press
release, 28 July 2011. 308 Ibid. 309 PricewaterhouseCoopers (2011), Public Sector Pension Negotiations – PwC comment, Press release, 29 June. Packman, M.: “Overall public
sector pensions are a good deal for those who benefit from them. Private sector workers would have to pay anything from 15 per cent to 40 per cent of their pay into defined contribution plan to get equivalent benefits, depending on the scheme and their age.”
310 Office for Budget Responsibility (2011), Economic and fiscal outlook: March 2011, p. 74.
51
Reformers and wreckersPolicy debate
general government employment by around 30,000. This is partly offset by the effect of the ONS upward revision to the level of general employment, which increases the absolute reduction in general government employment between 2010-11 and 2014-15 by around 10,000.311
As the Charted Institute of Personnel Development has noted, although undoubtedly significant for the individuals directly affected, job losses on this scale are unlikely to have a major impact on the UK labour market overall. The key is the various ways in which reductions are being undertaken (such as through compulsory or voluntary redundancies, recruitment freezes or natural turnover).312
To illustrate the effect of reducing public sector employment by 400,000, Reform modelled how long it would take to reduce headcount under a range of scenarios for natural wastage (people retiring or leaving jobs voluntarily) and for not replacing them when they leave. This shows that, with a total public sector workforce of 5.67 million, reducing headcount by 400,000 can be achieved solely by turnover (of 13.7 per cent):313
> In 1 year and 1 month by not replacing 2 out of 4 people who leave.
> In 2 years and 2 months by not replacing 1 out of 4 people who leave.
> In 2 years and 8 months by not replacing 1 out of 5 people who leave.
> In 5 years by not replacing just below 11 per cent of people who leave.
To further put these figures in context, using firm-level data from the Interdepartmental Business Register (IDBR), Hijzen et al. (2007) estimated that, based on data from 1997 to 2005, 2.76 million private sector jobs were created in a year (53,000 a week) and 2.66 million jobs were destroyed (51,000 a week).314 The loss of public sector jobs is thus equivalent to around 8 weeks of job losses in the private sector.
Government policy - reformers or wreckers?So far the Government has sent mixed messages with its policies for the public sector workforce. These policies comprise measures that cover all of the public sector (such as pay and public sector pensions) and measures specific to each service (typically pay negotiations and training and development arrangements). The full set of Government measures (legislation, regulation and consultations) is set out in Annex One.
What these measures reveal is that the Government has set out some policies directly in line with the best practice set out in this report. These are:
> The removal of the requirement to follow national terms and conditions from teachers in academies and free schools. This will support the efforts of those headteachers who seek to improve the quality of their school.
> The removal of the national pay bargaining framework for support staff in all state schools.
> The launch of the Winsor Review into the terms and conditions of police officers, due to report in January 2012. This review has the breadth and genuine independence to increase the flexibility of the police workforce.
> The reforms to public sector pensions, which will make them affordable by increasing the level of employee contribution.
> On the part of some Ministers, in particular at the Home Office, the argument that public service performance does not depend on the numbers of staff employed.
These policies, taken together, point towards a higher productivity public sector. They provide great support for the excellent UK managers described in the first chapter.
311 Office for Budget Responsibility (2011), Economic and fiscal outlook: March 2011, p. 74.312 Personnel Today (2011), “CIPD calls for audit of public sector job cuts”, 13 April.313 Chartered Institute for Personnel and Development (2007), Annual survey report: Recruitment, retention and turnover, Chartered Institute for
Personnel Development, p. 29. The average turnover for public services was 13.7 per cent and for all organisations was 18.1 per cent. Reasons for turnover are identified as redundancies, dismissed, fixed/short-term contracts, retired and voluntary. The majority of turnover is voluntary (7.8 of 13.7 per cent for public services and 11.5 of 18.1 per cent of all). Of turnover in public services, the rates are highest for health (17.2 per cent), local government (13.7 per cent), education (13.1 per cent), other public services (11.6 per cent) and central government (6.2 per cent).
314 Hijzen, A., Upward, R. and Wright, P. (2007), Job creation, job destruction and the role of small firms: firm-level evidence for the UK.
52
Reformers and wreckersPolicy debate
But they are not the whole picture, since on balance more of the Government’s policies remain true to the old-fashioned approach. These include
> The criticism in reductions in “front line” jobs and, by implication, a better workforce mix. Even the Prime Minister has made this case.
> A freeze in public sector pay for workers earning above £21,500 per year. This does not differentiate between higher and lower productivity workers.
> The policy to prevent public sector workers earning more than the Prime Minister, regardless of performance.
> The failure to extend flexibility of employment from academies and free schools into other parts of the public sector. In particular, the Department for Education has retained the pay and performance management arrangements for the 90 per cent of teachers in other schools. The Department for Health has left in place the existing pay contracts for GPs, hospital consultants and other NHS staff.
> The retention of centrally planned training arrangements in the schools and health workforces.
> The retreat on private sector involvement in the National Health Service. Over time, greater private sector involvement would increase the variability of terms and conditions in the public service workforce.
Like the TUC recommendations, these policies point towards a lower productivity public sector. Indeed, some of the recommendations, such as the ban on high public sector pay, have been supported by some trade unions.
Public sector payThe Government is far from accepting the principle that public sector pay should be linked to performance. In the Emergency Budget in June 2010, the Government implemented a two-year pay freeze for all workers earning above £21,000.315 This decision was understandable as a means to control public spending but it was nevertheless inconsistent with the principle of linking pay and performance.
More importantly, the Government has put forward the idea that, in practice, no public servant should be paid more than the Prime Minister. The Coalition Agreement says: “We will require anyone paid more than the Prime Minister in the centrally funded public sector to have their salary signed off by the Treasury.”316 In October 2010, the Secretary of State for Communities and Local Government, Eric Pickles, called on council leaders paid more than £150,000 to take a reduction in pay and said that no new council chief executive should receive a salary greater than the Prime Minister’s.317
Ministers are right to be concerned about a lack of accountability for pay at the senior levels of public services. One of the key arguments for greater accountability of public services is to create a new focus on value for money, including salaries. But true value for money means a focus on productivity and performance. Given the size of public services, and the extent of the fiscal challenge, outstanding performance could lead to reward above the level of the Prime Minister.
For example, the National Health Service in London has a budget of well over £10 billion per year. Its current efficiency challenge, set by Government, is to generate around 5 per cent of savings per year, i.e., at least £500 million per year. Its true efficiency challenge is likely to be even greater. Leadership will be critical and London should be aiming to recruit a small team of leaders from the global labour market in order to meet this challenge. If they were to succeed, salaries of even £500,000 a year would be negligible compared to the increase in value for the London taxpayer.
315 HM Treasury (2010), Budget 2010, p. 17. 316 HM Government (2010), Our programme for government, pp. 20-21.317 Pickles, E. (2010), speech to the Conservative Party conference. “So I say to my many chums who are Council Chief Execs... ... it’s your turn
now. Trust me, you will feel better for it – you’ll be able to look your council workers in the eye. I want to be helpful - so here’s a suggestion. If you’re on a salary of £150,000, you can afford to take a 5 per cent pay cut. Likewise, to all those on £200,000, you can afford a ten per cent cut. And no new council chief execs should be appointed on a salary greater than the Prime Minister’s.”
53
Reformers and wreckersPolicy debate
HeadcountThe Home Office is an example of a Department which has argued that the effectiveness of the workforce (in this case, policing) does not depend on numbers alone.318 In August 2011, the Mayor of London, Boris Johnson, has warned about reductions in police numbers for example, following the riots in English cities in August 2011.319 In response, the Home Secretary argued that the test of effectiveness is the number of officers able to be deployed at a given moment rather than the overall number of officers employed.320
Against that, the Department of Health has argued that there should be no reductions in the “front line” medical workforce at all. It has praised an increase in the number of doctors and a reduction in the number of managers with no reference to the actual outcomes achieved by these positions.321
Ministers from the Prime Minister downwards have argued that the “front line” of public services should not be reduced. As explained in the previous chapter, this runs the risk of preventing the better workforce mix that is such an important feature of the case studies. The exchange at Prime Minister’s Questions on 30 March 2011 is instructive:
Edward Miliband: “May I ask the Prime Minister whether there will be fewer front-line police officers in the years ahead?
The Prime Minister: According to Home Office statistics, if all forces achieve the current best average for visibility and availability, it would increase the number of officers available by 8,000.
Edward Miliband: …. I do not think that people will understand what that answer was supposed to mean. The Prime Minister should listen to the Chief Inspector of Lancashire police: ‘We cannot leave the front line untouched’. That is because of the scale of the cuts. Two thousand police officers are being forced out under the A19 rules. Sergeant Dave Hewitt: ‘I will be walking away from the force, unfortunately not through choice… As far as I’m concerned I’m still young and I wanted to continue being a neighbourhood sergeant.’ That sounds like a front-line police officer to me. May I ask the Prime Minister the same question? Does he expect there to be fewer front-line police officers in the years ahead? Yes or no?
The Prime Minister: There is no reason for there to be fewer front-line officers.”322
WhitehallThe reform of the public service workforce s poses a management challenge to Whitehall as much as to public services. As previous Reform reports have shown, Whitehall departments are prey to the same kind of old-fashioned employment culture as actual services.323 This will make it harder for officials to give Ministers the right advice on successful workforce reform. A successful reform programme would be able to draw on a wider range of skills than Whitehall officials themselves.
For this reason, the decision to ban the use of external consultants from Whitehall departments is an own goal. In August 2011, the Cabinet Office claimed that the ban of the use of consultants had saved £870 million.324 But it did not assess the loss of value from the lost advice. For example, external advice may have helped to forestall the uncertainties, retreats and delays over NHS reform. Those uncertainties, which still bedevil the Health and Social Care Bill, will make the NHS miss its target of £5 billion of efficiency savings in the financial year 2011-12 and will undermine the NHS effort in future years.
318 Hansard (2010), Police funding, Column 365, 8 December. Herbert, N.: “What we should be concerned about is how officers are deployed, whether they are available and visible to the public, whether they are there on the streets when the public want them. Therefore what matters is not the total size of the police workforce but the efficiency and effectiveness of deployment, how much bureaucracy is tying them up”; May, T. (2010), Speech to Superintendents’ Association Conference, 15 September: “As any experienced senior police officer will confirm, the effectiveness of a police force depends not primarily on the absolute number of police officers in the force but the way those officers are used. We all know that in policing, as in every other walk of life, the key to success is good management and leadership.”
319 Johnson, B. (2011), Today, BBC Radio 4, 10 August: “If you ask me if I think there is a case for cutting police budgets in light of these events then my answer to that would be no - I think that case was always pretty frail and it has been substantially weakened. This is not a time to think about making substantial cuts in police numbers.”
320 May, T. (2011) ‘Speech on police reform’, Reform, 16 August: “What matters is not the total number of officers employed, but the total number of officers deployed, and how effectively they are deployed.”
321 See for example the leaflet produced by No 10 Downing Street and the Department of Health at the time of the launch of the “listening exercise.” Since May 2010, the NHS has gained 2,500 more doctors and has 3,000 fewer managers.” http://www.dh.gov.uk/prod_consum_dh/groups/dh_digitalassets/documents/digitalasset/dh_125855.pdf
322 Hansard (2011), Column 335, 30 March.323 Haldenby, A. et al (2009), Fit for purpose. “The reasons for this are entrenched – the culture and structure of Whitehall rewards risk avoidance
and punishes innovation. One public sector consultant interviewed for this report said that the motto of the Civil Service should be ‘consent and evade’; others spoke of an absence of ‘moral courage’. Whitehall is not accountable – success or failure seems to have little or no consequence for departments. It displays inadequate performance management. It is weak at implementation.”
324 Cabinet Office (2011), news release, “Francis Maude reveals £3.75 billion in savings.” 1 August.
54
Reformers and wreckersPolicy debate
Policing The Winsor Review of Remuneration and Conditions for Officers and Staff, due to report in January 2012, is the only independent review of an individual workforce commissioned by the Government. It is a necessary step which follows two decades’ worth of attempts to reform the way in which the service is structured and managed.325 As HMIC’s 2004 report, Modernising the police service, put it: “A tightly regulated employment framework that sets remuneration only by hours of labour and years of service rather than by level of skill required or complexity of responsibility is surely no longer fit for purpose and needs to be reviewed.”326 This point has been echoed by the Association of Chief Police Officers, who argued in 2005 that “the police workforce is in many ways obsolete with inefficient and restrictive practices causing waste and suppressing latent capacity.”327
The Winsor Review could deliver a real increase in chief constables’ freedom to structure the workforce appropriately. The recommendations in the next chapter include the Reform think tank’s submission to the second stage of the review.
HealthcareIn December 2010, the Government published a new “strategy” for the NHS workforce. It calls for “sector-wide oversight of key aspects of workforce planning, education and training” and “mechanisms that allow the NHS Commissioning Board to have strategic influence on the national picture for education and training.”328 A new organisation, Health Education England, will set the national strategy for workforce development in the NHS. The “listening exercise” into the Government’s NHS reforms led to a strengthening of the Government’s desire to centralise decision-making:
“We will also emphasise the importance of the right investment in education and training to ensure that we develop the right values, behaviours and team-working to provide person-centred care …. Many have called for education and training funding to be protected. We agree, so we will establish transparent systems to make sure that organisations in receipt of education and training money are held to account for using it for the education and training of the NHS workforce.” 329
In July, the legal firm Capsticks reported that various elements of NHS employment regulation were preventing NHS organisations achieving value for money:
“NHS bodies have fed back to us that there are a range of factors preventing them from realising workforce savings as quickly as planned, including
> Lack of management capacity / will to drive forward major organisational change
> The cost of NHS redundancy payments
> Statutory consultation requirements and the timetable for collective consultation and issuing of notice
> Overly generous and inflexible nationally agreed terms and conditions
> Staff side opposition.”330
325 The 1993 Sheehy Report, commissioned in 1992 by the then Home Secretary Kenneth Clarke, recognised inflexibility as a key issue within the police service and proposed radical solutions including fixed-term contracts for officers and performance-related pay to replace promotion by length of service, the abolition of several police ranks, and tighter controls on medical retirement. The 2001 Policing White Paper, Policing a new century, once again attempted to introduce greater flexibility into policing, arguing that “a new framework covering police pay and conditions of service could, with the reform of the current system of regulations, result in a better, fairer, more flexible system for deploying and rewarding police officers.” In 2008, the review of police force modernisation published by the Institute for Public Policy Research, again found considerable evidence of inflexibility in that public service.
326 Her Majesty’s Inspectorate of Constabulary (2004), Modernising the police service: A thematic inspection of workforce modernisation – The role, management and deployment of police staff in the Police Service of England and Wales.
327 Association of Chief Police Officers (2005), Draft ACPO vision for workforce modernisation: The missing component of police reform, 12 October.
328 Department of Health (2011), Health and Social Care Bill 2011.329 Department of Health (2011), Liberating the NHS: Developing the Healthcare Workforce – Summary of consultation responses; Department
of Health (2011), Government response to the NHS Future Forum.330 Capsticks (2011), Liberating the NHS Workforce?, July.
55
Reformers and wreckersPolicy debate
EducationThe Government’s policy on the schools workforce is extremely inconsistent:
> It has abolished regulations on teachers’ pay and conditions for academies and free schools, while maintaining them for other state schools. 331
> It has abolished the national pay bargaining arrangements for support staff while keeping them for the teaching workforce.332
> It might be argued that the deregulations point the way to further deregulation in due course. But equally they may represent “halfway house reforms”, i.e. worthwhile reforms which do not build a critical mass of support because they apply only to a minority of providers. The existing regulations, based on the 2003 National Agreement, “Raising Standards and Tackling Workload”, reduce flexibility for heads and are costly.333 For example, the agreement contracts full time classroom teachers to 1,265 hours of directed time per year, spread over a maximum of 195 days, 190 of which are pupil contact days. This limits the flexibility of schools to introduce longer days or shorter holidays over the academic year, as some free schools and academies have done.334 The agreement also set out that at least ten per cent of teachers’ contact hours must be allocated to be spent away from the classroom for Planning Preparation and Assessment.
> On performance management and teacher standards, the Government has sought to improve the existing structure of regulation in such a way as to spread the best practice of schools such as Denbigh High School. But the key lesson of Denbigh High School, and other excellent schools, is that these decisions have to be taken at the school level. The Government’s regulatory framework still contradicts that position.
> Similarly, the Government has abolished regulatory agencies such as the Training and Development Agency for Schools and the General Teaching Council for England. It is, however, introducing a new agency, the Teaching Agency, in April 2012 with many of the same functions and responsibilities in practice.335
Local governmentIn local government, the Government has revoked Best Value statutory guidance on workforce matters previously set by central government. This includes the “Two-Tier Code”, the 2003 provision that required contractors employing new staff to do so under terms that were “overall no less favourable” than those of the staff transferred under TUPE from a local authority.336 This should deliver greater much-needed flexibility for the commissioning of services from third-party providers.
However, the local government workforce continues to be set by the Green Book, known as the Single Status Agreement, a national agreement covering pay and conditions for local authority employees, and also used to determine pay and conditions for non-local authority staff.337 This does allow for some local variation in workforce conditions, but remains the main basis for wage determination in the sector.338
The Local Government Workforce Strategy is wholly owned and driven by the local government sector itself. Since the introduction of the first Strategy in 2003, there has been progress towards making the workforce more flexible and strategically managed workforce. In particular, the Local Government Workforce Strategy has successfully encouraged councils to look more critically at their workforce, and identify skills shortages, retention and recruitment issues and leadership development, with 66 per cent of authorities identifying critical workforce issues across the council, and 48 per cent taking action to address such issues.339
331 School Teachers’ Pay and Conditions Order 2011.332 BBC News (2010), “School support staff pay body abolished”, 28 October.333 Department for Education and Skills (2003), Raising standards and tackling workload: a national agreement.334 For example see David Young Community Academy in Leeds, which has longer school days and longer terms.335 Training and Development Agency for Schools (2011). http://www.tda.gov.uk/about/latest-announcements/dfe-announces-teaching-agency.
aspx Accessed 31 August 2011. “The Teaching Agency is a new executive agency that will be responsible for ensuring the supply of high quality teachers and training, and for
teacher regulation. It will be operational from April 2012 and, subject to getting all necessary approvals, including Parliamentary approval of related legislation, will take on some key functions currently carried out by the Training and Development Agency for Schools (TDA), General Teaching Council for England (GTCE), Children’s Workforce Development Council (CWDC) and the Qualifications and Curriculum Development Agency (QCDA).
Subject to Parliamentary approval of related legislation, the Agency will be responsible for three key areas of delivery: •Supplyand,withothers,retentionoftheworkforce •Thequalityoftheworkforce •Regulationofteacherconduct.”336 Pickles, E. (2011), Statement on Open public services, 23 March.337 Local Government Employers (2010), Green book: National agreement on pay and conditions of service for local government services.338 Wolf, A. (2010), More than we bargained for: The social and economic effects of national wage bargaining, CentreForum.339 Local Government Association (2010), Delivering through people: Local Government Workforce Strategy 2010.
56
Reformers and wreckersA high productivity policy sector – recommendations
4A high productivity policy sector – recommendations
The goal of policy should be a high productivity public sector. A high productivity public sector would deliver greater value to taxpayers and would justify higher wages for public sector workers. Yet the idea of a high productivity public sector poses real challenges to policy makers at present.
The agenda for the TUC conference shows that the leaders of the trade union movement actually favour a low productivity public sector. Its recommendation of wider national bargaining would reduce the ability of managers to link pay and performance. Its recommendation of a toleration of sickness absence would reduce the output of the public sector and increase management costs. Its vision is of a high wage, low productivity public sector. This is not sustainable for the country and not satisfying for public sector workers, as the statistics in the second chapter show. The Government should reject these recommendations.
Government policy is inconsistent. Some measures, such as the greater flexibility in employment in academies and free schools and indeed the general idea of “open public services”, point towards a high productivity public sector. Other measures, such as the new national organisations for training in health and education and the ban on high public sector pay regardless of performance, point towards a low productivity public sector just as do the TUC recommendations. This inconsistency is a problem because a national lead for change gives much-needed support to reform-minded public sector managers.
Recommendations for change are set out below, with specific discussion for each of the key public services.
HeadcountAll of Government needs to adopt the Home Office’s argument that the quality of service is not determined by the number of public servants employed.
Even the Home Office needs to accept that “front line” public servants cannot be sacrosanct given that they are the main drivers of costs and performance. The case studies in this report show that successful reformers need the ability to create a better workforce mix.
In time, the headcount of public services should be determined by their productivity and accountability. The Minister’s role is then to improve the accountability of services, including the introduction of competition. It is not to make national judgements on public service headcount.
PayThe Government’s wish to restrain public sector pay is understandable given the position of public finances. Nevertheless the ban on salaries above the level of the Prime Minister’s salary is a terrible brake on the public sector’s ability to recruit, retain and motivate talented leaders. It is entirely contradictory to the goal of a high productivity public sector because the transformation of public services will need committed leaders with reasonable salaries.
Performance related pay, which rewards employees not for length of stay but for the quality and efficiency of their work, establishes the correct principles of remuneration and is a powerful driver of workforce productivity.
57
Reformers and wreckersA high productivity policy sector – recommendations
FlexibilityThe Government’s policies on training and development contradict its ambitions for “open” public services. The Open Public Services White Paper, published in July 2011, offers a vision of decentralised services run locally, as its principles make clear:
> “Wherever possible we will increase choice.
> Public services should be decentralised to the lowest appropriate level.
> Public services should be open to a range of providers.
> We will ensure fair access to public services.
> Public services should be accountable to users and to taxpayers.” 340
Given this, the Government’s decision to keep national organisations for training and development in health and education is difficult to understand. Equally, it is impossible to explain why the Government should want to remove regulations on pay and conditions for teachers in academies and free schools but retain
them for the great majority of English state schools.
To make sense of the policy of “open” public services, the Government should:
> end national planning and training arrangements in schools (which will otherwise be implemented by the new Teaching Agency).
> end national planning and training arrangements in the NHS (which will otherwise be implemented by the new organisation Health Education England).
> reverse the new policy that NHS organisations should be accountable to the Department of Health for their spending on training and development.
> abolish the School Teachers’ Review Body, in line with the previous abolition of the School Support Staff Negotiating Body.
> abolish the national contracts of employment for hospital doctors, GPs and other staff in the NHS, in line with the removal of employment regulation for academies and free schools.
WhitehallThe Government should reverse its decision to ban government departments from taking consultancy advice. It is an own goal to restrict the pool of skills available to Ministers as they face the considerable challenge of reforming public services. The challenge posed by external advice will drive better advice from officials as well as being of value in itself.
NHSThe key recommendations for the National Health Service include:
> Competition. Opening up the NHS to competition has reduced waiting times and patient length of stay, improved the quality of management, increased clinical quality and outcomes, and improved efficiency.341 New providers and competitive pressures provide a stimulus for new ways of working and disruptive innovation.342 Requiring an existing provider to allow another provider access to its facilities would encourage change, as would enabling consultants to work freely for other providers of NHS-funded services in their non-contracted hours.343 Independent economic analysis has established that private providers currently have to operate with a cost disadvantage of around 14 per cent relative to public sector providers, largely due to the pensions imbalance.344 Firstly, arrangements should be made for pension “portability” which would enable consultants to retain their pension entitlements while moving into the independent sector. Secondly, public sector bidders
340 Cabinet Office (2011), Open Public Services White Paper.341 OECD (2006),Competition in the provision of hospital services; Cooper, Z. et al (2010), “Does Hospital Competition Improve Efficiency? An
Analysis on the Recent Market-Based Reforms to the English NHS”, Centre for Economic Performance, Discussion Paper No.988; Cooper, Z. et al (2010), “Does Hospital Competition Save Lives? Evidence from the English NHS Patient Choice Reforms”, LSE Health Working Paper No: 16/2010; Gaynor. M. et al (2010), “Death by Market Power: Reform, Competition and Patient Outcomes in the National Health Service”, July, NBER Working Paper No.16164; Dash, P. and D. Meredith (2010), “When and how provider competition can improve health care delivery”, Mckinsey Quarterly.
342 Christensen, C. et al (2008), The Innovators Prescription: a disruptive solution to health care.343 See, Co-operation and Competition Panel (2009), Study of restrictions on consultants in relation to NHS work during non-contracted hours,
and Department of Health (2011), Government response to the NHS Future Forum. 344 Office of Health Economics (2009), How fair? Competition between independent and NHS providers to supply non-emergency hospital care
to NHS patients in England.
58
Reformers and wreckersA high productivity policy sector – recommendations
should be assessed on their full costs to the taxpayer (a substantial part of the pension costs are carried by central government not by NHS provider organisations themselves, which puts the public sector at a competitive advantage over the independent sector when tendering for contracts). This could be done by increasing the percentage of pension costs which they bear directly or by applying a “shadow” weighting factor.345
> Redesign. Too much healthcare continues to be delivered in high cost, inflexible business models such as hospitals.346 This limits the effect of new technologies and new types of clinicians. Moving care out into the community and developing new business models to meet the new healthcare needs will enable the medical workforce to be restructured and the development of more responsive and flexible clinical teams.347 To realise meaningful savings, excess capacity needs to be taken out (i.e. departments and hospitals need to close). This will require the development and implementation of a failure regime (an independent legal and financial regulatory framework).
> Reform pay. NHS consultants and GPs are among the best paid in the world, yet productivity, quality and responsiveness vary significantly.348 National contracts make it impossible to innovate with performance related pay, while merit awards and incentives in the Quality and Outcomes Framework have demonstrated very poor value for money.349
> Make clinicians financially accountable. Clinicians are responsible for using medical resources, but rarely accountable for the costs of delivery. Some Foundation Trusts have developed Service Line Management and Patient Level Costing but there is still significant variation in health spending on similar procedures.350 Few NHS organisations have the capability or will to effectively performance manage medical staff, while clinical governance remains informally managed through peer review. Rather than “managing experts” NHS leaders need to performance manage the productivity of clinicians, this should be reflected in contracts and pay.
> Use existing flexibilities. NHS Trusts, PCTs and Foundation Trusts are free to depart from Agenda for Change. However so far only Southend Foundation Trust has developed alternative terms and conditions. NHS employers should therefore move away from certain elements of Agenda for Change to innovate with pay and terms and conditions to improve productivity.351 Incentivising high performance through bonuses and other reward schemes, and managing under-performance, including sacking doctors and nurses (at present usually only exercised for misconduct or negligence, rather than poor performance) would drive improvements in workforce quality and productivity.
School educationThe key recommendations for state schools include the reform of pay and of performance management.
Through expansion of the academies programme and the abolition of the School Support Staff Negotiating Body, the Government has deregulated pay and conditions for some schools and for some staff. Yet national terms and conditions still exist for over 95 per cent of schools352 and for 80 per cent of the school workforce.353 The Government should abolish the School Teachers’ Review Body and give all schools autonomy to set pay and conditions for all staff.
Despite the fact that there is substantial variation between the quality and performance of teachers, even within individual schools, central pay bargaining hampers headteachers’ ability to reward staff according to their performance, not their length of service, and makes it difficult to hold staff to account for poor performance. The opponents of performance-related reward in education argue that fixed teaching budgets are inherently unfair, as a bonus for one staff member necessarily entails concessions elsewhere.
345 NHS Confederation (2010), Harnessing the benefits of the independent sector: priorities for the next government. 346 Bosanquet, N. et al (2010), Fewer hospitals, more competition, Reform. 347 Reform (2011), A lot more for a lot less: Disruptive innovation in healthcare.348 OECD (2010), Health Care Systems: Efficiency and Policy Settings. 349 National Audit Office (2007), Pay Modernisation: A new contract for NHS consultants in England : “the contract is not yet delivering the full
value for money to the NHS and patients that was expected from it… Some consultants are actually working the same if not fewer hours for more money… There is little evidence that ways of working have been changed as a result of the new contract and, although most consultants now have job plans, few trusts have used job planning as a lever for improving participation or productivity”; National Audit Office (2008), NHS Pay Modernisation: New contracts for general practice services in England; Dixon, A. et al (2011), The Quality and Outcomes Framework (QOF): does it reduce health inequalities?, The King’s Fund.
350 Monitor (2009), Service-line management: An Overview.351 Capsticks (2010), Achieving workforce savings.352 The latest figures from the Department for Education show that 801 schools have achieved academy status under this Government, in addition
to 203 under the previous government. In total, this amounts to just under 5 per cent of the 22,092 state schools in England. Department for Education (2011), Press release: Four academies opening every day, 12 July; Department for Education (2011), Schools, pupils and their characteristics, 22 June.
353 School support staff account for just 20 per cent of the workforce.
59
Reformers and wreckersA high productivity policy sector – recommendations
In fact, a number of models exist that effectively incentivise performance through wages. For instance, in the Swedish education system there are no incremental pay scales and salaries are determined through a decentralised individual pay scheme, in direct negotiation with the school Principal. Every few years, teacher unions negotiate a pay rise with the local municipality, which is handed out to Principals to deal out to staff according to performance, with the most effective staff achieving the biggest salary increase, and poor performers the lowest. Principals use a set of lesson observation criteria and extra commitments to determine which staff receive the highest pay rise.354
Effective performance management can be an essential tool in improving teachers’ performance and is an important prerequisite for the development of performance-related pay. As previous Reform research has demonstrated, the current prescribed standards on which many schools’ performance management regimes are based are too vague, are “tick-box” in nature, and focus insufficiently on the key issue of teaching quality.355
The Government has rightly adopted clearer standards of competence and conduct for teachers356 and committed to simpler performance management and capability procedures to give headteachers more flexibility and power.357 However, this does not represent the fundamental shift in the responsibility for teaching performance from government to schools. The remaining government interventions into the cost and size of the teaching workforce should be removed. Heads should have the freedom to set the right balance between pay, staff numbers and quality, and should be able to demand even greater professionalism from their staff, rewarding them as appropriate.
PoliceThe following text comprises the Reform think tank’s submission to the second stage of the Independent Review of Police Officers’ & Staff Remuneration and Conditions (the “Winsor Review”).
The call for evidence for the second stage asks for evidence on basic pay, contribution-related and role based pay, entry routes for officers, officer career length and pension age and pay negotiating machinery. Reform’s submission begins with two general points.
GeneralPolicing is the most labour intensive public service, with personnel costs amounting to at least 75 per cent of the total. It follows that excellent workforce management should be an even higher priority in policing than in the other public services. The model for police forces should be the most productive organisations in the private sector and public sector rather than the current public sector norm. The case studies in the first part of this report show what can be done.
The examples in chapter two make clear the importance of professional human resource management. If police forces find the task of updating their workforces difficult, there is a strong argument for outsourcing their human resource functions, on the model of the armed forces.
Basic pay, contribution-related and role based paySenior police officers should have the flexibility to pay their staff according to the role they are performing, their value (determined by a range of factors including experience, skills and commitment) and how well they perform, taking local factors (such as cost of living) into account. Senior officers should be able to change pay to reflect changes in duty (for example, a shift to restricted duty) if they wish. Civilian police staff pay should also be determined by local managers, who should have the freedom to take into consideration the relationship between the pay of their officers and civilian staff. In practice this means the abolition of national pay scales.
The definition of “performance” should ultimately be left to senior officers within each force. Experience from other sectors shows that when organisations determine their own criteria for good performance these are more likely to reflect the specific needs of that organisation, more likely to be viewed positively by staff and more likely to be rigorously assessed and used to hold staff to account.358 Senior officers may well want to impose more rigorous and quantifiable performance measurement than currently. For example, it makes little sense for police officers to undergo a fitness test on recruitment but not again during their
354 Strath, A., Teacher Policy Reforms in Sweden: The Case for Individualised Pay, International Institute for Educational Planning, UNESCO.355 Bassett, D.(2010), Every teacher matters, Reform.356 Department for Education (2011), New standards raise the bar for teachers, Updated 14 July.357 Department for Education (2011), Schools to get more powers to manage teachers, Updated 8 June.358 Bassett, D. et al. (2010), Every teacher matters, Reform.
60
Reformers and wreckersA high productivity policy sector – recommendations
employment. Given the importance of physical fitness to police officers, senior officers may wish to introduce a six-monthly or annual fitness check.
Senior officers should have the flexibility to vary officer and staff pay according to individuals’ performance against these criteria. Police and Crime Commissioners should have the flexibility to set their Chief Constables’ pay, including a performance element.
There are occasions when overtime for police officers and staff could be appropriate and managers should retain the flexibility to pay this at their discretion. However, the basic and fundamental role of many police officers and staff necessitates significant working outside of normal “office” hours. It is therefore appropriate for their contracts to include a significant number of anti-social hours as part of their basic contract and pay. Managers should of course take this into account when determining the basic pay of officers and staff to whom this applies.
Entry routes for officers The evidence in chapter two of this report showed that the public sector lags behind the private sector in its use of fixed term contracts (for the police service, short term “commissions”). Within the public sector, the police service actually has the longest average length of service upon retirement. One of the key reasons for the greater productivity of the private sector is the ability to bring in staff members, in particular senior officers.
The police service should use fixed term contracts and direct entry just as the private sector does. Many of the barriers to this are cultural. The recent debate over the putative appointment of the former chief of the Los Angeles and New York police departments as Commissioner of the Metropolitan Police epitomised the cultural conservatism that pervades many public services. Despite differences between policing in the US and in England and Wales, it is absurd to argue that Bill Bratton is so unqualified for the role that he should be barred even from applying. It has also been argued, for example, that military officers leaving the armed forces may be well-equipped to take senior jobs in policing.359
The right approach would be for suitably qualified individuals to be allowed to apply; managers (or Police and Crime Commissioners) should then simply pick the best person for the job. In teaching, as explained in chapter two, the Government is establishing “conversion” programmes to allow people from other professions to make a transition.360
Officer career length and pension age The same arguments apply to career length. The police service is jeopardising its own quality by making it difficult for excellent people to enter and leave policing more flexibly. As shown earlier, greater use of fixed term contracts can improve the flexibility and responsiveness of public services. This is particularly important as policing is subject to such great, variable and ever-increasing demands. Police forces should make much greater use of shorter commissions.
It is very likely that the greater use of shorter term commissions will change the culture of police employment for the better. A culture of “jobs for life” can easily turn to a culture where progression is based on time served rather than performance. This can in turn lead to a culture of cynicism, in which good performance is not rewarded nor bad performance questioned. This is the prevailing culture of public sector employment as shown in chapter two. A culture of shorter commissions would challenge such a culture by clarifying the link between pay and performance.
Equally senior officers should be able to make officers redundant on a compulsory basis. Police forces are no different from any other workforce in that certain functions become irrelevant or unaffordable. The current arrangements are certainly damaging for the police in that they give a bias to certain types of employment. Because senior officers can make staff redundant but not officers, they are responding to tighter budgets by disproportionate cuts in staff numbers. This prevents the kind of modern workforce mix that is seen in the case studies in chapter one.
359 Ruffley, D. (2011), “Three steps that will transform our police”, The Daily Telegraph, 12 August. “As a result of the defence cuts, many officers are leaving the Armed Forces. They have commanded men in life-and-death situations, often with limited resources. Why shouldn’t they enter the upper echelons of the police service? Back in the 1980s, Margaret Thatcher flirted with this idea, but was eventually persuaded that ‘Army types’ would alienate existing policemen, and had no experience of policing by consent. Try saying the same of today’s officers, who have secured the streets of Ulster and the bazaars of Afghanistan and Iraq.”
360 Department for Education (2010), The Importance of Teaching: The Schools White Paper 2010. The Government is developing “Teach Next” and “Troops to Teachers” programmes to allow senior professionals and ex-servicemen respectively to enter teaching.
61
Reformers and wreckersA high productivity policy sector – recommendations
Some may argue that shorter commissions jeopardise the fundamental idea that a constable should be independent and answerable to the law, rather than to his superiors. That is untrue because that independence actually means freedom from the executive branch of government rather than from management from senior officers. Lord Dennings’ frequently quoted definition of police independence makes clear that senior police officers must be able to “post their men”, i.e. manage them, in order to detect crime and secure order. 361 It seems implausible that constables’ independence would be compromised by the need to gain their seniors’ approval, for example to secure an extension of their commission: military policeman and special constables are frequently commissioned for shorter periods without compromising their integrity or operational performance. Many people employed more flexibly in public services – such as military officers on short commissions, agency nurses and retained firefighters – do extraordinary things in the line of duty without hesitation. It is unlikely that a police officer on a short commission faced with an incident requiring a response would stop to consider the impact on their promotion prospects before acting.
The police service also suffers from too many experienced officers who would like to retire remaining in the service (at great cost to the public purse) solely to realise their full pension entitlement.362 Officers’ pensions should be reformed to remove the financial penalty for early retirement.
Pay negotiating machineryThe national apparatus of pay negotiation is redundant given the changes above. Police forces should follow the model of academies and free schools, and take the opportunity to negotiate terms and conditions locally and individually.
361 Police Federation (2008), The Office of Constable. The document quotes R v. Metropolitan Police Commissioner ex parte Blackburn at 769.362 Winsor, T. (2011), Independent Review of Police Officer and Staff Remuneration and Conditions: Part 1 Report.
62
Reformers and wreckersReferences
References
Andrews, G. and J. de Raad (2009), The unemployment challenge, NZIER Working Paper 2009/02.
Association of Chief Police Officers (2005), Draft ACPO vision for workforce modernisation: The missing component of police reform.
Audit Commission (2004), Inspection report: Human resources, Birmingham City Council.
Audit Commission (2005), Fire and Rescue Comprehensive Performance Assessment: Merseyside Fire and Rescue Authority.
Audit Commission (2007), Seeing the light: Innovation in local public services.
Audit Commission (2008), Tomorrow’s people: Building a local government workforce for the future.
Audit Commission (2008), Fire and Rescue Performance Assessment.
Audit Commission (2009), Merseyside Fire and Rescue Authority: Organisational Assessment.
Audit Commission (2009), Annual Audit and Inspection Letter: Dartford Borough Council, Audit 2007-08.
Audit Commission (2010), Annual Audit Letter: Birmingham City Council 2009/10.
Audit Commission (2010), Developing transformational efficiency in Surrey.
Audit Commission (2011), Value for money in social care.
Audit Commission (2011), Better value for money in schools: An overview of school workforce spending.
Audit Commission, Her Majesty’s Inspectorate of Constabulary, and Wales Audit Office (2010), Sustaining value for money in the police service.
Australian Defence Service (2007), Report of the Defence-Industry Joint Training Task Force.
Baird, A. (2011), Public Service Output, Input and Productivity: Education, Office for National Statistics.
Bassett, D. et al (2009), Back to black, Reform.
Bassett, D. et al (2010), Every teacher matters, Reform.
Bassett, D. et al (2011), 2011 Reform Scorecard, Reform.
BBC News (2010), “Police ‘may force officers to retire to cut costs’”, 4 November.
BBC News (2010), “School support staff pay body abolished”, 28 October.
BBC News (2011), “England riots: Police hit out at ‘supercop’ Bill Bratton plan’”, 14 August.
Beale, E. (2010), “Public sector pay”, Economics in Practice, Scrutiny Unit, Houses of Parliament.
Benson, L. (2005), Delivering the workforce: Evaluation of the introduction of assistant practitioners in 14 pilot sites in Greater Manchester, Third Interim Report, Manchester Business School.
Benson, L. and L. Smith (2006), Delivering the workforce: Evaluation of the introduction of assistant practitioners in seven sites in Greater Manchester, Second Report, Manchester Business School.
Bevan, Y. (2011), How we moved to ‘Outstanding’, Presentation to Association of School and College Leaders.
Birmingham City Council (2008), Report of Cabinet Member for Equalities and Human Resources to the City Council.
Birmingham City Council (2009), Report of Cabinet Member for Equalities and Human Resources to the City Council.
Birmingham City Council (2010), The Annual Report of Cabinet Member for Equalities and Human Resources to the City Council.
63
Reformers and wreckersReferences
Birmingham City Council (2011), Cabinet Member for Equalities and Human Resources to the Equalities and Human Resources Overview and Scrutiny Committee.
Bishop, M. and D. Thompson (1992), “Regulatory reform and productivity growth in the UK’s public utilities”, Applied Economics, Vol. 24.
Blair, T. (2002), Speech to Labour Party Local Government and Women’s Conference in Cardiff, 3 February.
Blair, T. (2007), “What I’ve learned,” The Economist, 31 May.
Bosanquet, N. et al (2010), Fewer hospitals, more competition, Reform.
Brief: The Voice of Greater Manchester Police (2009), “A model approach to policing”, December.
Buck, A. (2009), What makes a great school.
Cameron, D (2011), Speech on NHS Reforms, 16 May.
Campbell, D. (2011), “Diabetics are put at risk as NHS cuts hit specialist nursing post”, The Guardian, 22 May.
Capsticks (2010), Achieving workforce savings.
Capsticks (2011), Liberating the NHS Workforce?
Cawston, T. et al (2011), Old and broke: the long term outlook for the UK’s public finances, Reform.
CBI and Pfizer (2011), Healthy returns? Absence and workplace health survey 2011.
Chartered Institute for Personnel and Development (2007), Annual survey report: Recruitment, retention and turnover.
Chartered Institute for Personnel and Development (2010), Transforming Public Sector Pay and Pensions, June.
Chartered Institute for Personnel and Development (2010), Improving People Management.
Chartered Institute for Personnel and Development (2010), Annual absence management survey 2010.
Chartered Institute for Personnel and Development (2010), Building productive public sector workplaces: Improving people management.
Chartered Institute for Personnel and Development (2011), Employee Outlook: Summer 2011.
Chartered Institute for Personnel and Development (2011), Reward Management 2011.
Chote, R. et al (2010), Public spending under Labour: 2010 Election Briefing Note No. 5, Institute for Fiscal Studies.
Christensen, C., J. Grossman and J. Hwang (2008), The innovator’s prescription: A disruptive solution for healthcare.
Christensen, C., M. Horn, and C. Johnson (2008), Disrupting class: How Disruptive Innovation will change the way the world learns.
Coates, S. et al (2011), First Report of the Independent Review of Teachers’ Standards.
Confederation of British Industry (2011), Thinking positive: The 21st Century employment relationship.
Cooper, Z. et al (2010) “Does Hospital Competition Improve Efficiency? An Analysis on the Recent Market-Based Reforms to the English NHS”, Centre for Economic Performance, CEP Discussion Paper No.988.
Cooper, Z. et al (2010), “Does Hospital Competition Save Lives? Evidence from the English NHS Patient Choice Reforms”, LSE Health Working Paper No: 16/2010.
Co-operation and Competition Panel (2009), Study of restrictions on consultants in relation to NHS work during non-contracted hours.
Cragg Ross Dawson (2010), Financial Efficiency in Schools, Department for Education.
Dash, P. and D. Meredith (2010), “When and how provider competition can improve health care delivery” Mckinsey Quarterly.
64
Reformers and wreckersReferences
Deloitte (2008) Transfusion: Private to Public.
Deloitte (2008), Bold moves: Using human capital to strengthen public-sector performance.
Denbigh High School, Core value statement.
Denbigh High School (2011), Continuing Professional Development and Support.
Department for Communities and Local Government (2009), Local Government Financial Statistics, England, No. 19.
Department for Education and Skills (2003), Raising standards and tackling workload: a national agreement.
Department for Education (2010), The importance of teaching: Schools White Paper.
Department for Education (2010), Performance tables 2010.
Department for Education (2011), School Spending Data: Secondary Schools.
Department for Education (2011), New standards raise the bar for teachers, Updated 14 July.
Department for Education (2011), Four academies opening every school day, Press release, 15 July.
Department for Education (2011), Schools to get more powers to manage teachers, Updated 08 June.
Department for Education (2011), Schools, pupils and their characteristics, June.
Department for Education (2011), Schools, pupils and their characteristics, January.
Department for Education website, Education and skills in your area; Denbigh High School. Accessed 26 August 2011.
Department of Health (2010), Equity and Excellence: Liberating the NHS.
Department of Health (2010), Liberating the NHS: Developing the Healthcare Workforce.
Department of Health (2011), Government response to the NHS Future Forum.
Department of Health (2011), Health and Social Care Bill 2011.
Department of Health (2011), Liberating the NHS: Developing the Healthcare Workforce – Summary of consultation responses.
Department of Health (2011), NHS Payment by Results 2010-11: National Tariff Information.
Department for Work and Pensions (2002), Simplicity, security and choice: Working and saving for retirement.
Denbigh High School (2008), Denbigh Exceeds the Investor in People Standard.
Denbigh High School (2011), Our Vision and Values.
Dixon, A. et al (2011), The Quality and Outcomes Framework (QOF): does it reduce health inequalities?
Downey, A. et al (2010), Payment for success – How to shift power from Whitehall to public service customers, KPMG.
Ewin website (2011), Skill Mix: Reprofiling the North West workforce.
European Association for Cardio Thoracic Surgery (2010), EACTS Adult Cardiac Surgical Database Individual Country Report for England.
Financial Times (2011), “Human cost forgotten in race to invest”, 30 May.
Financial Times (2011), “Southern Cross run on failed business model”, 30 May.
Flanagan, R. (2008), The Review of Policing, Final Report.
Fulton, D. et al (2011), “Health workforce skill mix and task shifting in low income countries: a recent review of evidence”, Human Resources for Health, Vol. 9.
Gaynor. M. et al (2010), “Death by Market Power: Reform, Competition and Patient Outcomes in the National Health Service”, July, NBER Working Paper No.16164.
65
Reformers and wreckersReferences
Gazzard, G. and R. Elek (2010), “Aravind Eye Care System”, presentation to board on 25 November, Moorfields Eye Hospital NHS Foundation Trust.
Gielen, A. et al (2006), Performance related pay and labor productivity, Discussion Paper No. 2211, Forschungsinstitut zur Zukunft der Arbeit Institute for the Study of Labor.
Gomes, P. (2011), “Fiscal policy and the labour market: The effects of public sector employment and wages”, Economic Papers, Directorate-General for Economic and Financial Affairs, European Commission.
Greater Manchester Police Authority (2011), Report of the Chief Constable to the Full Authority Meeting, 11 April 2011: Overview of the Change Portfolio.
Haldenby, A. et al (2009), The front line, Reform.
Haldenby, A., et al (2009), Fit for purpose, Reform.
Hansard (2010), Column 365, 8 December.
Hansard (2011), Column 335, 30 March.
Hardie, M. et al (2011), Public Service Outputs, Inputs and Productivity: Healthcare, Office of National Statistics.
Haskel, J. and Szymanski, S. (1993), The Effects of Privatisation, Restructuring and Competition on Productivity Growth in UK Public Corporations, Department of Economics, Queen Mary and Westfield College, London.
Hay Group (2011), Facing up to the challenge: Developing a new employment offer for the public sector.
Health Service Journal (2010), “NHS: Working smart to improve productivity”, 16 November.
Her Majesty’s Inspectorate of Constabulary (2004), Modernising the police service: A thematic inspection of workforce modernisation – The role, management and deployment of police staff in the Police Service of England and Wales.
Her Majesty’s Inspectorate of Constabulary (2008), Greater Manchester Policing: Neighbourhood Policing, Citizen Focus Policing.
Her Majesty’s Inspectorate of Constabulary (2010), Police Authority Inspection Report: Surrey Police, September 2010.
Her Majesty’s Inspectorate of Constabulary (2010), Surrey Police Value for Money Profile, 2010-11.
Her Majesty’s Inspectorate of Constabulary (2010), Valuing the Police: Policing in an age of austerity.
Her Majesty’s Inspectorate of Constabulary (2010), Inspection of Salford Basic Command Unit, Greater Manchester Police.
Her Majesty’s Inspectorate of Constabulary (2011), Demanding times: The front line and police visibility.
Her Majesty’s Inspectorate of Constabulary (2011), Adapting to austerity: A review of police force and authority preparedness for the 2011/12-2014/15 CSR Period.
Hijzen, A., Upward, R. and Wright, P. (2007), Job creation, job destruction and the role of small firms: Firm-level evidence for the UK.
HM Government (2010), Our programme for government.
HM Government (2011), Working together for a stronger NHS.
HM Treasury (2010), Budget 2010: Securing the recovery.
HM Treasury (2010), The Spending Review framework.
HM Treasury, Government consultation on proposed pension contribution changes for civil servants, NHS workers and teachers, Press release, 28 July.
Holmes, E. and Oakley, M.(2011), Public and private sector terms, conditions and the issue of fairness.
Home Office (1999), Annual Report
Home Office (2004), Study of Police Resource Management and Rostering Arrangements.
66
Reformers and wreckersReferences
Home Office (2009), Protecting the public: Supporting the police to succeed.
Home Office (2010), Policing for the 21st Century: Reconnecting the police and the people.
Home Office (2011), Statistical Bulletin 13/09: Police Service Strength England and Wales, 31 March 2011.
House of Commons Children, Schools and Families Select Committee (2009), Training of teachers: Memorandum submitted to by the Association of School and College Leaders.
House of Commons Children, Schools and Families Committee (2010), Training of Teachers.
House of Commons Health Select Committee (2007), Fourth report of the session 2006-07.
House of Commons Home Affairs Select Committee (2010), Fifth report of session 2009-10: Police Service Strength.
House of Commons Library (2011),Police funding, Standard Note 021616.
House of Commons Public Accounts Committee (2007), Financial Management in the NHS.
House of Commons Public Accounts Committee (2007), Police Funding.
House of Commons Public Accounts Committee (2008), Managing financial resources to deliver better public services.
House of Commons Public Accounts Committee (2011), The National Programme of IT for the NHS: An update on the delivery of detailed care records systems.
House of Commons Public Administration Select Committee (2010) Outsiders and Insiders: External Appointments to the Senior Civil Service.
Hutchings, M. et al. (2009), Aspects of School Workforce Remodelling, Department for Children, Schools and Families.
Independent Public Sector Pensions Commission (2011), Final Report.
India Knowledge (2010), Narayana Hrudayalaya: A Model for Accessible, Affordable Health Care?, Wharton School.
Institute for Fiscal Studies (2010), The IFS Green Budget.
Johnson, B. (2011), Today, BBC Radio 4, 10 August.
Jurd, A. (2011), Public Service Labour Productivity, UKCeMGA.
Khan, C. M. et al (2001), “Performance-based Wages in Tax Collection: The Brazilian Tax Collection Reform and its Effects”, The Economic Journal, Vol. 111 No.468.
Khanna, T. et al (2005), “Narayana Hrudayalaya Heart Hospital: Cardiac Care for the Poor”, Harvard Business School.
Kibasi, T. (2011), “Innovation in healthcare delivery: the power of technology”, The Future of Healthcare in Europe Conference.
Kothandaraman, P. and S. Mookerjee (2007), “Healthcare for All: Narayana Hrudayalaya, Bangalore”, Growing Inclusive Markets, United Nations Development Programme.
KPMG (2011), Indian Healthcare System Overview.
KPMG and Home Office (2010), Operation QUEST: Transforming policing.
Laurant, M. et al (2010), Revision of professional roles and quality improvement: a review of the evidence, The Health Foundation.
Lincolnshire Police (2011), “Outsourcing bidders announced”, 23 May.
Local Government Association Group (2007), Local Government Workforce Strategy.
Local Government Association (2009), Local Government Workforce Strategy: Update, Spring/Summer.
Local Government Employers (2010), Green book.
67
Reformers and wreckersReferences
Local Government Association Group (2010), Delivering through people: Local Government Workforce Strategy 2010.
Local Government Group (2011), Local Government Workforce Survey: England 2010.
Local Government Group (2011), Fire and Rescue Services: Going the extra mile.
Local Government Group (2011), Local Government Pay & Workforce: Facts & Figures 2010/11.
Local Government Improvement and Development (2010), Good practice library: The BEST programme: Improving employee engagement in Birmingham City Council.
Localgov.co.uk, (2011), www.localgov.co.uk, “Birmingham rages over wage cuts, but shelves offshoring plans”, 25 July.
Loveday B. (2005), Police staff and service modernisation: A reform too far?
May, T. (2011), ACPO summer conference speech, 4 July.
May, T. (2011) Speech on police reform, Reform, 16 August.
McKinsey & Company (2007), How the world’s best performing school systems come out on top.
Merseyside Fire and Rescue Service (2010), Annual Report 2010.
Merseyside Fire and Rescue Service (2011), Merseyside Fire and Rescue Authority Budget and Financial Plan, 2011/12.
Metropolitan Police Service (2010), Freedom of Information Request Response, November.
Mirror (2011), “Police condemn move for ‘supercop’”, 13 August.
Monitor (2009), Service-line management: An Overview.
Moorfields Eye Hospital NHS Foundation Trust (2010), Annual Report.
Mulholland, H. (2011), “’Hundreds of thousands’ of public sector workers strike”, The Guardian, 30 June.
National Audit Office (2006), Improving poorly performing schools in England.
National Audit Office (2007), Pay Modernisation: A new contract for NHS consultants in England.
National Audit Office (2008), NHS Pay Modernisation: New contracts for general practice services in England.
National Audit Office (2009), Commercial skills for complex government projects.
National Audit Office (2009), NHS Pay Modernisation in England: Agenda for Change, 29 January.
National Audit Office (2010), The cost of public service pensions.
National Audit Office (2010) Management of NHS Hospital Productivity.
National Audit Office (2011), Progress in Improving Financial Management in Government.
National College for School Leadership (2011), www.nationalcollege.org.uk/index/professional-development/national-leaders-of-education.htm. Accessed 31 August 2011.
National Policing Improvement Agency (2010), Changing the Workforce Mix: VfM Toolkit 5.1.
Neyroud, P. (2011), Review of Police Leadership and Training: Volume One.
NHS (2010), NHS Staff Survey 2010.
NHS Employers (2009), Leading the NHS workforce through to recovery, Briefing 66.
NHS Employers (2010), Flexible workforce: strategic planning to reduce costs and improve quality.
NHS North West (2008), The Workforce, Education Commissioning and Education and Learning Strategy.
NHS North West (2010) An evaluation of the scope and practice of Non Medical Prescribing in the North West.
68
Reformers and wreckersReferences
NHS North West (2010), Ten Years on - An Evaluation of the Non-Medical Consultant role in the North West.
NHS North West, www.whnt.nhs.uk, Clinical skills case study: Assistant Practitioner.
OECD (2002), Strengthening the pay-performance link in Government – A case study for Korea.
OECD (2004), Skill-mix and policy change in the health workforce: Nurses in advanced roles.
OECD (2006), Competition in the provision of hospital services.
OECD (2008), The State of the Public Services.
OECD (2010), Health data.
OECD (2010), Health Care Systems: Efficiency and Policy Settings.
OECD (2011), OECD Employment Database.
Office for Budget Responsibility (2011), Economic and fiscal outlook: March 2011.
Office for National Statistics (1998-2010), Annual Survey of Hours and Earnings.
Office for National Statistics (2006), Education and Training Highlights.
Office for National Statistics (2009), Total Public Sector Productivity.
Office for National Statistics (2011), Sickness absence in the labour market.
Office for National Statistics (2011), Statistical bulletin: Public and private sector employment.
Office for National Statistics (2011), Statistical bulletin: Public sector employment Q1 2011.
Office for National Statistics (2011), Estimating differences in public and private sector pay.
Office for Budget Responsibility (2011), Economic and fiscal outlook: March 2011.
Office of Manpower Economics (2010), “Update on abolition of SSSNB”, www.ome.uk.com/example/School_Support_Staff_Negotiating_Body.aspx. Accessed 31 August 2011.
Ofsted, (1995) Ofsted Inspection Report: Denbigh High School.
Ofsted (1999), Ofsted Inspection Report: Denbigh High School.
Ofsted (2004) Ofsted Inspection Report, Denbigh High School.
Ofsted (2006), The logical chain: continuing professional development in effective schools.
Ofsted (2007) Ofsted Inspection Report: Denbigh High School.
Papworth NHS Foundation Trust (2010), Annual Report.
Parker, D. and Martin, S. (1993), “The impact of UK privatisation on labour and total factor productivity”, Scottish Journal of Political Economy, Vol. 42, Issue 2.
Personnel Today (2011), “CIPD calls for audit of public sector job cuts”, 13 April.
Pickles, E. (2010), Speech to the Conservative Party conference, 3 October.
Pickles, E. (2011), Statement on Open public services, 23 March.
Prahalad, C. (2003), The Fortune at the Bottom of the Pyramid, Indian Institute of Management, Ahmedabad.
Prentice, G. et al (2007), Performance pay in the public sector: A review of the issues evidence, Office of Manpower Economics.
PricewaterhouseCoopers (2011), Public Sector Pension Negotiations – PwC comment, Press release, 29 June.
Public Service Pension Commission (2010), Interim Report.
Rangan, V. and R. Thulasiraj (2007), “Making sight affordable: Innovations Case Narrative: The Aravind Eye Care System”, Innovations, MIT.
69
Reformers and wreckersReferences
Ravindran, R. and R. Thulasiraj (2006), “Aravind Eye Care System: Developing sustainable eye care”, Cataract and Refractive Surgery Today, March.
Record, N. (2007), Sir Humphrey’s legacy: Facing up to the cost of public sector pensions, Institute of Economic Affairs.
Record, N. (2008), Sir Humphrey’s Legacy: An Update – UK Public Sector Unfunded Occupational Pensions, Institute of Economic Affairs.
Reform (2010), The first hundred days.
Reform (2011), A lot more for a lot less: Disruptive innovation in healthcare.
Reform (2011), Localism and the public services revolution.
Reform (2011), Value for money in policing: From efficiency to transformation.
Rubery, J. et al (2011), The recruitment and retention of a care workforce for older people, Manchester Business School.
Ruffley, D. (2011), “Three steps that will transform our police”, The Daily Telegraph, 12 August.
School Teachers’ Pay and Conditions Order 2011.
Selfe, J. et al (2008), Assistant Practitioner Foundation Degree Evaluation Report, University of Central Lancashire.
Shapiro, A. (2009), Evaluating the Implementation and Impact of Advanced Practitioners across Greater Manchester – Summary of Findings.
Silver, N. (2008), A Bankruptcy Foretold: The UK’s Implicit Pension Debt, Institute of Economic Affairs, Discussion Paper No. 22.
Skills for Care (2005), The State of the Social Care Workforce 2004.
Skills for Care (2011), The size and structure of the adult social care sector and workforce.
Spilsbury, K. (2010), Introduction and development of assistant practitioner roles, presentation to the Royal College of Nursing, January 29.
Strath, A., Teacher Policy Reforms in Sweden: The Case for Individualised Pay, International Institute for Educational Planning, UNESCO.
Surrey Police Authority (2009), Chief Constable’s report to the police authority, 10 December.
Swift, J. (2009), “Advanced Practitioners”, Health Service Journal, 24 August.
Swift, J. (2010), Skill mix and role redesign, the North West way, presentation at NHS Confederation conference, 12 May.
Symmons, E. (2011) “Southern Cross – the truth behind the headlines”, Insolvency News, 8 July.
TeacherNet (2009), The role of the School Teachers’ Review Body.
The Daily Telegraph (2009), “Doctors given bonuses of up to £75,000”, 25 April.
The Daily Telegraph (2011), “Surrey Police, bureaucracy and the front line”, 15 April.
The Guardian (2011), “Trusts compare staff performance through workforce portal”, 4 February.
The Guardian (2011), “’Hundreds of thousands’ of public sector workers strike”, 30 June.
The Guardian (2011), “David Cameron: Foreign police chief could run UK force to tackle corruption”, 20 July.
The Information Centre for Health and Social Care (2009), NHS Staff 1998 - 2008 Overview.
The Information Centre for Health and Social Care (2011), NHS Staff 2000-2010 Overview.
The Teaching Awards (2006), Inspiring Minds: Ten Case Studies of Teaching Award Head Teachers.
The Wall Street Journal (2009), “The Henry Ford of Heart Surgery”, 21 November.
Tidd, J. et al (2005), “Aravind Eye Clinics”, Managing Innovation.
70
Reformers and wreckersReferences
Times Educational Supplement (2004), “Believe they can Fly”, 13 February.
Trade Union Congress (2011), Congress Preliminary Agenda. Nominations and motions for the 143rd annual Trades Union Congress 12–14 September, London.
Training and Development Agency for Schools (2011), www.tda.gov.uk/about/latest-announcements/dfe-announces-teaching-agency.aspx Accessed 31 August 2011.
Training and Development Agency for Schools (2011), www.tda.gov.uk/get-into-teaching/teacher-training-options/gtp.aspx. Accessed 26 August 2011.
Training and Development Agency for Schools (2011), www.tda.gov.uk/get-into-teaching/transition-to-teach.aspx. Accessed 26 August 2011.
Wanless, D. et al (2007), Securing good care for older people, The King’s Fund.
Winsor, T. (2011), Independent Review of Police Officer and Staff Remuneration and Conditions: Part 1 Report.
Wolf, A. (2010), More than we bargained for: the social and economic costs of national wage bargaining, CentreForum.
World Health Organization (2002), Skill mix in the health care workforce: reviewing the evidence.
World Health Organisation (2009), Health data.
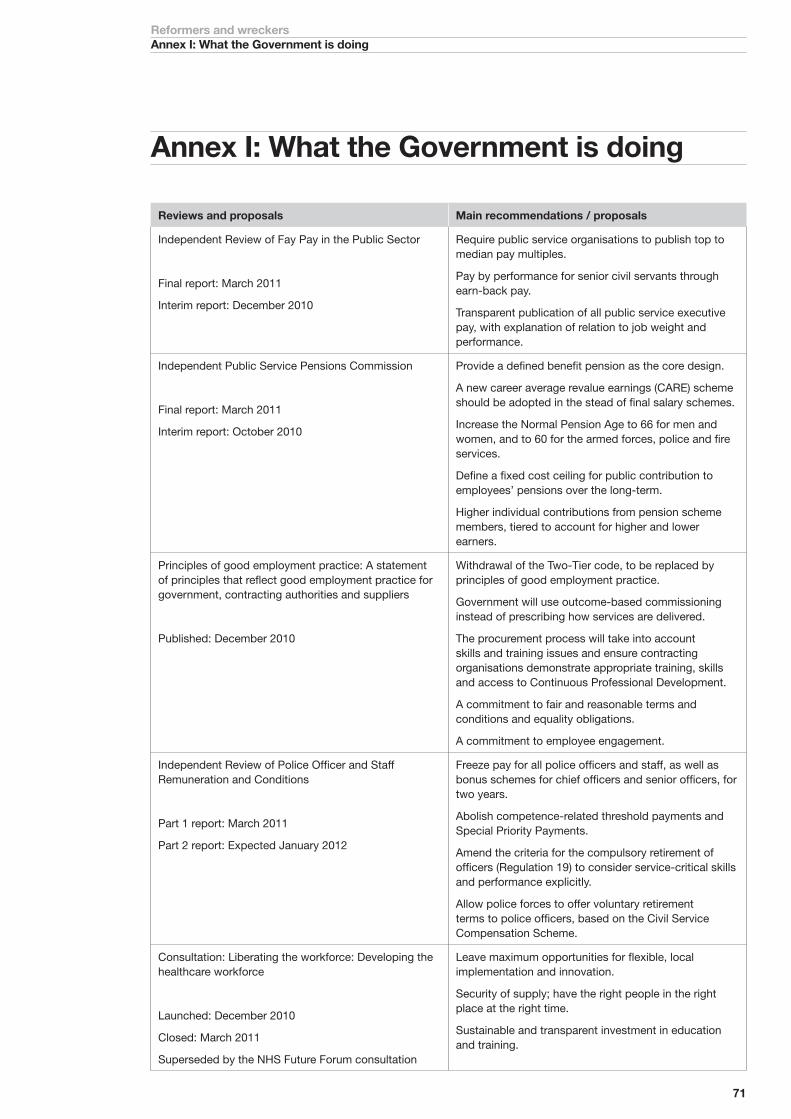
71
Reformers and wreckersAnnex I: What the Government is doing
Annex I: What the Government is doing
Reviews and proposals Main recommendations / proposals
Independent Review of Fay Pay in the Public Sector
Final report: March 2011
Interim report: December 2010
Require public service organisations to publish top to median pay multiples.
Pay by performance for senior civil servants through earn-back pay.
Transparent publication of all public service executive pay, with explanation of relation to job weight and performance.
Independent Public Service Pensions Commission
Final report: March 2011
Interim report: October 2010
Provide a defined benefit pension as the core design.
A new career average revalue earnings (CARE) scheme should be adopted in the stead of final salary schemes.
Increase the Normal Pension Age to 66 for men and women, and to 60 for the armed forces, police and fire services.
Define a fixed cost ceiling for public contribution to employees’ pensions over the long-term.
Higher individual contributions from pension scheme members, tiered to account for higher and lower earners.
Principles of good employment practice: A statement of principles that reflect good employment practice for government, contracting authorities and suppliers
Published: December 2010
Withdrawal of the Two-Tier code, to be replaced by principles of good employment practice.
Government will use outcome-based commissioning instead of prescribing how services are delivered.
The procurement process will take into account skills and training issues and ensure contracting organisations demonstrate appropriate training, skills and access to Continuous Professional Development.
A commitment to fair and reasonable terms and conditions and equality obligations.
A commitment to employee engagement.
Independent Review of Police Officer and Staff Remuneration and Conditions
Part 1 report: March 2011
Part 2 report: Expected January 2012
Freeze pay for all police officers and staff, as well as bonus schemes for chief officers and senior officers, for two years.
Abolish competence-related threshold payments and Special Priority Payments.
Amend the criteria for the compulsory retirement of officers (Regulation 19) to consider service-critical skills and performance explicitly.
Allow police forces to offer voluntary retirement terms to police officers, based on the Civil Service Compensation Scheme.
Consultation: Liberating the workforce: Developing the healthcare workforce
Launched: December 2010
Closed: March 2011
Superseded by the NHS Future Forum consultation
Leave maximum opportunities for flexible, local implementation and innovation.
Security of supply; have the right people in the right place at the right time.
Sustainable and transparent investment in education and training.
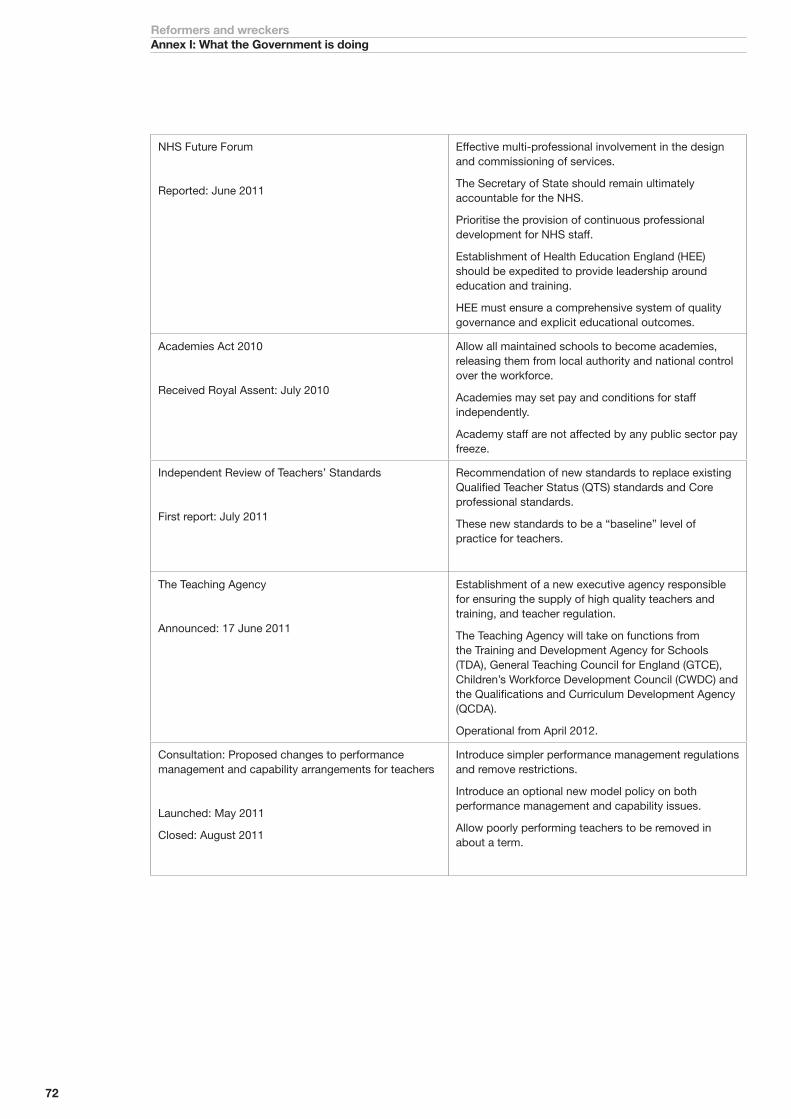
72
Reformers and wreckersAnnex I: What the Government is doing
NHS Future Forum
Reported: June 2011
Effective multi-professional involvement in the design and commissioning of services.
The Secretary of State should remain ultimately accountable for the NHS.
Prioritise the provision of continuous professional development for NHS staff.
Establishment of Health Education England (HEE) should be expedited to provide leadership around education and training.
HEE must ensure a comprehensive system of quality governance and explicit educational outcomes.
Academies Act 2010
Received Royal Assent: July 2010
Allow all maintained schools to become academies, releasing them from local authority and national control over the workforce.
Academies may set pay and conditions for staff independently.
Academy staff are not affected by any public sector pay freeze.
Independent Review of Teachers’ Standards
First report: July 2011
Recommendation of new standards to replace existing Qualified Teacher Status (QTS) standards and Core professional standards.
These new standards to be a “baseline” level of practice for teachers.
The Teaching Agency
Announced: 17 June 2011
Establishment of a new executive agency responsible for ensuring the supply of high quality teachers and training, and teacher regulation.
The Teaching Agency will take on functions from the Training and Development Agency for Schools (TDA), General Teaching Council for England (GTCE), Children’s Workforce Development Council (CWDC) and the Qualifications and Curriculum Development Agency (QCDA).
Operational from April 2012.
Consultation: Proposed changes to performance management and capability arrangements for teachers
Launched: May 2011
Closed: August 2011
Introduce simpler performance management regulations and remove restrictions.
Introduce an optional new model policy on both performance management and capability issues.
Allow poorly performing teachers to be removed in about a term.
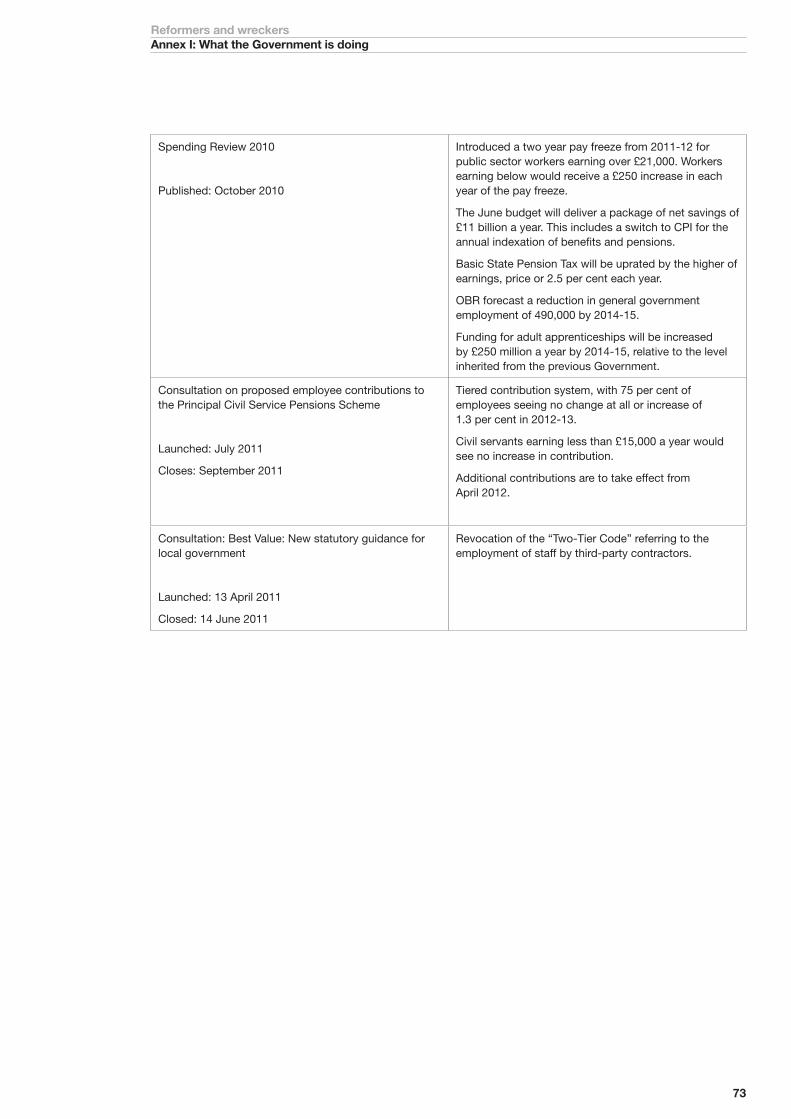
73
Reformers and wreckersAnnex I: What the Government is doing
Spending Review 2010
Published: October 2010
Introduced a two year pay freeze from 2011-12 for public sector workers earning over £21,000. Workers earning below would receive a £250 increase in each year of the pay freeze.
The June budget will deliver a package of net savings of £11 billion a year. This includes a switch to CPI for the annual indexation of benefits and pensions.
Basic State Pension Tax will be uprated by the higher of earnings, price or 2.5 per cent each year.
OBR forecast a reduction in general government employment of 490,000 by 2014-15.
Funding for adult apprenticeships will be increased by £250 million a year by 2014-15, relative to the level inherited from the previous Government.
Consultation on proposed employee contributions to the Principal Civil Service Pensions Scheme
Launched: July 2011
Closes: September 2011
Tiered contribution system, with 75 per cent of employees seeing no change at all or increase of 1.3 per cent in 2012-13.
Civil servants earning less than £15,000 a year would see no increase in contribution.
Additional contributions are to take effect from April 2012.
Consultation: Best Value: New statutory guidance for local government
Launched: 13 April 2011
Closed: 14 June 2011
Revocation of the “Two-Tier Code” referring to the employment of staff by third-party contractors.
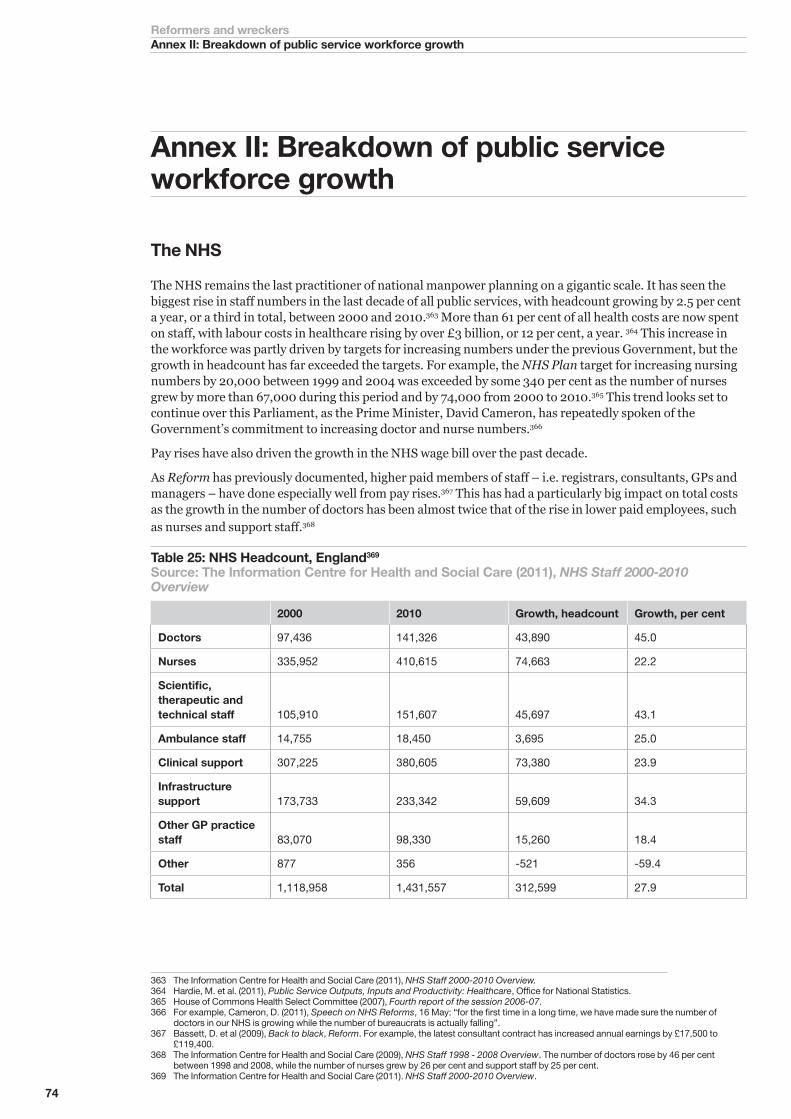
74
Reformers and wreckersAnnex II: Breakdown of public service workforce growth
Annex II: Breakdown of public service workforce growth
The NHS
The NHS remains the last practitioner of national manpower planning on a gigantic scale. It has seen the biggest rise in staff numbers in the last decade of all public services, with headcount growing by 2.5 per cent a year, or a third in total, between 2000 and 2010.363 More than 61 per cent of all health costs are now spent on staff, with labour costs in healthcare rising by over £3 billion, or 12 per cent, a year. 364 This increase in the workforce was partly driven by targets for increasing numbers under the previous Government, but the growth in headcount has far exceeded the targets. For example, the NHS Plan target for increasing nursing numbers by 20,000 between 1999 and 2004 was exceeded by some 340 per cent as the number of nurses grew by more than 67,000 during this period and by 74,000 from 2000 to 2010.365 This trend looks set to continue over this Parliament, as the Prime Minister, David Cameron, has repeatedly spoken of the Government’s commitment to increasing doctor and nurse numbers.366
Pay rises have also driven the growth in the NHS wage bill over the past decade.
As Reform has previously documented, higher paid members of staff – i.e. registrars, consultants, GPs and managers – have done especially well from pay rises.367 This has had a particularly big impact on total costs as the growth in the number of doctors has been almost twice that of the rise in lower paid employees, such as nurses and support staff.368
Table 25: NHS Headcount, England369
Source: The Information Centre for Health and Social Care (2011), NHS Staff 2000-2010 Overview
2000 2010 Growth, headcount Growth, per cent
Doctors 97,436 141,326 43,890 45.0
Nurses 335,952 410,615 74,663 22.2
Scientific, therapeutic and technical staff 105,910 151,607 45,697 43.1
Ambulance staff 14,755 18,450 3,695 25.0
Clinical support 307,225 380,605 73,380 23.9
Infrastructure support 173,733 233,342 59,609 34.3
Other GP practice staff 83,070 98,330 15,260 18.4
Other 877 356 -521 -59.4
Total 1,118,958 1,431,557 312,599 27.9
363 The Information Centre for Health and Social Care (2011), NHS Staff 2000-2010 Overview.364 Hardie, M. et al. (2011), Public Service Outputs, Inputs and Productivity: Healthcare, Office for National Statistics.365 House of Commons Health Select Committee (2007), Fourth report of the session 2006-07.366 For example, Cameron, D. (2011), Speech on NHS Reforms, 16 May: “for the first time in a long time, we have made sure the number of
doctors in our NHS is growing while the number of bureaucrats is actually falling”.367 Bassett, D. et al (2009), Back to black, Reform. For example, the latest consultant contract has increased annual earnings by £17,500 to
£119,400.368 The Information Centre for Health and Social Care (2009), NHS Staff 1998 - 2008 Overview. The number of doctors rose by 46 per cent
between 1998 and 2008, while the number of nurses grew by 26 per cent and support staff by 25 per cent.369 The Information Centre for Health and Social Care (2011). NHS Staff 2000-2010 Overview.
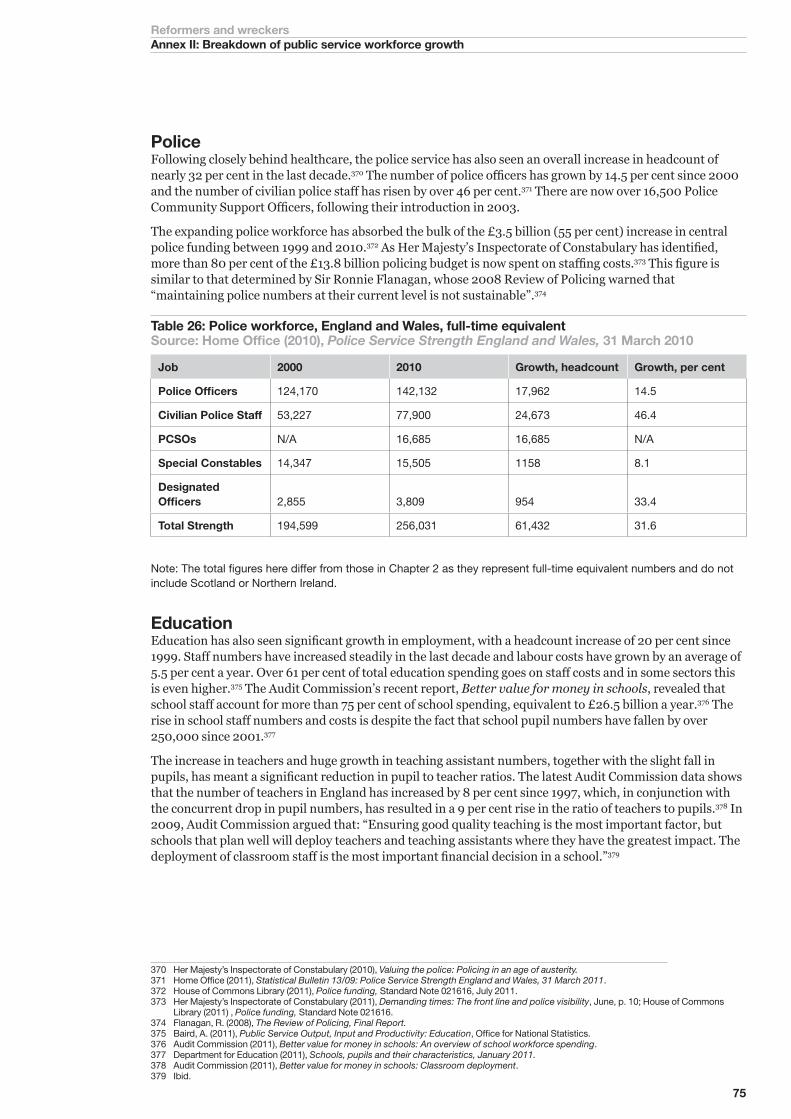
75
Reformers and wreckersAnnex II: Breakdown of public service workforce growth
PoliceFollowing closely behind healthcare, the police service has also seen an overall increase in headcount of nearly 32 per cent in the last decade.370 The number of police officers has grown by 14.5 per cent since 2000 and the number of civilian police staff has risen by over 46 per cent.371 There are now over 16,500 Police Community Support Officers, following their introduction in 2003.
The expanding police workforce has absorbed the bulk of the £3.5 billion (55 per cent) increase in central police funding between 1999 and 2010.372 As Her Majesty’s Inspectorate of Constabulary has identified, more than 80 per cent of the £13.8 billion policing budget is now spent on staffing costs.373 This figure is similar to that determined by Sir Ronnie Flanagan, whose 2008 Review of Policing warned that “maintaining police numbers at their current level is not sustainable”.374
Table 26: Police workforce, England and Wales, full-time equivalentSource: Home Office (2010), Police Service Strength England and Wales, 31 March 2010
Job 2000 2010 Growth, headcount Growth, per cent
Police Officers 124,170 142,132 17,962 14.5
Civilian Police Staff 53,227 77,900 24,673 46.4
PCSOs N/A 16,685 16,685 N/A
Special Constables 14,347 15,505 1158 8.1
Designated Officers 2,855 3,809 954 33.4
Total Strength 194,599 256,031 61,432 31.6
Note: The total figures here differ from those in Chapter 2 as they represent full-time equivalent numbers and do not include Scotland or Northern Ireland.
EducationEducation has also seen significant growth in employment, with a headcount increase of 20 per cent since 1999. Staff numbers have increased steadily in the last decade and labour costs have grown by an average of 5.5 per cent a year. Over 61 per cent of total education spending goes on staff costs and in some sectors this is even higher.375 The Audit Commission’s recent report, Better value for money in schools, revealed that school staff account for more than 75 per cent of school spending, equivalent to £26.5 billion a year.376 The rise in school staff numbers and costs is despite the fact that school pupil numbers have fallen by over 250,000 since 2001.377
The increase in teachers and huge growth in teaching assistant numbers, together with the slight fall in pupils, has meant a significant reduction in pupil to teacher ratios. The latest Audit Commission data shows that the number of teachers in England has increased by 8 per cent since 1997, which, in conjunction with the concurrent drop in pupil numbers, has resulted in a 9 per cent rise in the ratio of teachers to pupils.378 In 2009, Audit Commission argued that: “Ensuring good quality teaching is the most important factor, but schools that plan well will deploy teachers and teaching assistants where they have the greatest impact. The deployment of classroom staff is the most important financial decision in a school.”379
370 Her Majesty’s Inspectorate of Constabulary (2010), Valuing the police: Policing in an age of austerity.371 Home Office (2011), Statistical Bulletin 13/09: Police Service Strength England and Wales, 31 March 2011.372 House of Commons Library (2011), Police funding, Standard Note 021616, July 2011.373 Her Majesty’s Inspectorate of Constabulary (2011), Demanding times: The front line and police visibility, June, p. 10; House of Commons
Library (2011) , Police funding, Standard Note 021616.374 Flanagan, R. (2008), The Review of Policing, Final Report.375 Baird, A. (2011), Public Service Output, Input and Productivity: Education, Office for National Statistics.376 Audit Commission (2011), Better value for money in schools: An overview of school workforce spending.377 Department for Education (2011), Schools, pupils and their characteristics, January 2011.378 Audit Commission (2011), Better value for money in schools: Classroom deployment.379 Ibid.
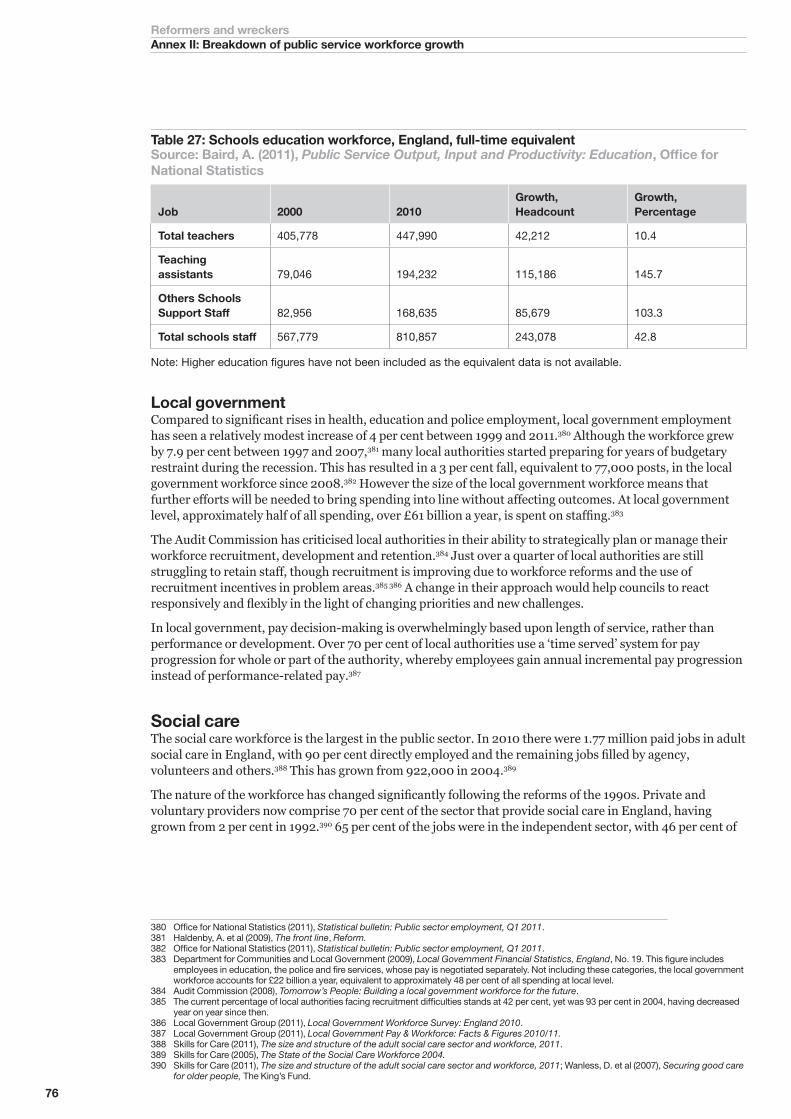
76
Reformers and wreckersAnnex II: Breakdown of public service workforce growth
Table 27: Schools education workforce, England, full-time equivalentSource: Baird, A. (2011), Public Service Output, Input and Productivity: Education, Office for National Statistics
Job 2000 2010Growth, Headcount
Growth, Percentage
Total teachers 405,778 447,990 42,212 10.4
Teaching assistants 79,046 194,232 115,186 145.7
Others Schools Support Staff 82,956 168,635 85,679 103.3
Total schools staff 567,779 810,857 243,078 42.8
Note: Higher education figures have not been included as the equivalent data is not available.
Local governmentCompared to significant rises in health, education and police employment, local government employment has seen a relatively modest increase of 4 per cent between 1999 and 2011.380 Although the workforce grew by 7.9 per cent between 1997 and 2007,381 many local authorities started preparing for years of budgetary restraint during the recession. This has resulted in a 3 per cent fall, equivalent to 77,000 posts, in the local government workforce since 2008.382 However the size of the local government workforce means that further efforts will be needed to bring spending into line without affecting outcomes. At local government level, approximately half of all spending, over £61 billion a year, is spent on staffing.383
The Audit Commission has criticised local authorities in their ability to strategically plan or manage their workforce recruitment, development and retention.384 Just over a quarter of local authorities are still struggling to retain staff, though recruitment is improving due to workforce reforms and the use of recruitment incentives in problem areas.385 386 A change in their approach would help councils to react responsively and flexibly in the light of changing priorities and new challenges.
In local government, pay decision-making is overwhelmingly based upon length of service, rather than performance or development. Over 70 per cent of local authorities use a ‘time served’ system for pay progression for whole or part of the authority, whereby employees gain annual incremental pay progression instead of performance-related pay.387
Social careThe social care workforce is the largest in the public sector. In 2010 there were 1.77 million paid jobs in adult social care in England, with 90 per cent directly employed and the remaining jobs filled by agency, volunteers and others.388 This has grown from 922,000 in 2004.389
The nature of the workforce has changed significantly following the reforms of the 1990s. Private and voluntary providers now comprise 70 per cent of the sector that provide social care in England, having grown from 2 per cent in 1992.390 65 per cent of the jobs were in the independent sector, with 46 per cent of
380 Office for National Statistics (2011), Statistical bulletin: Public sector employment, Q1 2011.381 Haldenby, A. et al (2009), The front line, Reform.382 Office for National Statistics (2011), Statistical bulletin: Public sector employment, Q1 2011.383 Department for Communities and Local Government (2009), Local Government Financial Statistics, England, No. 19. This figure includes
employees in education, the police and fire services, whose pay is negotiated separately. Not including these categories, the local government workforce accounts for £22 billion a year, equivalent to approximately 48 per cent of all spending at local level.
384 Audit Commission (2008), Tomorrow’s People: Building a local government workforce for the future.385 The current percentage of local authorities facing recruitment difficulties stands at 42 per cent, yet was 93 per cent in 2004, having decreased
year on year since then.386 Local Government Group (2011), Local Government Workforce Survey: England 2010.387 Local Government Group (2011), Local Government Pay & Workforce: Facts & Figures 2010/11. 388 Skills for Care (2011), The size and structure of the adult social care sector and workforce, 2011.389 Skills for Care (2005), The State of the Social Care Workforce 2004.390 Skills for Care (2011), The size and structure of the adult social care sector and workforce, 2011; Wanless, D. et al (2007), Securing good care
for older people, The King’s Fund.

77
Reformers and wreckersAnnex II: Breakdown of public service workforce growth
the total in the private sector.391 392 The structure of the sector has also changed. There has been significant growth in non-residential care services. In 2010 35 per cent of social care workers worked in residential care, down from 50 per cent in 2004, while 44 per cent worked in domiciliary care, compared to 18 per cent in 2004.393
There has been a significant expansion in social care provision in England driven by demographic change and declining mortality. Council spending on social care was £16.8 billion in 2009-10, a 16 per cent real terms increase since 2003-04.394 However productivity declined by 4.3 per cent between 1997 and 2007.395 In addition unit costs vary. For example, weekly spend on residential care varies from £262 to £11,282, although the quality and choice of services, and particularly the social care facilities have improved over the past decade.396
Like other public services the majority of staff costs in social care are on the front line. In 2010 74 per cent of all social care jobs were directly providing care and support, with 8 per cent working in management.397 However social care services have significant problems with recruitment, retention, quality of management, low pay and poor skills.398 For example, the vacancy rate for care workers is 4 per cent and the turnover rate was 22.8 per cent, higher than many other industries.399 Pay, retention and skill levels are lower in the private sector.400
391 Skills for Care (2011), The size and structure of the adult social care sector and workforce, 2011.392 Following the collapse of the Southern Cross, the UK’s largest care home provider, some have expressed concern over private provision and
private equity in the social care sector. However private equity is not necessarily to blame. First, Southern Cross faced a series of particular problems: a bias towards the midlands and north where local authority fees are lower and there are far fewer private fees at premium rates and a sheer size that is physically unwieldy and expensive to manage making it unresponsive. Moreover the “sale and leaseback” model, where more care operated were acquired through the funds raised by spinning off housing assets, proved to be dangerous in the long term. Following the financial crisis the company was hit by falling property prices, reduced fees for residents while being forced to increase rents to meet rising costs. Cuts in social care spending and the long term move towards domiciliary care put further pressure onto Southern Cross. See: Financial Times (2011), “Human cost forgotten in race to invest”, 30 May; Financial Times (2011), “Southern Cross run on failed business model”, 30 May; Symmons, E. (2011) “Southern Cross – the truth behind the headlines”, Insolvency News, 8 July.
393 Skills for Care (2011), The size and structure of the adult social care sector and workforce 2011; Skills for Care (2005), The State of the Social Care Workforce 2004.
394 Audit Commission (2011), Value for money in social care. 395 Office for National Statistics (2009), Total Public Sector Productivity. 396 Audit Commission (2011), Value for money in social care.397 Skills for Care (2011), The size and structure of the adult social care sector and workforce, 2011.398 Wanless, D. et al (2007), Securing good care for older people, The King’s Fund; Rubery, J. et al (2011), The recruitment and retention of a care
workforce for older people, Manchester Business School. 399 Skills for Care (2011), The size and structure of the adult social care sector and workforce, 2011.400 Ibid.
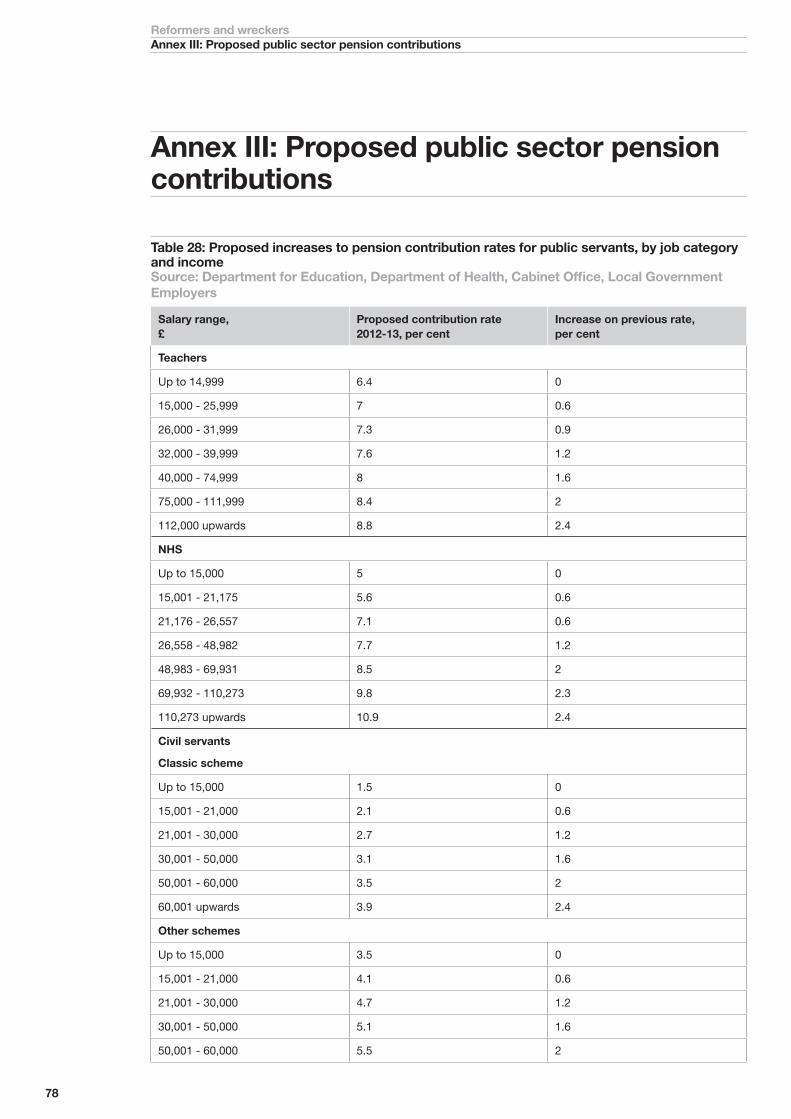
78
Reformers and wreckersAnnex III: Proposed public sector pension contributions
Annex III: Proposed public sector pension contributions
Table 28: Proposed increases to pension contribution rates for public servants, by job category and incomeSource: Department for Education, Department of Health, Cabinet Office, Local Government Employers
Salary range, £
Proposed contribution rate 2012-13, per cent
Increase on previous rate, per cent
Teachers
Up to 14,999 6.4 0
15,000 - 25,999 7 0.6
26,000 - 31,999 7.3 0.9
32,000 - 39,999 7.6 1.2
40,000 - 74,999 8 1.6
75,000 - 111,999 8.4 2
112,000 upwards 8.8 2.4
NHS
Up to 15,000 5 0
15,001 - 21,175 5.6 0.6
21,176 - 26,557 7.1 0.6
26,558 - 48,982 7.7 1.2
48,983 - 69,931 8.5 2
69,932 - 110,273 9.8 2.3
110,273 upwards 10.9 2.4
Civil servants
Classic scheme
Up to 15,000 1.5 0
15,001 - 21,000 2.1 0.6
21,001 - 30,000 2.7 1.2
30,001 - 50,000 3.1 1.6
50,001 - 60,000 3.5 2
60,001 upwards 3.9 2.4
Other schemes
Up to 15,000 3.5 0
15,001 - 21,000 4.1 0.6
21,001 - 30,000 4.7 1.2
30,001 - 50,000 5.1 1.6
50,001 - 60,000 5.5 2

79
Reformers and wreckersAnnex III: Proposed public sector pension contributions
60,001 upwards 5.9 2.4
Local government
Up to 12,600 5.5 0
12,601 - 14,700 5.6 0
14,701 - 18,000 5.9 0
18,001- 24,000 6.5 0
24,001 - 31,500 7.8 1.3
31,501 - 42,000 8.6 1.7
42,001 - 75,000 9.5 2.3
75,001 - 100,000 10.1 2.6
100,001 - 150,000 10.3 2.8
150,001 upwards 10.5 3
Police
1987 scheme
Up to 27,000 n/a n/a
27,000 - 60,000 12.25 1.25
60,001 upwards 12.5 1.5
2006 scheme
Up to 27,000 10.1 0.6
27,000 - 60,000 10.5 1
60,001 upwards 10.75 1.25

£20.00 Reform45 Great Peter StreetLondonSW1P 3LT
T 020 7799 [email protected]
ISBN number 978-1-905730-54-4