reforestation management and socio-economic...
TRANSCRIPT
Reforestation Management and Socio-economic Condition of Landless Taungya
Cultivators of Pyinmana Kaing Reserved Forest in Myanmar
Thanda Kyi1 and Khin Lay Nandar Aung2
ABSTRACT
The deforestation may lose not only the national economy but also faced the many kinds of environmental problems. In 1995, Myanmar Forest Policy ensures the sustainable development of forest resources and paves the way for prudent use and enhanced benefit from the forest while maintaining ecosystem integrity and environmental balance. Since, Myanmar is an underdeveloped country and over 70% of total population is rural dwellers. Some of them are still heavily dependent on forests for food, fuel, fodder and timber for their livelihood. Several deforestations occurred primarily as a result of land clearing for agriculture. To solve the challenge of deforestation, it needs to find effective ways of using and managing forest land resource on sustainable basis to meet the demands of growing population. The specific objectives of this study are as follow;
1. To understand the management of reforestation in the losses of forests 2. To assess the socio-economic characteristics of Taungya cultivators in selected
areas. Kaing reserved forests, located in the Western slope of Bago Yoma, are considered as a sample area. Total of (37) sample households were randomly selected with the help of local forest officers. Taungya method of reforestation system was the rehalibilitation to forest with the collaboration of forest department and Taungya farmers and can provide the national economy. The households got mainly their income from farm, off-farm, non-farm, and Norn from the forest department. The farm income was 52% of total income. Taungya cultivators had grown the groundnut as the major crop. If the profitability of the cultivated crops were compared, the profit of the rice production (upland) has the negative value in unit area. However, it is not assumed as loss because opportunity cost (family labour cost) is used in profit calculation. The net profit of paddy (lowland) and groundnut were not different and that of sesame has incentive to grow.
1 Lecturer, Department of Agricultural Economics, Yezin Agricultural University, Myanmar. 2 Demonstrator, Department of Botany, Yadanapone University, Mandalay.
І. INTRODUCTION
The deforestation may lose not only the national economy but also faced the
many kinds of environmental problems including soil erosion, lack of windbreaks, silting
in reservoirs and natural streams due to water erosion, damage of biodiversity and
ecosystems. Serious threats are weather changing, global warming and subsequently,
becoming to the desert. The forests are not simply a source of timber but they perform a
variety of social and ecological functions and provide a livelihood and cultural integrity
of forest dwellers and a habitat for a wealth of plants and animals. They protect enrich
soils, provide natural regulation of the hydrologic cycle, affect local and regional climate
through evaporation and transpiration, and influence watershed flow of surface and
groundwater. In addition, the poverty condition of the local people and Taungya
cultivators is the more or less responsible to forest degradation.
Since, Myanmar is an under developed country and over 70% of total population
is rural dwellers. Some of rural communities are still heavily dependent on forests for
food, fuel, fodder (pasture land) and timber for their livelihood. Several deforestations
occurred primarily as a result of land clearing for agriculture. Shifting cultivation (land
clearing for agriculture) was included as the important fact in deforestation. To solve the
challenge of deforestation, it needs to find effective ways of using and managing forest
land resource on sustainable basis to meet the demands of growing population.
Myanmar forest resources were administered by the Forest Department in 1998
by using the “Taungya” method. “Taungya” is a typical type of agro-forestry that is
combined plantation of agricultural crops with forest trees. In this method, local people
and shifting cultivators from other community could grow their agricultural crops in
allotted lands; simultaneously they will take part in forest plantation. From this way, not
only the forest department can do the forest plantations programme with low cost but also
the cultivators can get the agricultural land and norn provided by forest department.
Objectives Forest plantation by Taungya has been established in many regions of Myanmar
in 1856. These silvi-agricultural practices helped in solving the national land-use
problems and the development of national economy, i.e. to raise the living standard and
socio-economic condition of shifting cultivators in rural area.

With the development and success of Taungya system in teak plantation, shifting
cultivators need to acquire some advanced knowledge relating to the forest value,
appropriate agricultural practices which will lead to minimizing the shifting cultivation
practice and the clearing of forests. The specific objectives of this study are as follow;
1. To understand the management of reforestation in the losses of forests.
2. To assess the socio-economic characteristics of Taungya cultivators in selected
areas.
To retain the remaining natural forest, Natural Generation method can be used.
But, for the unclassified and degraded forests, New Forest Plantation Programme are
more suitable. In Pyinmana Township, Forest Plantation Programme was started as
Special Teak Plantation Programme in 1998.
Table 1. Special teak plantation programme in Pyinmana
No. Year Reserved forest Compartment No Area (Acre) Successful %
1. 1998-1999 Kaing 9 500 82.5%
2. 1998-1999 Kaing 10 500 86.5%
3. 1999-2000 Kaing 4,7 500 84.8%
4. 1999-2000 Kaing 7,8 500 84.3%
5. 2000-2001 Kaing 18,19 500 86.1%
6. 2000-2001 Kaing 14 500 74.5%
7. 2001-2002 Kaing 17,18 500 74.7%
8. 2001-2002 Kaing 12 500 71.0%
9. 2002-2003 Kaing 3 500 94.8%
10. 2002-2003 Kaing 5 500 93.3%
11. 2003-2004 Kaing 2 500 95.8%
12. 2003-2004 Kaing 5,6 500 92.6%
Source: Forest Department, Pyinmana 2004
II. METHODOLOGY
Data Sources and Data Collection The study was based on primary and secondary source of data. Primary data was
collected at a household level of Taungya cultivators and secondary data from the forest

officers and staff from forest department. Both types of data were collected during the
planting season of 2004-2005 for the investigation of forest management and socio-
economic condition of Taungya farmers. Data included the financial support from the
forest department to Taungya cultivators, intercropping in this agro-forestry type, and
their cropping patterns. The questionnaires were prepared to collect the data from the
local Taungya cultivators after the preliminary survey.
The survey area was in remote area and the population has sparse density. In
Kaing (13), those who participated in Taungya system are (24) and (37) in Kaing (15).
The head of household was considered as sampling unit. Total of (37) sample households
were selected by using simple random sampling method depending upon the list of
population within the study area with the help of local forest officers. Kaing reserved
forest was located on the Western slope of Bago Yoma. Pyinmana Township consisted of
10 reserved forests namely, Taung Nyo, Ngalight, Phozaung, Kaing, Hting, Yezin, Nan-
cho, Zeyaing, Paung-laung-sinsa and Me-haul (Table 2). Compartment number 13 and 15
of Special Teak Plantations were considered as study area in Kaing Reserved Forest.
Table 2. Total area and compartments of Reserved Forest
No. Name of reserved forest Compartment Area (acre)
1. Taung Nyo 22 23792
2. Ngalight 20 21503
3. Phozaung 47 46512
4. Kaing 18 11423
5. Hting 1 1711
6. Yezin 23 40042
7. Nan-cho 22 23279
8. Zeyaing 6 3975
9. Paung-laung-sinsa 1 583
10. Me-haul 8 5857
Source: Forest Department, Pyinmana
The area of Pyinmana Township was 792.00 square miles and it is one of the
main places of central Myanmar. Many reserved forests and agricultural farms are the

main source of township economy. Transportation and selling for products is very easy.
The land use type of Pyinmana is shown in Table 3.
Table 3. Land-Use type in Pyinmana Township
No. Land-use type Area (Acre)
1. Reserved forests
(a) Forest plantation area after establishment
(b) Plantation area as forest plantation next
140263
2. Non-reserved forest lands 233813
3. Agricultural land
(a) Farm land
(b) Ya land
(c) Gardenings
(d) Taungya
50590
21850
165
3200
4. Cultivated arable land 1829
5. Uncultivated arable land 55341
6. Forest lands (Included protection forests) 374076
Source: From MAS, Pyinmana Township
The primary data included the socio-economic characteristics of Taungya
cultivators (personal data); age, education, family size, farm size, number of family
number assisting in farming activities, years of experience in Taungya cultivation.
Economic data on farm assets, cropping patterns, cultivated crops, animal husbandry
condition, family income, household expenditure and labour cost, input and output level,
crop yield, production cost, etc. Personal data and economic data are combined as socio-
economic data. Land-use on cultivated system, fertilizer use, weeds control, water
resource, and using soil management practice are studied as other information.
Secondary data were gathered from the Forestry Department (FD) and Myanmar
Agricultural Service (MAS) office of Pyinmana Township. These secondary data were
used to study the basic steps in Taungya method, plantation diary of afforestation
procedure, wage of cultivators from the forest department, rainfall distribution, land-use
patterns in township and other knowledge information

Method of Analysis Collected data were transferred into the data sheets and identified and divided into
sub-groups to concerning items. These data were transferred again into Microsoft Excel
Programme. To calculate the summary of final results, the SPSS econometric software
programme was used. The Statistical Package for the Social Science (SPSS) (Nie at all,
1975) is designed for the analysis of farm and other survey. Benefit-cost ratio analysis
was used to determine the relative profitability of the crops. This ratio analysis is one of
the most widely used criteria in economic evaluation. Descriptive analysis was used for
the characteristics of the farm including physical, biological, social and economic aspects
of the farm and the farm households at a specified point in time.
III. RESULTS AND DISCUSSIONS
Special Teak Plantation by Way of Taungya in Study Area
Basic steps in Taungya plantation The reforestation system by way of Taungya method was the rehalibilitation to
the natural forest or economical forest with the collaboration of forest department and
Taungya farmers. In the every steps of plantation establishment, both concerned forest
officer and Taungya cultivators were taken part in this method which was very profitable
or symbiosis for them and can provide the national economy.
In Taungya cutting, the small trees like herbs and shrubs, the underground- roots,
creepers and twinners were cut first. After that fire protection road was prepared. The fire
line of 4.5 meters wide is made around the plantation. Ya burning was started in April.
Depending on the weather condition, burning can be varied. After burning, almost all the
trees and bamboos are incinerated but the rhizome, stem and roots of larger trees are
unburned and remained. After burning process, the unburned and remained debris is
collected, piled up and burn again. This operation is called the “Kyun-kwe” and finished
in second week of May. After the plantation compartment is completely burnt, staking is
carried out in which 1-meter long bamboo stakes are used and put into the ground with a
spacing of (2.6 x 2.6) meters. Planting is started in the first week of June in rainy season.
Before planting, the seed collection nursery preparation should be done. For plantation,
the seeds were collected from the medium-aged (20-25 years old) plants because of

germination percentage. The collected seeds are dried in the sun at least three days and
placing in the water-filled bucket for one week. This operation is done at least three
times and the seeds are put into the seed-bed. The seed-bed is 15.243 m long and 1.219 m
wide and made up of coarse sand. If one pair of true leaf and one pair of seed leaf is
completed, the seed is well germinated. The seedlings from nursery preparation of seed-
bed is qualitatively developed and transferred into plastic bags. These plastic bags must
have the four poles to control the water and air. The germination percentage of the
seedlings in the seed-bed is considered as 20%.
In the process of planting, direct seeding from the stumping process and
cultivation to the seedling is differed depend upon the soil type. First weeding is started
in July, not only the forest staffs and Taungya cultivators but also the hired labours who
are taken part in weeding operation. After first weeding, patching is continuously done.
Patching is the completing or supplement of seedlings to the unsuccessful or dead
seedlings. The second weeding is started in September and end in mid-October. The third
weeding is doing in November.
The counting of survival plants is made in first week of December and is called
“December counting”. All of these operations are supervised by the Forest Department.
After the stage of planting, Taungya farmers are allowed to cultivate their agricultural
crops in the blank space between the stakes.
General Characters of Taungya Cultivators Traditionally, the poor rural people have much attachment to the native place and
unwilling to shift themselves to the new surroundings for land. But in order to reduce the
degradation of forest and to raise the living standard of rural farmers near the forest, the
controlled agro-forestry typed shifting cultivation (or) Taungya method is used by the
forest department. In other way, with the increase of population in their families and
community, more land is needed for the increased production of staple food. In study
areas, almost all of the households are generally poor farmers. Their life style is very
simple and they are honest. Most of the farmers lived in near the villages but some are
new immigrants coming from the other related townships. People in this area are engaged
in different occupations; farmers, construction labors, shopkeeper, the retired staffs, and

the majority are landless and no employments. So, all have the requirements of
agricultural land for their livelihood.
Some Taungya farmers have their own permanent houses in the villages or other
related townships during a few kilometers or a few miles away from the plantation site.
But they have very small temporary houses near the forest plantation. Their major
problem is landless and difficult to life persistence. Therefore, they shifted into the forest
and get agricultural land and employment opportunities. Their socio-economic status is
marginal because their institutional system as the Taungya cultivators is not perfect to
their economy and fairly obtains the daily-bread. So, their children wanted to participate
in Taungya plantation for their insufficient family income.
All households cultivate with an average lot at least 3 acres per family as their
farm land and have small vegetable garden for domestic (home) consumption. Some
farmers have inadequate rice for daily consumption in some reasons and needed to
borrow money at sometimes from their friends or relatives. They remain fairly constraints
throughout the year.
Demographic Characteristics of Sample Cultivators The demographic characteristics of the sample Taungya cultivators were shown in
Table 4. Age of household head, the average farm size, and experience in Taungya, the
average use of family labour, the classification of family size and their educational status
were presented. The mean age of the sample household head was 38 years and the
minimum and maximum ages were 17 and 72 years. Their average farm size was 5 acres
and the minimum size of farm was 2 acres. The maximum farm size of sample
respondents was 15 acres depending upon the size of the family. Some cultivators were
old service in Taungya and they have much experience, however, some have little
knowledge. The mean value of their experience in Taungya cultivation was 12 years
while the maximum and minimum experiences were 1 and 30 years. All of the
households used family labour for their farming activities. The mean number of family
labour was 3 and the minimum and maximum labours were 1 and 6 respectively.
The sample household had average 1 child (under 15 years old) and the maximum
number was 5. The mean number of adult male and female was 1 and the minimum and

maximum numbers were 1 to 5 and 4. The mean value of total family size was 4 in study
area but 2 and 12 were the minimum and maximum of total household size.
With regard to educational attainment, the sample cultivators were classified
according to years of schooling. About 43% of the sampled cultivators were no attention
to basic educational primary school. It was defined as monastery education. Those who
had less than 5 years of schooling had primary education and it was about 51%. Those
who had 5 to 8 years of schooling had secondary education and it was found only 5%.
They had no high school educational attainment and no graduate.
Table 4. Demographic characteristics of sample cultivators in survey area.
43.2451.355.41
PercentPercentPercent
Education(1) Monastery Edu;(2) Primary Edu;(3) Secondary Edu;
2.201224.59NumberTotal Family Size
1.010.950.95
545
111
1.831.741.81
NumberNumberNumber
Family size(1) Adult male(2) Adult female(3) Child
1.44613.02NumberFamily Labor
8.6930112.08YearExperience
3.051525.58AcresFarm size
14.35721738.16YearsAge
Std DeviationMaximumMinimumMeanUnitsCharacteristics
Cropping Patterns and Crops Growing by Taungya Cultivators
The major cultivated crops of Taungya cultivators are paddy (Le), paddy (Ya),
groundnut, and sesame. During the summer time, the Taungya cultivators cut down the
trees and bushes (Ya cutting), burning and reburning (Kyunkhwe) to get the agricultural
land. Ploughing and planting of paddy was started with the help of monsoon. Groundnut
and sesame were grown in winter season. The majority of cultivators were planted the
paddy (Le and Ya), paddy (Le) or paddy (Ya) for their daily consumption. The
cultivation of groundnut and sesame were used for their selling commodity and maize
was for their snack. The percentage of cultivators to Le, Ya, groundnut, maize and
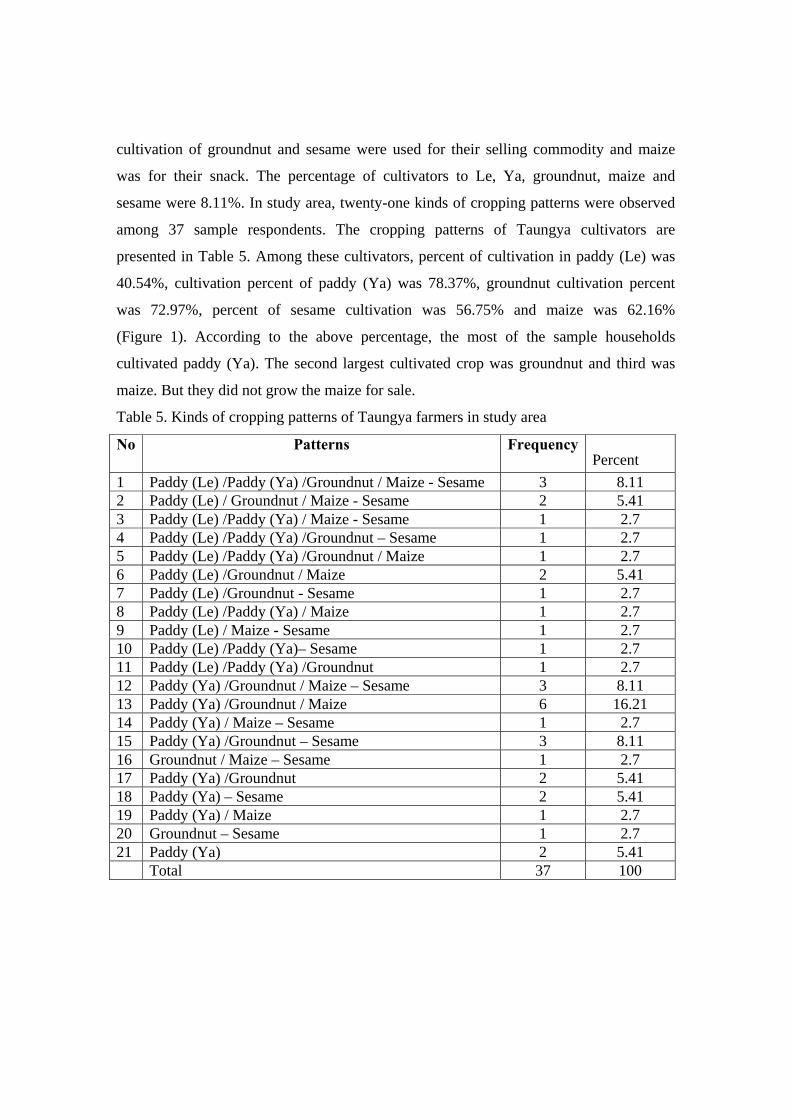
sesame were 8.11%. In study area, twenty-one kinds of cropping patterns were observed
among 37 sample respondents. The cropping patterns of Taungya cultivators are
presented in Table 5. Among these cultivators, percent of cultivation in paddy (Le) was
40.54%, cultivation percent of paddy (Ya) was 78.37%, groundnut cultivation percent
was 72.97%, percent of sesame cultivation was 56.75% and maize was 62.16%
(Figure 1). According to the above percentage, the most of the sample households
cultivated paddy (Ya). The second largest cultivated crop was groundnut and third was
maize. But they did not grow the maize for sale.
Table 5. Kinds of cropping patterns of Taungya farmers in study area
No Patterns Frequency Percent
1 Paddy (Le) /Paddy (Ya) /Groundnut / Maize - Sesame 3 8.11 2 Paddy (Le) / Groundnut / Maize - Sesame 2 5.41 3 Paddy (Le) /Paddy (Ya) / Maize - Sesame 1 2.7 4 Paddy (Le) /Paddy (Ya) /Groundnut – Sesame 1 2.7 5 Paddy (Le) /Paddy (Ya) /Groundnut / Maize 1 2.7 6 Paddy (Le) /Groundnut / Maize 2 5.41 7 Paddy (Le) /Groundnut - Sesame 1 2.7 8 Paddy (Le) /Paddy (Ya) / Maize 1 2.7 9 Paddy (Le) / Maize - Sesame 1 2.7 10 Paddy (Le) /Paddy (Ya)– Sesame 1 2.7 11 Paddy (Le) /Paddy (Ya) /Groundnut 1 2.7 12 Paddy (Ya) /Groundnut / Maize – Sesame 3 8.11 13 Paddy (Ya) /Groundnut / Maize 6 16.21 14 Paddy (Ya) / Maize – Sesame 1 2.7 15 Paddy (Ya) /Groundnut – Sesame 3 8.11 16 Groundnut / Maize – Sesame 1 2.7 17 Paddy (Ya) /Groundnut 2 5.41 18 Paddy (Ya) – Sesame 2 5.41 19 Paddy (Ya) / Maize 1 2.7 20 Groundnut – Sesame 1 2.7 21 Paddy (Ya) 2 5.41 Total 37 100

0
10
20
30
40
50
60
70
80
Paddy(Le) Paddy(Ya) Ground-nut Sesame Maize
Figure 1. Percent of cultivators with respect to different crops.
Assets of Sample Respondents in Survey Area
In the survey area, it was observed that the farmers owned small houses. Some
family possessed middle status house and some cultivators owned the lowest valued
houses. Due to the conditions of the houses, those were divided into three types. The first
type was the least valued house, which is made up of Thekke and bamboo as roof, shield
and floor, and the value was less than or equal to thirty thousands kyat. Percent of this
home type was the largest in sample households and it was 51.35%. The value of second
type home was between thirty thousands and fifty thousands kyat. This type of home
used Thekke, bamboo, and wood as roof, shield and floor and the percent was 35.31%. In
survey area, the highest value of house was greater than fifty thousands kyat and this type
has been possessed by a few cultivators. The cultivators in higher income group
possessed the good condition of house. In this type, iron-roof, wood and bamboo were
used and the percent of highest valued house was 13.51%.
In sample households, the percent owned of television was the least and 2%. The
percent of radio owning was 22%. Some cultivators used bicycle for travel and the
percent was 6%. The owned percent of battery was 14%.
Percent holding of farm and livestock assets per household were presented in
Figure 2. Chopper, axe and spade were used for Ya cutting by the Taungya cultivators
(Figure 3). Chopper is cheap to buy possessing almost all of these cultivators. Plough,

harrow, and sickle were kept as useful materials for land preparation, crops production
and harvesting. Cattle and cart were used not only for land preparation and crop
production but also used for the carrying of fire-wood and crops and other income
activities.
All cultivators in study area had on average 2 hoes and sickles; owned average 1
or 2 axes and spades owned per household. Plough and harrow were not possessed by
low income households who tendered those materials from higher income groups when
they are required. Taungya cultivators who had higher income groups possessed the carts
in small percent.
0102030405060708090
100
Hoe
Cho
pper
Axe
Sick
le
Spad
e
Plou
gh
Har
row
Car
t
Figure 2. Farm assets percentage owned by the Taungya cultivators
Figure 3. Some farm assets using in Taungya plantation and farming activities
In study area, the cultivators raised the three main livestock animals; cattle,
poultry and pig. Low income cultivators had no cattle and pig. On the other hand, the

higher income families raised the cows or buffalos for land preparation, manure
production and breeding. Middle and high income families had 1 to 4 buffalos or cows.
The Taungya cultivators in all income groups raised the poultry and poultry raising is a
quick source of cash income. Low income cultivators had 5 to 10 poultries whereas
middle and higher income groups had more than 10. It was clearly indicated that the
higher income cultivators of survey area had the highest animal value on average for
household. Therefore, the majority of backyard livestock animals (cows, buffalos and
pigs) were found as manure production and cash income in higher income groups in
study area (Figure 4).
0
5
10
15
20
25
30
Num
ber o
f Cul
tivat
ors
Cattles Poultry pigs
Figure 4. Livestock husbandry in Taungya cultivation
Incomes and Expenditure of Sample Households in Survey Area In study area, income share of sample respondents were categorized into three
based on the information of survey data. The average income component of Taungya
cultivators were presented in Figure 5. The survey data was clearly observed that the
households got mainly their income from three sources; farm income, off-farm income
(or) agricultural wage income, non-farm income, and Norn from the forest department. In
farm income, income from field crops products, vegetables and selling of livestock (i.e.
poultries) were included. In study area, it was evidently showed that the income from
farm activities was 52% of total income.
Taungya cultivators obtained some amount of income from agricultural off-farm
activities (i.e. land preparation and seasonal daily labour). Their off-farm income is 18%

of total income component in study area. Non-farm income depends on a variety of
unseasonable and non-farm jobs such as making charcoal kiln, labour in construction
site, shopkeeper, government employee, selling fire-wood, renting of carts and buffalos,
bamboo cutter, bamboo-shoot collection, digging to the medicinal plants and roots and
honey collection. The non-farm income of sample households can be seen equal to their
off-farm income.
Norn is the income from the collaboration in teak plantation (or) Taungya system
of forest department. Norn is the extra income of Taungya cultivators and they can get
from those activities such as Ya cutting, building to fire protection roads, ploughing and
reburning, stake collection, planting, weeding, patching, fire protection on plantation site
and survival counting. The income from the forest department is 12% of their total
income.
18%
18%12%
52%
Farm income Off-farm income Non-farm income Norn
Figure 5. Income components of Taungya cultivators
Figure 6 showed the yearly expenditure of sample households. They used 77% of
total cost for food. The cultivators can get the rice as part of their daily bread from their
farms. However, they had brought some things for curry such as oil, meat, fish, pulses,
onion, garlic, chili powder, potato, pepper, egg, salt, seasonal powder, and spices.
Furthermore, clothes and other household tools such as candle, kerosene, cosmetics, soap,
soap-powder and paste were used as non-food materials in 9%.

The sample household in survey area expensed 2% of their income for health and
used 1% for social cases. In most families, 6% and 2% were used for school fee and fire-
wood as basic services of basic needs. Transportation cost per year was 3% but most
people used their own foot in some distance. The expenditure of sample households can
vary depending upon their family size.
0
10
20
30
40
50
60
70
80
Perc
ent o
f cos
t
Food
Non-food
Health
Social
School fe
e
Transp
ortatio
n
Firewood
Food Non-food Health Social School fee Transportation Firewood
Figure 6. Percent of household expenditure of the sample respondents in a year
Cost of Production for Cultivated Crops Grown by the Taungya Cultivators In survey area, the Taungya cultivators had grown some species of rice
suitable to the climate. The most cultivated species are Khon-ni, Phyu-lon-yin and Pearl-
thwe. Their cultivation and yield of crops were depending upon the weather conditions
and material inputs. In hilly lands, rice growing is very difficult to get high yield. Almost
the entire sample household planted the paddy (Ya) for their daily consumption. Taungya
farmers used the series of sequences; slashing and site cleaning (land preparation),
planting with stick, weeding, harvesting and threshing. So, family labour and hired labour
were needed for these growing.
For the cultivation of Taungya paddy, land preparation is firstly required after the
first rain. To plant 1 acre of Ya-paddy field, 55% of labour cost for slashing and site

cleaning was used. Seed cost is 5% and they used the sticking way to cultivate. Weeding
is required at least two or three times during the growth stages in rice production (Ya).
High amount of labour are needed for harvesting and threshing procedure.
28% of hired labour and 55% of family labour were used for the growing of 1
acre of Taungya paddy cultivation. In study area, the average farm size for Ya paddy is
1.61 acre and it depends upon the family size of household. It means that bigger the
family size, it has higher the power of working activities and farm size is more and more
large. The share of cost for rice production (Ya) is presented in Figure 7.
55%
5%12%
28%
Labor cost for S & S Seed cost H.la cost F.la cost
Figure 7. Percent contribution of cost components in growing for rice production (Ya)
Some Taungya cultivators in study area had grown the rice production (Le) in
valley and flat lands. The rice cultivation in Le is very familiar with cultivators and the
yield is high. However, three-quarter of Taungya farmers can plant the rice cultivation
(Le) because of their taking of land state during the allotment of farm land from the forest
department.
The soil condition of study area is sandy silt and very soft in monsoon. So, the
land preparation for rice production (Le) can be negligible. The yield of paddy (Le) is
normally 4 or 5 times higher than the paddy (Ya). Because, the planting steps of Le and
Ya are different and the rice production (Le) is more systematic. The Taungya farmers
used these planting sequences in Le; ploughing and harrowing (some had no land
preparation), nursery preparation, uprooting, transplanting, weeding, harvesting and
threshing.
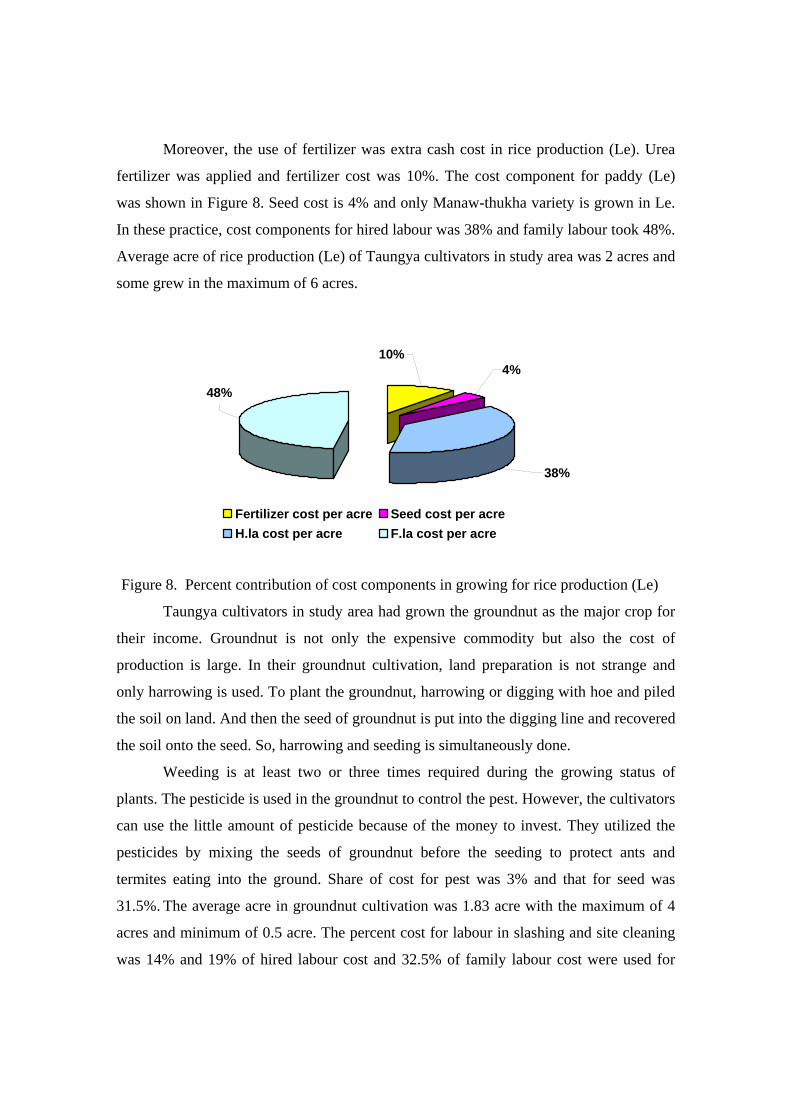
Moreover, the use of fertilizer was extra cash cost in rice production (Le). Urea
fertilizer was applied and fertilizer cost was 10%. The cost component for paddy (Le)
was shown in Figure 8. Seed cost is 4% and only Manaw-thukha variety is grown in Le.
In these practice, cost components for hired labour was 38% and family labour took 48%.
Average acre of rice production (Le) of Taungya cultivators in study area was 2 acres and
some grew in the maximum of 6 acres.
10%4%
38%
48%
Fertilizer cost per acre Seed cost per acreH.la cost per acre F.la cost per acre
Figure 8. Percent contribution of cost components in growing for rice production (Le)
Taungya cultivators in study area had grown the groundnut as the major crop for
their income. Groundnut is not only the expensive commodity but also the cost of
production is large. In their groundnut cultivation, land preparation is not strange and
only harrowing is used. To plant the groundnut, harrowing or digging with hoe and piled
the soil on land. And then the seed of groundnut is put into the digging line and recovered
the soil onto the seed. So, harrowing and seeding is simultaneously done.
Weeding is at least two or three times required during the growing status of
plants. The pesticide is used in the groundnut to control the pest. However, the cultivators
can use the little amount of pesticide because of the money to invest. They utilized the
pesticides by mixing the seeds of groundnut before the seeding to protect ants and
termites eating into the ground. Share of cost for pest was 3% and that for seed was
31.5%. The average acre in groundnut cultivation was 1.83 acre with the maximum of 4
acres and minimum of 0.5 acre. The percent cost for labour in slashing and site cleaning
was 14% and 19% of hired labour cost and 32.5% of family labour cost were used for

other planting process. The yield of groundnut is related to the inputs of seeds and natural
weather conditions. The Figure 9 showed the percent cost component for the growing of
groundnut.
19%
3%
14%
31.5%
32.5%
Pest control Labour cost for S&S Seed cost H.La cost F.La cost
Figure 9. Percent contribution of cost components in growing for groundnut
production
Other major crop for Taungya cultivators in survey area is sesame. However,
sesame is very sensitive crop to climatic conditions. In study area, sesame was grown
between later monsoon and early winter. To plant the sesame, 20% of total was used for
labour cost in slashing and site cleaning is used. The variety is boat and seed cost is 27%.
The cultivators used the direct spreading of seed with large amount of seeds to grow the
successful plants during even the bad weather conditions.
One or two times of weeding are required and the bundles of sesame are dried in
sun after harvesting. The dried sesame bundles are threshing and cleaning to sell. For the
planting of sesame, 16% of hired labour cost and 37% of family labour cost are used. The
average farm size of sesame in study area is 3.04 acres and the maximum cultivated acre
was 7 acres and the minimum is 1 acre. The percent of cost component for the cultivation
of sesame is shown in Figure 10 and Figure 11 is represented the average farm size of
sample households in study area.

37% 20%
27%16%
Labour cost for S&S Seed cost H.La cost F.La cost
Figure 10 Percent contribution of cost components in growing for sesame production
00.5
11.5
22.5
33.5
Ave
rage
Are
a
Rice (Le) Rice(Ya) Groundnut Sesame
Crops
Figure 11. Average areas grown by different crops
Economic Analysis of Growing Crops in Survey Area In study area, the Taungya cultivators planted the paddy (Le,Ya), groundnut and
sesame as major crops. To know the profitability of these crops, cost and return analyses
were utilized. In these analysis, four profitability measures were computed, namely, gross
benefit (GB), return above variable cost (RAVC), return above cash cost (RACC), and
benefit-cost ratio (BCR). GB of rice production (Ya) was Ks.14650/acre, rice production
(Le) was Ks. 62933/acre, groundnut production was Ks. 39240/acre and sesame
production was Ks.26856/acre respectively. TVC of rice (Ya) was Ks.24551/acre
however, in rice production (Le), fertilizer cost was extra cash cost and TVC was Ks.
41632/acre. In groundnut, pest control cost was cash cost and TVC was Ks. 17880/acre

and sesame was Ks. 13444/acre. In total variable cash cost, family labour cost is not
considered and it is the total cash cost. TVCC of the cultivated crops were Ks.
11308/acre, Ks.25002/acre, Ks.10613/acre and Ks. 7099/acre respectively. In the TVCC
of rice production (Le) and groundnut, fertilizer cost and pest control cost are cash costs.
Return above variable cost (RAVC) is the difference of gross benefit and total
variable cost. RAVC of the crops in study area are Ks. – 9901/acre for (Ya), Ks.
21300/acre for (Le), ks.21359/acre for groundnut and Ks.13411/acre for sesame
respectively. The RAVC of rice production (Ya) is the negative value because in total
variable cost of (Ya) rice is family labour cost in the calculation.
Return above cash cost (RACC) means the difference between the gross benefit
and total variable cash cost. RACC of the grown crops in survey area were Ks. 2341/acre
for rice production (Ya), Ks.37930/acre for (Le), Ks.28626/acre for groundnut and
Ks.19756/acre for sesame respectively. Benefit-cost ratio is the division of the gross
benefit and total variable cash cost. BCR of the cultivated crops were 1.29 for rice
production (Ya), 2.51 for (Le), 3.69 for groundnut and 3.78 for sesame respectively.
If the profitability of the cultivated crops were compared, the profit of the rice
production Ya has the negative value in Ks.-9901/acre. However, it is not assumed as
loss because return above variable cost is used in profit calculation and including family
wage. The net profit or return above variable cost of Le and groundnut were not different
and RAVC of sesame has incentive to grow. The Figure 11 showed the net profit or
RAVC of the cultivated crops in study area.
On the other hand, if the return above cash cost of the planted crops were
compared, the RACC of rice production (Ya) has the positive value Ks. 2341/acre.
Because, in the calculation of the RACC of the rice production (Ya), the family labour
cost is not considered so the RACC of (Ya) had the positive value. Within the
comparison of RACC of the cultivated crops, RACC of rice production (Le) was the
highest (Ks. 37930/acr). RACC of groundnut is the second highest value (Ks.
28626/acre) and that of sesame was third (Ks.19756/acre). Cultivation of rice production
(Ya) got the least RACC value of (Ks.2341/acre). The RACC of the cultivated crops were
compared in Figure. 12.

-10000
-5000
0
5000
10000
15000
20000
25000
Prof
it in
Ks
per a
cre
Ya Le Groundnut SesameCrops
Ya Le Groundnut Sesame
Figure 11 Comparison of profitability of the main crops in Taungya.
05000
10000150002000025000300003500040000
Ret
urn
abov
e ca
sh c
ost
per a
cre
Ya Le Groundnut Sesame
CropsYa Le Groundnut Sesame
Figure 12 Comparison of the RACC of the cultivated crops.