reflections on supply chain excellence in the context … on supply chain excellence in the context...
TRANSCRIPT
1
Reflections on Supply Chain Excellence in the context of trends in the globalbusiness environmentJune 2016
Content
Trends 3
Supply Chain Concepts 14
Supply Chain Excellence 26
Syncronic’s Business Consulting Methodology 34
Case descriptions 40
2
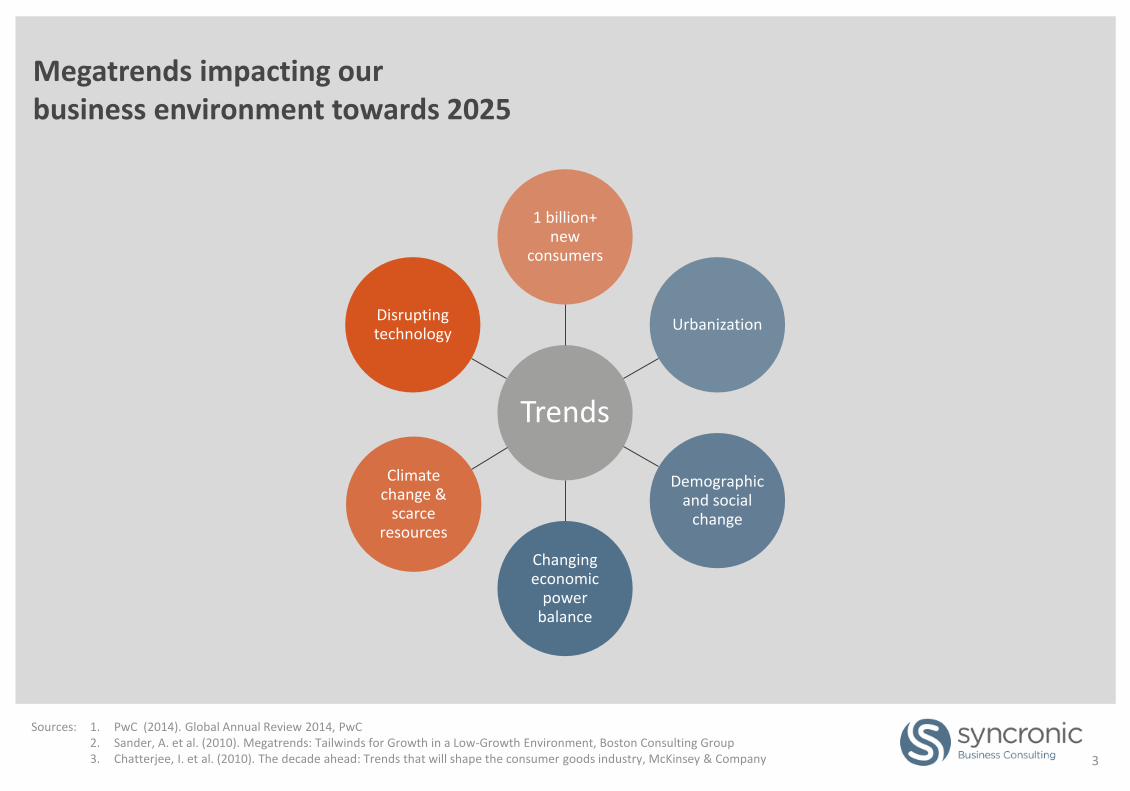
Megatrends impacting our business environment towards 2025
Trends
1 billion+ new
consumers
Urbanization
Demographic and social
change
Changing economic
power balance
Climate change &
scarce resources
Disrupting technology
Sources: 1. PwC (2014). Global Annual Review 2014, PwC2. Sander, A. et al. (2010). Megatrends: Tailwinds for Growth in a Low-Growth Environment, Boston Consulting Group3. Chatterjee, I. et al. (2010). The decade ahead: Trends that will shape the consumer goods industry, McKinsey & Company 3
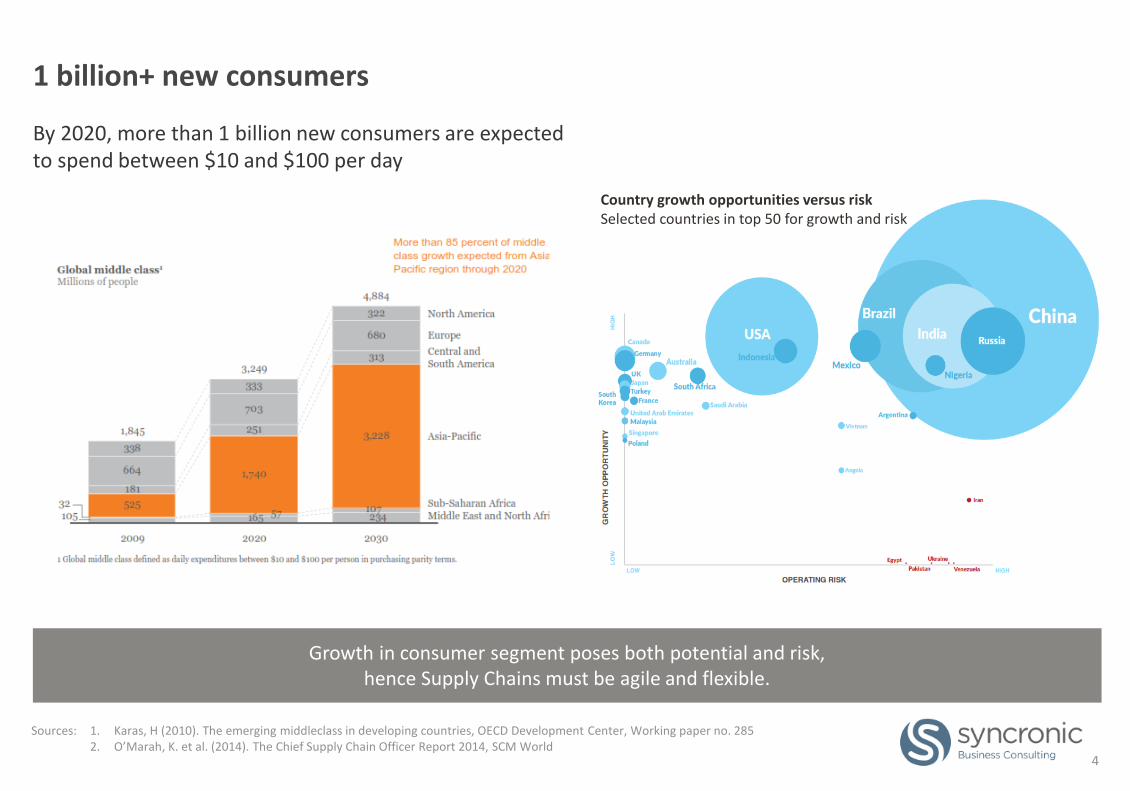
1 billion+ new consumers
By 2020, more than 1 billion new consumers are expected to spend between $10 and $100 per day
Country growth opportunities versus riskSelected countries in top 50 for growth and risk
Growth in consumer segment poses both potential and risk,hence Supply Chains must be agile and flexible.
1. Karas, H (2010). The emerging middleclass in developing countries, OECD Development Center, Working paper no. 2852. O’Marah, K. et al. (2014). The Chief Supply Chain Officer Report 2014, SCM World
4
Sources:
Urbanization
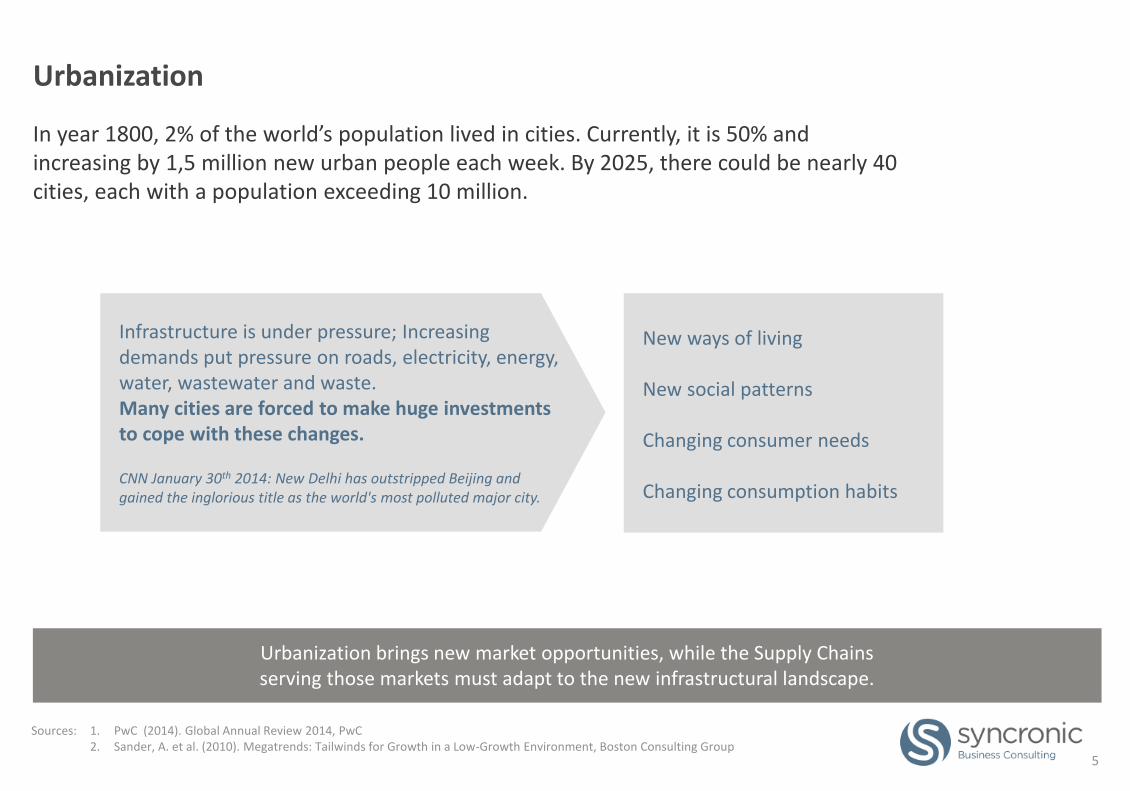
In year 1800, 2% of the world’s population lived in cities. Currently, it is 50% and increasing by 1,5 million new urban people each week. By 2025, there could be nearly 40 cities, each with a population exceeding 10 million.
Urbanization brings new market opportunities, while the Supply Chains serving those markets must adapt to the new infrastructural landscape.
Infrastructure is under pressure; Increasing demands put pressure on roads, electricity, energy, water, wastewater and waste. Many cities are forced to make huge investments to cope with these changes.
CNN January 30th 2014: New Delhi has outstripped Beijing and gained the inglorious title as the world's most polluted major city.
New ways of living
New social patterns
Changing consumer needs
Changing consumption habits
1. PwC (2014). Global Annual Review 2014, PwC2. Sander, A. et al. (2010). Megatrends: Tailwinds for Growth in a Low-Growth Environment, Boston Consulting Group
5
Sources:
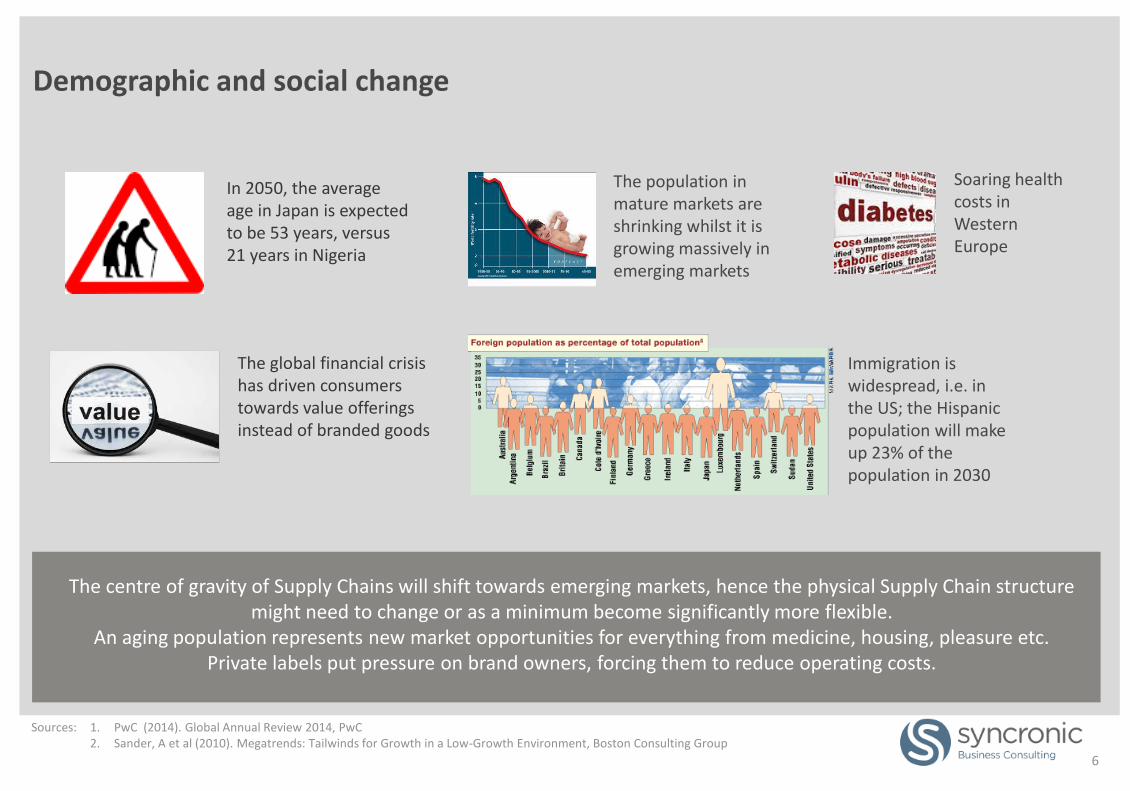
The centre of gravity of Supply Chains will shift towards emerging markets, hence the physical Supply Chain structure might need to change or as a minimum become significantly more flexible.
An aging population represents new market opportunities for everything from medicine, housing, pleasure etc. Private labels put pressure on brand owners, forcing them to reduce operating costs.
Demographic and social change
The global financial crisis has driven consumers towards value offerings instead of branded goods
The population in mature markets are shrinking whilst it is growing massively in emerging markets
Immigration is widespread, i.e. in the US; the Hispanic population will make up 23% of the population in 2030
Soaring health costs in Western Europe
In 2050, the average age in Japan is expected to be 53 years, versus 21 years in Nigeria
Sources: 1. PwC (2014). Global Annual Review 2014, PwC2. Sander, A et al (2010). Megatrends: Tailwinds for Growth in a Low-Growth Environment, Boston Consulting Group
6
Changing economic power balance
• October 2014: China became the world's largest economy followed by the US (IMF)
• Annual infrastructure spending will more than double by 2025 – previously, these spending were largest in Western Europe, but by 2025 60% will be in the Asia Pacific region
• Emerging markets will
• Challenge developed markets in producing high end products
• Have highly talented people leading global multinationals
• Developed countries will benefit from re-shoring (near shoring, in sourcing) as wage differentials will cancel out
There is a big market potential to be explored, but the associated operating risks will force Supply Chains to cope with uncertainty by being agile and flexible.
Sources: 1. PwC (2014). Global Annual Review 2014, PwC
7
Climate change & scarce resources
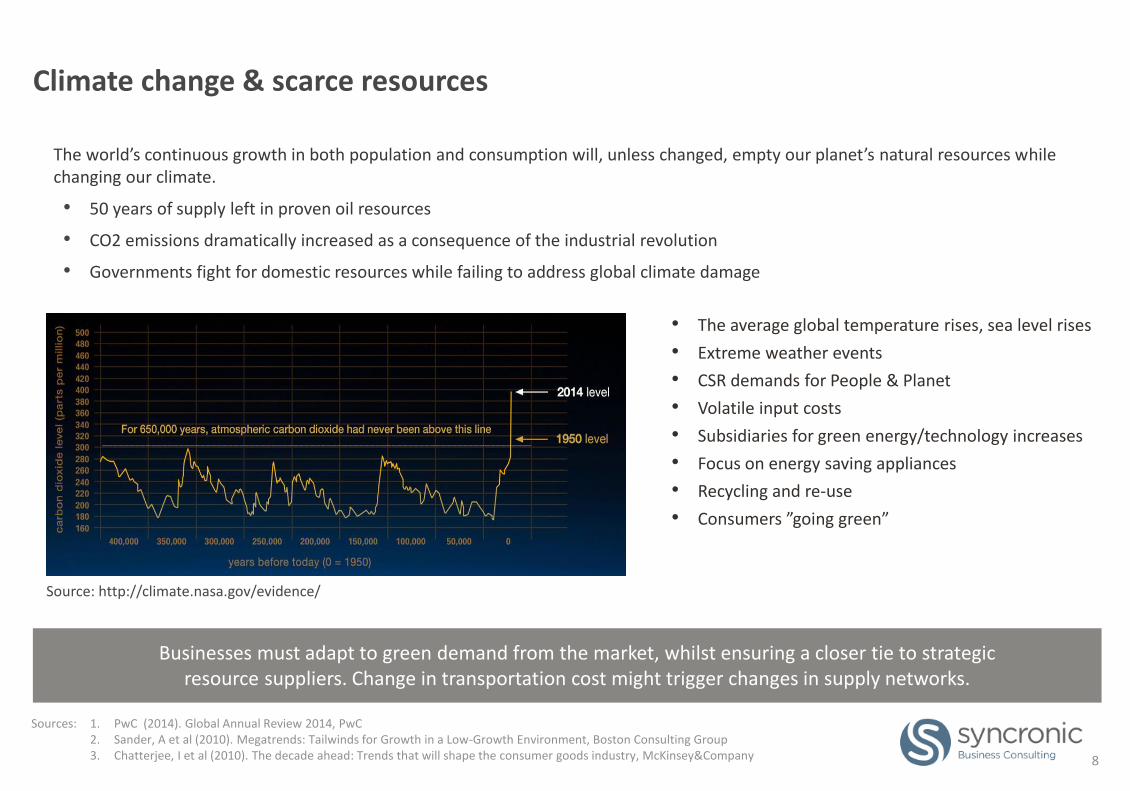
The world’s continuous growth in both population and consumption will, unless changed, empty our planet’s natural resources while changing our climate.
• 50 years of supply left in proven oil resources
• CO2 emissions dramatically increased as a consequence of the industrial revolution
• Governments fight for domestic resources while failing to address global climate damage
Businesses must adapt to green demand from the market, whilst ensuring a closer tie to strategic resource suppliers. Change in transportation cost might trigger changes in supply networks.
• The average global temperature rises, sea level rises
• Extreme weather events
• CSR demands for People & Planet
• Volatile input costs
• Subsidiaries for green energy/technology increases
• Focus on energy saving appliances
• Recycling and re-use
• Consumers ”going green”
Source: http://climate.nasa.gov/evidence/
Sources: 1. PwC (2014). Global Annual Review 2014, PwC2. Sander, A et al (2010). Megatrends: Tailwinds for Growth in a Low-Growth Environment, Boston Consulting Group3. Chatterjee, I et al (2010). The decade ahead: Trends that will shape the consumer goods industry, McKinsey&Company 8
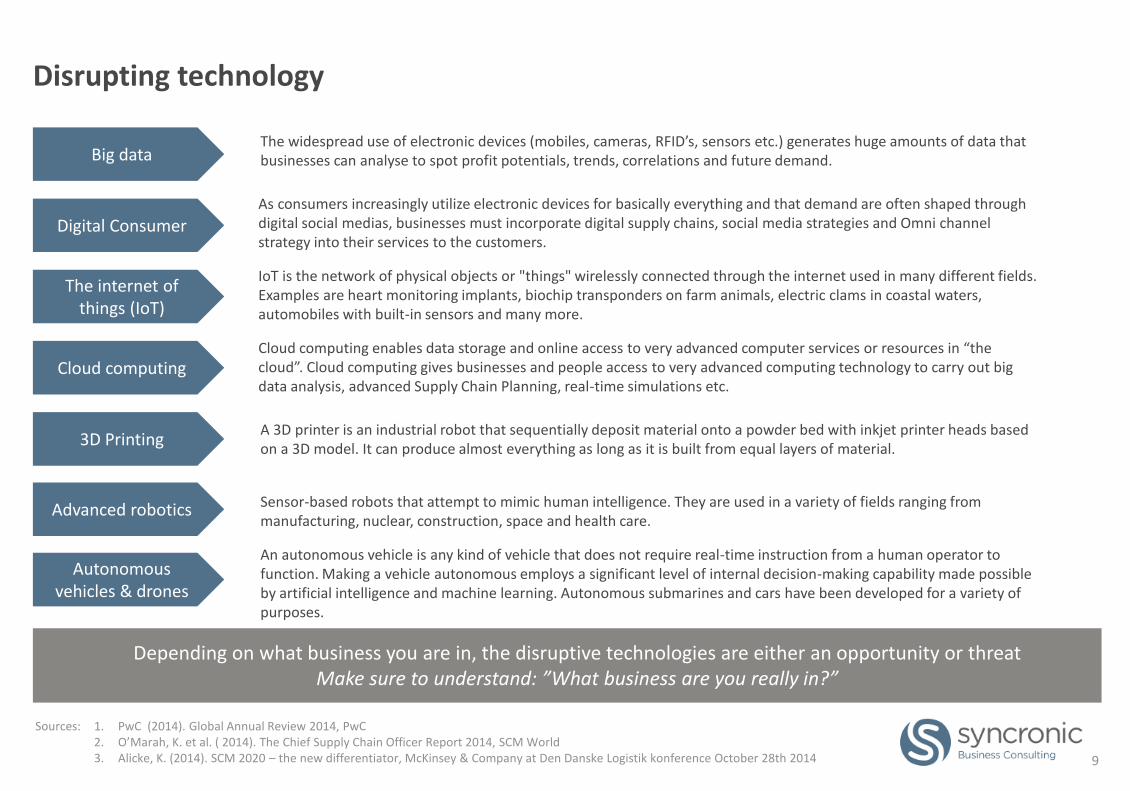
Disrupting technology
Big data
The internet of things (IoT)
Cloud computing
3D Printing
Advanced robotics
Autonomous vehicles & drones
Digital Consumer
Depending on what business you are in, the disruptive technologies are either an opportunity or threat Make sure to understand: ”What business are you really in?”
The widespread use of electronic devices (mobiles, cameras, RFID’s, sensors etc.) generates huge amounts of data that businesses can analyse to spot profit potentials, trends, correlations and future demand.
IoT is the network of physical objects or "things" wirelessly connected through the internet used in many different fields. Examples are heart monitoring implants, biochip transponders on farm animals, electric clams in coastal waters, automobiles with built-in sensors and many more.
Cloud computing enables data storage and online access to very advanced computer services or resources in “the cloud”. Cloud computing gives businesses and people access to very advanced computing technology to carry out big data analysis, advanced Supply Chain Planning, real-time simulations etc.
A 3D printer is an industrial robot that sequentially deposit material onto a powder bed with inkjet printer heads based on a 3D model. It can produce almost everything as long as it is built from equal layers of material.
Sensor-based robots that attempt to mimic human intelligence. They are used in a variety of fields ranging from manufacturing, nuclear, construction, space and health care.
An autonomous vehicle is any kind of vehicle that does not require real-time instruction from a human operator to function. Making a vehicle autonomous employs a significant level of internal decision-making capability made possible by artificial intelligence and machine learning. Autonomous submarines and cars have been developed for a variety of purposes.
As consumers increasingly utilize electronic devices for basically everything and that demand are often shaped through digital social medias, businesses must incorporate digital supply chains, social media strategies and Omni channel strategy into their services to the customers.
Sources: 1. PwC (2014). Global Annual Review 2014, PwC2. O’Marah, K. et al. ( 2014). The Chief Supply Chain Officer Report 2014, SCM World3. Alicke, K. (2014). SCM 2020 – the new differentiator, McKinsey & Company at Den Danske Logistik konference October 28th 2014 9
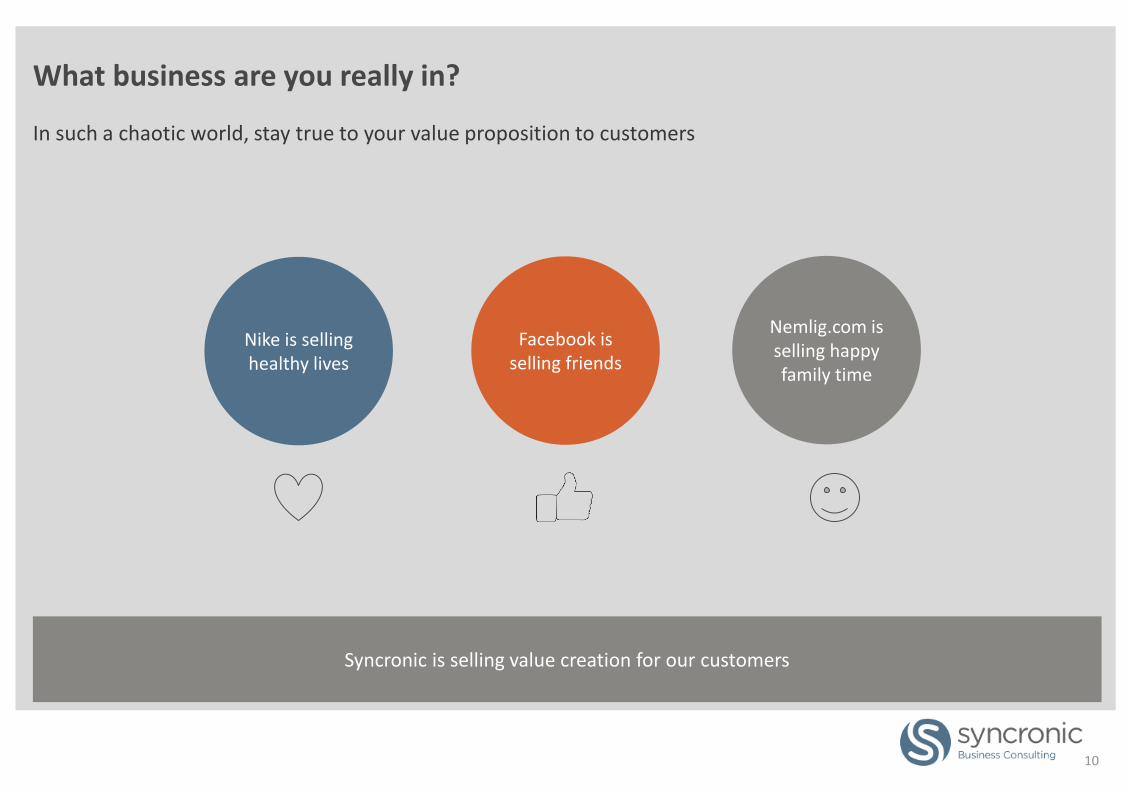
What business are you really in?
In such a chaotic world, stay true to your value proposition to customers
Facebook is selling friends
Nemlig.com is selling happy family time
Nike is selling healthy lives
Syncronic is selling value creation for our customers
10
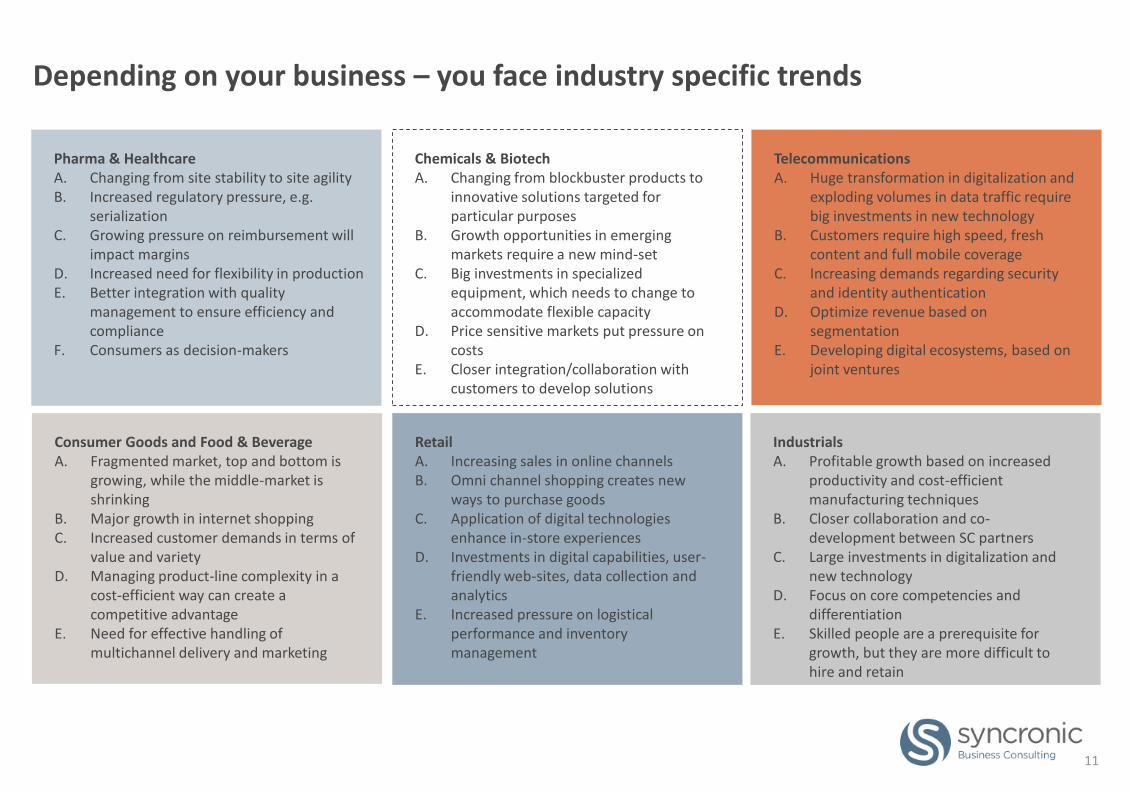
Depending on your business – you face industry specific trends
Pharma & HealthcareA. Changing from site stability to site agilityB. Increased regulatory pressure, e.g.
serializationC. Growing pressure on reimbursement will
impact marginsD. Increased need for flexibility in productionE. Better integration with quality
management to ensure efficiency and compliance
F. Consumers as decision-makers
Consumer Goods and Food & BeverageA. Fragmented market, top and bottom is
growing, while the middle-market is shrinking
B. Major growth in internet shoppingC. Increased customer demands in terms of
value and varietyD. Managing product-line complexity in a
cost-efficient way can create a competitive advantage
E. Need for effective handling of multichannel delivery and marketing
RetailA. Increasing sales in online channelsB. Omni channel shopping creates new
ways to purchase goodsC. Application of digital technologies
enhance in-store experiencesD. Investments in digital capabilities, user-
friendly web-sites, data collection and analytics
E. Increased pressure on logistical performance and inventory management
IndustrialsA. Profitable growth based on increased
productivity and cost-efficient manufacturing techniques
B. Closer collaboration and co-development between SC partners
C. Large investments in digitalization and new technology
D. Focus on core competencies and differentiation
E. Skilled people are a prerequisite for growth, but they are more difficult to hire and retain
Chemicals & BiotechA. Changing from blockbuster products to
innovative solutions targeted for particular purposes
B. Growth opportunities in emerging markets require a new mind-set
C. Big investments in specialized equipment, which needs to change to accommodate flexible capacity
D. Price sensitive markets put pressure on costs
E. Closer integration/collaboration with customers to develop solutions
TelecommunicationsA. Huge transformation in digitalization and
exploding volumes in data traffic require big investments in new technology
B. Customers require high speed, fresh content and full mobile coverage
C. Increasing demands regarding security and identity authentication
D. Optimize revenue based on segmentation
E. Developing digital ecosystems, based on joint ventures
11
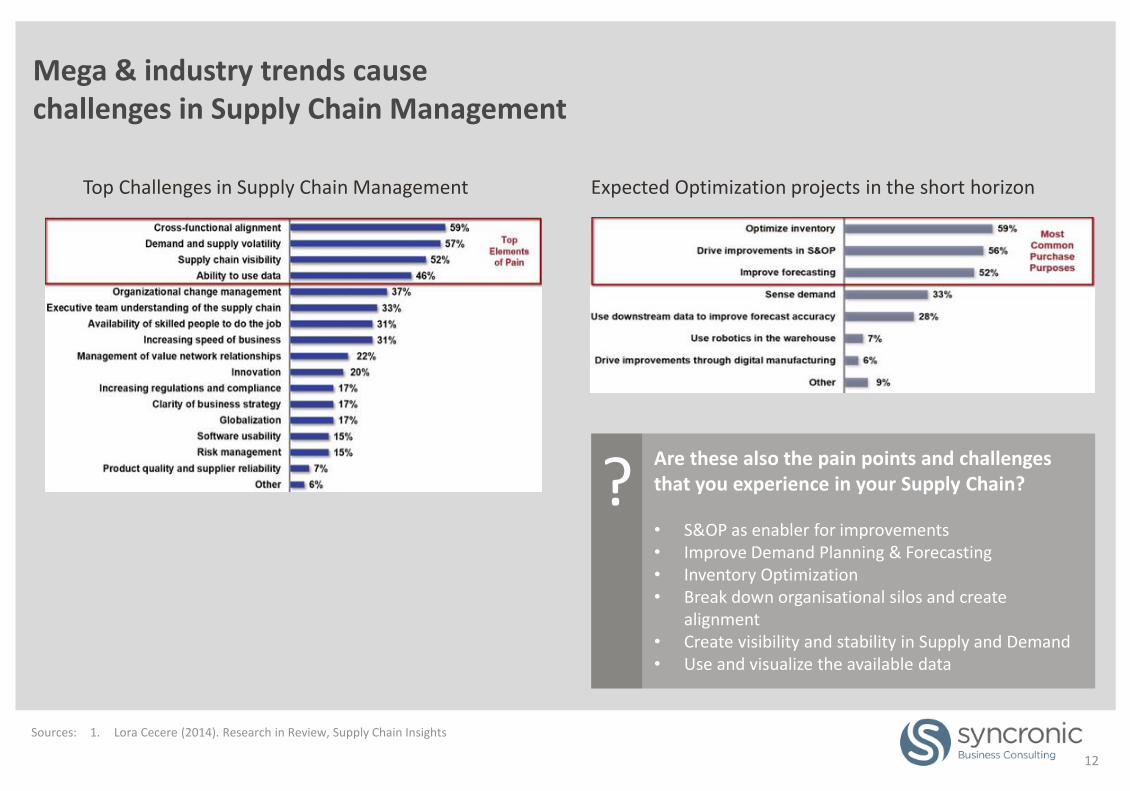
Mega & industry trends cause challenges in Supply Chain Management
Top Challenges in Supply Chain Management Expected Optimization projects in the short horizon
Sources: 1. Lora Cecere (2014). Research in Review, Supply Chain Insights
12
Are these also the pain points and challenges that you experience in your Supply Chain?
• S&OP as enabler for improvements• Improve Demand Planning & Forecasting• Inventory Optimization• Break down organisational silos and create
alignment• Create visibility and stability in Supply and Demand• Use and visualize the available data
?
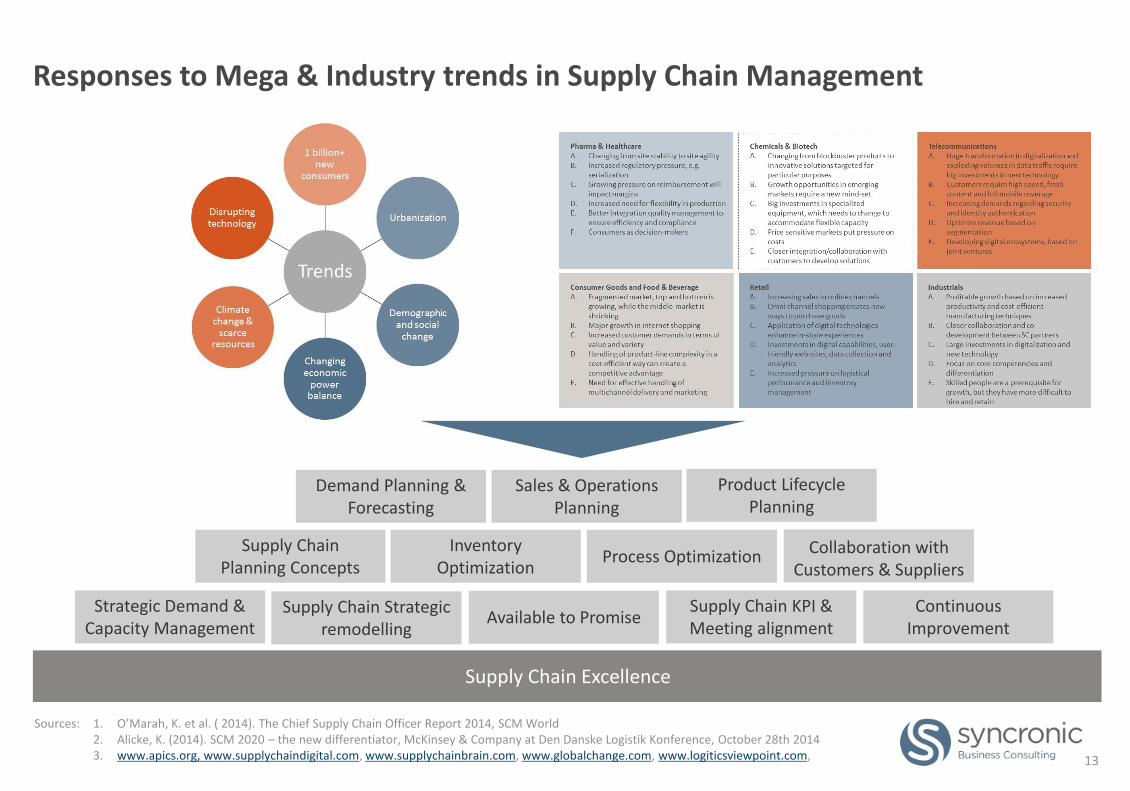
Responses to Mega & Industry trends in Supply Chain Management
Sales & Operations Planning
Supply Chain Strategic remodelling
Supply Chain KPI & Meeting alignment
Demand Planning & Forecasting
Product Lifecycle Planning
Inventory Optimization
Process OptimizationSupply Chain
Planning Concepts
Strategic Demand & Capacity Management
Continuous Improvement
Collaboration with Customers & Suppliers
Available to Promise
Sources: 1. O’Marah, K. et al. ( 2014). The Chief Supply Chain Officer Report 2014, SCM World2. Alicke, K. (2014). SCM 2020 – the new differentiator, McKinsey & Company at Den Danske Logistik Konference, October 28th 20143. www.apics.org, www.supplychaindigital.com, www.supplychainbrain.com, www.globalchange.com, www.logiticsviewpoint.com,
Supply Chain Excellence
13
14
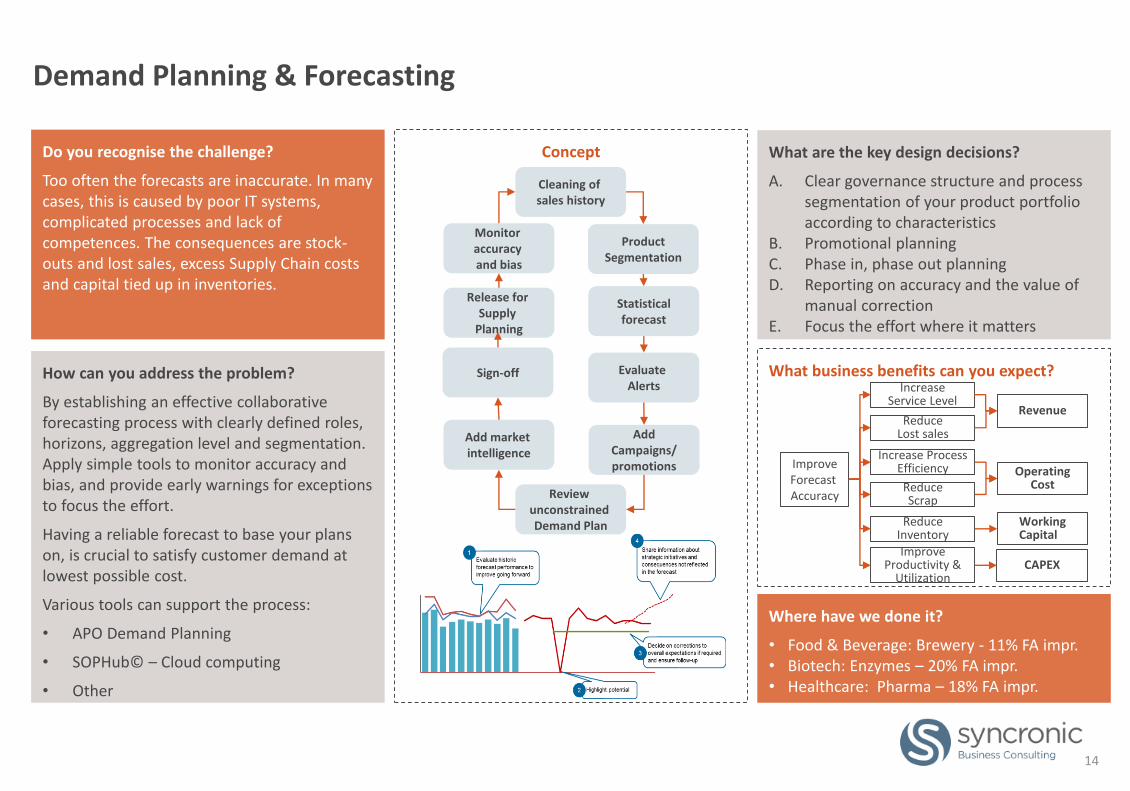
Do you recognise the challenge?
Too often the forecasts are inaccurate. In many cases, this is caused by poor IT systems, complicated processes and lack of competences. The consequences are stock-outs and lost sales, excess Supply Chain costs and capital tied up in inventories.
How can you address the problem?
By establishing an effective collaborative forecasting process with clearly defined roles, horizons, aggregation level and segmentation. Apply simple tools to monitor accuracy and bias, and provide early warnings for exceptions to focus the effort.
Having a reliable forecast to base your plans on, is crucial to satisfy customer demand at lowest possible cost.
Various tools can support the process:
• APO Demand Planning
• SOPHub© – Cloud computing
• Other
Concept What are the key design decisions?
A. Clear governance structure and process segmentation of your product portfolio according to characteristics
B. Promotional planningC. Phase in, phase out planningD. Reporting on accuracy and the value of
manual correctionE. Focus the effort where it matters
Where have we done it?
• Food & Beverage: Brewery - 11% FA impr.• Biotech: Enzymes – 20% FA impr.• Healthcare: Pharma – 18% FA impr.
What business benefits can you expect?
Demand Planning & Forecasting
Cleaning of sales history
ProductSegmentation
Statisticalforecast
Evaluate Alerts
AddCampaigns/promotions
Review unconstrained Demand Plan
Add market intelligence
Sign-off
Release for Supply
Planning
Monitor accuracy and bias
Revenue
Operating Cost
WorkingCapital
IncreaseService Level
Reduce Lost sales
Reduce Scrap
ReduceInventory
ImproveForecast Accuracy
Increase ProcessEfficiency
ImproveProductivity &
UtilizationCAPEX
15
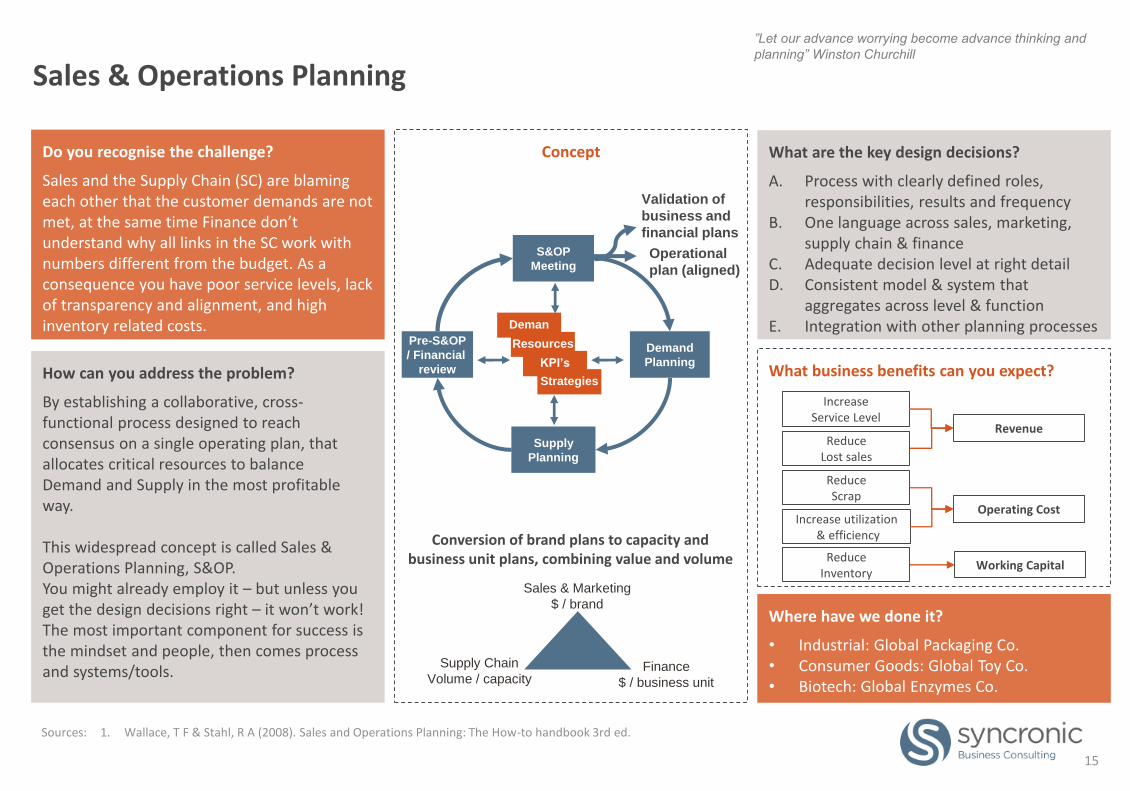
Do you recognise the challenge?
Sales and the Supply Chain (SC) are blaming each other that the customer demands are not met, at the same time Finance don’t understand why all links in the SC work with numbers different from the budget. As a consequence you have poor service levels, lack of transparency and alignment, and high inventory related costs.
How can you address the problem?
By establishing a collaborative, cross-functional process designed to reach consensus on a single operating plan, that allocates critical resources to balance Demand and Supply in the most profitable way.
This widespread concept is called Sales & Operations Planning, S&OP.You might already employ it – but unless you get the design decisions right – it won’t work!The most important component for success is the mindset and people, then comes process and systems/tools.
Concept What are the key design decisions?
A. Process with clearly defined roles, responsibilities, results and frequency
B. One language across sales, marketing, supply chain & finance
C. Adequate decision level at right detailD. Consistent model & system that
aggregates across level & functionE. Integration with other planning processes
Where have we done it?
• Industrial: Global Packaging Co.• Consumer Goods: Global Toy Co.• Biotech: Global Enzymes Co.
What business benefits can you expect?
Sales & Operations Planning
Sources: 1. Wallace, T F & Stahl, R A (2008). Sales and Operations Planning: The How-to handbook 3rd ed.
Revenue
Operating Cost
Working Capital
IncreaseService Level
Reduce Lost sales
Reduce Scrap
ReduceInventory
Increase utilization& efficiency
Sales & Marketing
$ / brand
Finance
$ / business unit
Supply Chain
Volume / capacity
Conversion of brand plans to capacity and business unit plans, combining value and volume
”Let our advance worrying become advance thinking and
planning” Winston Churchill
Operational
plan (aligned)
Validation of
business and
financial plans
Deman
dResourcesPre-S&OP
/ Financial
review
Supply
Planning
Demand
PlanningKPI’s
S&OP
Meeting
Strategies
16
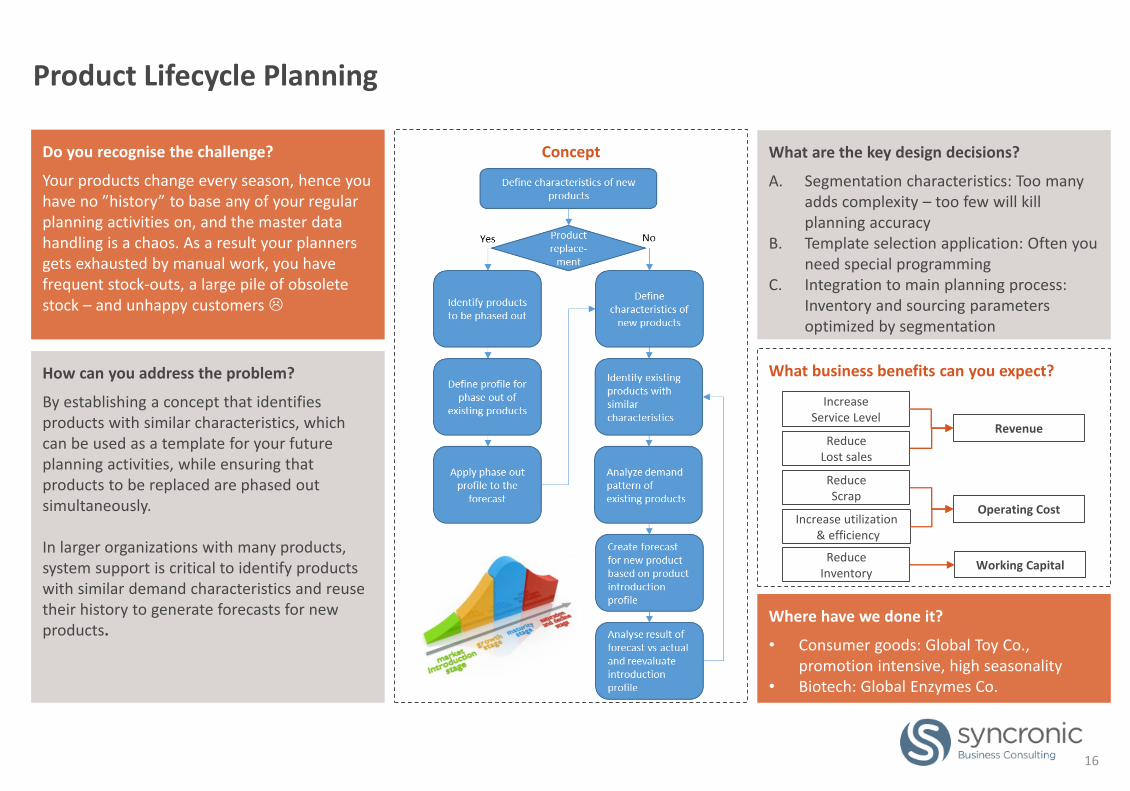
Do you recognise the challenge?
Your products change every season, hence you have no ”history” to base any of your regular planning activities on, and the master data handling is a chaos. As a result your planners gets exhausted by manual work, you have frequent stock-outs, a large pile of obsolete stock – and unhappy customers
How can you address the problem?
By establishing a concept that identifies products with similar characteristics, which can be used as a template for your future planning activities, while ensuring that products to be replaced are phased out simultaneously.
In larger organizations with many products, system support is critical to identify products with similar demand characteristics and reuse their history to generate forecasts for new products.
Concept What are the key design decisions?
A. Segmentation characteristics: Too many adds complexity – too few will kill planning accuracy
B. Template selection application: Often you need special programming
C. Integration to main planning process: Inventory and sourcing parameters optimized by segmentation
Where have we done it?
• Consumer goods: Global Toy Co., promotion intensive, high seasonality
• Biotech: Global Enzymes Co.
What business benefits can you expect?
Product Lifecycle Planning
Revenue
Operating Cost
Working Capital
IncreaseService Level
Reduce Lost sales
Reduce Scrap
ReduceInventory
Increase utilization& efficiency
17
Do you recognise the challenge?
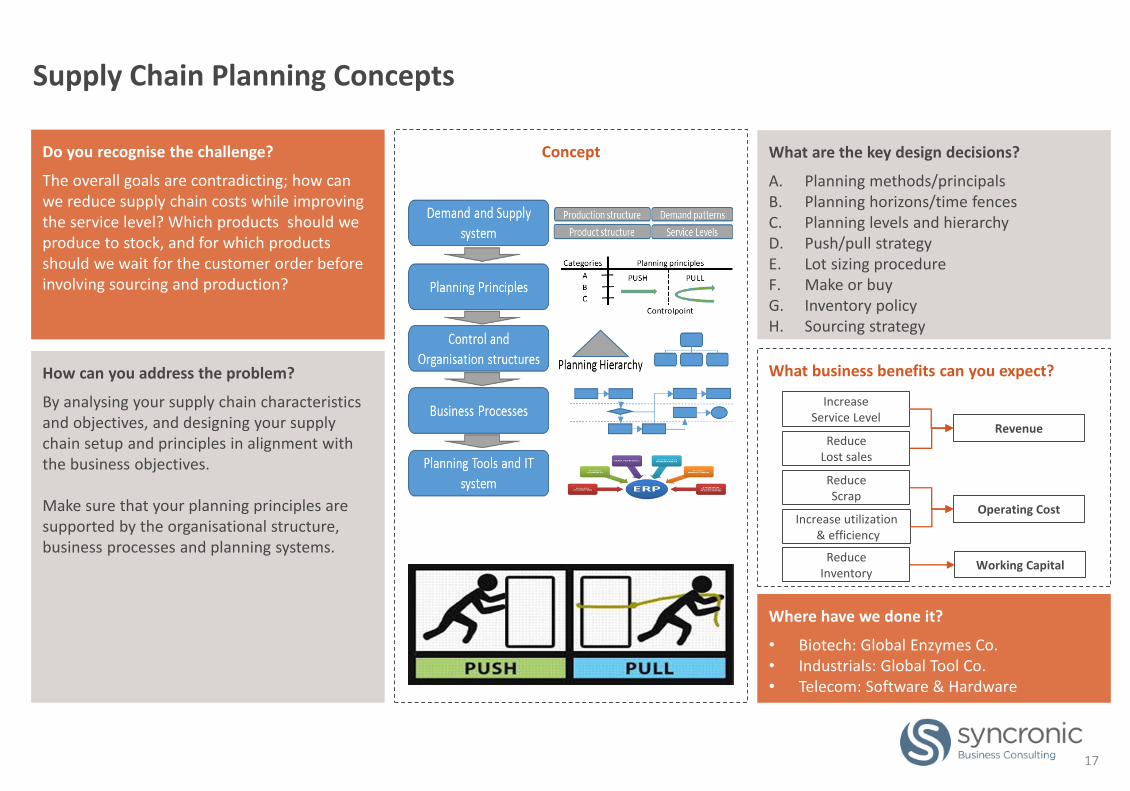
The overall goals are contradicting; how can we reduce supply chain costs while improving the service level? Which products should we produce to stock, and for which products should we wait for the customer order before involving sourcing and production?
How can you address the problem?
By analysing your supply chain characteristics and objectives, and designing your supply chain setup and principles in alignment with the business objectives.
Make sure that your planning principles are supported by the organisational structure, business processes and planning systems.
Concept What are the key design decisions?
A. Planning methods/principalsB. Planning horizons/time fencesC. Planning levels and hierarchyD. Push/pull strategyE. Lot sizing procedureF. Make or buyG. Inventory policyH. Sourcing strategy
Where have we done it?
• Biotech: Global Enzymes Co.• Industrials: Global Tool Co.• Telecom: Software & Hardware
What business benefits can you expect?
Supply Chain Planning Concepts
Revenue
Operating Cost
Working Capital
IncreaseService Level
Reduce Lost sales
Reduce Scrap
ReduceInventory
Increase utilization& efficiency
18
Do you recognise the challenge?
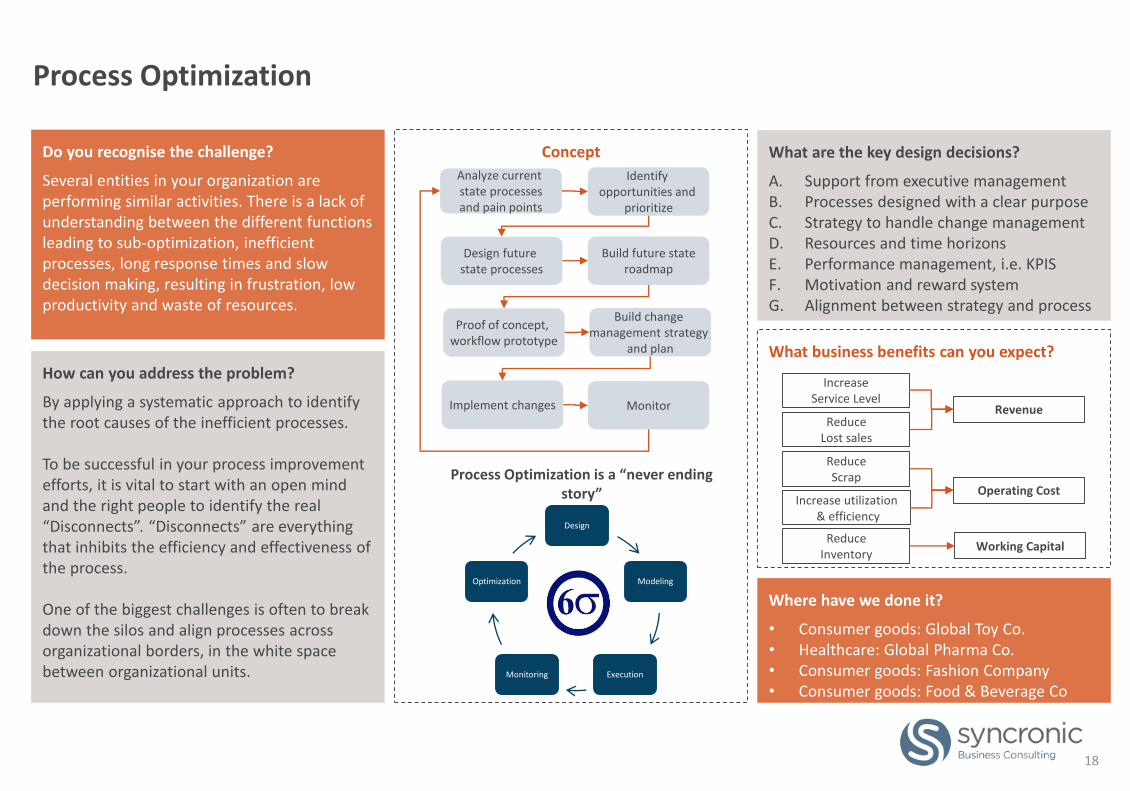
Several entities in your organization are performing similar activities. There is a lack of understanding between the different functions leading to sub-optimization, inefficient processes, long response times and slow decision making, resulting in frustration, low productivity and waste of resources.
How can you address the problem?
By applying a systematic approach to identify the root causes of the inefficient processes.
To be successful in your process improvement efforts, it is vital to start with an open mind and the right people to identify the real “Disconnects”. “Disconnects” are everything that inhibits the efficiency and effectiveness of the process.
One of the biggest challenges is often to break down the silos and align processes across organizational borders, in the white space between organizational units.
Concept What are the key design decisions?
A. Support from executive managementB. Processes designed with a clear purposeC. Strategy to handle change managementD. Resources and time horizonsE. Performance management, i.e. KPIS F. Motivation and reward systemG. Alignment between strategy and process
Where have we done it?
• Consumer goods: Global Toy Co.• Healthcare: Global Pharma Co.• Consumer goods: Fashion Company • Consumer goods: Food & Beverage Co
What business benefits can you expect?
Process Optimization
Design future state processes
Proof of concept, workflow prototype
Identify opportunities and
prioritize
Analyze current state processesand pain points
Implement changes
Build future stateroadmap
Build change management strategy
and plan
Monitor
Process Optimization is a “never ending story”
Design
Modeling
ExecutionMonitoring
Optimization
Revenue
Operating Cost
Working Capital
IncreaseService Level
Reduce Lost sales
Reduce Scrap
ReduceInventory
Increase utilization& efficiency
19
Do you recognise the challenge?
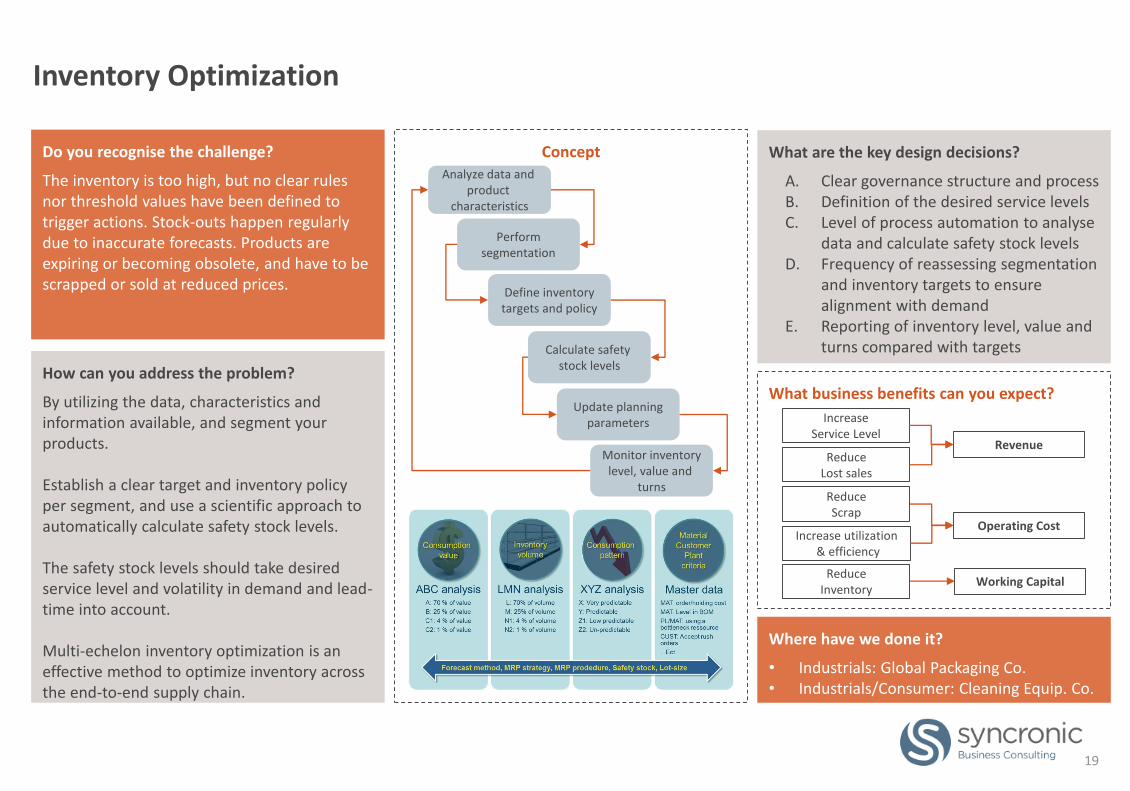
The inventory is too high, but no clear rules nor threshold values have been defined to trigger actions. Stock-outs happen regularly due to inaccurate forecasts. Products are expiring or becoming obsolete, and have to be scrapped or sold at reduced prices.
How can you address the problem?
By utilizing the data, characteristics and information available, and segment your products.
Establish a clear target and inventory policy per segment, and use a scientific approach to automatically calculate safety stock levels.
The safety stock levels should take desired service level and volatility in demand and lead-time into account.
Multi-echelon inventory optimization is an effective method to optimize inventory across the end-to-end supply chain.
Concept What are the key design decisions?
A. Clear governance structure and processB. Definition of the desired service levelsC. Level of process automation to analyse
data and calculate safety stock levelsD. Frequency of reassessing segmentation
and inventory targets to ensure alignment with demand
E. Reporting of inventory level, value and turns compared with targets
Where have we done it?
• Industrials: Global Packaging Co.• Industrials/Consumer: Cleaning Equip. Co.
What business benefits can you expect?
Inventory Optimization
Revenue
Operating Cost
Working Capital
IncreaseService Level
Reduce Lost sales
Reduce Scrap
ReduceInventory
Increase utilization& efficiency
Define inventorytargets and policy
Update planningparameters
Performsegmentation
Analyze data and product
characteristics
Monitor inventorylevel, value and
turns
Calculate safety stock levels
20
Do you recognise the challenge?
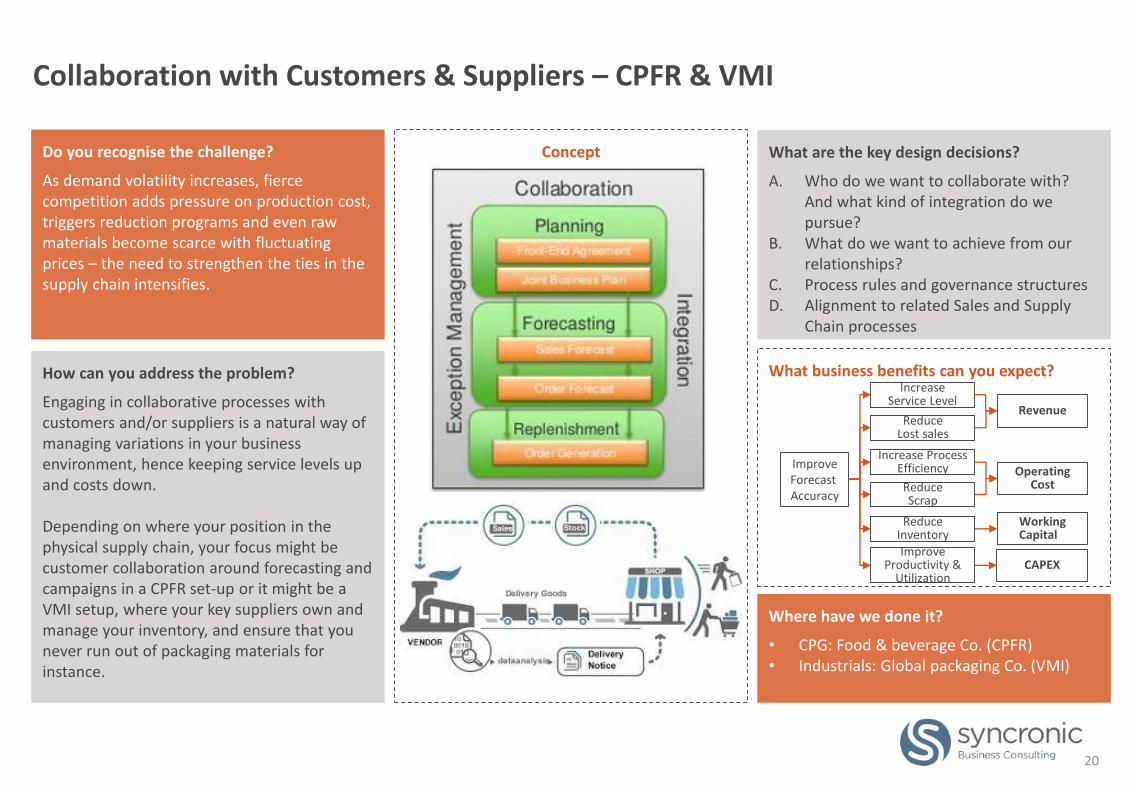
As demand volatility increases, fierce competition adds pressure on production cost, triggers reduction programs and even raw materials become scarce with fluctuating prices – the need to strengthen the ties in the supply chain intensifies.
How can you address the problem?
Engaging in collaborative processes with customers and/or suppliers is a natural way of managing variations in your business environment, hence keeping service levels up and costs down.
Depending on where your position in the physical supply chain, your focus might be customer collaboration around forecasting and campaigns in a CPFR set-up or it might be a VMI setup, where your key suppliers own and manage your inventory, and ensure that you never run out of packaging materials for instance.
Concept What are the key design decisions?
A. Who do we want to collaborate with? And what kind of integration do we pursue?
B. What do we want to achieve from our relationships?
C. Process rules and governance structuresD. Alignment to related Sales and Supply
Chain processes
Where have we done it?
• CPG: Food & beverage Co. (CPFR)• Industrials: Global packaging Co. (VMI)
What business benefits can you expect?
Collaboration with Customers & Suppliers – CPFR & VMI
Revenue
Operating Cost
WorkingCapital
IncreaseService Level
Reduce Lost sales
Reduce Scrap
ReduceInventory
ImproveForecast Accuracy
Increase ProcessEfficiency
ImproveProductivity &
UtilizationCAPEX
21
Do you recognise the challenge?
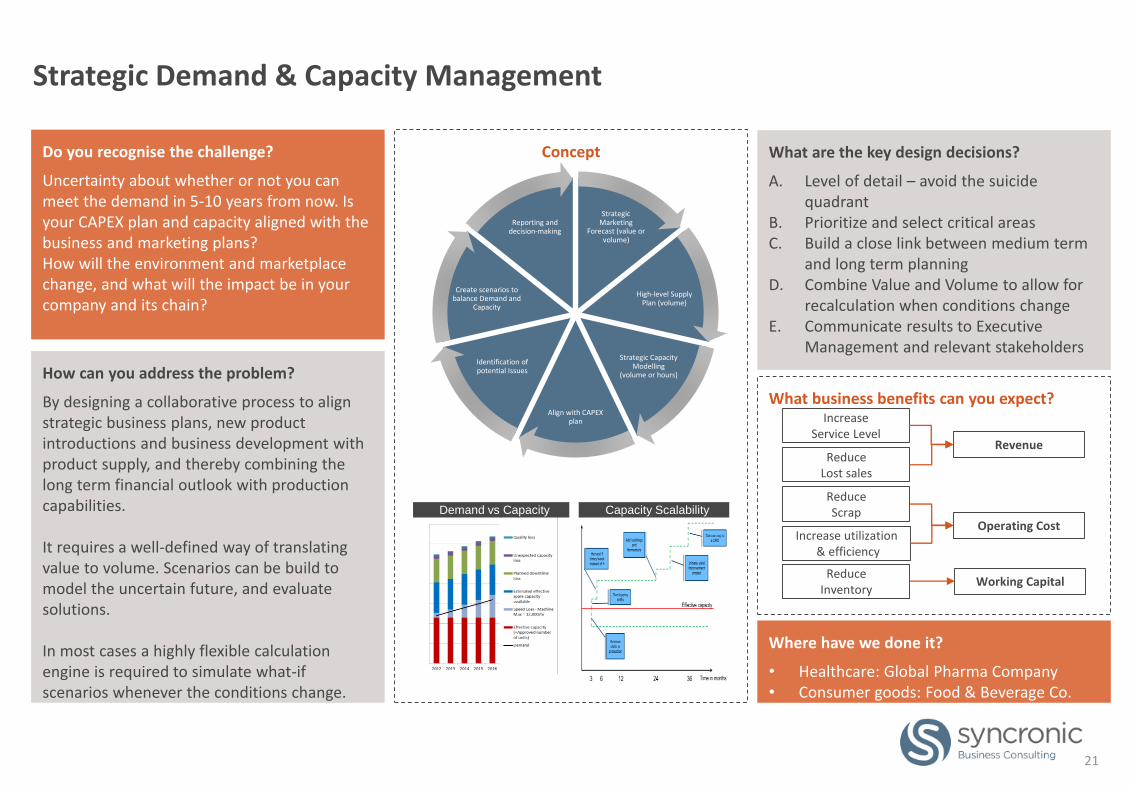
Uncertainty about whether or not you can meet the demand in 5-10 years from now. Is your CAPEX plan and capacity aligned with the business and marketing plans? How will the environment and marketplace change, and what will the impact be in your company and its chain?
How can you address the problem?
By designing a collaborative process to align strategic business plans, new product introductions and business development with product supply, and thereby combining the long term financial outlook with production capabilities.
It requires a well-defined way of translating value to volume. Scenarios can be build to model the uncertain future, and evaluate solutions.
In most cases a highly flexible calculation engine is required to simulate what-if scenarios whenever the conditions change.
Concept What are the key design decisions?
A. Level of detail – avoid the suicide quadrant
B. Prioritize and select critical areasC. Build a close link between medium term
and long term planningD. Combine Value and Volume to allow for
recalculation when conditions changeE. Communicate results to Executive
Management and relevant stakeholders
Where have we done it?
• Healthcare: Global Pharma Company• Consumer goods: Food & Beverage Co.
What business benefits can you expect?
Strategic Demand & Capacity Management
Strategic Marketing
Forecast (value or volume)
High-level Supply Plan (volume)
Strategic Capacity Modelling
(volume or hours)
Align with CAPEX plan
Identification of potential Issues
Create scenarios to balance Demand and
Capacity
Reporting and decision-making
Demand vs Capacity Capacity Scalability
Revenue
Operating Cost
Working Capital
IncreaseService Level
Reduce Lost sales
Reduce Scrap
ReduceInventory
Increase utilization& efficiency
22
Do you recognise the challenge?
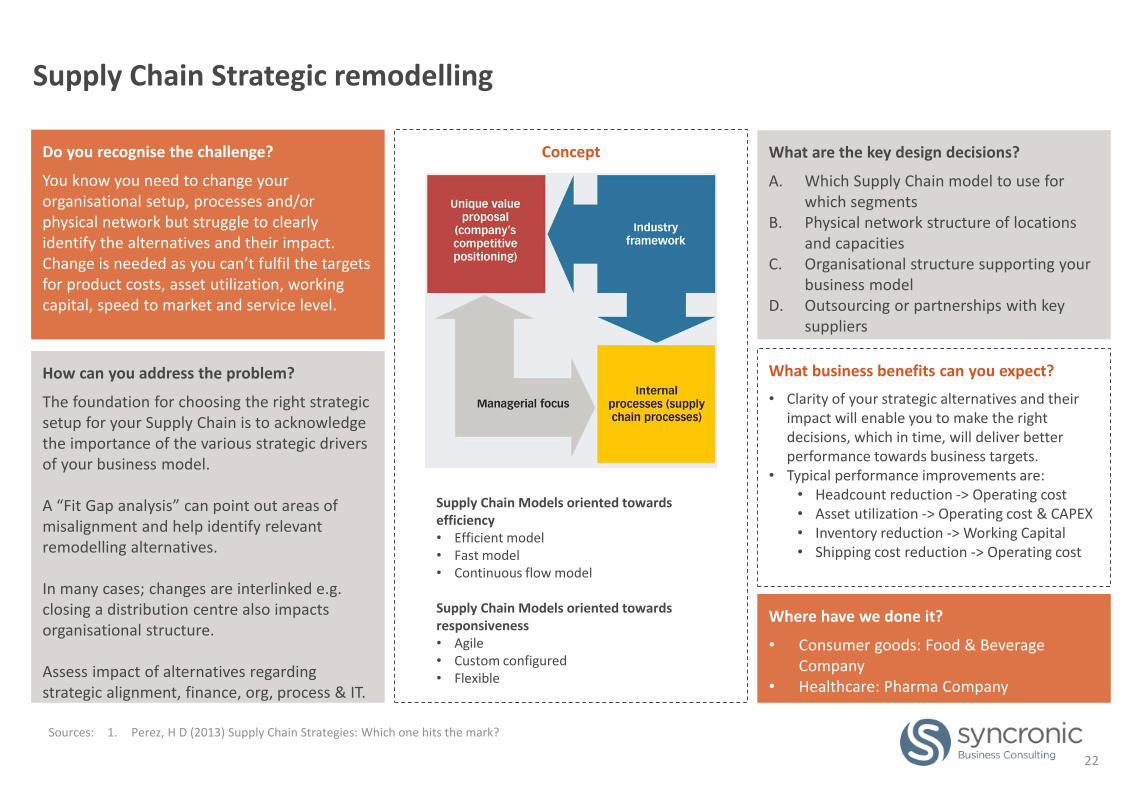
You know you need to change your organisational setup, processes and/or physical network but struggle to clearly identify the alternatives and their impact. Change is needed as you can’t fulfil the targets for product costs, asset utilization, working capital, speed to market and service level.
How can you address the problem?
The foundation for choosing the right strategic setup for your Supply Chain is to acknowledge the importance of the various strategic drivers of your business model.
A “Fit Gap analysis” can point out areas of misalignment and help identify relevant remodelling alternatives.
In many cases; changes are interlinked e.g. closing a distribution centre also impacts organisational structure.
Assess impact of alternatives regarding strategic alignment, finance, org, process & IT.
Concept What are the key design decisions?
A. Which Supply Chain model to use for which segments
B. Physical network structure of locations and capacities
C. Organisational structure supporting your business model
D. Outsourcing or partnerships with key suppliers
Where have we done it?
• Consumer goods: Food & Beverage Company
• Healthcare: Pharma Company
What business benefits can you expect?
• Clarity of your strategic alternatives and their impact will enable you to make the right decisions, which in time, will deliver better performance towards business targets.
• Typical performance improvements are:• Headcount reduction -> Operating cost• Asset utilization -> Operating cost & CAPEX• Inventory reduction -> Working Capital• Shipping cost reduction -> Operating cost
Supply Chain Strategic remodelling
Sources: 1. Perez, H D (2013) Supply Chain Strategies: Which one hits the mark?
Supply Chain Models oriented towards efficiency• Efficient model• Fast model• Continuous flow model
Supply Chain Models oriented towards responsiveness• Agile• Custom configured• Flexible
23
Do you recognise the challenge?
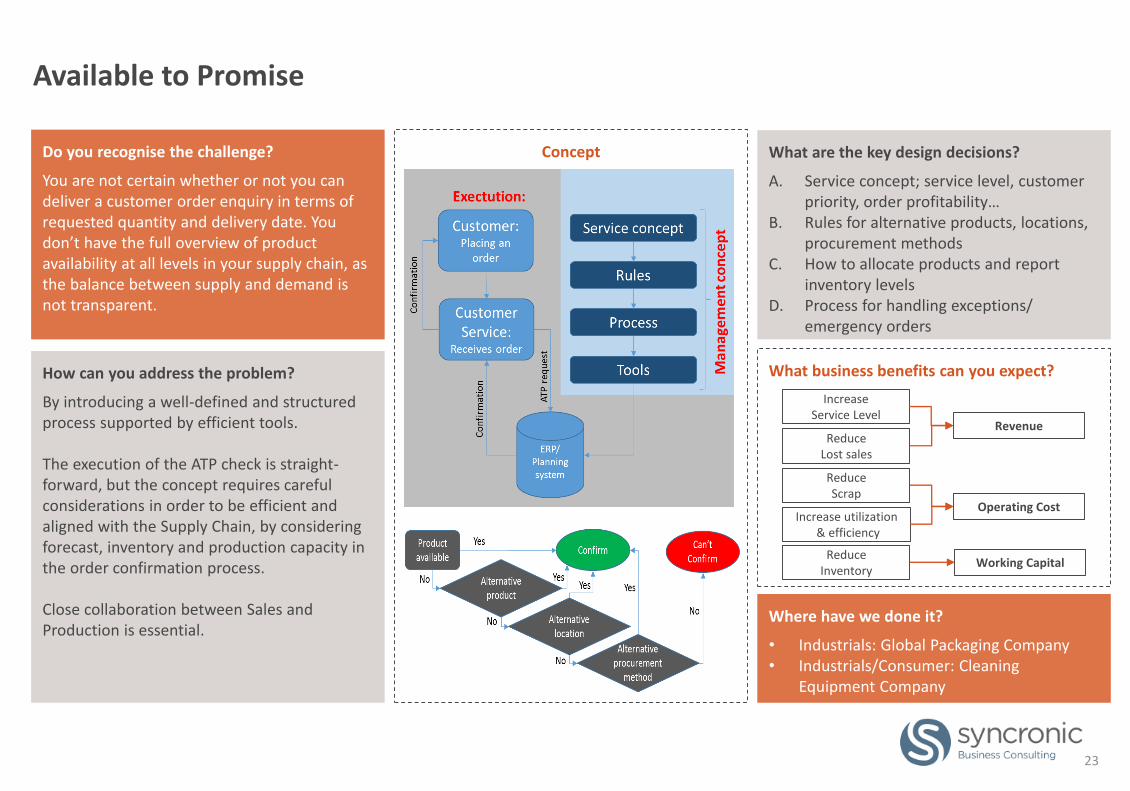
You are not certain whether or not you can deliver a customer order enquiry in terms of requested quantity and delivery date. You don’t have the full overview of product availability at all levels in your supply chain, as the balance between supply and demand is not transparent.
How can you address the problem?
By introducing a well-defined and structured process supported by efficient tools.
The execution of the ATP check is straight-forward, but the concept requires careful considerations in order to be efficient and aligned with the Supply Chain, by consideringforecast, inventory and production capacity in the order confirmation process.
Close collaboration between Sales and Production is essential.
Concept What are the key design decisions?
A. Service concept; service level, customer priority, order profitability…
B. Rules for alternative products, locations, procurement methods
C. How to allocate products and report inventory levels
D. Process for handling exceptions/ emergency orders
Where have we done it?
• Industrials: Global Packaging Company• Industrials/Consumer: Cleaning
Equipment Company
What business benefits can you expect?
Available to Promise
Revenue
Operating Cost
Working Capital
IncreaseService Level
Reduce Lost sales
Reduce Scrap
ReduceInventory
Increase utilization& efficiency
24
Do you recognise the challenge?
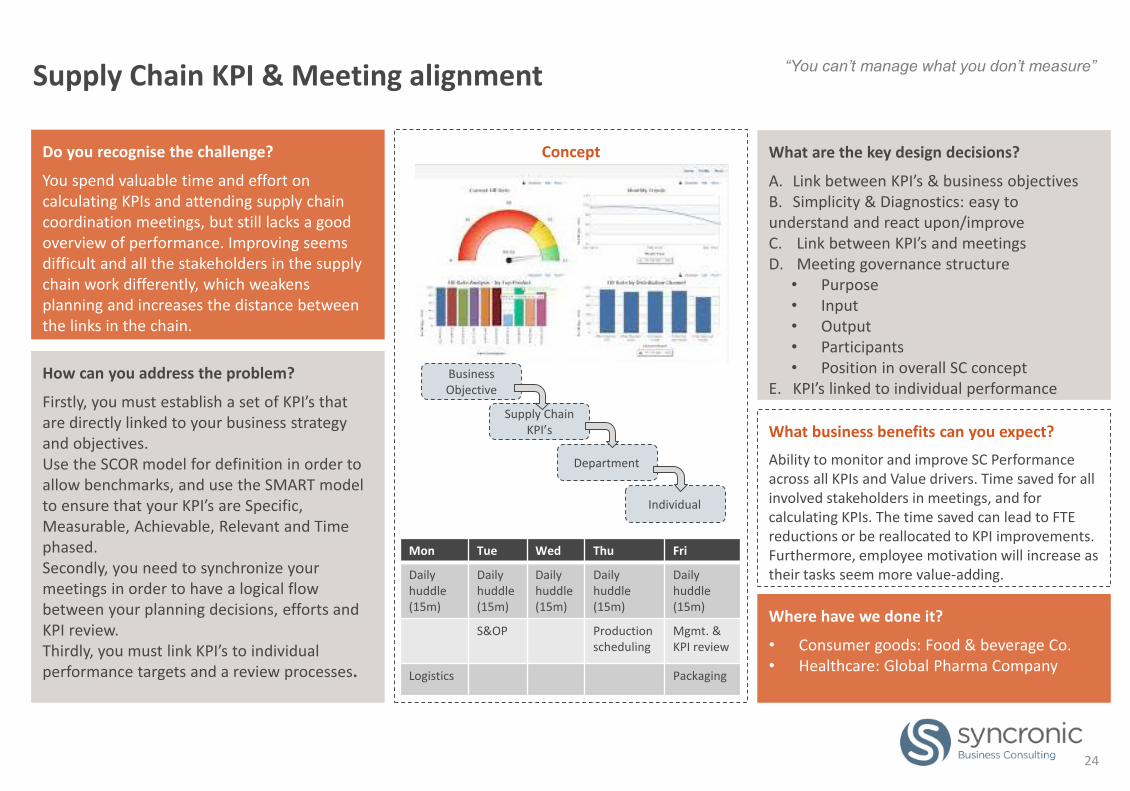
You spend valuable time and effort on calculating KPIs and attending supply chain coordination meetings, but still lacks a good overview of performance. Improving seems difficult and all the stakeholders in the supply chain work differently, which weakens planning and increases the distance between the links in the chain.
How can you address the problem?
Firstly, you must establish a set of KPI’s that are directly linked to your business strategy and objectives. Use the SCOR model for definition in order to allow benchmarks, and use the SMART model to ensure that your KPI’s are Specific, Measurable, Achievable, Relevant and Time phased.Secondly, you need to synchronize your meetings in order to have a logical flow between your planning decisions, efforts and KPI review. Thirdly, you must link KPI’s to individual performance targets and a review processes.
Concept What are the key design decisions?
A. Link between KPI’s & business objectivesB. Simplicity & Diagnostics: easy to understand and react upon/improveC. Link between KPI’s and meetingsD. Meeting governance structure
• Purpose• Input• Output• Participants• Position in overall SC concept
E. KPI’s linked to individual performance
Where have we done it?
• Consumer goods: Food & beverage Co.• Healthcare: Global Pharma Company
What business benefits can you expect?
Ability to monitor and improve SC Performance across all KPIs and Value drivers. Time saved for all involved stakeholders in meetings, and for calculating KPIs. The time saved can lead to FTE reductions or be reallocated to KPI improvements. Furthermore, employee motivation will increase as their tasks seem more value-adding.
Supply Chain KPI & Meeting alignment “You can’t manage what you don’t measure”
Business Objective
Supply Chain KPI’s
Department
Individual
Mon Tue Wed Thu Fri
Daily huddle (15m)
Daily huddle (15m)
Daily huddle (15m)
Daily huddle (15m)
Daily huddle (15m)
S&OP Productionscheduling
Mgmt. & KPI review
Logistics Packaging
25
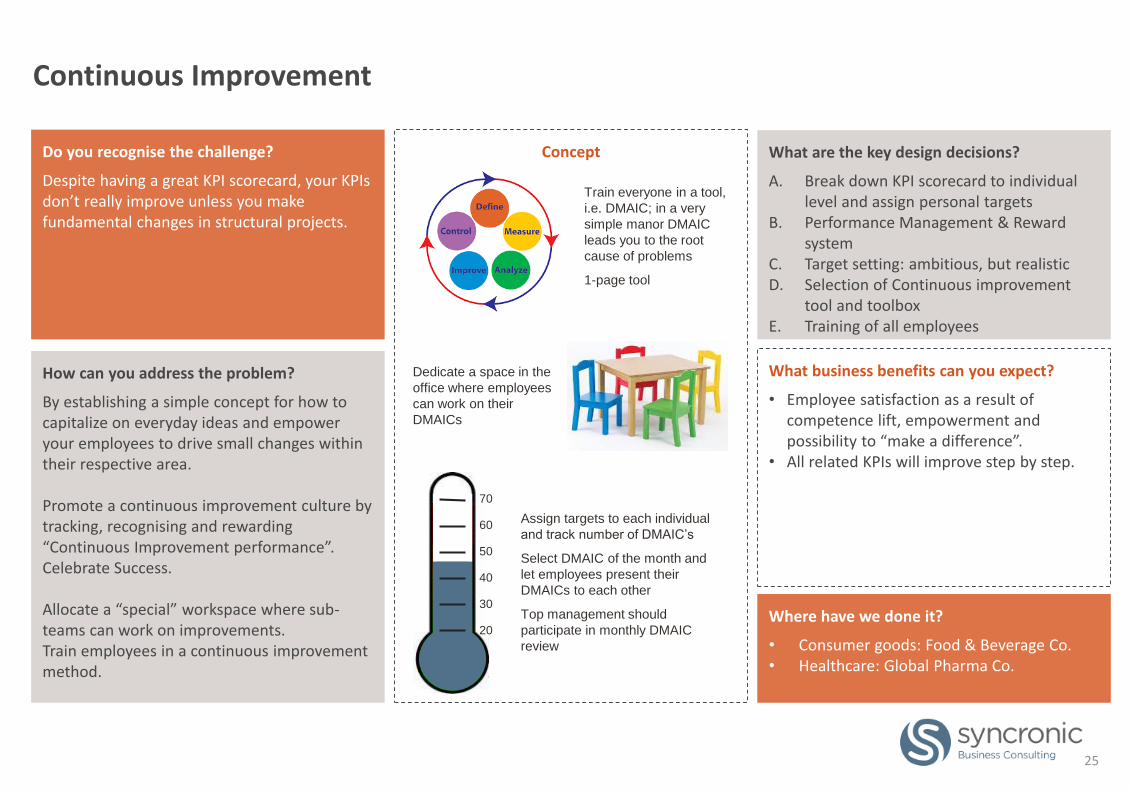
Do you recognise the challenge?
Despite having a great KPI scorecard, your KPIs don’t really improve unless you make fundamental changes in structural projects.
How can you address the problem?
By establishing a simple concept for how to capitalize on everyday ideas and empower your employees to drive small changes within their respective area.
Promote a continuous improvement culture by tracking, recognising and rewarding “Continuous Improvement performance”. Celebrate Success.
Allocate a “special” workspace where sub-teams can work on improvements.Train employees in a continuous improvement method.
Concept What are the key design decisions?
A. Break down KPI scorecard to individual level and assign personal targets
B. Performance Management & Reward system
C. Target setting: ambitious, but realisticD. Selection of Continuous improvement
tool and toolboxE. Training of all employees
Where have we done it?
• Consumer goods: Food & Beverage Co.• Healthcare: Global Pharma Co.
What business benefits can you expect?
• Employee satisfaction as a result of competence lift, empowerment and possibility to “make a difference”.
• All related KPIs will improve step by step.
Continuous Improvement
70
60
50
40
30
20
Train everyone in a tool,
i.e. DMAIC; in a very
simple manor DMAIC
leads you to the root
cause of problems
1-page tool
Dedicate a space in the
office where employees
can work on their
DMAICs
Assign targets to each individual
and track number of DMAIC’s
Select DMAIC of the month and
let employees present their
DMAICs to each other
Top management should
participate in monthly DMAIC
review
26
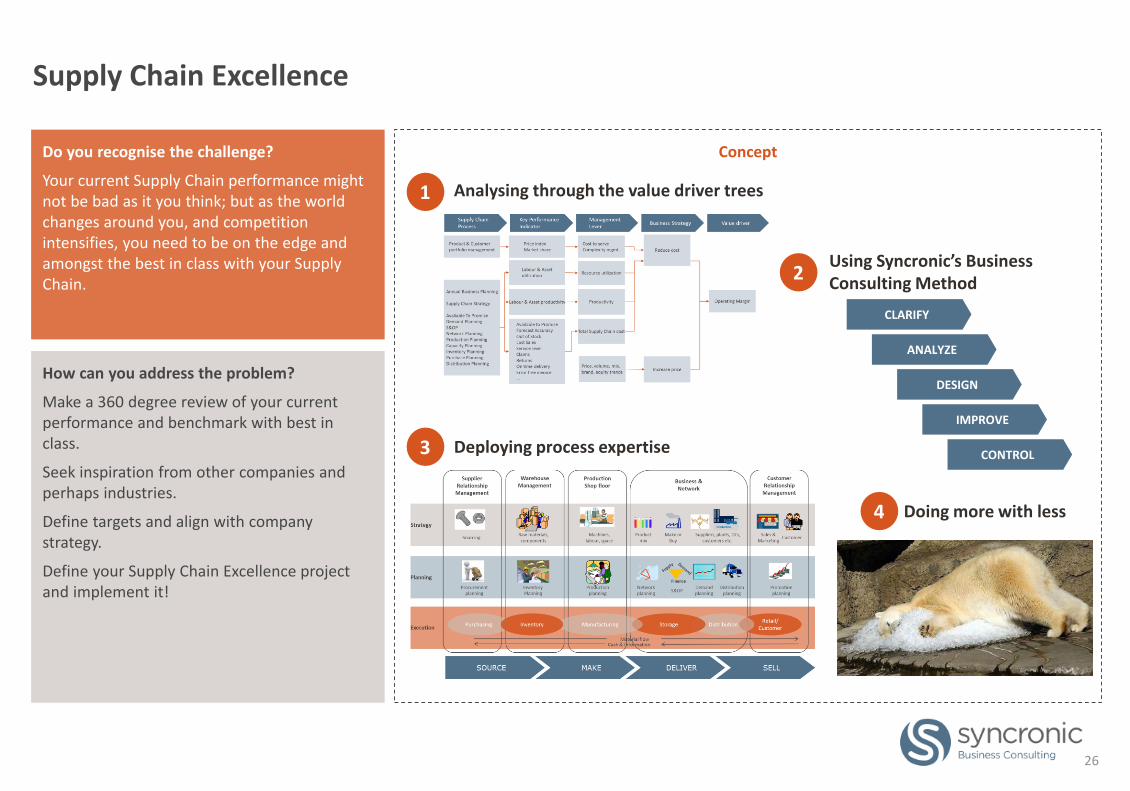
Do you recognise the challenge?
Your current Supply Chain performance might not be bad as it you think; but as the world changes around you, and competition intensifies, you need to be on the edge and amongst the best in class with your Supply Chain.
How can you address the problem?
Make a 360 degree review of your current performance and benchmark with best in class.
Seek inspiration from other companies and perhaps industries.
Define targets and align with company strategy.
Define your Supply Chain Excellence project and implement it!
Concept
Supply Chain Excellence
1 Analysing through the value driver trees
Using Syncronic’s Business Consulting Method
2
Deploying process expertise3
Doing more with less4
CLARIFY
ANALYZE
DESIGN
IMPROVE
CONTROL
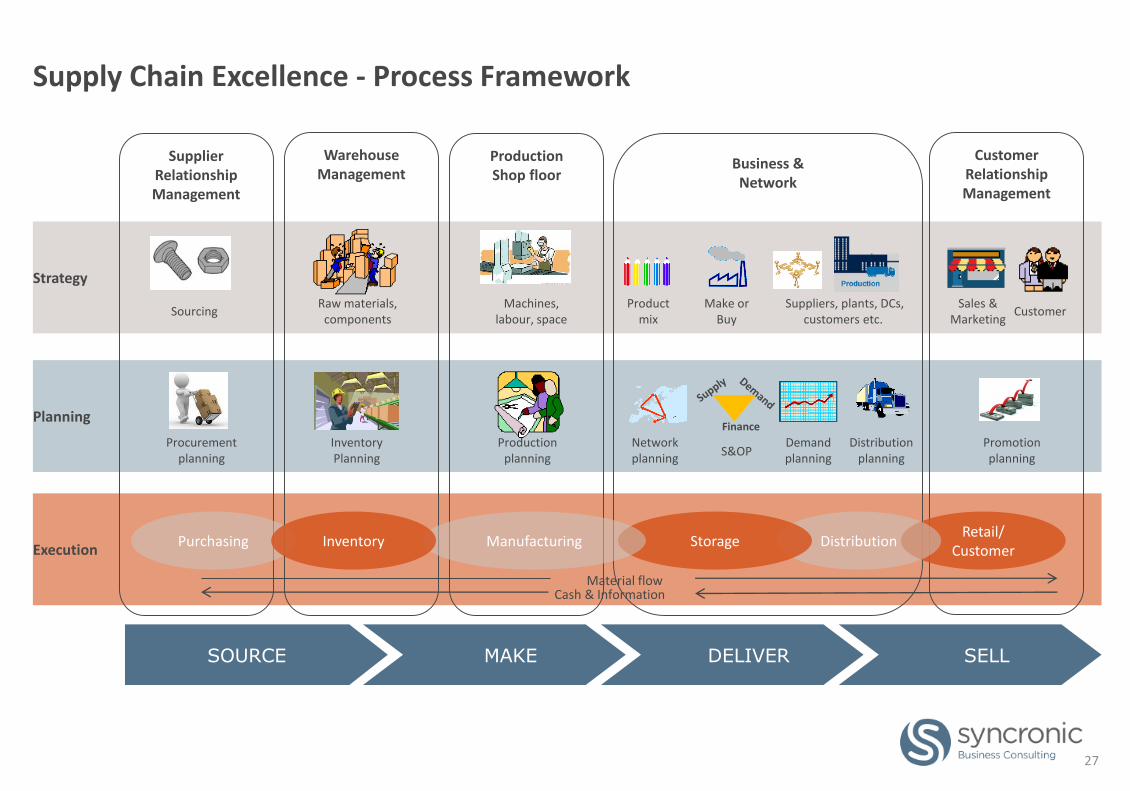
Supply Chain Excellence - Process Framework
SOURCE MAKE DELIVER SELL
Execution
Planning
Strategy
SupplierRelationshipManagement
WarehouseManagement
ProductionShop floor
Business &Network
CustomerRelationshipManagement
Demand planning
InventoryPlanning
Productionplanning
Procurementplanning
Distributionplanning
CustomerSales &
MarketingProduct
mixSuppliers, plants, DCs,
customers etc.Make or
BuySourcing
S&OP
Machines, labour, space
Raw materials, components
Finance
Promotionplanning
Networkplanning
Retail/Customer
DistributionStorageManufacturingPurchasing Inventory
Material flowCash & Information
27
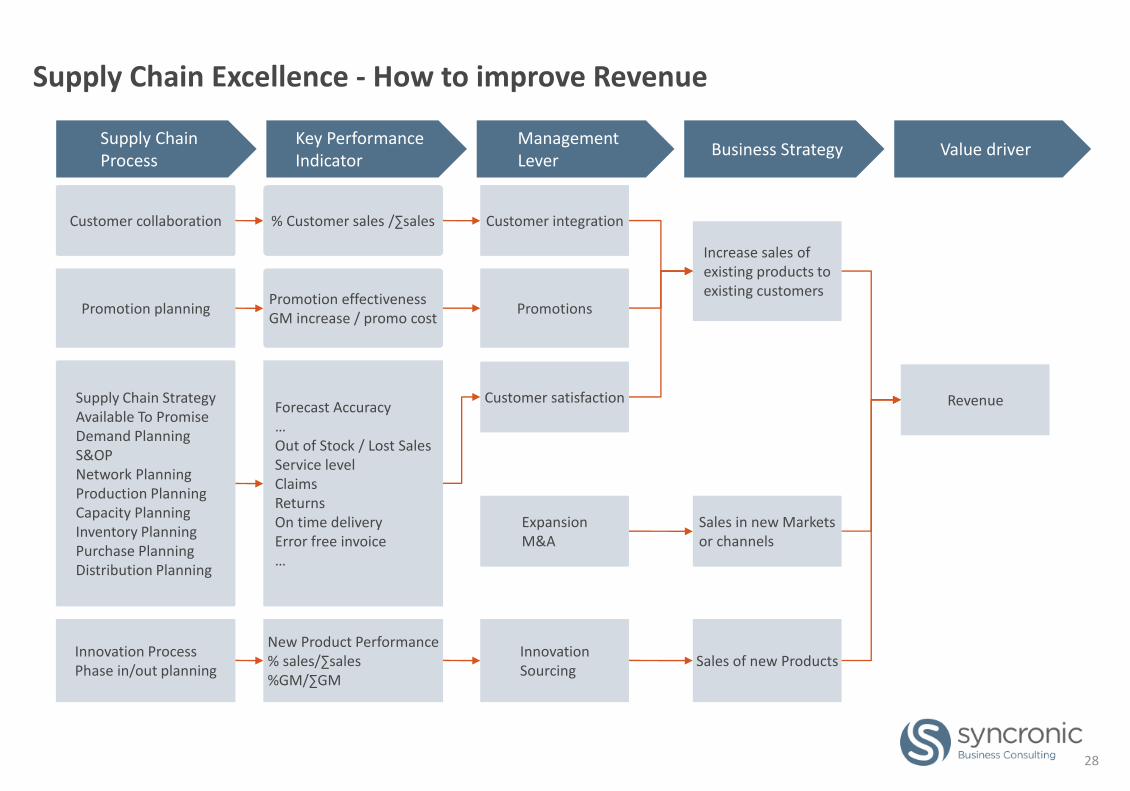
Supply Chain Excellence - How to improve Revenue
Revenue
Increase sales of existing products to existing customers
Sales of new Products
Sales in new Markets or channels
Customer integration
Promotions
Customer satisfaction
InnovationSourcing
ExpansionM&A
% Customer sales /∑sales
Promotion effectivenessGM increase / promo cost
Forecast Accuracy…Out of Stock / Lost SalesService levelClaimsReturnsOn time deliveryError free invoice…
New Product Performance% sales/∑sales%GM/∑GM
Customer collaboration
Promotion planning
Supply Chain StrategyAvailable To PromiseDemand PlanningS&OPNetwork PlanningProduction PlanningCapacity PlanningInventory PlanningPurchase PlanningDistribution Planning
Innovation ProcessPhase in/out planning
28
Key PerformanceIndicator
Supply Chain Process
ManagementLever
Business Strategy Value driver
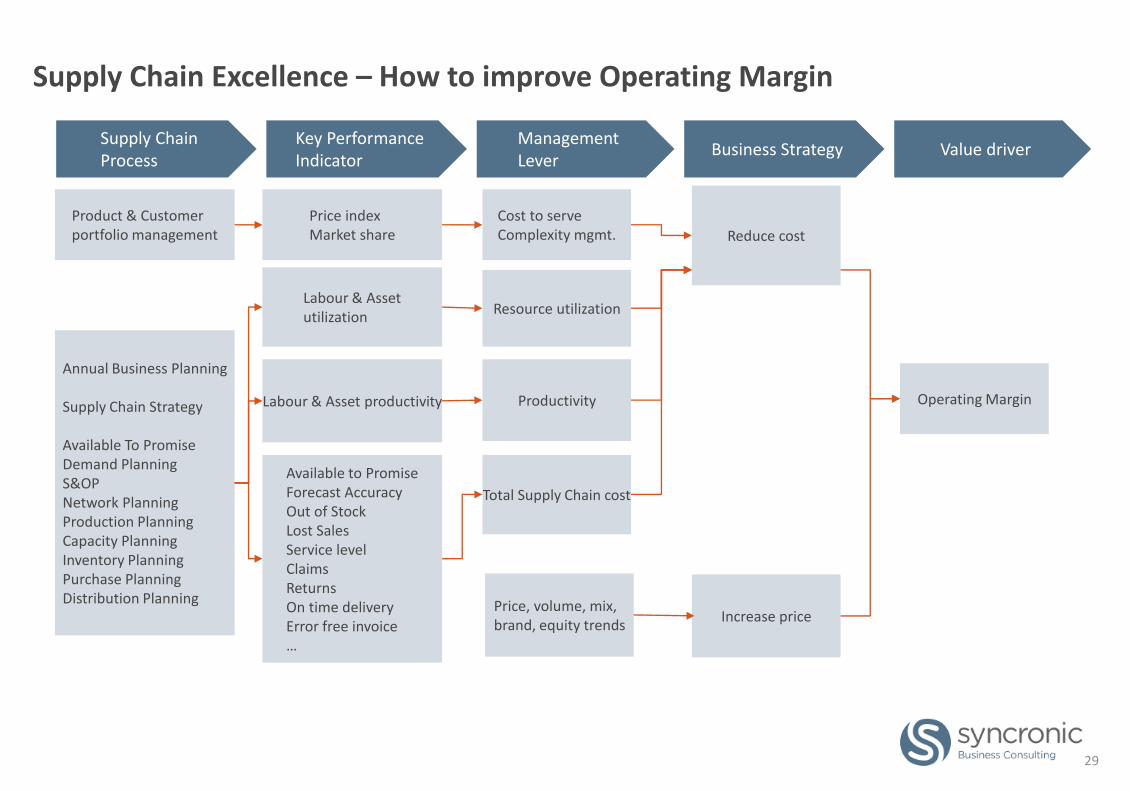
Supply Chain Excellence – How to improve Operating Margin
29
Operating Margin
Reduce cost
Increase price
Cost to serveComplexity mgmt.
Resource utilization
Productivity
Price, volume, mix, brand, equity trends
Total Supply Chain cost
Price indexMarket share
Labour & Assetutilization
Available to PromiseForecast AccuracyOut of StockLost SalesService levelClaimsReturnsOn time deliveryError free invoice…
Labour & Asset productivity
Product & Customer portfolio management
Annual Business Planning
Supply Chain Strategy
Available To PromiseDemand PlanningS&OPNetwork PlanningProduction PlanningCapacity PlanningInventory PlanningPurchase PlanningDistribution Planning
Key PerformanceIndicator
Supply Chain Process
ManagementLever
Business Strategy Value driver
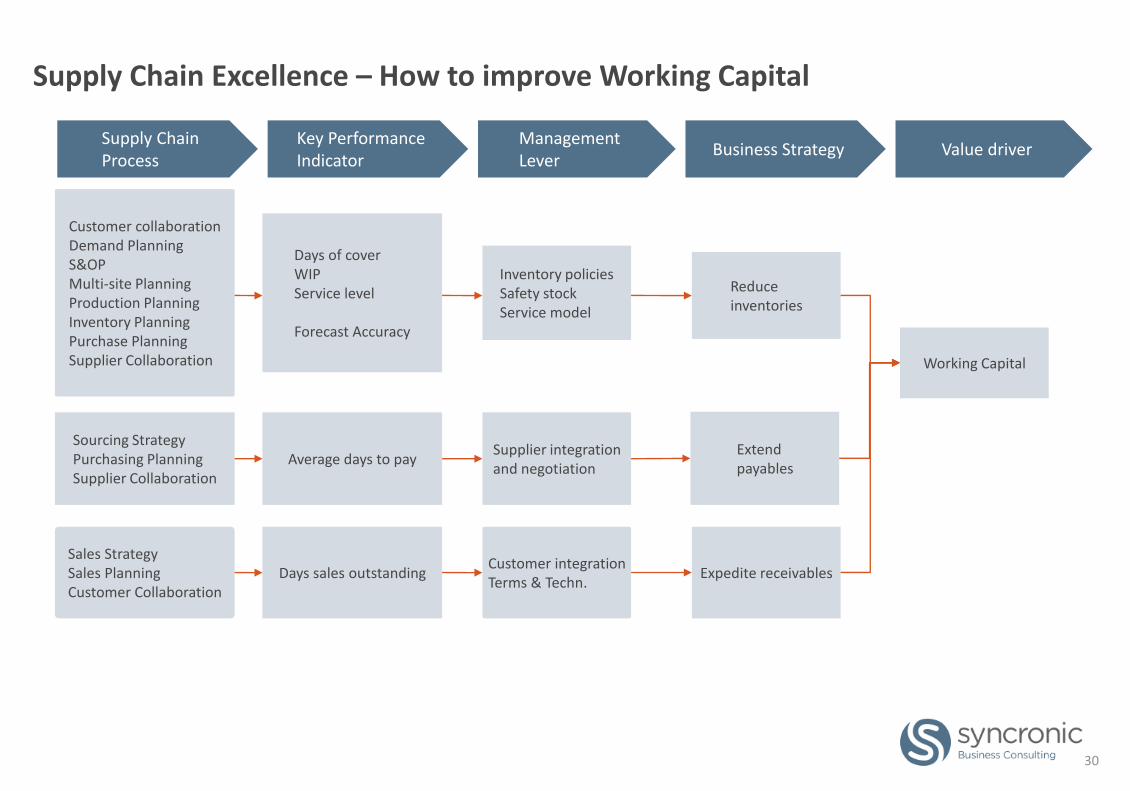
Supply Chain Excellence – How to improve Working Capital
Working Capital
Reduce inventories
Expedite receivables
Inventory policiesSafety stockService model
Supplier integration and negotiation
Customer integration Terms & Techn.
Days of coverWIPService level
Forecast Accuracy
Days sales outstanding
Average days to pay
Customer collaborationDemand PlanningS&OPMulti-site PlanningProduction PlanningInventory PlanningPurchase PlanningSupplier Collaboration
Sourcing StrategyPurchasing PlanningSupplier Collaboration
Extendpayables
Sales StrategySales PlanningCustomer Collaboration
30
Key PerformanceIndicator
Supply Chain Process
ManagementLever
Business Strategy Value driver
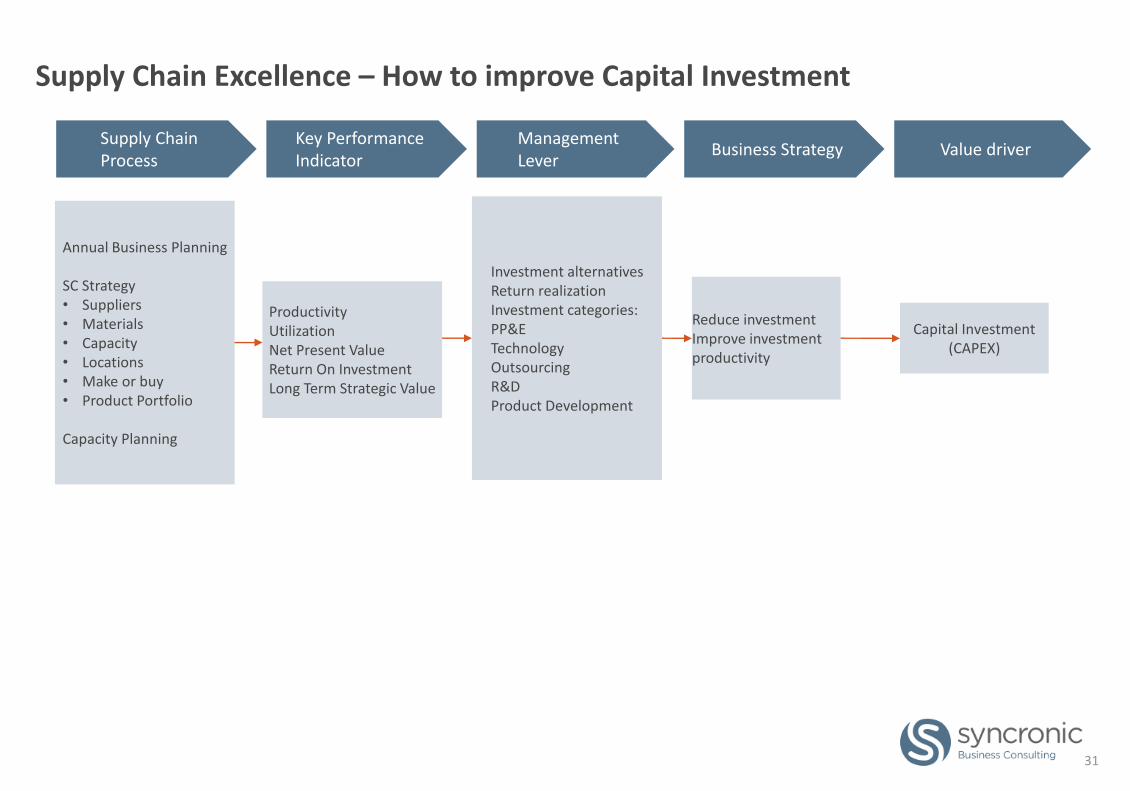
Supply Chain Excellence – How to improve Capital Investment
Capital Investment(CAPEX)
Reduce investmentImprove investment productivity
Investment alternativesReturn realizationInvestment categories:PP&ETechnologyOutsourcingR&DProduct Development
ProductivityUtilizationNet Present ValueReturn On InvestmentLong Term Strategic Value
Annual Business Planning
SC Strategy• Suppliers• Materials• Capacity• Locations• Make or buy• Product Portfolio
Capacity Planning
31
Key PerformanceIndicator
Supply Chain Process
ManagementLever
Business Strategy Value driver
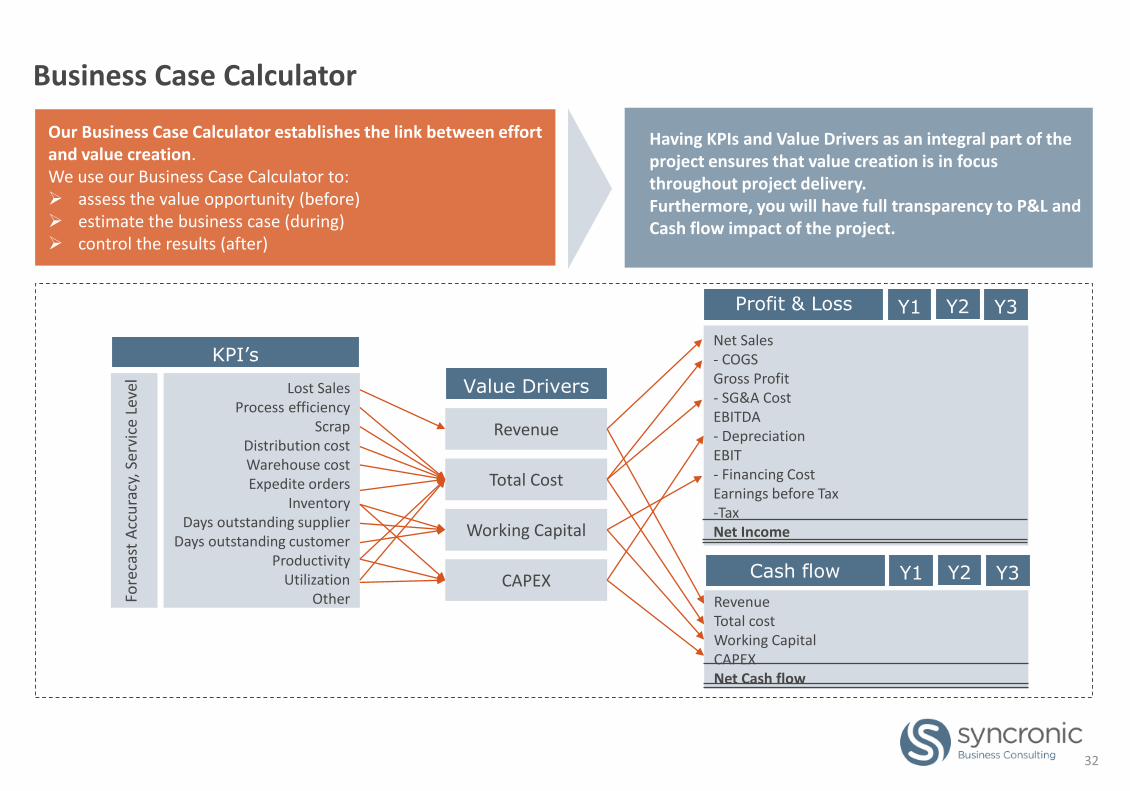
Business Case Calculator
Our Business Case Calculator establishes the link between effort and value creation.We use our Business Case Calculator to: assess the value opportunity (before) estimate the business case (during) control the results (after)
Having KPIs and Value Drivers as an integral part of the project ensures that value creation is in focus throughout project delivery.Furthermore, you will have full transparency to P&L and Cash flow impact of the project.
Profit & Loss
Net Sales- COGSGross Profit- SG&A CostEBITDA- DepreciationEBIT- Financing CostEarnings before Tax-TaxNet Income
KPI’s
Lost SalesProcess efficiency
ScrapDistribution costWarehouse costExpedite orders
InventoryDays outstanding supplier
Days outstanding customerProductivity
UtilizationOther
Value Drivers
Revenue
Total Cost
Working Capital
CAPEX Cash flow
Y1 Y2 Y3
Y1 Y2 Y3
RevenueTotal costWorking CapitalCAPEXNet Cash flow
Fore
cast
Acc
ura
cy, S
ervi
ce L
evel
32
When all you got is a hammer, every problem looks like a nail
Hello,
My name is Mr. Fix It!
For small problems, I use the small hammer
For big problems, I use the big hammer
33
From: Richard Scary: Alle mine venner
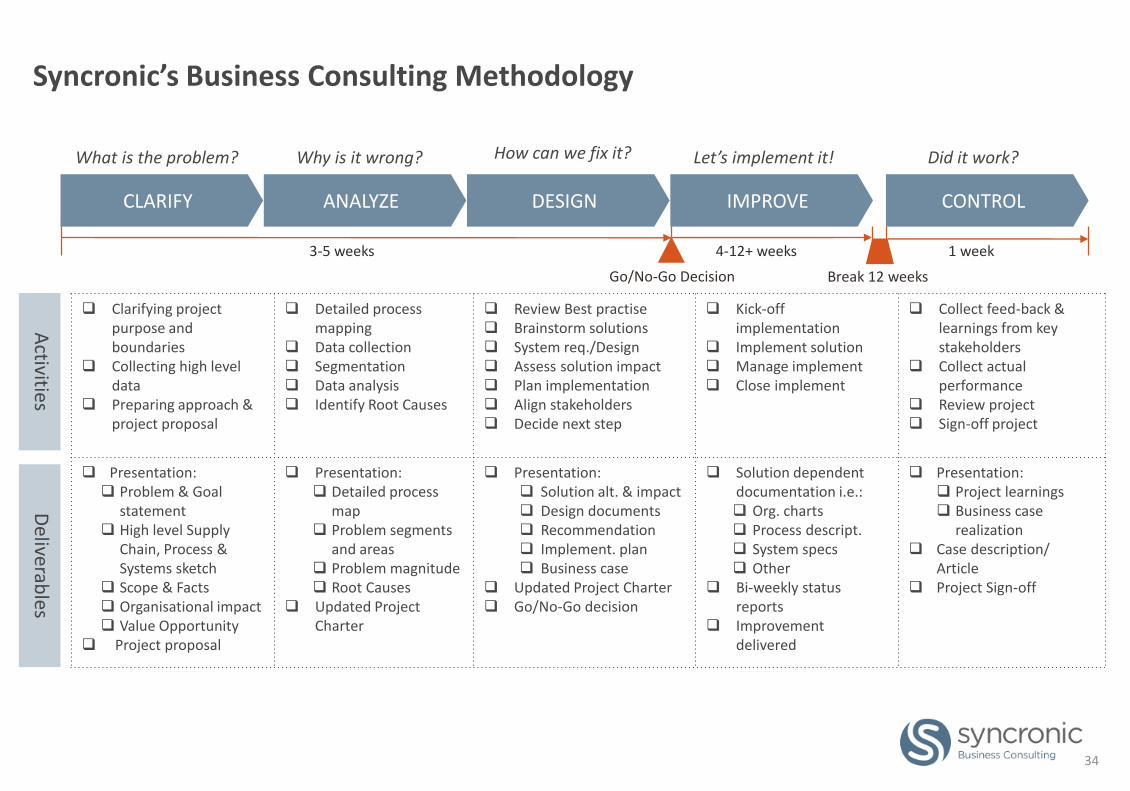
Syncronic’s Business Consulting Methodology
Clarifying project purpose and boundaries
Collecting high level data
Preparing approach & project proposal
Detailed process mapping
Data collection Segmentation Data analysis Identify Root Causes
Review Best practise Brainstorm solutions System req./Design Assess solution impact Plan implementation Align stakeholders Decide next step
Kick-off implementation
Implement solution Manage implement Close implement
Collect feed-back & learnings from key stakeholders
Collect actualperformance
Review project Sign-off project
Presentation: Problem & Goal
statement High level Supply
Chain, Process & Systems sketch
Scope & Facts Organisational impact Value Opportunity
Project proposal
Presentation: Detailed process
map Problem segments
and areas Problem magnitude Root Causes
Updated Project Charter
Presentation: Solution alt. & impact Design documents Recommendation Implement. plan Business case
Updated Project Charter Go/No-Go decision
Solution dependent documentation i.e.: Org. charts Process descript. System specs Other
Bi-weekly status reports
Improvement delivered
Presentation: Project learnings Business case
realization Case description/
Article Project Sign-off
Deliverab
lesA
ctivities
Break 12 weeks
What is the problem? Why is it wrong? How can we fix it? Let’s implement it! Did it work?
3-5 weeks 4-12+ weeks 1 week
CLARIFY ANALYZE DESIGN IMPROVE CONTROL
Go/No-Go Decision
34
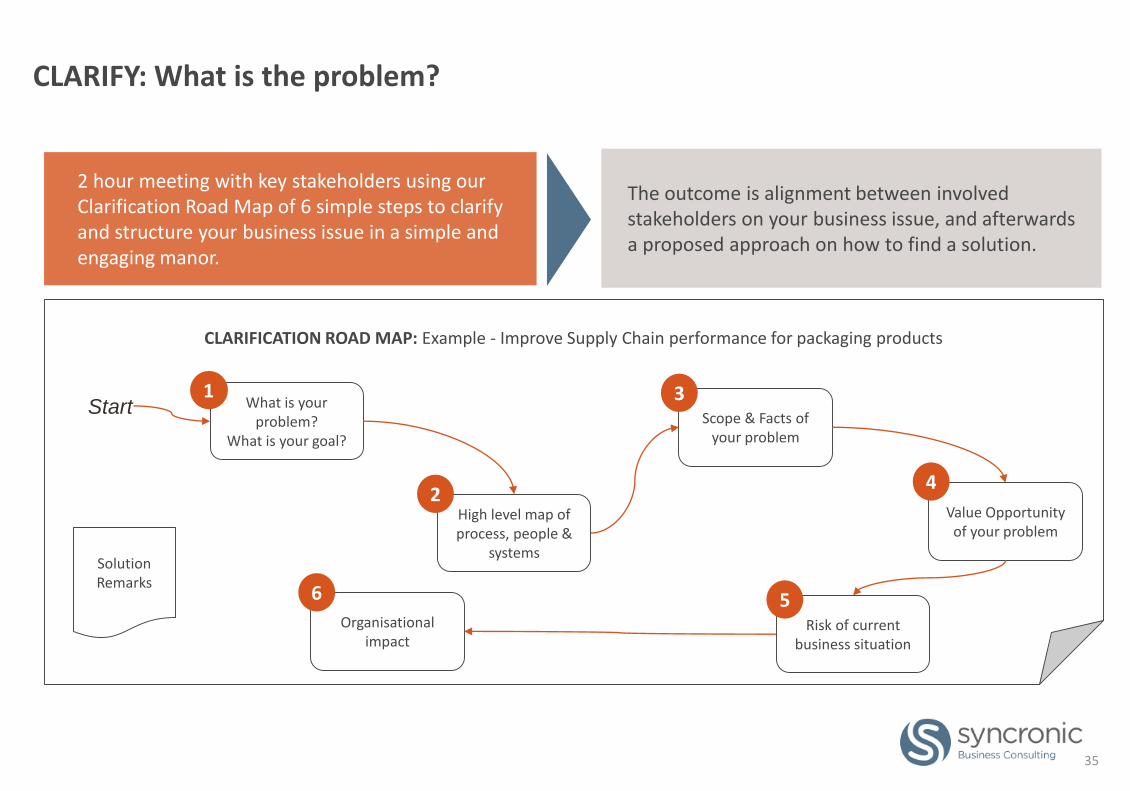
CLARIFY: What is the problem?
2 hour meeting with key stakeholders using our Clarification Road Map of 6 simple steps to clarify and structure your business issue in a simple and engaging manor.
The outcome is alignment between involved stakeholders on your business issue, and afterwards a proposed approach on how to find a solution.
CLARIFICATION ROAD MAP: Example - Improve Supply Chain performance for packaging products
Start
Value Opportunity of your problem
Scope & Facts of your problem
What is your problem?
What is your goal?
High level map of process, people &
systems
Risk of current business situation
Organisational impact
35
1
2
3
4
56
Solution Remarks
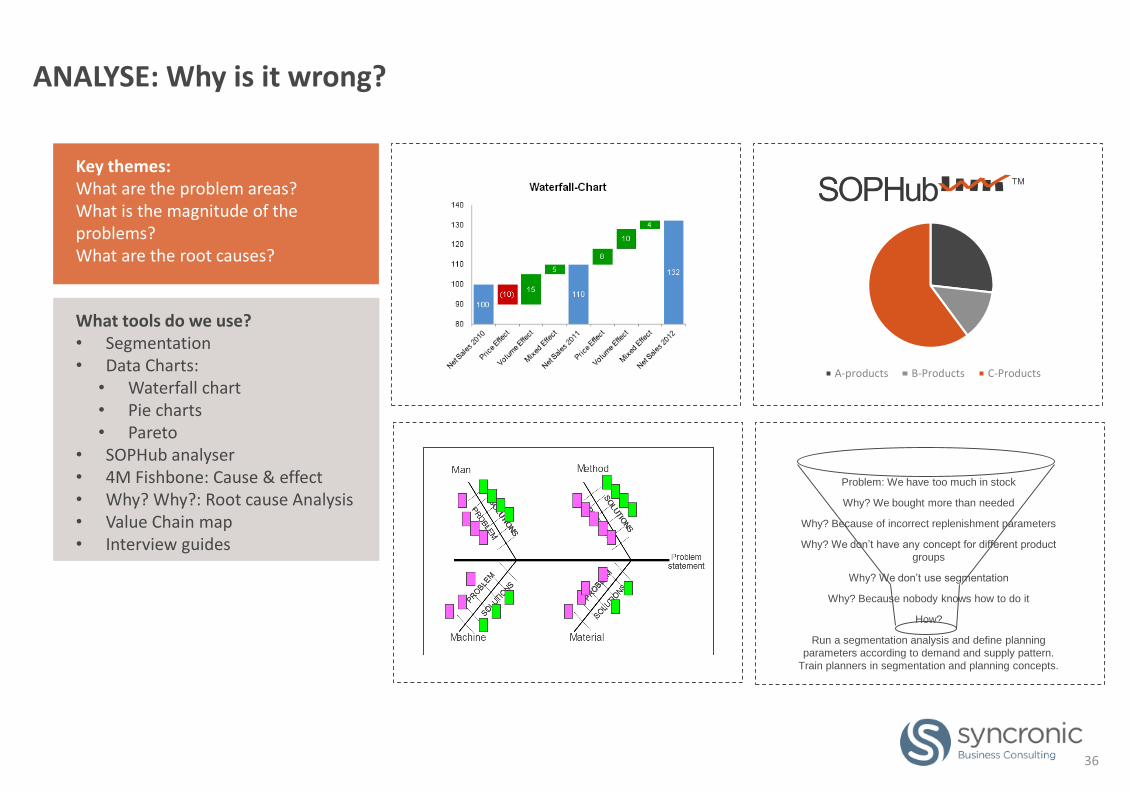
Key themes:What are the problem areas?What is the magnitude of the problems?What are the root causes?
ANALYSE: Why is it wrong?
A-products B-Products C-Products
What tools do we use?• Segmentation• Data Charts:
• Waterfall chart• Pie charts• Pareto
• SOPHub analyser• 4M Fishbone: Cause & effect• Why? Why?: Root cause Analysis• Value Chain map• Interview guides
36
Problem: We have too much in stock
Why? We bought more than needed
Why? Because of incorrect replenishment parameters
Why? We don’t have any concept for different product
groups
Why? We don’t use segmentation
Why? Because nobody knows how to do it
How?
Run a segmentation analysis and define planning
parameters according to demand and supply pattern.
Train planners in segmentation and planning concepts.
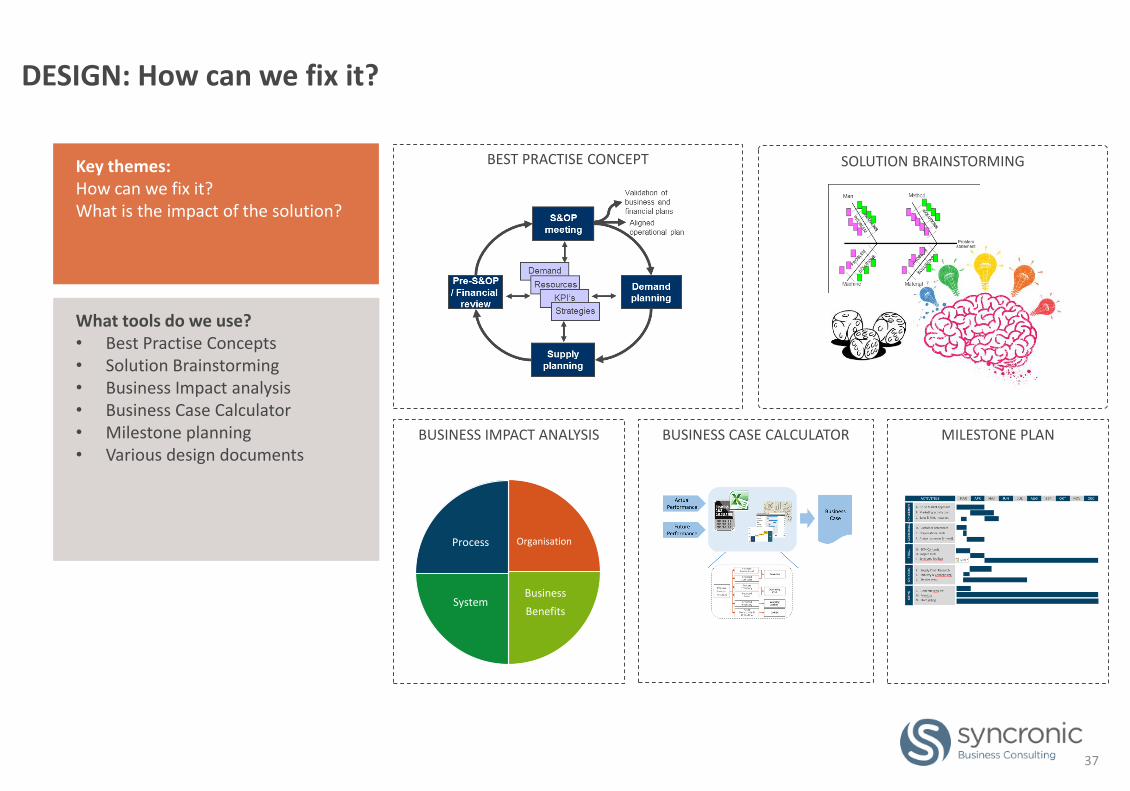
SOLUTION BRAINSTORMINGBEST PRACTISE CONCEPT
DESIGN: How can we fix it?
BUSINESS IMPACT ANALYSIS
Organisation
Business
BenefitsSystem
Process
BUSINESS CASE CALCULATOR MILESTONE PLAN
37
Key themes:How can we fix it?What is the impact of the solution?
What tools do we use?• Best Practise Concepts• Solution Brainstorming • Business Impact analysis• Business Case Calculator• Milestone planning• Various design documents
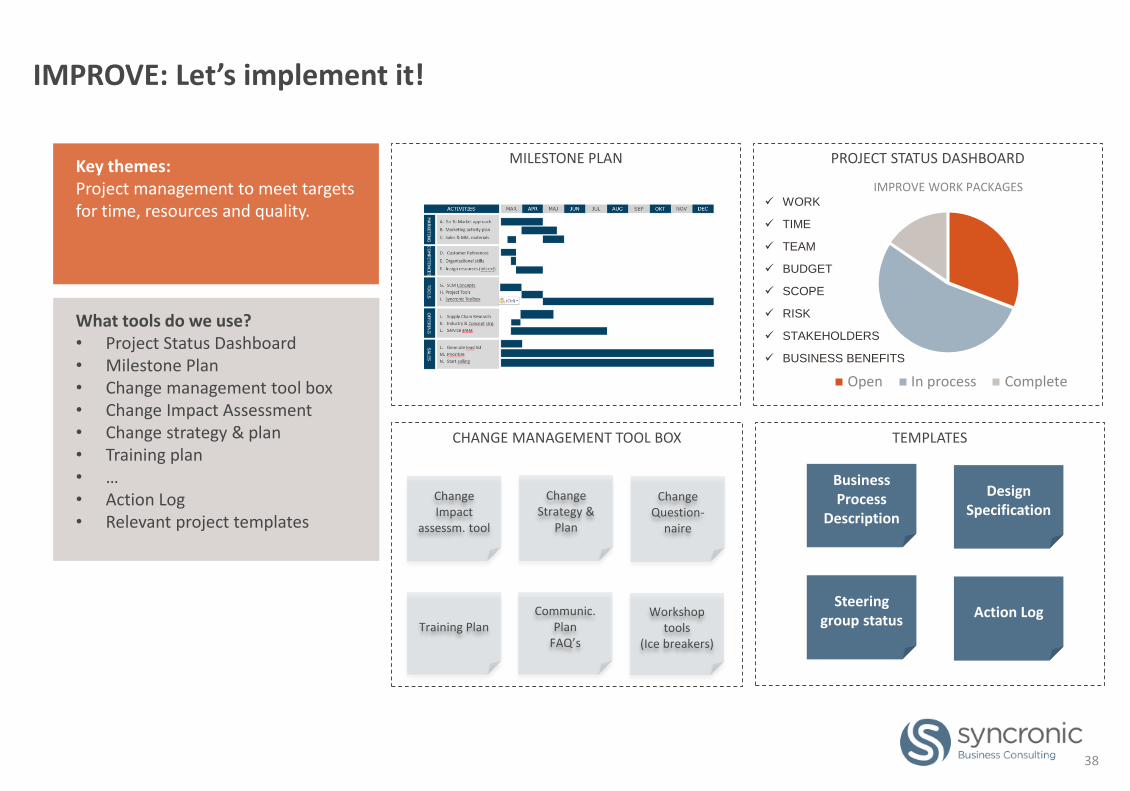
IMPROVE: Let’s implement it!
Key themes:Project management to meet targets for time, resources and quality.
PROJECT STATUS DASHBOARDMILESTONE PLAN
TEMPLATESCHANGE MANAGEMENT TOOL BOX
IMPROVE WORK PACKAGES
Open In process Complete
ChangeImpact
assessm. tool
ChangeStrategy &
Plan
Training PlanCommunic.
PlanFAQ’s
DesignSpecification
ChangeQuestion-
naire
Workshop tools
(Ice breakers)
Business Process
Description
Steering group status
Action Log
WORK
TIME
TEAM
BUDGET
SCOPE
RISK
STAKEHOLDERS
BUSINESS BENEFITS
38
Key themes:Project management to meet targets for time, resources and quality.
What tools do we use?• Project Status Dashboard• Milestone Plan• Change management tool box• Change Impact Assessment• Change strategy & plan• Training plan• …• Action Log• Relevant project templates
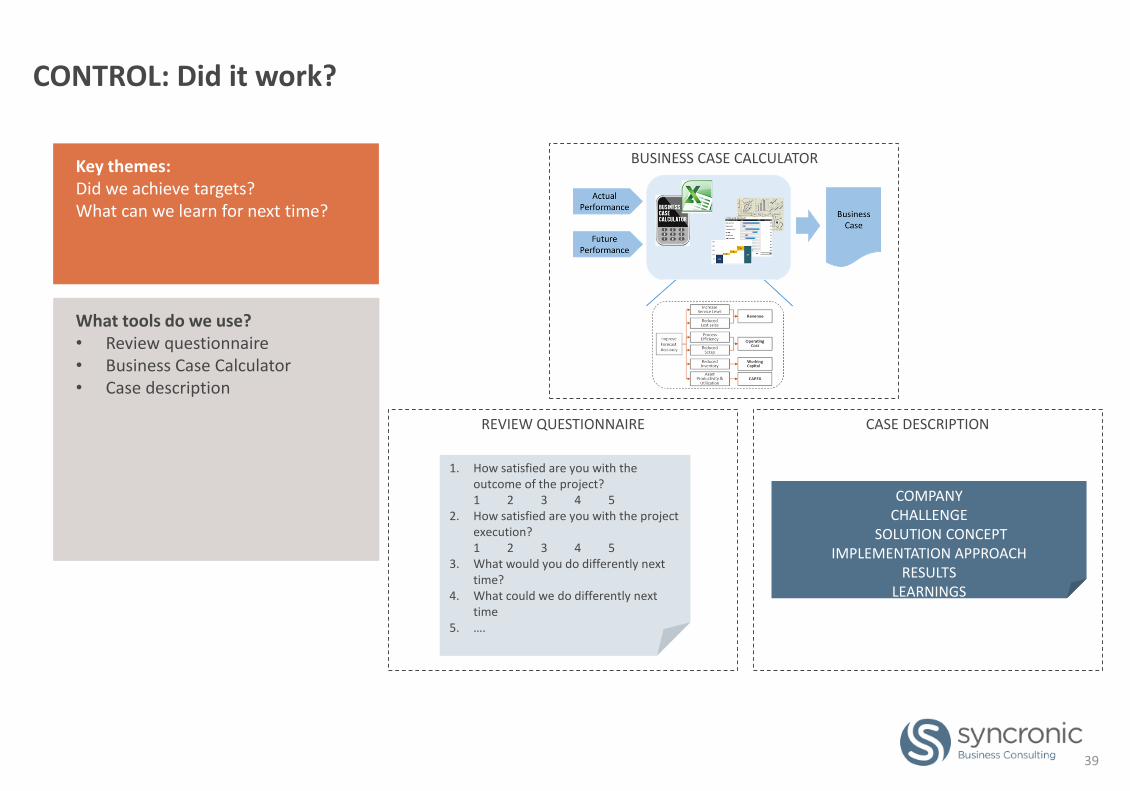
CONTROL: Did it work?
BUSINESS CASE CALCULATOR
REVIEW QUESTIONNAIRE CASE DESCRIPTION
1. How satisfied are you with the outcome of the project?1 2 3 4 5
2. How satisfied are you with the project execution?1 2 3 4 5
3. What would you do differently next time?
4. What could we do differently next time
5. ….
COMPANYCHALLENGE
SOLUTION CONCEPTIMPLEMENTATION APPROACH
RESULTSLEARNINGS
39
Key themes:Did we achieve targets?What can we learn for next time?
What tools do we use?• Review questionnaire• Business Case Calculator• Case description
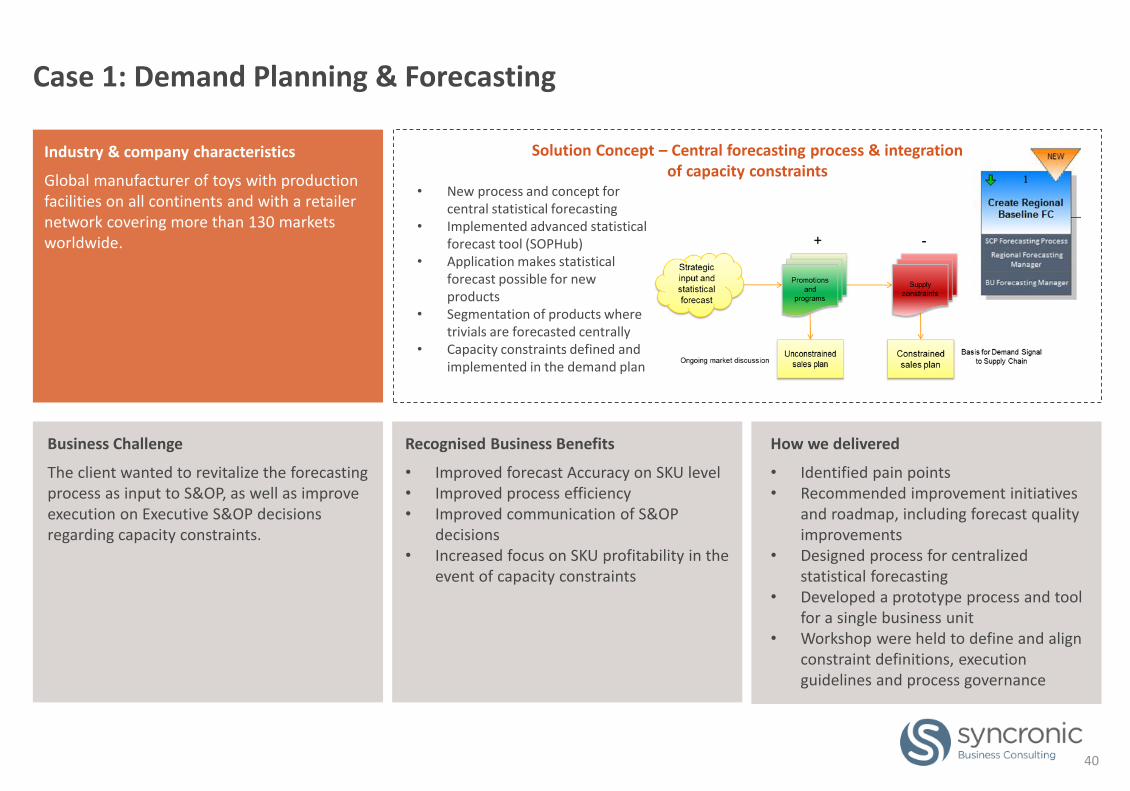
Case 1: Demand Planning & Forecasting
Industry & company characteristics
Global manufacturer of toys with production facilities on all continents and with a retailernetwork covering more than 130 marketsworldwide.
Business Challenge
The client wanted to revitalize the forecasting process as input to S&OP, as well as improve execution on Executive S&OP decisions regarding capacity constraints.
Recognised Business Benefits
• Improved forecast Accuracy on SKU level• Improved process efficiency• Improved communication of S&OP
decisions• Increased focus on SKU profitability in the
event of capacity constraints
How we delivered
• Identified pain points• Recommended improvement initiatives
and roadmap, including forecast quality improvements
• Designed process for centralized statistical forecasting
• Developed a prototype process and tool for a single business unit
• Workshop were held to define and align constraint definitions, execution guidelines and process governance
Solution Concept – Central forecasting process & integration of capacity constraints
• New process and concept for central statistical forecasting
• Implemented advanced statistical forecast tool (SOPHub)
• Application makes statistical forecast possible for new products
• Segmentation of products where trivials are forecasted centrally
• Capacity constraints defined and implemented in the demand plan
40
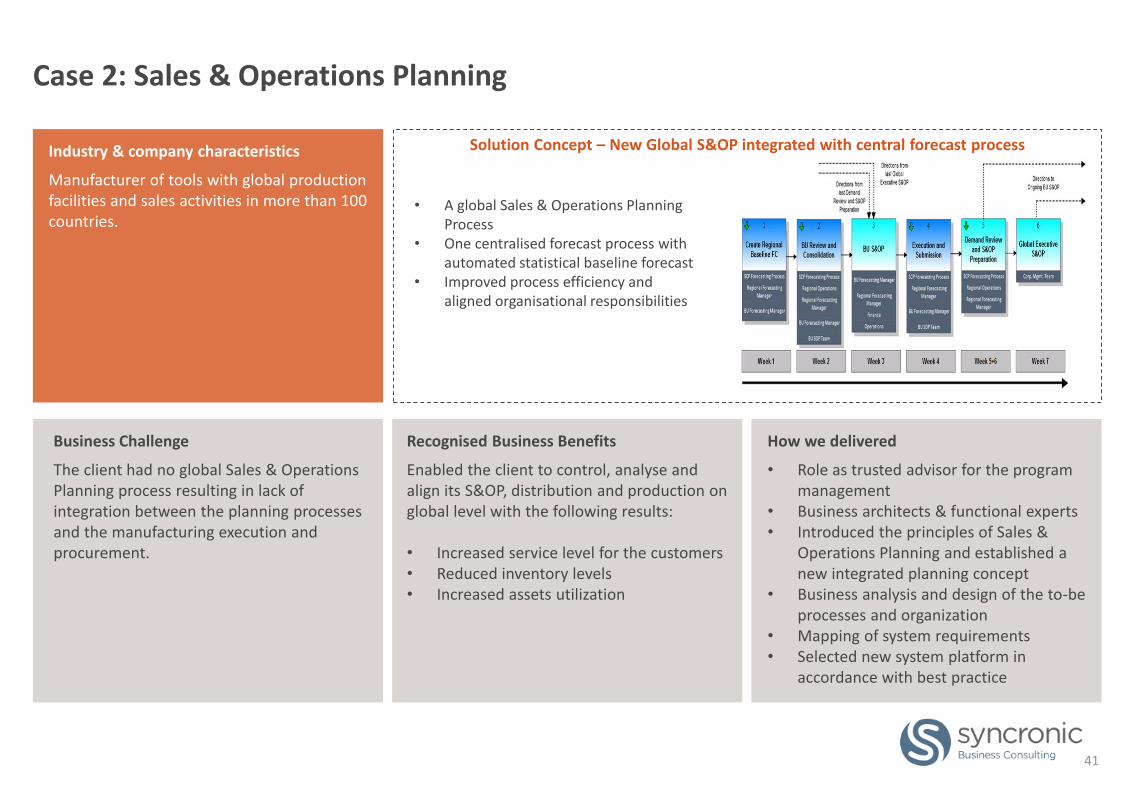
Case 2: Sales & Operations Planning
Industry & company characteristics
Manufacturer of tools with global production facilities and sales activities in more than 100 countries.
Business Challenge
The client had no global Sales & Operations Planning process resulting in lack of integration between the planning processes and the manufacturing execution and procurement.
Recognised Business Benefits
Enabled the client to control, analyse and align its S&OP, distribution and production on global level with the following results:
• Increased service level for the customers• Reduced inventory levels• Increased assets utilization
How we delivered
• Role as trusted advisor for the program management
• Business architects & functional experts• Introduced the principles of Sales &
Operations Planning and established a new integrated planning concept
• Business analysis and design of the to-be processes and organization
• Mapping of system requirements• Selected new system platform in
accordance with best practice
Solution Concept – New Global S&OP integrated with central forecast process
• A global Sales & Operations Planning Process
• One centralised forecast process with automated statistical baseline forecast
• Improved process efficiency and aligned organisational responsibilities
41
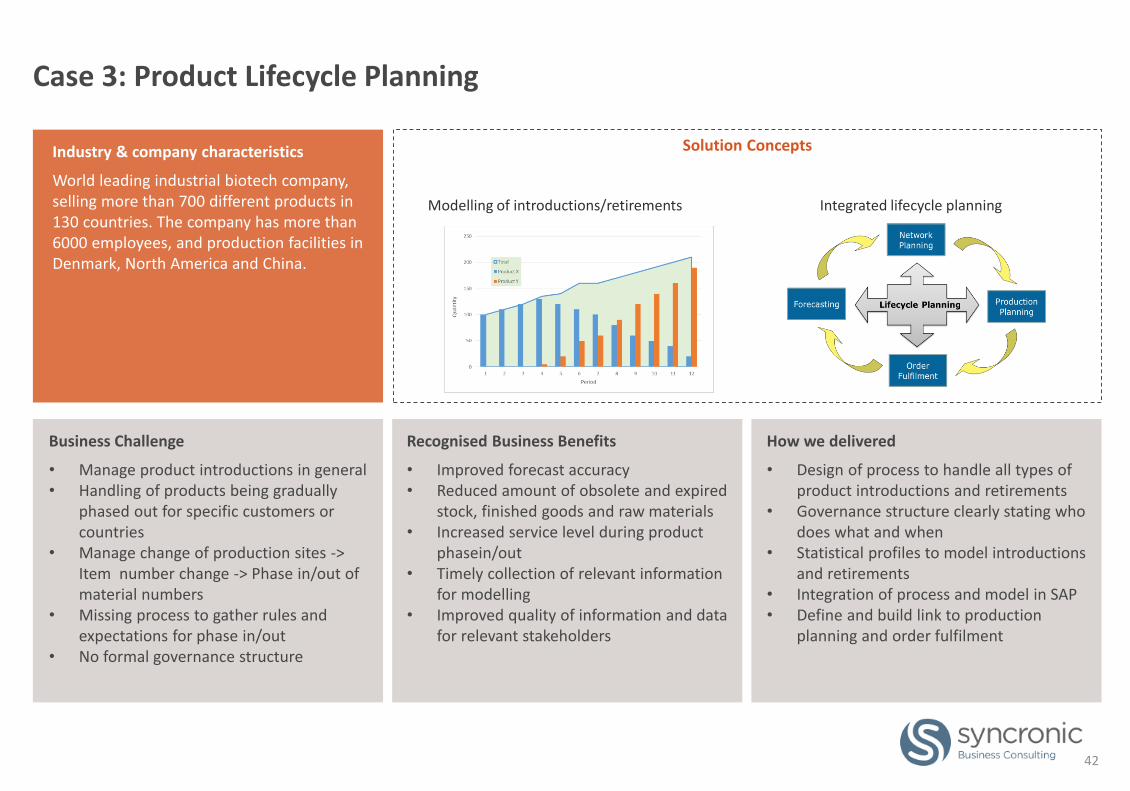
Case 3: Product Lifecycle Planning
Industry & company characteristics
World leading industrial biotech company, selling more than 700 different products in 130 countries. The company has more than 6000 employees, and production facilities in Denmark, North America and China.
Business Challenge
• Manage product introductions in general• Handling of products being gradually
phased out for specific customers or countries
• Manage change of production sites -> Item number change -> Phase in/out of material numbers
• Missing process to gather rules and expectations for phase in/out
• No formal governance structure
Recognised Business Benefits
• Improved forecast accuracy• Reduced amount of obsolete and expired
stock, finished goods and raw materials• Increased service level during product
phasein/out• Timely collection of relevant information
for modelling• Improved quality of information and data
for relevant stakeholders
How we delivered
• Design of process to handle all types of product introductions and retirements
• Governance structure clearly stating who does what and when
• Statistical profiles to model introductions and retirements
• Integration of process and model in SAP• Define and build link to production
planning and order fulfilment
Solution Concepts
Integrated lifecycle planningModelling of introductions/retirements
42
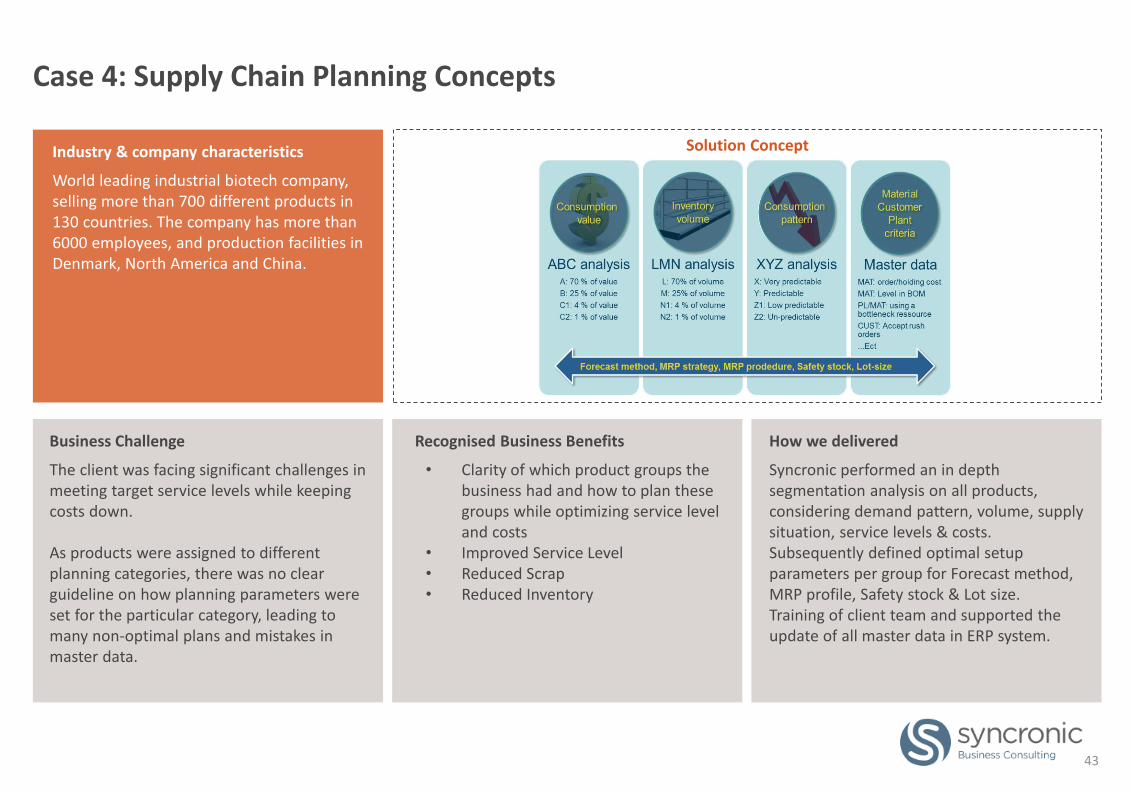
Case 4: Supply Chain Planning Concepts
Industry & company characteristics
World leading industrial biotech company, selling more than 700 different products in 130 countries. The company has more than 6000 employees, and production facilities in Denmark, North America and China.
Business Challenge
The client was facing significant challenges in meeting target service levels while keeping costs down.
As products were assigned to different planning categories, there was no clear guideline on how planning parameters were set for the particular category, leading to many non-optimal plans and mistakes in master data.
Recognised Business Benefits
• Clarity of which product groups the business had and how to plan these groups while optimizing service level and costs
• Improved Service Level• Reduced Scrap• Reduced Inventory
How we delivered
Syncronic performed an in depth segmentation analysis on all products, considering demand pattern, volume, supply situation, service levels & costs.Subsequently defined optimal setup parameters per group for Forecast method, MRP profile, Safety stock & Lot size.Training of client team and supported the update of all master data in ERP system.
Solution Concept
43
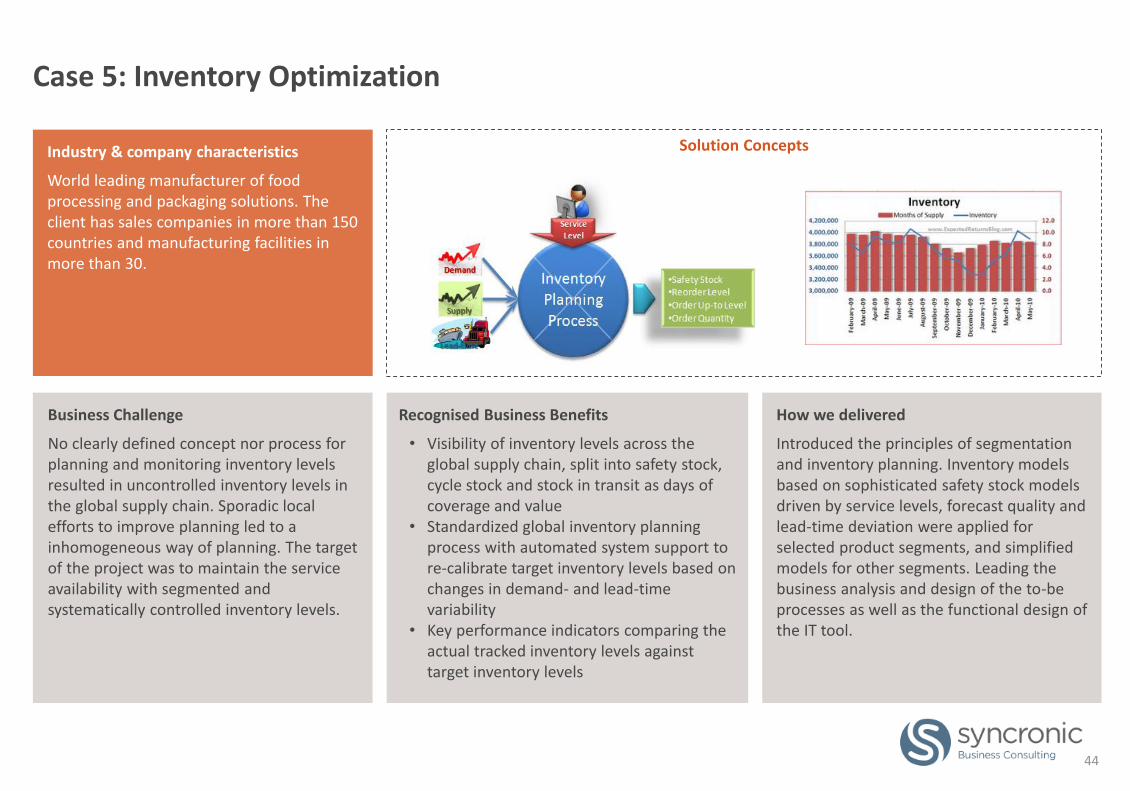
Case 5: Inventory Optimization
Industry & company characteristics
World leading manufacturer of food processing and packaging solutions. The client has sales companies in more than 150 countries and manufacturing facilities in more than 30.
Business Challenge
No clearly defined concept nor process for planning and monitoring inventory levels resulted in uncontrolled inventory levels in the global supply chain. Sporadic local efforts to improve planning led to a inhomogeneous way of planning. The target of the project was to maintain the service availability with segmented and systematically controlled inventory levels.
Recognised Business Benefits
• Visibility of inventory levels across the global supply chain, split into safety stock, cycle stock and stock in transit as days of coverage and value
• Standardized global inventory planning process with automated system support to re-calibrate target inventory levels based on changes in demand- and lead-time variability
• Key performance indicators comparing the actual tracked inventory levels against target inventory levels
How we delivered
Introduced the principles of segmentation and inventory planning. Inventory models based on sophisticated safety stock models driven by service levels, forecast quality and lead-time deviation were applied for selected product segments, and simplified models for other segments. Leading the business analysis and design of the to-be processes as well as the functional design of the IT tool.
Solution Concepts
44
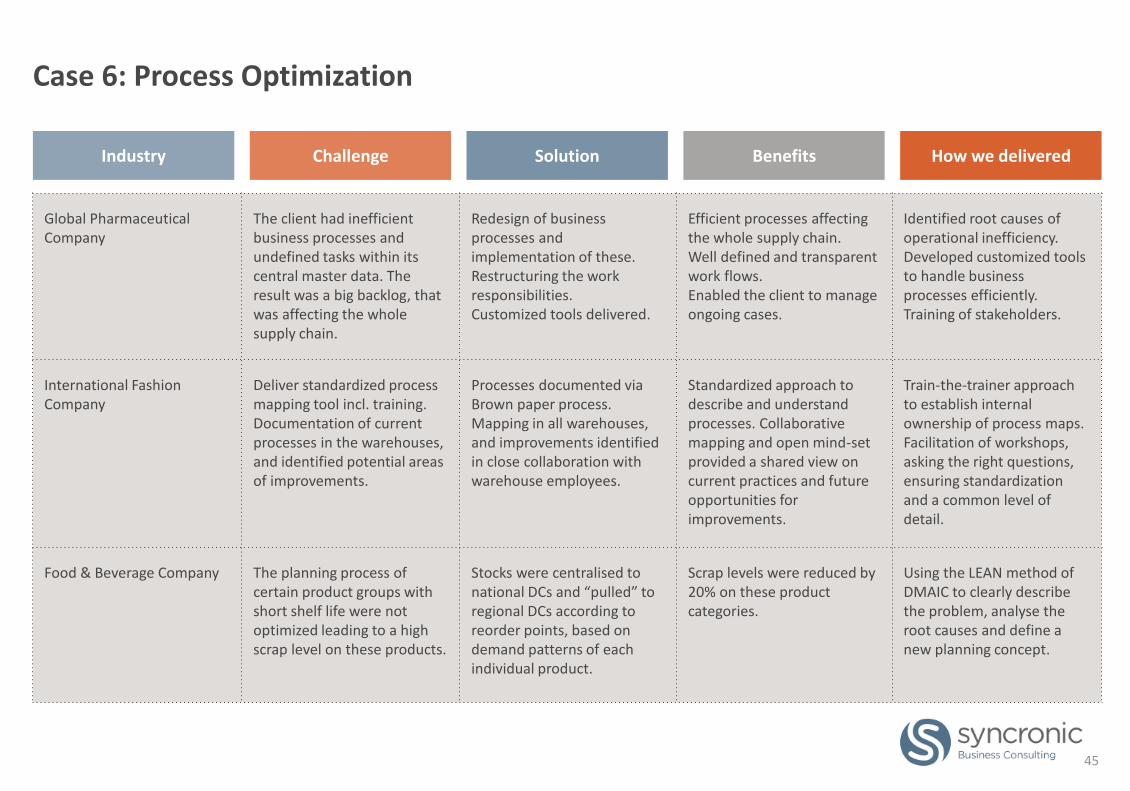
Case 6: Process Optimization
Global Pharmaceutical Company
The client had inefficient business processes and undefined tasks within its central master data. The result was a big backlog, that was affecting the whole supply chain.
Redesign of business processes and implementation of these.Restructuring the work responsibilities.Customized tools delivered.
Efficient processes affecting the whole supply chain.Well defined and transparent work flows.Enabled the client to manage ongoing cases.
Identified root causes of operational inefficiency.Developed customized tools to handle business processes efficiently.Training of stakeholders.
International Fashion Company
Deliver standardized process mapping tool incl. training.Documentation of current processes in the warehouses, and identified potential areas of improvements.
Processes documented via Brown paper process. Mapping in all warehouses, and improvements identified in close collaboration with warehouse employees.
Standardized approach to describe and understand processes. Collaborative mapping and open mind-set provided a shared view on current practices and future opportunities for improvements.
Train-the-trainer approach to establish internal ownership of process maps. Facilitation of workshops, asking the right questions, ensuring standardization and a common level of detail.
Food & Beverage Company The planning process of certain product groups with short shelf life were not optimized leading to a high scrap level on these products.
Stocks were centralised to national DCs and “pulled” to regional DCs according to reorder points, based on demand patterns of each individual product.
Scrap levels were reduced by 20% on these product categories.
Using the LEAN method of DMAIC to clearly describe the problem, analyse the root causes and define a new planning concept.
45
Industry Challenge Solution Benefits How we delivered
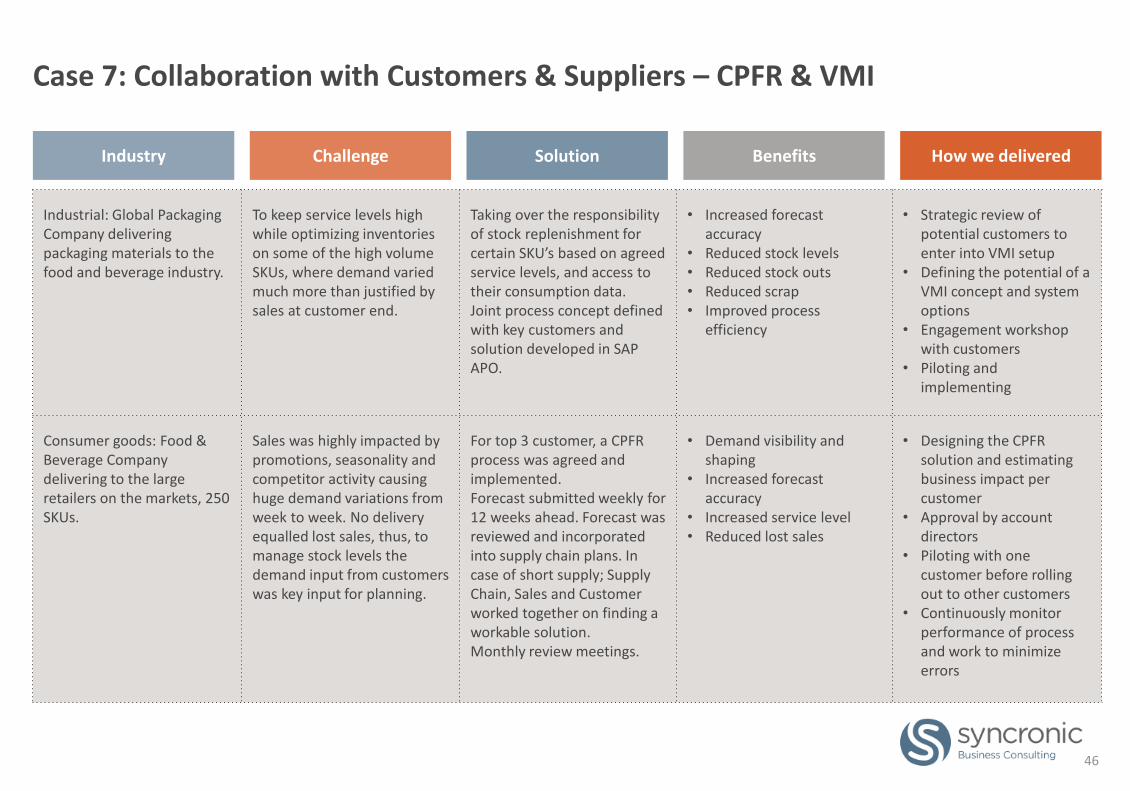
Case 7: Collaboration with Customers & Suppliers – CPFR & VMI
46
Industrial: Global Packaging Company delivering packaging materials to the food and beverage industry.
To keep service levels high while optimizing inventories on some of the high volume SKUs, where demand varied much more than justified by sales at customer end.
Taking over the responsibility of stock replenishment for certain SKU’s based on agreed service levels, and access to their consumption data.Joint process concept defined with key customers and solution developed in SAP APO.
• Increased forecast accuracy
• Reduced stock levels• Reduced stock outs• Reduced scrap• Improved process
efficiency
• Strategic review of potential customers to enter into VMI setup
• Defining the potential of a VMI concept and system options
• Engagement workshop with customers
• Piloting and implementing
Consumer goods: Food & Beverage Company delivering to the large retailers on the markets, 250 SKUs.
Sales was highly impacted by promotions, seasonality and competitor activity causing huge demand variations from week to week. No delivery equalled lost sales, thus, to manage stock levels the demand input from customers was key input for planning.
For top 3 customer, a CPFR process was agreed and implemented.Forecast submitted weekly for 12 weeks ahead. Forecast was reviewed and incorporated into supply chain plans. In case of short supply; Supply Chain, Sales and Customer worked together on finding a workable solution.Monthly review meetings.
• Demand visibility and shaping
• Increased forecast accuracy
• Increased service level• Reduced lost sales
• Designing the CPFR solution and estimating business impact per customer
• Approval by account directors
• Piloting with one customer before rolling out to other customers
• Continuously monitor performance of process and work to minimize errors
Industry Challenge Solution Benefits How we delivered
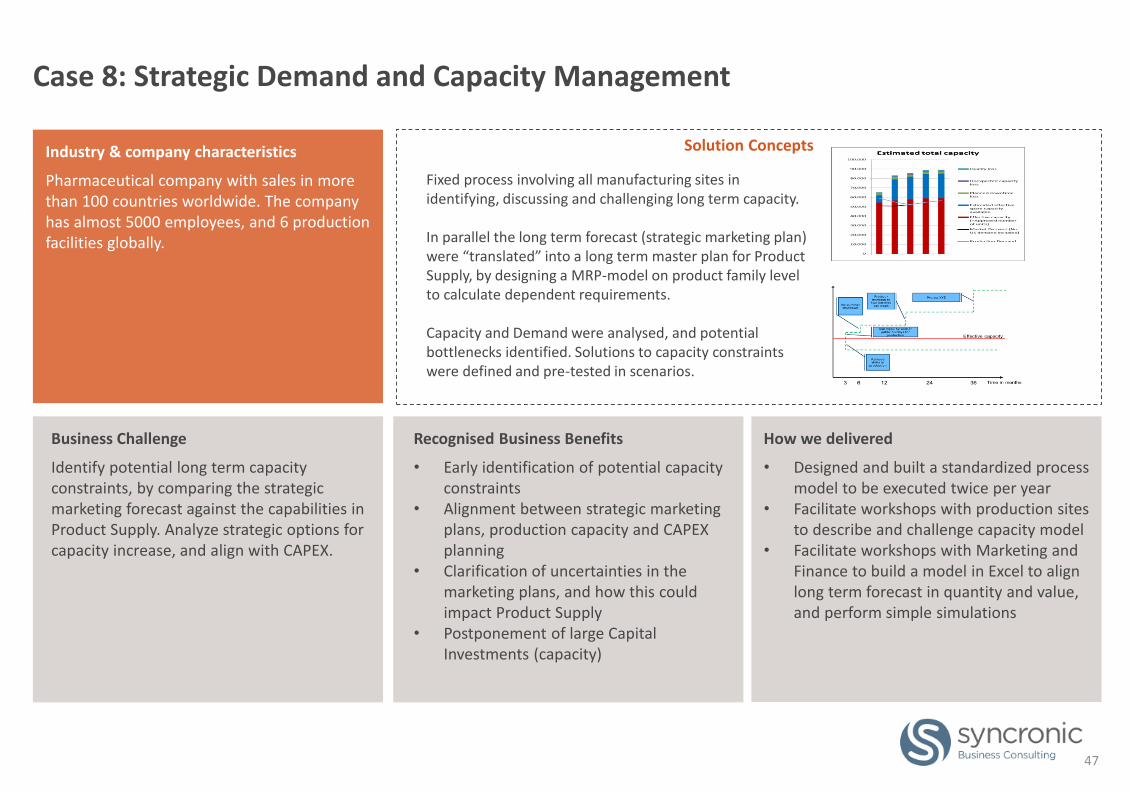
Case 8: Strategic Demand and Capacity Management
Industry & company characteristics
Pharmaceutical company with sales in more than 100 countries worldwide. The company has almost 5000 employees, and 6 production facilities globally.
Business Challenge
Identify potential long term capacity constraints, by comparing the strategic marketing forecast against the capabilities in Product Supply. Analyze strategic options for capacity increase, and align with CAPEX.
Recognised Business Benefits
• Early identification of potential capacity constraints
• Alignment between strategic marketing plans, production capacity and CAPEX planning
• Clarification of uncertainties in the marketing plans, and how this could impact Product Supply
• Postponement of large Capital Investments (capacity)
How we delivered
• Designed and built a standardized process model to be executed twice per year
• Facilitate workshops with production sites to describe and challenge capacity model
• Facilitate workshops with Marketing and Finance to build a model in Excel to align long term forecast in quantity and value, and perform simple simulations
Solution Concepts
Fixed process involving all manufacturing sites in identifying, discussing and challenging long term capacity.
In parallel the long term forecast (strategic marketing plan) were “translated” into a long term master plan for Product Supply, by designing a MRP-model on product family level to calculate dependent requirements.
Capacity and Demand were analysed, and potential bottlenecks identified. Solutions to capacity constraints were defined and pre-tested in scenarios.
47
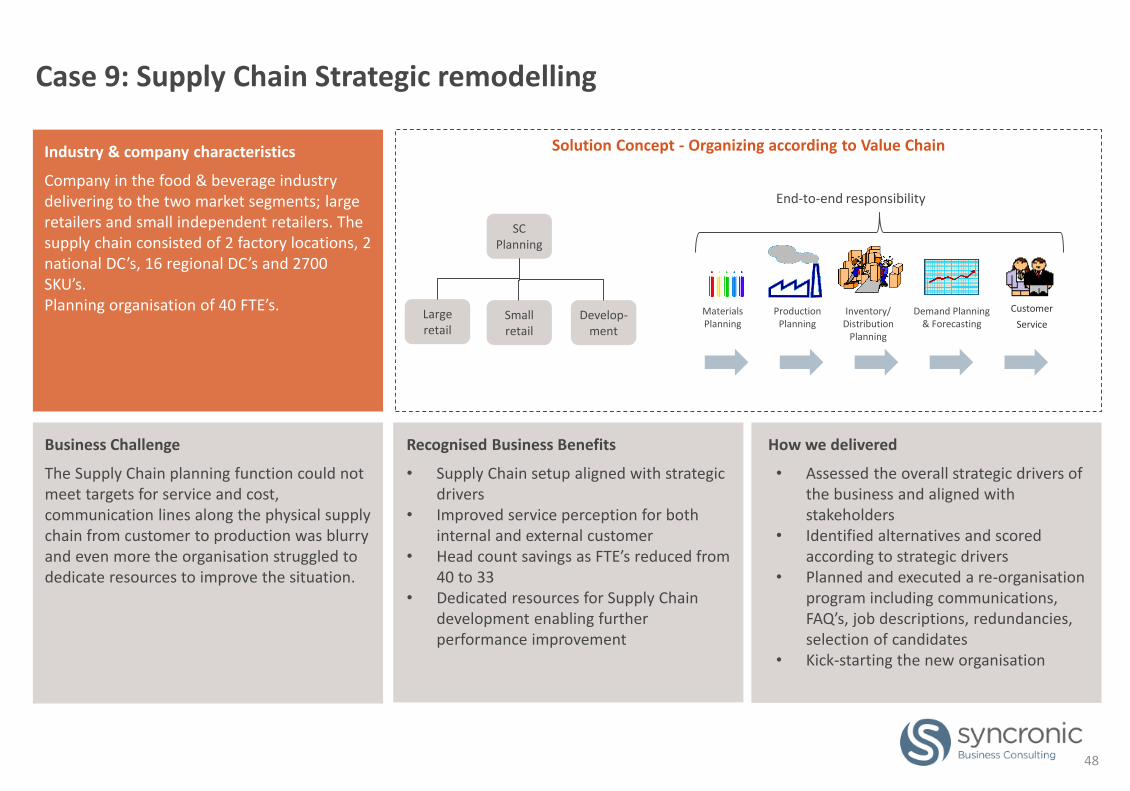
Case 9: Supply Chain Strategic remodelling
Industry & company characteristics
Company in the food & beverage industry delivering to the two market segments; large retailers and small independent retailers. The supply chain consisted of 2 factory locations, 2 national DC’s, 16 regional DC’s and 2700 SKU’s.Planning organisation of 40 FTE’s.
Business Challenge
The Supply Chain planning function could not meet targets for service and cost, communication lines along the physical supply chain from customer to production was blurry and even more the organisation struggled to dedicate resources to improve the situation.
Recognised Business Benefits
• Supply Chain setup aligned with strategic drivers
• Improved service perception for both internal and external customer
• Head count savings as FTE’s reduced from 40 to 33
• Dedicated resources for Supply Chain development enabling further performance improvement
How we delivered
• Assessed the overall strategic drivers of the business and aligned with stakeholders
• Identified alternatives and scored according to strategic drivers
• Planned and executed a re-organisation program including communications, FAQ’s, job descriptions, redundancies, selection of candidates
• Kick-starting the new organisation
Solution Concept - Organizing according to Value Chain
Large retail
Small retail
Develop-ment
SCPlanning
Customer
ServiceDemand Planning
& ForecastingInventory/
DistributionPlanning
ProductionPlanning
MaterialsPlanning
End-to-end responsibility
48
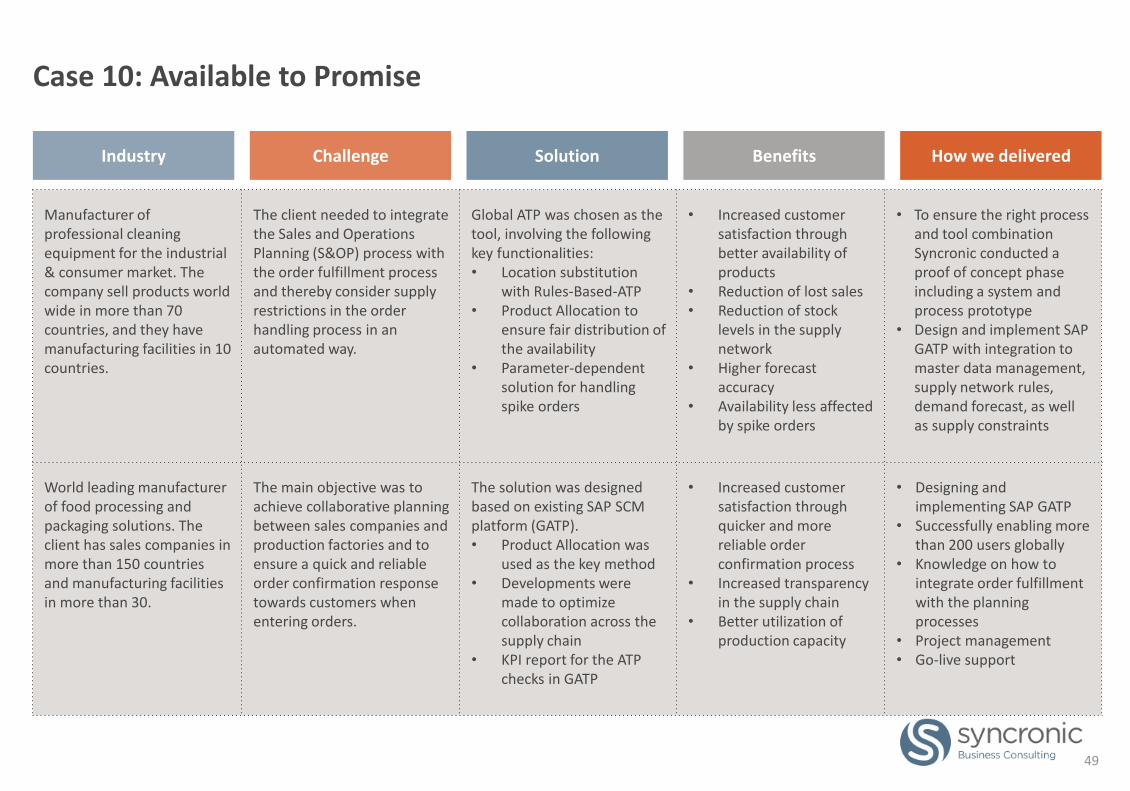
Case 10: Available to Promise
Manufacturer of professional cleaning equipment for the industrial & consumer market. The company sell products world wide in more than 70 countries, and they have manufacturing facilities in 10 countries.
The client needed to integrate the Sales and Operations Planning (S&OP) process with the order fulfillment process and thereby consider supply restrictions in the order handling process in an automated way.
Global ATP was chosen as the tool, involving the following key functionalities:• Location substitution
with Rules-Based-ATP• Product Allocation to
ensure fair distribution of the availability
• Parameter-dependent solution for handling spike orders
• Increased customer satisfaction through better availability of products
• Reduction of lost sales• Reduction of stock
levels in the supply network
• Higher forecast accuracy
• Availability less affected by spike orders
• To ensure the right process and tool combination Syncronic conducted a proof of concept phase including a system and process prototype
• Design and implement SAP GATP with integration to master data management, supply network rules, demand forecast, as well as supply constraints
World leading manufacturer of food processing and packaging solutions. The client has sales companies in more than 150 countries and manufacturing facilities in more than 30.
The main objective was to achieve collaborative planning between sales companies and production factories and to ensure a quick and reliable order confirmation response towards customers when entering orders.
The solution was designed based on existing SAP SCM platform (GATP). • Product Allocation was
used as the key method• Developments were
made to optimize collaboration across the supply chain
• KPI report for the ATP checks in GATP
• Increased customer satisfaction through quicker and more reliable order confirmation process
• Increased transparency in the supply chain
• Better utilization of production capacity
• Designing and implementing SAP GATP
• Successfully enabling more than 200 users globally
• Knowledge on how to integrate order fulfillment with the planning processes
• Project management• Go-live support
Industry Challenge Solution Benefits How we delivered
49
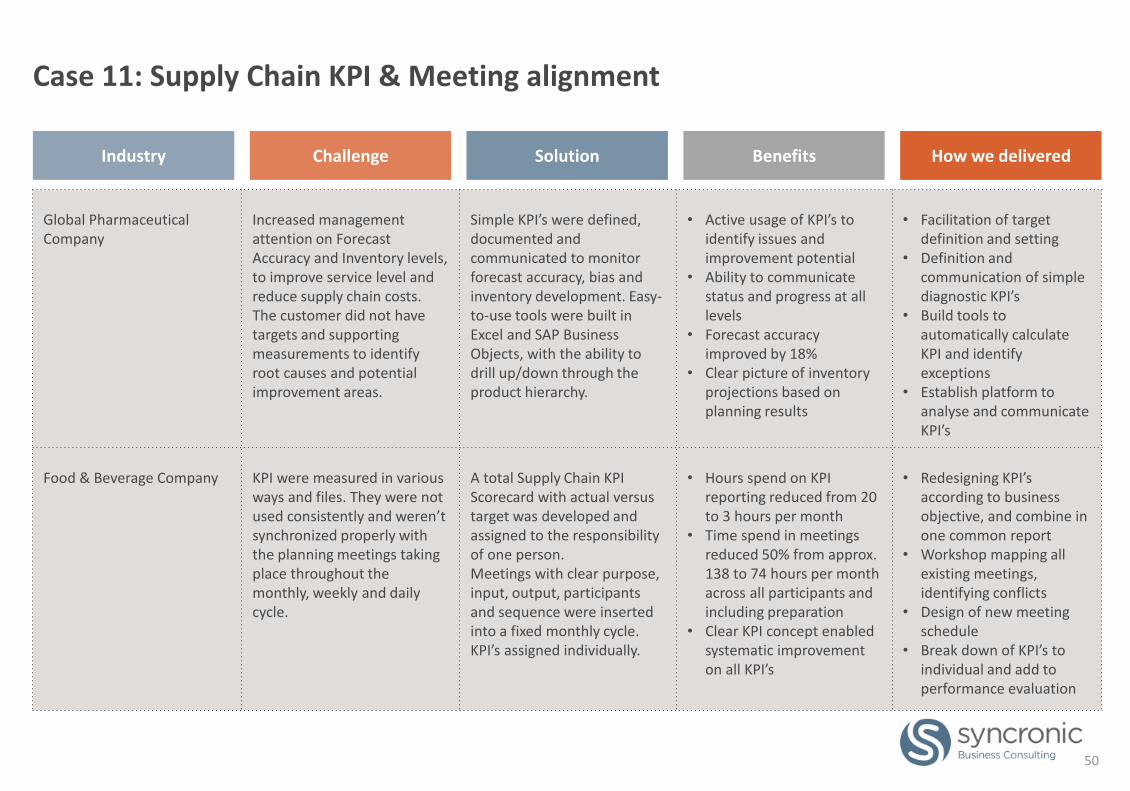
Case 11: Supply Chain KPI & Meeting alignment
Global Pharmaceutical Company
Increased management attention on Forecast Accuracy and Inventory levels, to improve service level and reduce supply chain costs. The customer did not have targets and supporting measurements to identify root causes and potential improvement areas.
Simple KPI’s were defined, documented and communicated to monitor forecast accuracy, bias and inventory development. Easy-to-use tools were built in Excel and SAP Business Objects, with the ability to drill up/down through the product hierarchy.
• Active usage of KPI’s to identify issues and improvement potential
• Ability to communicate status and progress at all levels
• Forecast accuracy improved by 18%
• Clear picture of inventory projections based on planning results
• Facilitation of target definition and setting
• Definition and communication of simple diagnostic KPI’s
• Build tools to automatically calculate KPI and identify exceptions
• Establish platform to analyse and communicate KPI’s
Food & Beverage Company KPI were measured in various ways and files. They were not used consistently and weren’t synchronized properly with the planning meetings taking place throughout the monthly, weekly and daily cycle.
A total Supply Chain KPI Scorecard with actual versus target was developed and assigned to the responsibility of one person.Meetings with clear purpose, input, output, participants and sequence were inserted into a fixed monthly cycle.KPI’s assigned individually.
• Hours spend on KPI reporting reduced from 20 to 3 hours per month
• Time spend in meetings reduced 50% from approx. 138 to 74 hours per month across all participants and including preparation
• Clear KPI concept enabled systematic improvement on all KPI’s
• Redesigning KPI’s according to business objective, and combine in one common report
• Workshop mapping all existing meetings, identifying conflicts
• Design of new meeting schedule
• Break down of KPI’s to individual and add to performance evaluation
50
Industry Challenge Solution Benefits How we delivered
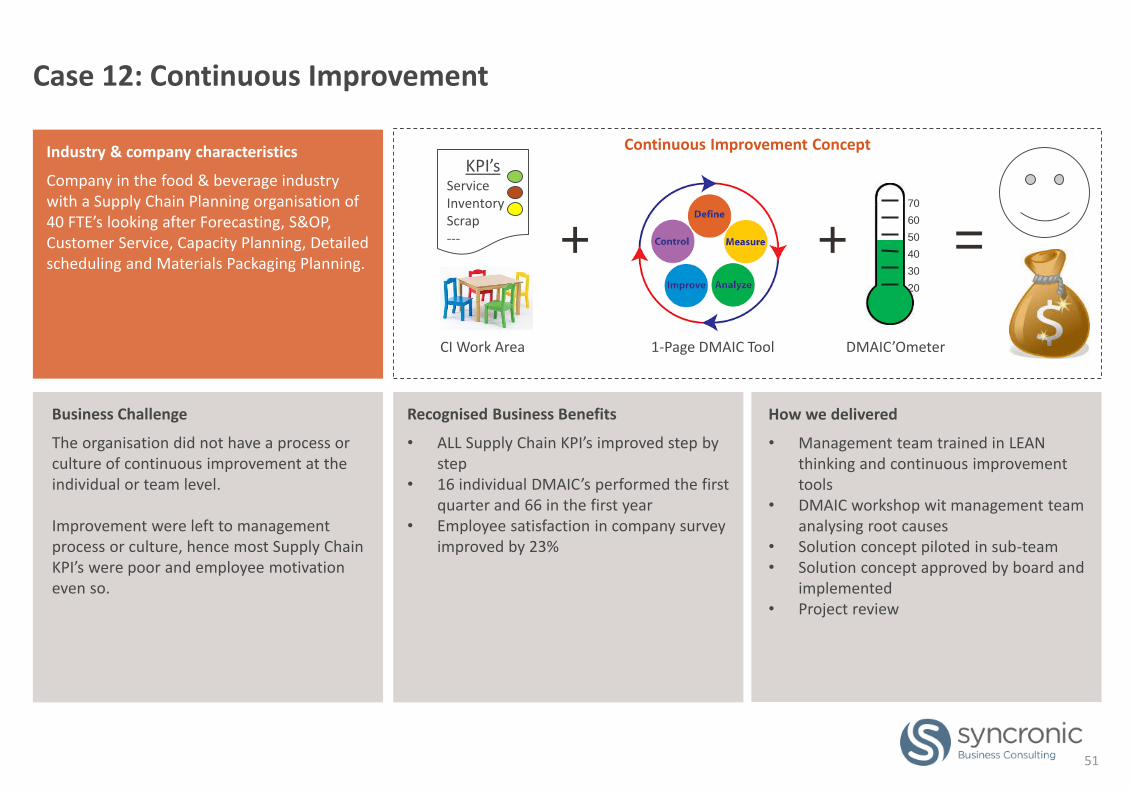
Case 12: Continuous Improvement
Industry & company characteristics
Company in the food & beverage industry with a Supply Chain Planning organisation of 40 FTE’s looking after Forecasting, S&OP, Customer Service, Capacity Planning, Detailed scheduling and Materials Packaging Planning.
Business Challenge
The organisation did not have a process or culture of continuous improvement at the individual or team level.
Improvement were left to management process or culture, hence most Supply Chain KPI’s were poor and employee motivation even so.
Recognised Business Benefits
• ALL Supply Chain KPI’s improved step by step
• 16 individual DMAIC’s performed the first quarter and 66 in the first year
• Employee satisfaction in company survey improved by 23%
How we delivered
• Management team trained in LEAN thinking and continuous improvement tools
• DMAIC workshop wit management team analysing root causes
• Solution concept piloted in sub-team• Solution concept approved by board and
implemented• Project review
Continuous Improvement Concept
1-Page DMAIC Tool
+ + =
DMAIC’Ometer
70
60
50
40
30
20
CI Work Area
KPI’sServiceInventoryScrap---
51
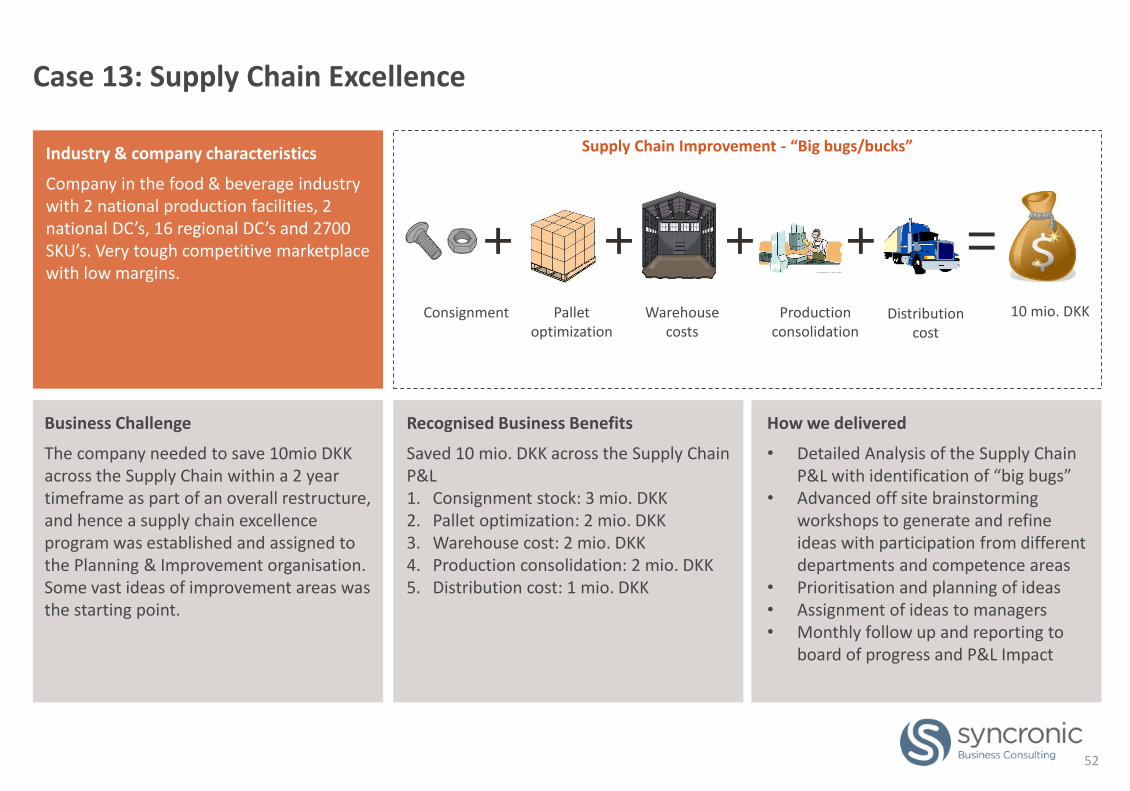
Case 13: Supply Chain Excellence
Industry & company characteristics
Company in the food & beverage industry with 2 national production facilities, 2 national DC’s, 16 regional DC’s and 2700 SKU’s. Very tough competitive marketplace with low margins.
Business Challenge
The company needed to save 10mio DKK across the Supply Chain within a 2 year timeframe as part of an overall restructure, and hence a supply chain excellence program was established and assigned to the Planning & Improvement organisation.Some vast ideas of improvement areas was the starting point.
Recognised Business Benefits
Saved 10 mio. DKK across the Supply Chain P&L1. Consignment stock: 3 mio. DKK2. Pallet optimization: 2 mio. DKK3. Warehouse cost: 2 mio. DKK4. Production consolidation: 2 mio. DKK5. Distribution cost: 1 mio. DKK
How we delivered
• Detailed Analysis of the Supply Chain P&L with identification of “big bugs”
• Advanced off site brainstorming workshops to generate and refine ideas with participation from different departments and competence areas
• Prioritisation and planning of ideas• Assignment of ideas to managers• Monthly follow up and reporting to
board of progress and P&L Impact
Supply Chain Improvement - “Big bugs/bucks”
10 mio. DKK
+ + =Consignment
+ +Pallet
optimizationWarehouse
costsProduction
consolidationDistribution
cost
52

Notes
53
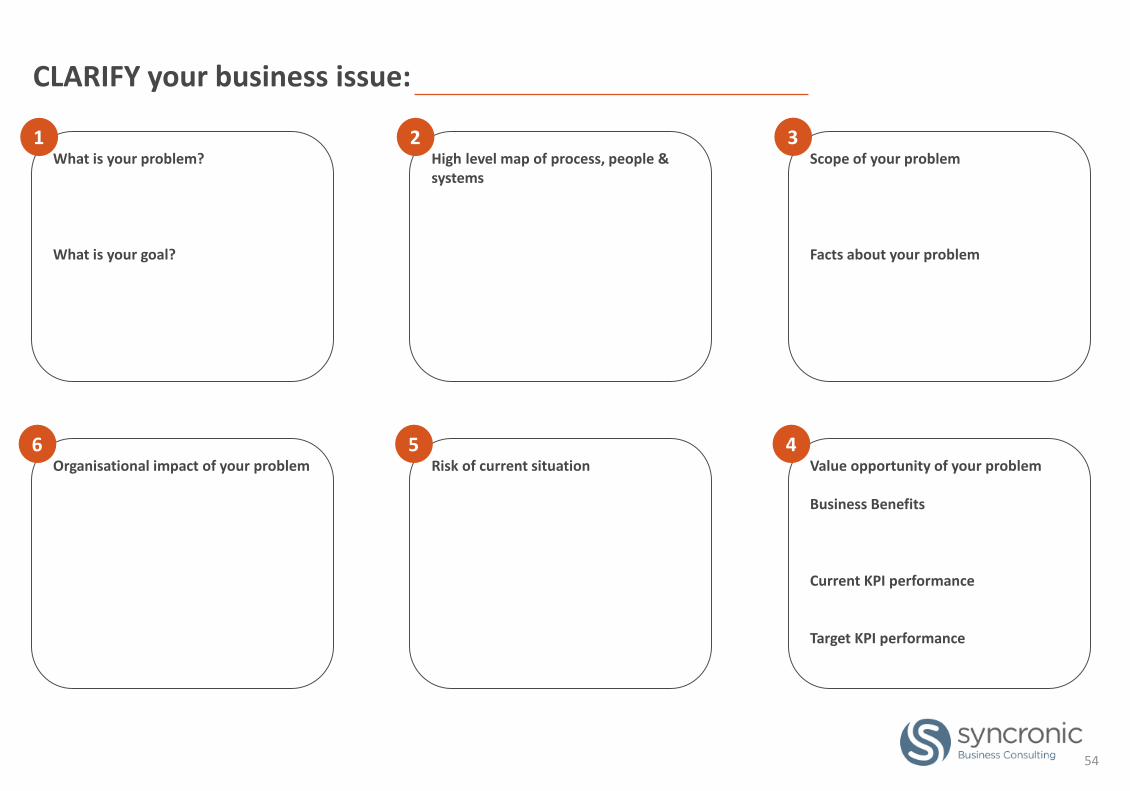
CLARIFY your business issue:
54
What is your problem?
What is your goal?
High level map of process, people & systems
Scope of your problem
Facts about your problem
Organisational impact of your problem Risk of current situation Value opportunity of your problem
Business Benefits
Current KPI performance
Target KPI performance
1 2 3
6 5 4
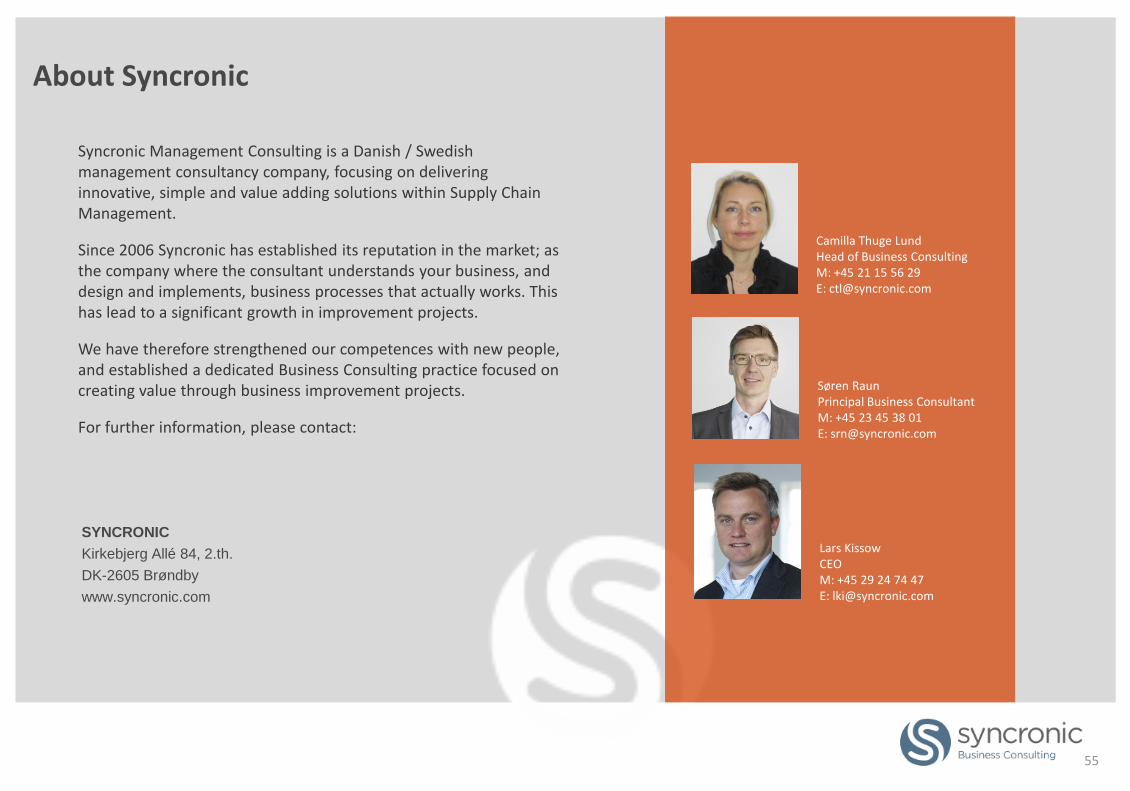
About Syncronic
Syncronic Management Consulting is a Danish / Swedish management consultancy company, focusing on delivering innovative, simple and value adding solutions within Supply Chain Management.
Since 2006 Syncronic has established its reputation in the market; as the company where the consultant understands your business, and design and implements, business processes that actually works. This has lead to a significant growth in improvement projects.
We have therefore strengthened our competences with new people, and established a dedicated Business Consulting practice focused on creating value through business improvement projects.
For further information, please contact:
Camilla Thuge LundHead of Business ConsultingM: +45 21 15 56 29E: [email protected]
Lars KissowCEOM: +45 29 24 74 47E: [email protected]
Søren RaunPrincipal Business ConsultantM: +45 23 45 38 01 E: [email protected]
55
SYNCRONIC
Kirkebjerg Allé 84, 2.th.
DK-2605 Brøndby
www.syncronic.com