reduction of digital instrument errors by means of automatic corrections and averaging
TRANSCRIPT
R E D U C T I O N OF D I G I T A L I N S T R U M E N T ERRORS BY M E A N S
OF A U T O M A T I C C O R R E C T I O N S AND A V E R A G I N G
Yu . A. N e s t e r e n k o , V. O. B o i k o v , a n d A. V. K o i n o v
UDC 681.2.085.36 : 543.27
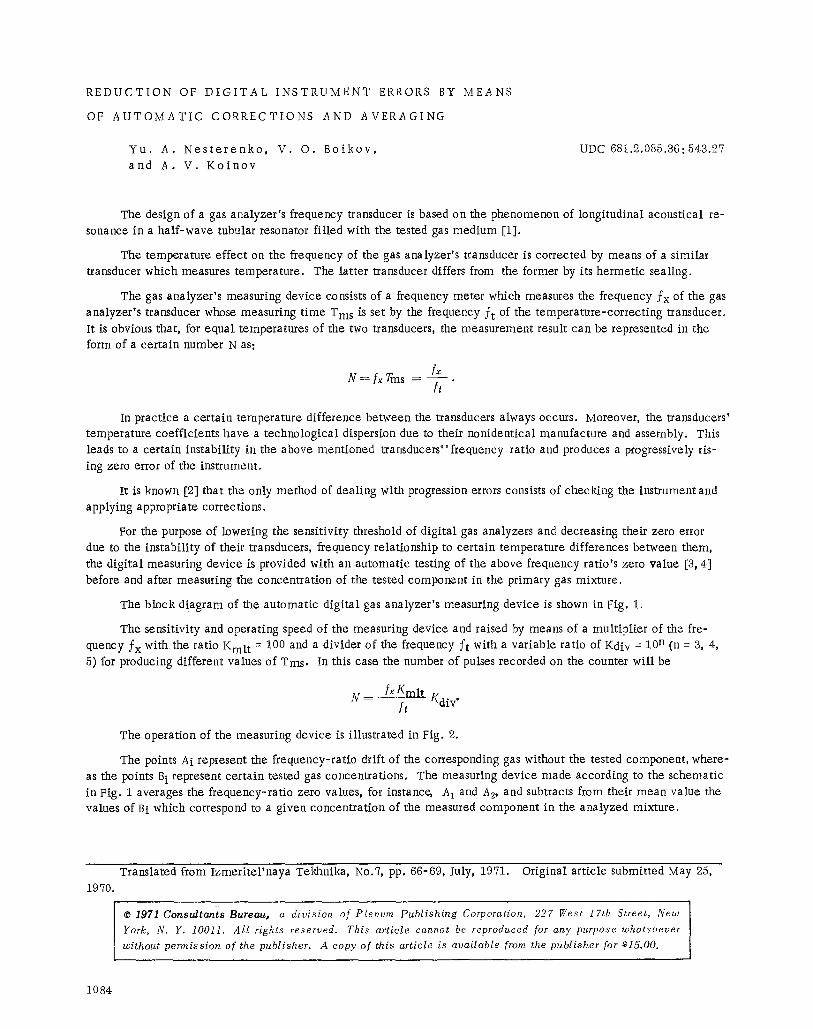
The design of a gas analyzer's frequency transducer is based on the phenomenon of longitudinal acoustical re- sonance in a half-wave tubular resonator filled with the tested gas medium [1].
The temperature effect on the frequency of the gas analyzer's transducer is corrected by means of a similar transducer which measures temperature. The latter transducer differs from the former by its hermetic sealing.
The gas analyzer 's measuring device consists of a frequency meter which measures the frequency fx of the gas analyzer 's transducer whose measuring time Tms is set by the frequency f t of the temperature-correcting transducer. It is obvious that, for equal temperatures of the two transducers, the measurement result can be represented in the form of a certain number N as:
f~ N = ix Tms --
h
In practice a certain temperature difference between the transducers always occurs. Moreover, the transducers' temperature coefficients have a technological dispersion due to their nonidentical manufacture and assembly. This leads to a certain instability in the above mentioned transducers ~' frequency ratio and produces a progressively ris- ing zero error of the instrument.
It is known [2] that the only method of dealing with progression errors consists of checking the instrumentand applying appropriate corrections.
For the purpose of lowering the sensitivity threshold of digital gas analyzers and decreasing their zero error due to the instability of their transducers, frequency relationship to certain temperature differences between them, the digital measuring device is provided with an automatic testing of the above frequency ratio's zero value [3, 4] before and after measuring the concentration of the tested component in the primary gas mixture.
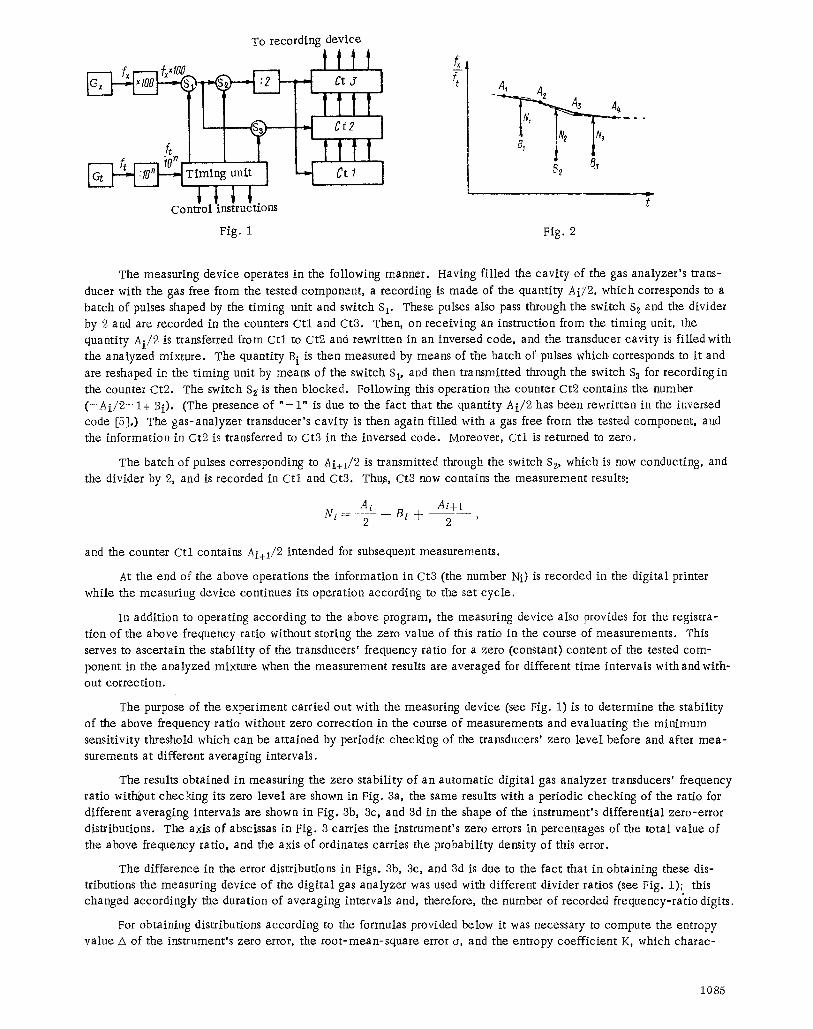
The block diagram of the automatic digital gas analyzer 's measuring device is shown in Fig. 1.
The sensitivity and operating speed of the measuring device and raised by means of a multiplier of the fre- quency fx with the ratio Kml t = 100 and a divider of the frequency f t with a variable ratio of Kdiv = 10 n (n = 3, 4, 5) for producing different values of Tins. In this case the number of pulses recorded on the counter will be
N = /x--Kmlt Kdi v. h
The operation of the measuring device is illustrated in Fig. 2.
The points Ai represent the frequency-ratio drift of the corresponding gas without the tested component, where- as the points B i represent certain tested gas concentrations. The measuring device made according to the schematic in Fig. 1 averages the frequency-ratio zero values, for instance, A1 and A~, and subtracts from their mean value the values of Bi which correspond to a given concentration of the measured component in the analyzed mixture.
Translated from Izmeritel 'naya Tekhnika, No.7, pp. 66-69, July, 1971. Original article submitted May 25, 1970.
�9 1971 Consul tants Bureau, a div is ion o f Plenum Publ i sh ing Corporation, 227 West 17th Street, New
York, N. Y. 10011. Al l rights reserved. This article cannot be reproduced for any purpose whatsoever
without permiss ion of the publisher. A copy of this article is avai lable from the publ isher for $15.00.
1084
To recording device
tttt
I IT Cf2 I
. I I I t t t t mi.gu. t I '-"I C t, I
Control instructions
t T A, A
S2 5j
Fig. 1 Fig. 2
The measuring device operates in the foIIowing manner. Having fi l led the cavi ty of the gas analyzer ' s trans-
ducer with the gas free from the tested component , a recording is made of the quantity Ai /2 , which corresponds to a batch of pulses shaped by the t iming unit and switch Sp These pulses also pass through the switch $2 and the divider by 2 and are recorded in the counters C t l and Ct3. Then, on receiving an instruction from the t iming unit, the quantity A i / 2 is transferred from C t l to Ct2 and rewrit ten in an inversed code, and the transducer cavi ty is f i l led with
the analyzed mixture. The quantity B i is then measured by means of the batch of pulses which corresponds to i t and
are reshaped in the t iming unit by means of the switch S 1, and then transmitted through the switch S s for recording in
the counter Ct2. The switch $2 is then blocked. Following this operat ion the counter Ct2 contains the number ( - A i / 2 - 1 + Bi). (The presence of " - 1 " is due to the fact that the quantity Ai /2 has been rewrit ten in the inversed code [5].) The gas-ana lyzer transducer's cavi ty is then again f i l led with a gas free from the tested component, and the information in Ct2 is transferred to Ct3 in the inversed code. Moreover, C t l is returned to zero.
The batch of pulses corresponding to Ai+I/2 is t ransmitted through the switch S 2, which is now conducting, and the divider by 2, and is recorded in C t l and Ct3. Thus, Ct3 now contains the measurement results:
A i Ai+] N i ~ B i @ ----
2 2
and the counter C t l contains Ai+l /2 intended for subsequent measurements.
At the end of the above operations the information in Ct3 (the number Ni) is recorded in the d ig i ta l printer
while the measuring device continues its operat ion according to the set cyc le .
In addit ion to operating according to the above program, the measuring device also provides for the registra-
tion of the above frequency ratio without storing the zero value of this ratio in the course of measurements. This serves to ascertain the s tabi l i ty of the transducers' frequency ratio for a zero (constant) content of the tested com-
ponent in the analyzed mixture when the measurement results are averaged for different t ime intervals with andwith- out correction.
The purpose of the exper iment carr ied out with the measuring device (see Fig. 1) is to determine the stabil i ty of the above frequency ratio without zero correct ion in the course of measurements and evaluat ing the minimum sensit ivity threshold which can be at ta ined by periodic checking of the transducers' zero leve l before and after mea- surements at different averaging intervals.
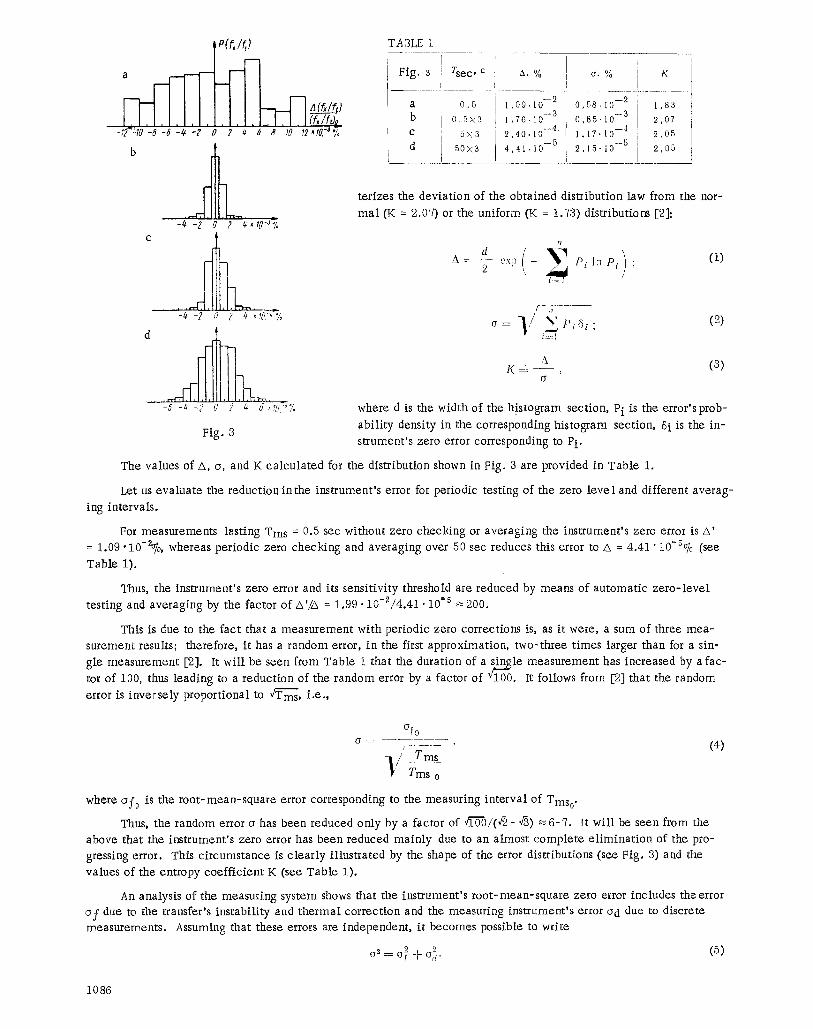
The results obtained in measuring the zero s tabi l i ty of an au tomat ic d igi ta l gas analyzer transducers' frequency ratio with~)ut checking its zero leve l are shown in Fig. 3a, the same results with a periodic checking of the ratio for different averaging intervals are shown in Pig. 3b, 3c, and 3d in the shape of the instrument 's different ial zero-error distributions. The axis of abscissas in Fig. 3 carries the instrument 's zero errors in percentages of the total value of the above frequency ratio, and the axis of ordinates carries the probabil i ty density of this error.
The difference in the error distributions in Figs. 3b, 3c, and ad is due to the fact that in obtaining these dis- tributions the measuring device of the d ig i ta l gas analyzer was used with different divider ratios (see Fig. 1); this changed accordingly the duration of averaging intervals and, therefore, the number of recorded frequency-rat io digits.
For obtaining distributions according to the formulas provided below it was necessary to compute the entropy value A of the instrument 's zero error, the roo t -mean-square error o, and the entropy coeff ic ient K, which charac-
1085
P(f,/0
~ ~ (f,/?'r h i , i l l ! i ! ! !
-,2:10 -8 =6 -4~ -? 0 ? # 6 8 l~ 1l tO.- %
b . i .
"* -2 0 ? * , lO"J~o
2 C
�9 , ~ j l J I L L _ ~ -4 -2 ~q ? 0 ~7f-*%
Fig. 3
TABLE I
[ I Ftg. 3 rsec, c A. % ] e, % K
[
a 0,5 ] 1,09.10--2 ] 0,58-10 -2 1,83 b 0 ,5X3 [ 1 76 10 - 3 i ! 0 , 8 5 . 1 0 _ 3 2,07 C 5X3 i 2 ' 4 0 " i 0 - - 4 1 ' 1 7 ' 1 0 - - 4 2 ,05
L d SOX3 I 4 ' 4 1 ' 1 0 - 5 2 ' 1 5 ' 1 0 - 5 2 ,05
terizes the deviation of the obtained distribution law from the nor-
mal (K = 2.07) or the uniform (K = 1.73) distributions [2]:
d < 2 A = - exp - - Pi l:~ Pi ; (1)
F-~z y = _ . P~ ~5i �9 (2) i::1
A ( 3 ) K ~-
fir
where d is the width of the histogram section, Pi is the error's prob-
abili ty density in the corresponding histogram section, gi is the in-
strument's zero error corresponding to Pi.
The values of A, o, and K calculated for the distribution shown in Fig. 3 are provided in Table 1.
Let us evaluate the reduction:inthe instrument's error for periodic testing of the zero level and different averag-
ing intervals.
For measurements lasting Tins = 0.5 sec without zero checking or averaging the instrument's zero error is A' = 1.09 "10-2% whereas periodic zero checking and averaging over 50 sec reduces this error to ZX = 4.41" 10"~% (see
Table 1).
Thus, the instrument's zero error and its sensitivity threshold are reduced by means of automatic zero-level
testing and averaging by the factor of A'/A = 1.99" 10-2/4.41 �9 10 ~5 ~ 200.
This is due to the fact that a measurement with periodic zero corrections is, as it were, a sum of three mea- surement results; therefore, it has a random error, in the first approximation, two-three times larger than for a sin-
gle measurement [2]. It will be seen from Table 1 that the duration of a s ~ l e measurement has increased by a fac-
tor of 100, thus leading to a reduction of the random error by a factor of Vl00. It follows from [2] that the random
error is inversely proportional to T'/~ms, i.e.,
, . . . . . . . . . . . ( 4 ) - I / Tms
Tins o
where af0 is the root-mean-square error corresponding to the measuring interval of Tms 0.
Thus, the random error o has been reduced only by a factor of v~"0/(,~- Q) ~ 6-7. It will be seen from the
above that the instrument's zero error has been reduced mainly due to an almost complete eI iminat ion of the pro- gressing error. This circumstance is clearly illustrated by the shape of the error distributions (see Fig. 3) and the
values of the entropy coefficient K (see Table 1).
An analysis of the measuring system shows that the instrument's root-mean-square zero error includes the error o f due to the transfer's instability and thermal correction and the measuring instrument's error u d due to discrete measurements. Assuming that these errors are independent, it becomes possible to write
~ o~ ' ~ (5) -K O d "
1 0 8 6
TA BLE 2
ff~.lO -5, ffd'lO - 5 % % a.{0 - 5 , % ~x=Ka, % I Tins,____ see
0,5X3 ' 5X3
50X3
(500)X3
23 7,3 2,3
(0,73)
85 8,5 0,85
(0,085)
88 11 ,2 2,4
(0,73)
1,8. i0 - 3 2,5.10 - 4 4,8.10 - 5 (15.10 - 6 )
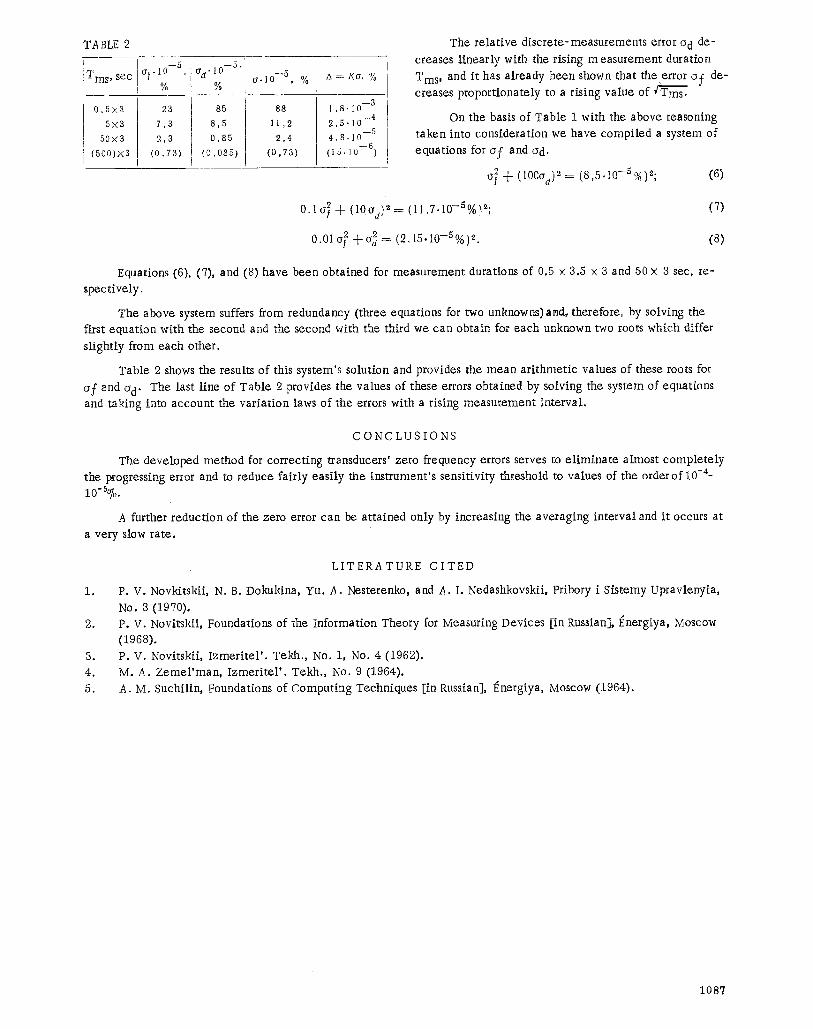
The re la t ive discre te-measurements error o d de-
creases l inear ly with the rising measurement duration
Tms, and it has a l ready been shown that the error o f de- creases proportionately to a rising value of
On the basis of Table 1 with the above reasoning taken into consideration we have compi led a system of
equations for o f and Od,
o] § (10c%) ~ = (8 ,5 .10-s%)2; (6)
0.1 (~ ~- (10ad)2 = (11,7.10-5%)2;
0,01 o~ -t-a~ = (2,15"10-5%) 2.
(~)
(8)
Equations (6), (7), and (8) have been obtained for measurement durations of 0.5 • 8.5 x 8 and SO x 8 sec, re-
spect ively.
The above system suffers from redundancy (three equations for two unknowns)and, therefore, by solving the first equat ion with the second and the second with the third we can obtain for each unknown two roots which differ
slightly from each other.
Table 2 shows the results of this system's solution and provides the mean ar i thmet ic values of these roots for
o f and o d. The last line of Table 2 provides the values of these errors obtained by solving the system of equations
and taking into account the var ia t ion laws of the errors with a rising measurement interval .
C O N C L U S I O N S
The developed method for correct ing transducers' zero frequency errors serves to e l imina te almost compIe te ly the progressing error and to reduce fair ly easi ly the instrument 's sensit ivity threshold to values of the order of 10 -4- 10-5o]o.
A further reduction of the zero error can be at tained only by increasing the averaging interval and i t occurs at
a very slow ra te .
L I T E R A T U R E C I T E D
1. P . V . Novkitskii, N. B. Dokukina, Yu. A. Nesterenko, and A. I. Nedashkovskii, Pribory i Sistemy Upravlenyia,
No. 8 (1970). 2. P . V . NovitsMi, Foundations of the Information Theory for Measuring Devices [in Russian], ~nergiya, Moscow
(1968).
3. P .V . Novitski i , I zmer i te l ' . Tekh., No. 1, No. 4 (1962).
4. M . A . Zeme l 'man , I zmer i t e l ' . Tekh., No. 9 (1964). 5. A . M . Suchiltn, Foundations of Computing Techniques [in Russian], ~nergtya, Moscow (1964).
1087