reducing diesel particle emissions: a switching comparison between particle traps and lpg vehicles
TRANSCRIPT
This article was downloaded by: [Columbia University]On: 05 October 2014, At: 07:31Publisher: Taylor & FrancisInforma Ltd Registered in England and Wales Registered Number: 1072954 Registered office: MortimerHouse, 37-41 Mortimer Street, London W1T 3JH, UK
Impact Assessment and Project AppraisalPublication details, including instructions for authors and subscription information:http://www.tandfonline.com/loi/tiap20
Reducing diesel particle emissions: a switchingcomparison between particle traps and LPG vehiclesEric Johnson aa Atlantic Consulting , Obstgartenstrasse 14, 8136 , Gattikon , Switzerland Phone: +41 1772 1079 E-mail:Published online: 20 Feb 2012.
To cite this article: Eric Johnson (2002) Reducing diesel particle emissions: a switching comparison between particle trapsand LPG vehicles, Impact Assessment and Project Appraisal, 20:4, 243-251
To link to this article: http://dx.doi.org/10.3152/147154602781766591
PLEASE SCROLL DOWN FOR ARTICLE
Taylor & Francis makes every effort to ensure the accuracy of all the information (the “Content”) containedin the publications on our platform. However, Taylor & Francis, our agents, and our licensors make norepresentations or warranties whatsoever as to the accuracy, completeness, or suitability for any purpose ofthe Content. Any opinions and views expressed in this publication are the opinions and views of the authors,and are not the views of or endorsed by Taylor & Francis. The accuracy of the Content should not be reliedupon and should be independently verified with primary sources of information. Taylor and Francis shallnot be liable for any losses, actions, claims, proceedings, demands, costs, expenses, damages, and otherliabilities whatsoever or howsoever caused arising directly or indirectly in connection with, in relation to orarising out of the use of the Content.
This article may be used for research, teaching, and private study purposes. Any substantial or systematicreproduction, redistribution, reselling, loan, sub-licensing, systematic supply, or distribution in anyform to anyone is expressly forbidden. Terms & Conditions of access and use can be found at http://www.tandfonline.com/page/terms-and-conditions

Impact Assessment and Project Appraisal December 2002 1461-5517/02/040243-9 US$08.00 IAIA 2002 243
Impact Assessment and Project Appraisal, volume 20, number 4, December 2002, pages 243–251, Beech Tree Publishing, 10 Watford Close, Guildford, Surrey GU1 2EP, UK
Reducing emissions
Reducing diesel particle emissions: a switching comparison between particle traps and LPG vehicles
Eric Johnson
One aim of the UK’s Air Quality Strategy is to cut emissions of particles, and one policy option is to fit light-duty diesel vehicles with particle traps. However, there is a more immediate, lower cost and more effective option — switching to LPG-fuelled vehicles. Using this option, this study estimates that vehicles owners could save in the range of £170 to £400 in annual operating cost; UK particle emissions could be cut an addi-tional 2–7% in the target year 2010, primarily in urban areas where they are most harmful; and this reduction could cause 100–400 fewer hospi-talisations for respiratory problems and 20–80 fewer premature deaths over the period of im-pact. It also could cut particles’ property damage by nearly £1 million per year.
Keywords: reducing emissions; LPG; particle traps
Eric Johnson is at Atlantic Consulting, Obstgartenstrasse 14, 8136 Gattikon, Switzerland; Tel: +41 1 772 1079; E-mail: [email protected].
NE AIM OF THE UK Government’s Air Quality Strategy (DETR, 2000a) is to reduce ambient concentrations of particles in the
troposphere, where people live and breathe. This is to be done by reducing emissions of particles.
A key sector targeted by the Government for emission reductions is road transport. This is for two main reasons:
• Road transport (primarily diesel engines) is the largest emitter in populated areas,1 where airborne particles cause the most damage.
• Road transport is the second largest emitter in absolute terms, that is, tonnes of particulate emit-ted per year. By 2010, road transport is projected to surpass residential heating, which is currently the largest emitter of the 20 sectors emitting par-ticulate (DEFRA, 2001, Table 3.1, page 37).
For several years, the Government has analysed how it can reduce particle emissions from road transport by the target year 2010. The most recent policy anal-ysis was published in September 2001 by DEFRA (Department for Environment, Food and Rural Af-fairs), entitled An Economic Analysis to Inform the Review of the Air Quality Strategy Objectives for Particles, A Second Report of the Interdepartmental Group on Costs and Benefits (DEFRA, 2001).
DEFRA’s report analyses the cost-effectiveness of various measures to reduce particle concen-trations, especially those with higher population ex-posure. DEFRA did not consider all possible measures such as LPG (liquefied petroleum gas) for
O
Dow
nloa
ded
by [
Col
umbi
a U
nive
rsity
] at
07:
31 0
5 O
ctob
er 2
014

Reducing diesel particle emissions
244 Impact Assessment and Project Appraisal December 2002
reductions; and it noted that “there will probably be local measures for achieving reductions in particle concentration levels which prove more cost effective than the national measures quantified and costed in this work”.
The purpose of this study is to compare the cost-effectiveness of two possible measures, or options, for cutting particulate emissions from diesel-engines in transport:
• Switching to diesel vehicles with particle traps — an option assessed by DEFRA
• Switching to LPG fuelled vehicles — an option not assessed by DEFRA
In the next section, the method we used in this com-parison is outlined. Then the options and their costs are analysed, and finally a comparison is made of the costs.
Method
The method of comparison used in this study is eco-nomic analysis and health impact assessment. The analysis has been scoped at a typical level for pol-icy-making, that is, it covers the UK as a whole; it assumes more simplicity and uniformity than exists in real life; and it deals with uncertainty by using sensitivities and ranges. A general schematic of the approach to this study is presented in Figure 1.
Our method is meant to be very similar to the method of analysis used by the Government in its latest reports on the topic (DEFRA, 2001; Alterna-tive Fuels Group, 2000). As in DEFRA analysis of particle traps (DEFRA, 2001, page 53–54), we have not included the switching impacts on Government revenues in the scope of our analysis.
We have tried to use data that are published by authoritative sources and based on actual practice. We have aimed to present the data and the analysis in a transparent manner. For ease of presentation and communication, this report presents summary
figures and data. Detailed calculations can be made available to qualified readers upon request.
We believe the concepts in the study are generally known to, and accepted by, educated readers. There-fore, they are explained in the text of the analysis, rather than in a separate section.
Two options to reduce particle emissions are de-scribed and their costs defined. A comparison is then made of the performance, costs and benefits.
As a basis for our analysis, we have used the conditions described in the Government’s analysis (DEFRA, 2001, pages 53–54), including the presum-ption that the comparison takes place in 2010. With a few exceptions, we have used the same values as the Government. Most of the exceptions are for variables that were not in the Government’s analysis or could not be inferred from it. We have tried to state all rele-vant assumptions in the text below.
Option 1: Switch to particle traps
By this option, all new, light-duty, diesel vehicles2 are factory equipped with particle traps from 2006. This is assumed in the Government’s analysis (DEFRA, 2001, page 53).
It is generally agreed that particle traps are the best method for cutting particle emissions from diesels, but the technology is still relatively unproven com-mercially. There is considerable uncertainty associ-ated with traps, about their performance, their costs and the timing in which they will achieve these. For instance, the Government’s estimate of the cost of a particle trap is expressed as a 250% range.
The industry association for manufacturers of particle traps calls them a ‘next generation technol-ogy’ (Association for Emissions Control, 2002). Commercial models of diesel cars with traps became available only last year and only from one manufac-turer, PSA Peugeot Citroen in the model Citroen C5.
Automobile and trap manufacturers recognise that new technologies such as this can take some time to ‘shake out’ and work properly. A recent article
Today Options for 2010
Evaluationcriteria
Results
LightDuty
Diesel Vehicles
Particle reductionFuel economy
lifetimeParticle reduction
over time
CapitalFuel
MaintenanceEnforcement
LPG
Particletraps
Damage CostImpact
Opt
ion
LPG
Particle traps
or
Performance
Cost
Figure 1. Method of analysis
Dow
nloa
ded
by [
Col
umbi
a U
nive
rsity
] at
07:
31 0
5 O
ctob
er 2
014
Reducing diesel particle emissions
Impact Assessment and Project Appraisal December 2002 245
(Shelef and McCabe, 2000) by researchers at Ford Motor Company pointed out the difficulties encoun-tered in the 1970s when catalytic converters were first introduced for US automobiles:
“As is the case with every new technology, the early years of use witnessed catalyst failures due to misfueling, upstream engine and system malfunctions, etc.”
These sorts of ‘teething pains’ are the rule, not the exception, when new technologies are introduced in any sector.
How particle traps reduce particle emissions
Upon combustion, diesel fuel generates greater amounts of particles than other automotive fuels such as petrol or LPG. In conventional engines to-day, particle emissions from diesel cars are about ten times higher than petrol and 100 times higher than LPG (Wang, 1999; Wang and Huang, 1999).
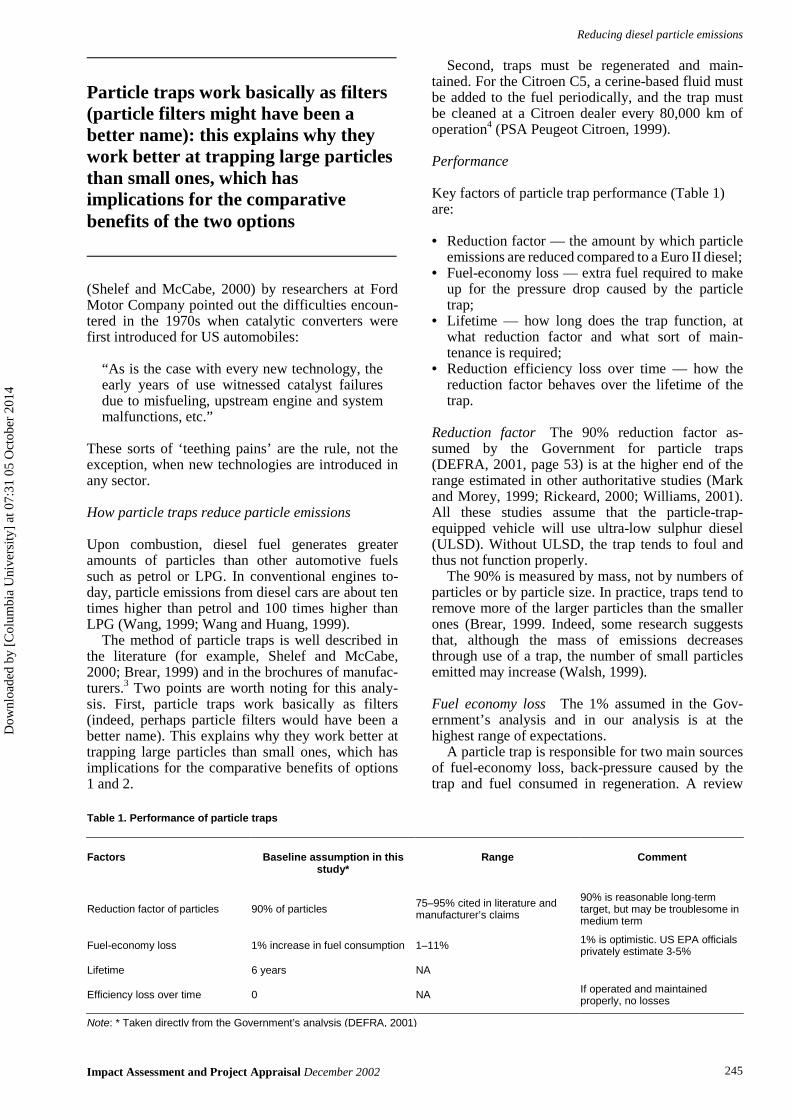
The method of particle traps is well described in the literature (for example, Shelef and McCabe, 2000; Brear, 1999) and in the brochures of manufac-turers.3 Two points are worth noting for this analy-sis. First, particle traps work basically as filters (indeed, perhaps particle filters would have been a better name). This explains why they work better at trapping large particles than small ones, which has implications for the comparative benefits of options 1 and 2.
Second, traps must be regenerated and main-tained. For the Citroen C5, a cerine-based fluid must be added to the fuel periodically, and the trap must be cleaned at a Citroen dealer every 80,000 km of operation4 (PSA Peugeot Citroen, 1999).
Performance
Key factors of particle trap performance (Table 1) are:
• Reduction factor — the amount by which particle emissions are reduced compared to a Euro II diesel;
• Fuel-economy loss — extra fuel required to make up for the pressure drop caused by the particle trap;
• Lifetime — how long does the trap function, at what reduction factor and what sort of main-tenance is required;
• Reduction efficiency loss over time — how the reduction factor behaves over the lifetime of the trap.
Reduction factor The 90% reduction factor as-sumed by the Government for particle traps (DEFRA, 2001, page 53) is at the higher end of the range estimated in other authoritative studies (Mark and Morey, 1999; Rickeard, 2000; Williams, 2001). All these studies assume that the particle-trap-equipped vehicle will use ultra-low sulphur diesel (ULSD). Without ULSD, the trap tends to foul and thus not function properly.
The 90% is measured by mass, not by numbers of particles or by particle size. In practice, traps tend to remove more of the larger particles than the smaller ones (Brear, 1999. Indeed, some research suggests that, although the mass of emissions decreases through use of a trap, the number of small particles emitted may increase (Walsh, 1999).
Fuel economy loss The 1% assumed in the Gov-ernment’s analysis and in our analysis is at the highest range of expectations.
A particle trap is responsible for two main sources of fuel-economy loss, back-pressure caused by the trap and fuel consumed in regeneration. A review
Table 1. Performance of particle traps
Factors Baseline assumption in this study*
Range Comment
Reduction factor of particles 90% of particles 75–95% cited in literature and manufacturer’s claims
90% is reasonable long-term target, but may be troublesome in medium term
Fuel-economy loss 1% increase in fuel consumption 1–11% 1% is optimistic. US EPA officials privately estimate 3-5%
Lifetime 6 years NA
Efficiency loss over time 0 NA If operated and maintained properly, no losses
Note: * Taken directly from the Government’s analysis (DEFRA, 2001)
Particle traps work basically as filters (particle filters might have been a better name): this explains why they work better at trapping large particles than small ones, which has implications for the comparative benefits of the two options
Dow
nloa
ded
by [
Col
umbi
a U
nive
rsity
] at
07:
31 0
5 O
ctob
er 2
014
Reducing diesel particle emissions
246 Impact Assessment and Project Appraisal December 2002
published in 1997 calculates that back-pressure can reduce fuel-economy by as much as 5–6% and re-generation can cut it by another 1–5% (Stamatelos, 1997). The same review suggests that with optimisa-tion measures, total fuel-economy loss from a trap could be 1–2% in light-duty vehicles.
Lifetime and efficiency loss over time Our base case analysis has not assumed any loss of efficiency over the trap’s lifetime. This is because the technol-ogy is still ‘next generation’ (Association for Emis-sions Control, 2002), and we have no reliable data on efficiency loss.
Nonetheless, several factors suggest that the trap would lose some of its efficiency over time in service:
• A trap’s lifetime is only six years (DEFRA, 2001, page 53), while an average UK car’s lifetime is 14 years (UK Commission for Integrated Transport, 2001);
• Citroen’s trap, the only commercial model for cars, requires some maintenance;
• Studies of particle traps in real operation on buses, lorries and vans show that filters frequently coke up and thus lose efficiency (Danish Ecologi-cal Council, 2001).
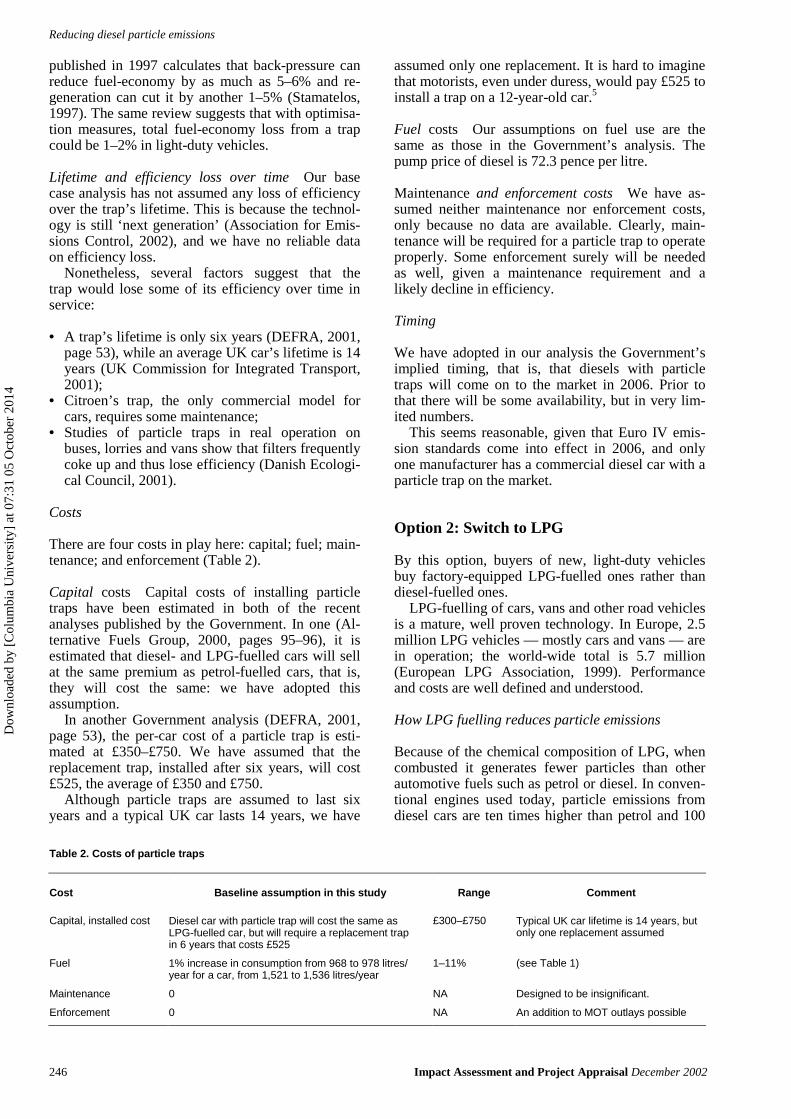
Costs
There are four costs in play here: capital; fuel; main-tenance; and enforcement (Table 2).
Capital costs Capital costs of installing particle traps have been estimated in both of the recent analyses published by the Government. In one (Al-ternative Fuels Group, 2000, pages 95–96), it is estimated that diesel- and LPG-fuelled cars will sell at the same premium as petrol-fuelled cars, that is, they will cost the same: we have adopted this assumption.
In another Government analysis (DEFRA, 2001, page 53), the per-car cost of a particle trap is esti-mated at £350–£750. We have assumed that the replacement trap, installed after six years, will cost £525, the average of £350 and £750.
Although particle traps are assumed to last six years and a typical UK car lasts 14 years, we have
assumed only one replacement. It is hard to imagine that motorists, even under duress, would pay £525 to install a trap on a 12-year-old car.5
Fuel costs Our assumptions on fuel use are the same as those in the Government’s analysis. The pump price of diesel is 72.3 pence per litre.
Maintenance and enforcement costs We have as-sumed neither maintenance nor enforcement costs, only because no data are available. Clearly, main-tenance will be required for a particle trap to operate properly. Some enforcement surely will be needed as well, given a maintenance requirement and a likely decline in efficiency.
Timing
We have adopted in our analysis the Government’s implied timing, that is, that diesels with particle traps will come on to the market in 2006. Prior to that there will be some availability, but in very lim-ited numbers.
This seems reasonable, given that Euro IV emis-sion standards come into effect in 2006, and only one manufacturer has a commercial diesel car with a particle trap on the market.
Option 2: Switch to LPG
By this option, buyers of new, light-duty vehicles buy factory-equipped LPG-fuelled ones rather than diesel-fuelled ones.
LPG-fuelling of cars, vans and other road vehicles is a mature, well proven technology. In Europe, 2.5 million LPG vehicles — mostly cars and vans — are in operation; the world-wide total is 5.7 million (European LPG Association, 1999). Performance and costs are well defined and understood.
How LPG fuelling reduces particle emissions
Because of the chemical composition of LPG, when combusted it generates fewer particles than other automotive fuels such as petrol or diesel. In conven-tional engines used today, particle emissions from diesel cars are ten times higher than petrol and 100
Table 2. Costs of particle traps
Cost Baseline assumption in this study Range Comment
Capital, installed cost Diesel car with particle trap will cost the same as LPG-fuelled car, but will require a replacement trap in 6 years that costs £525
£300–£750 Typical UK car lifetime is 14 years, but only one replacement assumed
Fuel 1% increase in consumption from 968 to 978 litres/ year for a car, from 1,521 to 1,536 litres/year
1–11% (see Table 1)
Maintenance 0 NA Designed to be insignificant.
Enforcement 0 NA An addition to MOT outlays possible
Dow
nloa
ded
by [
Col
umbi
a U
nive
rsity
] at
07:
31 0
5 O
ctob
er 2
014
Reducing diesel particle emissions
Impact Assessment and Project Appraisal December 2002 247
times higher than LPG (Wang, 1999; Wang and Huang, 1999).
Particle emissions from LPG engines are well be-low regulatory ceilings, therefore no end-of-pipe controls are required.
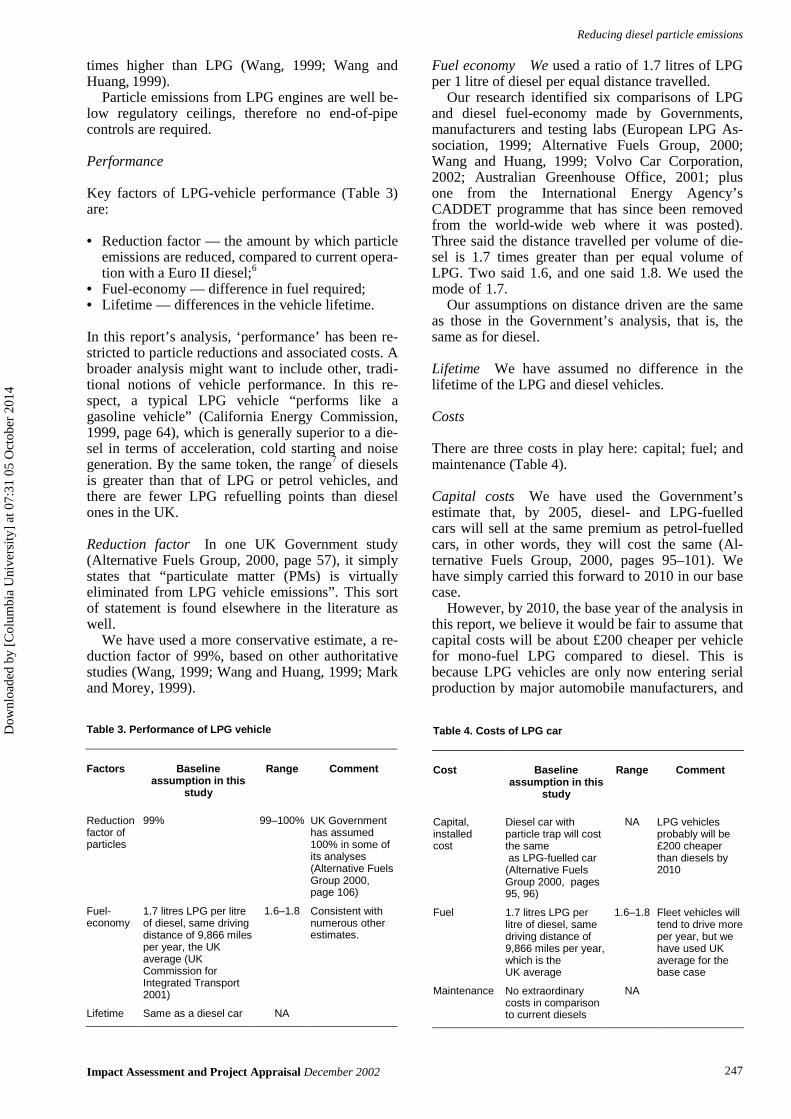
Performance
Key factors of LPG-vehicle performance (Table 3) are:
• Reduction factor — the amount by which particle emissions are reduced, compared to current opera-tion with a Euro II diesel;6
• Fuel-economy — difference in fuel required; • Lifetime — differences in the vehicle lifetime.
In this report’s analysis, ‘performance’ has been re-stricted to particle reductions and associated costs. A broader analysis might want to include other, tradi-tional notions of vehicle performance. In this re-spect, a typical LPG vehicle “performs like a gasoline vehicle” (California Energy Commission, 1999, page 64), which is generally superior to a die-sel in terms of acceleration, cold starting and noise generation. By the same token, the range7 of diesels is greater than that of LPG or petrol vehicles, and there are fewer LPG refuelling points than diesel ones in the UK.
Reduction factor In one UK Government study (Alternative Fuels Group, 2000, page 57), it simply states that “particulate matter (PMs) is virtually eliminated from LPG vehicle emissions”. This sort of statement is found elsewhere in the literature as well.
We have used a more conservative estimate, a re-duction factor of 99%, based on other authoritative studies (Wang, 1999; Wang and Huang, 1999; Mark and Morey, 1999).
Fuel economy We used a ratio of 1.7 litres of LPG per 1 litre of diesel per equal distance travelled.
Our research identified six comparisons of LPG and diesel fuel-economy made by Governments, manufacturers and testing labs (European LPG As-sociation, 1999; Alternative Fuels Group, 2000; Wang and Huang, 1999; Volvo Car Corporation, 2002; Australian Greenhouse Office, 2001; plus one from the International Energy Agency’s CADDET programme that has since been removed from the world-wide web where it was posted). Three said the distance travelled per volume of die-sel is 1.7 times greater than per equal volume of LPG. Two said 1.6, and one said 1.8. We used the mode of 1.7.
Our assumptions on distance driven are the same as those in the Government’s analysis, that is, the same as for diesel.
Lifetime We have assumed no difference in the lifetime of the LPG and diesel vehicles.
Costs
There are three costs in play here: capital; fuel; and maintenance (Table 4).
Capital costs We have used the Government’s estimate that, by 2005, diesel- and LPG-fuelled cars will sell at the same premium as petrol-fuelled cars, in other words, they will cost the same (Al-ternative Fuels Group, 2000, pages 95–101). We have simply carried this forward to 2010 in our base case.
However, by 2010, the base year of the analysis in this report, we believe it would be fair to assume that capital costs will be about £200 cheaper per vehicle for mono-fuel LPG compared to diesel. This is because LPG vehicles are only now entering serial production by major automobile manufacturers, and
Table 3. Performance of LPG vehicle
Factors Baseline assumption in this
study
Range Comment
Reduction factor of particles
99% 99–100% UK Government has assumed 100% in some of its analyses (Alternative Fuels Group 2000, page 106)
Fuel-economy
1.7 litres LPG per litre of diesel, same driving distance of 9,866 miles per year, the UK average (UK Commission for Integrated Transport 2001)
1.6–1.8 Consistent with numerous other estimates.
Lifetime Same as a diesel car NA
Table 4. Costs of LPG car
Cost Baseline assumption in this
study
Range Comment
Capital, installed cost
Diesel car with particle trap will cost the same as LPG-fuelled car (Alternative Fuels Group 2000, pages 95, 96)
NA LPG vehicles probably will be £200 cheaper than diesels by 2010
Fuel 1.7 litres LPG per litre of diesel, same driving distance of 9,866 miles per year, which is the UK average
1.6–1.8 Fleet vehicles will tend to drive more per year, but we have used UK average for the base case
Maintenance No extraordinary costs in comparison to current diesels
NA
Dow
nloa
ded
by [
Col
umbi
a U
nive
rsity
] at
07:
31 0
5 O
ctob
er 2
014
Reducing diesel particle emissions
248 Impact Assessment and Project Appraisal December 2002
costs of production typically decrease as scale and cumulative output increases.8
According to a study led by Oak Ridge National Laboratory (Leiby and Rubin, 1997) for the US En-ergy Information Administration, increasing output from 2,500 per year to 25,000 per year would cut production costs by around £1,800 per vehicle. An additional hike from 25,000 per year to 100,000 per year would bring an additional saving of £200 per vehicle. Another study for the US Energy Informa-tion Administration (Green and Plotkin, 2001, page 1262) shows the same phenomenon.
Last year, 20,576 LPG vehicles were sold in the UK, and sales are forecast to rise to 50,000 in 2002 (Transportaction Powershift, 2001). These figures include both OEMs (original equipment manufactur-ers) and conversions.
Fuel costs The assumed pump price of LPG is 37.1p per litre (Automobile Association UK, 2001).
Maintenance costs We have assumed no extraor-dinary maintenance costs for LPG vehicles in rela-tion to diesel vehicles. In other words, we assume that fuel choice (LPG vs diesel) does not change maintenance costs. This is borne out in private dis-cussions with fleet operators, and there is no men-tion of any difference in the literature we have reviewed for this paper. Nonetheless, this might be a worthwhile topic for further research either to con-firm or refute this.
Timing
We have adopted in our base case the same timing of introduction as for diesels with particle traps, that is, serial LPG vehicles will come on to the market in 2006. In fact, they are available already, and it is plausible to assume that they could be produced in large quantities earlier than 2006. This is addressed under one of the scenarios in the next section.
Comparison: LPG versus traps
This section compares costs, performance and bene-fits of the two options defined in the previous section under a base case and some alternative scenarios.
Definition of scenarios
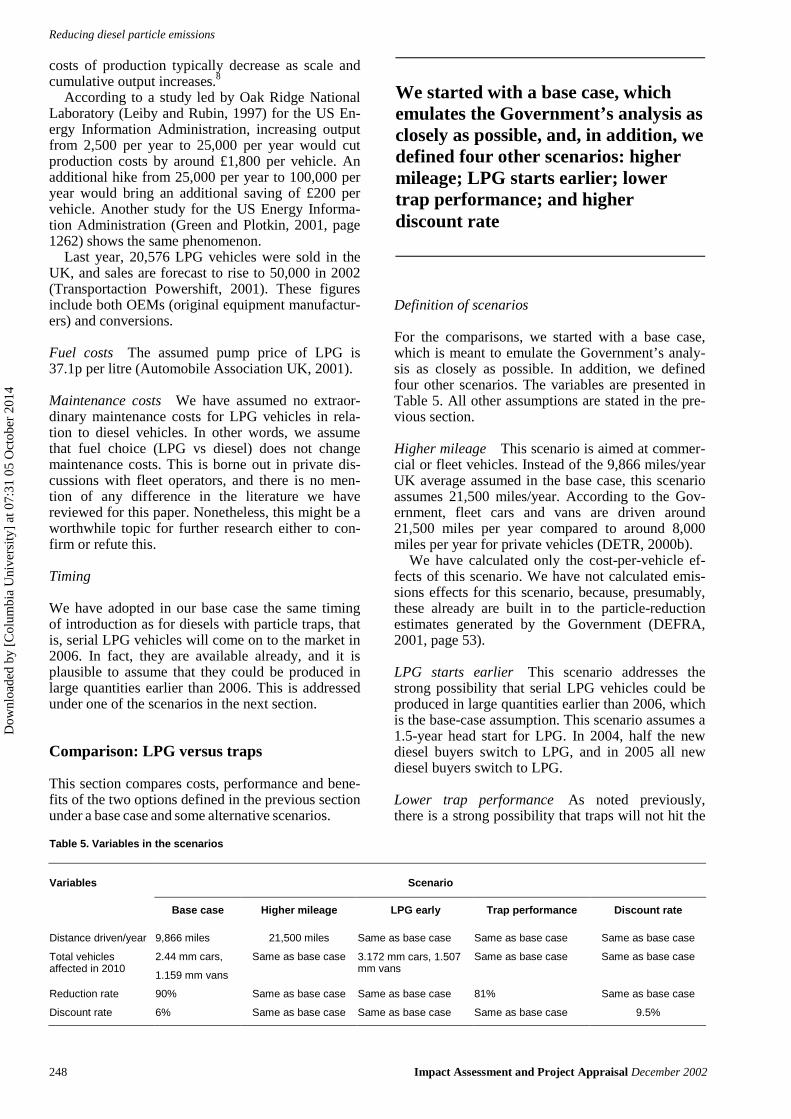
For the comparisons, we started with a base case, which is meant to emulate the Government’s analy-sis as closely as possible. In addition, we defined four other scenarios. The variables are presented in Table 5. All other assumptions are stated in the pre-vious section.
Higher mileage This scenario is aimed at commer-cial or fleet vehicles. Instead of the 9,866 miles/year UK average assumed in the base case, this scenario assumes 21,500 miles/year. According to the Gov-ernment, fleet cars and vans are driven around 21,500 miles per year compared to around 8,000 miles per year for private vehicles (DETR, 2000b).
We have calculated only the cost-per-vehicle ef-fects of this scenario. We have not calculated emis-sions effects for this scenario, because, presumably, these already are built in to the particle-reduction estimates generated by the Government (DEFRA, 2001, page 53).
LPG starts earlier This scenario addresses the strong possibility that serial LPG vehicles could be produced in large quantities earlier than 2006, which is the base-case assumption. This scenario assumes a 1.5-year head start for LPG. In 2004, half the new diesel buyers switch to LPG, and in 2005 all new diesel buyers switch to LPG.
Lower trap performance As noted previously, there is a strong possibility that traps will not hit the
We started with a base case, which emulates the Government’s analysis as closely as possible, and, in addition, we defined four other scenarios: higher mileage; LPG starts earlier; lower trap performance; and higher discount rate
Table 5. Variables in the scenarios
Variables Scenario
Base case Higher mileage LPG early Trap performance Discount rate
Distance driven/year 9,866 miles 21,500 miles Same as base case Same as base case Same as base case
Total vehicles affected in 2010
2.44 mm cars,
1.159 mm vans
Same as base case 3.172 mm cars, 1.507 mm vans
Same as base case Same as base case
Reduction rate 90% Same as base case Same as base case 81% Same as base case
Discount rate 6% Same as base case Same as base case Same as base case 9.5%
Dow
nloa
ded
by [
Col
umbi
a U
nive
rsity
] at
07:
31 0
5 O
ctob
er 2
014

Reducing diesel particle emissions
Impact Assessment and Project Appraisal December 2002 249
90% reduction rate assumed in the base case or that they will first hit it sometime after 2010.
Of course there is a possibility that traps will ex-ceed the 90% rate. However, this is extremely unlikely, because: 1) the 90% estimate is already optimistic; 2) instant success of a ‘next generation’ technology runs counter to real-life experience most of the time; and 3) like all removal technologies, the last 10% tends to be much more difficult to achieve than the first 10%. So, this scenario considers only lower trap performance, not higher.
This scenario assumes that traps’ performance will be 10% lower than in the base case, that is, 81% of particles will be removed. This value is based on a review of the accuracy of estimating the character-istics of new technologies. Such estimation is inher-ently inaccurate. Inaccuracies of 20% and more are common; 10% is at the highest end of the range.
Higher discount rate The Government’s calcula-tion (DEFRA, 2001, page 53) and our base case both use a 6% discount rate, the so-called ‘public discount rate’ used by the Exchequer.
However, the costs incurred by the switch either to particle traps or LPG vehicles will be borne by companies and private individuals. A Government analysis of fuel switching (Alternative Fuels Group, 2000, pages 109–110) assumes a 9% discount rate for companies and 20% for private individuals.
This scenario assumes a 9.5% discount rate. This is the average of the 9% for companies and the cur-rent 10% market rate for typical automobile loans to private individuals (Direct Line, 2001).
Cost and performance comparison
The comparison of the two switch options is pre-sented in Tables 6 and 7.
In the base case, switching to LPG rather than to traps saves £173–£228 in annual costs per vehicle, and it cuts particle emissions by 125 tonnes annually.
For fleet vehicles with higher mileage, the annual savings increase to £286–£406. If the discount rate is 9.5%, annual savings increase from the base-case level to £201–£256.
If LPG vehicles are introduced ahead of diesel traps, then an extra 538 tonnes/year of particle emissions are avoided. If traps perform 10% less effectively than has been forecast in the base case, then 250 tonnes/year of particle emissions are avoided.
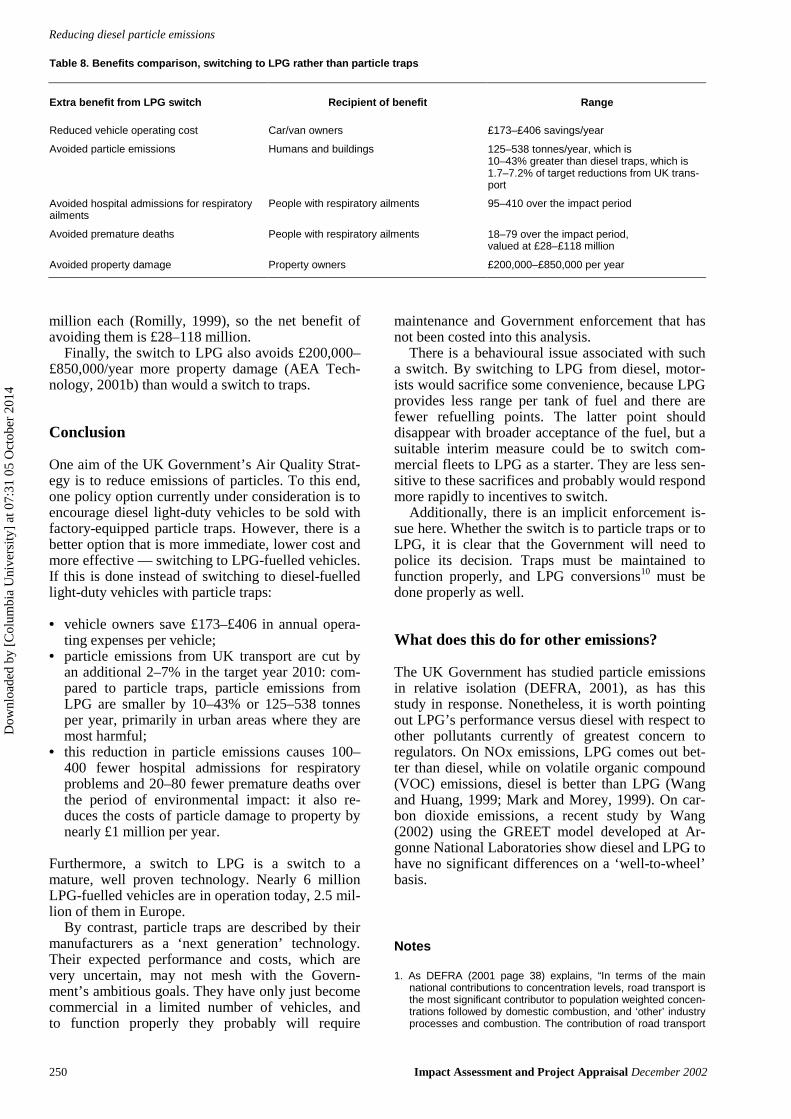
Benefits comparison
The benefits of switching to LPG instead of particle traps are summarised in Table 8.
Vehicle operators would save £173–£406 per year, and particle emissions would be cut by 125–538 tonnes per annum. This additional reduction avoids 10–43% more particle emissions than the switch to traps, and it represents 1.7–7.2% of tar-geted reductions from UK transport.9
Based on analyses commissioned by the Govern-ment (AEA Technology Environment, 2001a), this would eliminate 95–410 hospital admissions and 18–79 premature deaths over the period of impact. Recent impact studies value these deaths at £1.5
Table 6. Switching cost comparison, traps vs LPG
Extra cost per vehicle (£/yr)*
Option Scenario
Base case Higher mileage LPG early Trap performance Discount rate
Switch to traps 83–87 91–100 No effect No effect 112–116
Switch to LPG (90–141) (195–306) No effect No effect (89–140)
LPG’s benefit vs diesel, £ saved/vehicle 173–228 286–406 No effect No effect 201–256
*The first figure in the range is for cars, the second is for vans
Table 7. Switching particle-reduction comparison, traps vs LPG
Particle emissions avoided (t/yr)
Option Scenario
Base case Higher mileage LPG early Trap performance Discount rate
Switch to traps 1,250 No effect 1,250 1,125 No effect
Switch to LPG 1,375 No effect 1,788 1,375 No effect
LPG’s benefit vs diesel, extra tonnes particle emissions avoided/year 125 No effect 538 250 No effect
Dow
nloa
ded
by [
Col
umbi
a U
nive
rsity
] at
07:
31 0
5 O
ctob
er 2
014
Reducing diesel particle emissions
250 Impact Assessment and Project Appraisal December 2002
million each (Romilly, 1999), so the net benefit of avoiding them is £28–118 million.
Finally, the switch to LPG also avoids £200,000–£850,000/year more property damage (AEA Tech-nology, 2001b) than would a switch to traps.
Conclusion
One aim of the UK Government’s Air Quality Strat-egy is to reduce emissions of particles. To this end, one policy option currently under consideration is to encourage diesel light-duty vehicles to be sold with factory-equipped particle traps. However, there is a better option that is more immediate, lower cost and more effective — switching to LPG-fuelled vehicles. If this is done instead of switching to diesel-fuelled light-duty vehicles with particle traps:
• vehicle owners save £173–£406 in annual opera-ting expenses per vehicle;
• particle emissions from UK transport are cut by an additional 2–7% in the target year 2010: com-pared to particle traps, particle emissions from LPG are smaller by 10–43% or 125–538 tonnes per year, primarily in urban areas where they are most harmful;
• this reduction in particle emissions causes 100–400 fewer hospital admissions for respiratory problems and 20–80 fewer premature deaths over the period of environmental impact: it also re-duces the costs of particle damage to property by nearly £1 million per year.
Furthermore, a switch to LPG is a switch to a mature, well proven technology. Nearly 6 million LPG-fuelled vehicles are in operation today, 2.5 mil-lion of them in Europe.
By contrast, particle traps are described by their manufacturers as a ‘next generation’ technology. Their expected performance and costs, which are very uncertain, may not mesh with the Govern-ment’s ambitious goals. They have only just become commercial in a limited number of vehicles, and to function properly they probably will require
maintenance and Government enforcement that has not been costed into this analysis.
There is a behavioural issue associated with such a switch. By switching to LPG from diesel, motor-ists would sacrifice some convenience, because LPG provides less range per tank of fuel and there are fewer refuelling points. The latter point should disappear with broader acceptance of the fuel, but a suitable interim measure could be to switch com-mercial fleets to LPG as a starter. They are less sen-sitive to these sacrifices and probably would respond more rapidly to incentives to switch.
Additionally, there is an implicit enforcement is-sue here. Whether the switch is to particle traps or to LPG, it is clear that the Government will need to police its decision. Traps must be maintained to function properly, and LPG conversions10 must be done properly as well.
What does this do for other emissions?
The UK Government has studied particle emissions in relative isolation (DEFRA, 2001), as has this study in response. Nonetheless, it is worth pointing out LPG’s performance versus diesel with respect to other pollutants currently of greatest concern to regulators. On NOx emissions, LPG comes out bet-ter than diesel, while on volatile organic compound (VOC) emissions, diesel is better than LPG (Wang and Huang, 1999; Mark and Morey, 1999). On car-bon dioxide emissions, a recent study by Wang (2002) using the GREET model developed at Ar-gonne National Laboratories show diesel and LPG to have no significant differences on a ‘well-to-wheel’ basis.
Notes
1. As DEFRA (2001 page 38) explains, “In terms of the main national contributions to concentration levels, road transport is the most significant contributor to population weighted concen-trations followed by domestic combustion, and ‘other’ industry processes and combustion. The contribution of road transport
Table 8. Benefits comparison, switching to LPG rather than particle traps
Extra benefit from LPG switch Recipient of benefit Range
Reduced vehicle operating cost Car/van owners £173–£406 savings/year
Avoided particle emissions Humans and buildings 125–538 tonnes/year, which is 10–43% greater than diesel traps, which is 1.7–7.2% of target reductions from UK trans-port
Avoided hospital admissions for respiratory ailments
People with respiratory ailments 95–410 over the impact period
Avoided premature deaths People with respiratory ailments 18–79 over the impact period, valued at £28–£118 million
Avoided property damage Property owners £200,000–£850,000 per year
Dow
nloa
ded
by [
Col
umbi
a U
nive
rsity
] at
07:
31 0
5 O
ctob
er 2
014

Reducing diesel particle emissions
Impact Assessment and Project Appraisal December 2002 251
emissions to population weighted concentration levels is higher than its emissions share. This reflects the concentration of road transport emissions in urban areas where population density is higher. In contrast, the contribution from sectors such as power stations (which figure significantly in terms of primary emission contributions) are particularly small”.
2. Cars and light vans. Light vans are defined as those weighing less than 3.5 tonnes.
3. Trap makers Johnson Matthey and Engelhard or automobile makers Citroen and Volkswagen, for example.
4. For average usage, this would be once every 3.5–5 years. 5. For instance, a 12-year-old Vauxhall Astra 1.4 L 5d Estate
currently trades for around £380. See Parkers Online at <http://www.parkers.co.uk/pricing/> last accessed 28 January 2003.
6. Reduction by switching to LPG occurs in a different way from switching to particle traps. With LPG, the particles are not generated in the first place, with traps they are removed from the exhaust stream.
7. Distance that can be driven on one tank of fuel. 8. This is a general rule of economics, in both theory and ob-
served practice. 9. Targeted reductions being the ‘illustrative package’ proposed
under ‘Method’. 10. Most LPG vehicles are designed for petrol operation and con-
verted to run on both petrol and LPG. Conversions can be, and sometimes are, of shoddy quality.
References
AEA Technology Environment (2001a), “Quantification of the health effects of air pollution in the UK for the review of the national air quality strategy”, by John Stedman, Emma Line-han and Katie King, sponsored by DETR.
AEA Technology Environment (2001b), “Quantification of the non-health effects of air pollution in the UK for PM10 objective analysis”, by Paul Watkiss, Steve Pye, Dan Forster, Mike Holland and Katie King, sponsored by DEFRA.
Alternative Fuels Group of the Cleaner Vehicles Task Force (2000), “An assessment of the emissions performance of al-ternative and conventional fuels”, DTI Automotive Directorate, January, available at <http://www.road.detr.gov.uk/cvtf/index. htm> last accessed December 2001.
Association for Emissions Control by Catalyst, Brussels (2002), <http://www.aecc.be/en/next_technology.htm> last accessed 28 January 2003.
Australian Greenhouse Office (2001), Fuel Consumption Guide 2000–2001 (Commonwealth of Australia, Canberra).
Automobile Association UK (2001), “November average”. Brear, Fred (1999), “Diesel exhaust particle emissions: an engine
manufacturer’s contribution to the debate”, Science of the To-tal Environment, 235, pages 421–422.
California Energy Commission (1999), A Guide to Alternative Fuel Vehicles (California Energy Commission, Sacramento, 5th edition).
Danish Ecological Council (2001), “Working Group report on par-ticle filters on heavy vehicles”, 5 September, Copenhagen.
DEFRA, Department for Environment, Food and Rural Affairs (2001), An Economic Analysis to Inform the Review of the Air Quality Strategy Objectives for Particles, a Second Report of the Interdepartmental Group on Costs and Benefits (DEFRA, London).
DETR, Department of the Environment, Transport and the Re-gions (2000a), The Air Quality Strategy for England, Scotland, Wales and Northern Ireland (The Stationery Office, London).
DETR, Department of the Environment, Transport and the Re-gions (2000b), “Get ‘motorvated’, MacDonald tells British Business”, Press Release, 6 June.
Direct Line (2001), <www.directline.com> last accessed Decem-ber 2001.
European LPG Association (1999), “Global autogas market information, 1999”, in Meeting the Green Fuels Challenge (Liquefied Petroleum Gas Association in response to the UK Government’s Green Fuels Challenge) page 46.
Green, David L, and Steven E Plotkin (2001), “Energy futures for the US transport sector”, Energy Policy, 29(14), November, pages 1255–1270.
Leiby, Paul, and Jonathan Rubin (1997), Sustainable Transporta-tion: Analyzing the Transition to Alternative Fuel Vehicles (Oak Ridge National Laboratory, Oak Ridge, USA).
Mark, Jason, and Candace Morey (1999), Diesel Passenger Ve-hicles and the Environment (Union of Concerned Scientists, Washington DC).
PSA Peugeot Citroen (1999), “PSA Peugeot Citroen presents the first particle filter system to be fitted as standard equipment in a vehicle at the start of the year 2000”, Press Release, 15 April.
Rickeard, David J (2000), “Impact of fuels and lubricants on PM emissions. ExxonMobil Research and Engineering, paper pre-sented to the CRC/CEC/JAMA Workshop on Vehicle Exhaust Particle Emissions Measurement, 15 June.
Romilly, Peter (1999), “Substitution of bus for car travel in urban Britain: an economic evaluation of bus and car exhaust emis-sions and other costs”, Transportation Research Part D: Transport and Environment, 4(2), March, pages 109–125.
Shelef, M, and R W McCabe (2000), “Twenty-five years after introduction of automotive catalysts: what next?”, Catalysis Today, 62(1), 25 September, pages 35–50.
Stamatelos, A M (1997), “A review of the effect of particulate traps on the efficiency of vehicle diesel engines”, Energy Conversion Management, 38(1), pages 83–99.
Transportaction Powershift (2001), “Clean fuel vehicles market report. 2001”, available at <http://www.powershift.org.uk/vpo/ downloads/case/POWERSHIFT_MARKET_REPORT.pdf> last accessed 28 January 2003.
UK Commission for Integrated Transport (2001), “European com-parison of taxes on car ownership and use”, UK Department of Transport, Local Government and the Regions, 4 July.
Volvo Car Corporation (2002), “Product declaration/life cy-cle/useful life”, available at <http:/www.volvocars.co.uk/ Environmental> last accessed January 2002.
Walsh, Michael P (1999), “Global trends in diesel emissions con-trol — a 1999 update”, 1999-01-0107 SAE Engineering Soci-ety for Advancing Mobility Land Sea Air and Space, Society of Automotive Engineers.
Wang, M Q, and H S Huang (1999), “A full fuel-cycle analysis of energy and emissions impacts of transportation fuels produced from natural gas”, sponsored by the US Department of En-ergy,. Argonne National Laboratory.
Wang, M Q (1999), “Greet 1.5 — transportation fuel-cycle model”, sponsored by the US Department of Energy, Argonne National Laboratory.
Wang, M Q (2002), “Greenhouse gas emissions impacts of LP gas vehicles: a well-to-wheels study”, unpublished.
Williams, Jimmie L (2001), “Monolith structures, materials, proper-ties and uses”, Catalysis Today, 69(1–4), 15 September, pages 3–9.
Dow
nloa
ded
by [
Col
umbi
a U
nive
rsity
] at
07:
31 0
5 O
ctob
er 2
014