reducing crashes at rural thru-stop controlled intersections · crashes at rural thru-stop...
TRANSCRIPT
Reducing Crashes at Rural Thru-STOP Controlled Intersections
Howard Preston and Richard Storm CH2M Hill 1380 Corporate Center Curve, Suite 200 Eagan, MN 55121 [email protected], [email protected]
Key words: crash reduction―intersections―safety
INTRODUCTION/PROBLEM STATEMENT
County engineers around the State of Minnesota identified the frequency and severity of right angle crashes at rural Thru-STOP controlled intersections as being a significant concern. They also suggested that it was commonly believed that the key contributing factor to these crashes were vehicles on the minor road approaches running through the STOP signs.
An informal survey of practice of county highway departments found that the typical approach to designing the traffic control at these rural intersections started with installing a 30 by 30 inch STOP sign. Then, if there were ever an intersection recognition or crash problem the county highway staff would consider a variety of alternatives contained in their traffic safety tool box; including:
• adding rumble strips or overhead flashers
• adding a supplemental plaque to the STOP sign (CROSS TRAFFIC DOES NOT STOP)
• adding either bigger or additional STOP signs
However, a series of research reports has suggested that these strategies have not been consistently effective at reducing crashes. Research conducted by Iowa State University (1) analyzed more than one-hundred locations in Iowa and concluded that intersections with rumble strips had a higher crash frequency than comparable intersections without rumble strips. A similar study of twenty-five intersections in Minnesota came to the same conclusion (2). A study by the University of Minnesota of red/yellow overhead flashers installed at rural Thru-STOP controlled intersections found that they not only didn’t reduce crashes, but in a driving simulator environment they also appeared to confuse drivers into thinking that the intersection was actually controlled by an All-Way STOP (3). (Following the release of this study, MnDOT issued a technical memo to their District’s requesting the removal of these devices.) The University of Arkansas found the CROSS TRAFFIC DOES NOT STOP plaque to be of limited effectiveness because of inconsistent usage of the plaque and the fact that most drivers do not understand the concept of just exactly what is cross traffic (4). And finally, prior to the current study conducted by Harder, Bloomfield and Chihak using the University of Minnesota’s driving simulator there was virtually no research documenting the effectiveness of either larger or additional STOP signs. There is one additional key point, the basic approach used by the typical county engineer to address rural intersection safety appears to assume that the primary contributing factor is lack of recognition of the STOP sign by drivers on the minor road approaches (which results in the vehicles on the minor road running through the STOP signs). However, there is nothing in the literature to suggest that this is a valid assumption.
Therefore, the Minnesota Local Road Research Board adopted as an objective - the identification of new mitigation strategies for inclusion in the County Engineer’s Safety Tool Box, based on addressing the root causes of rural intersection crashes.
APPROACH
The basic approach to addressing the traffic engineering issues associated with safety at rural intersections consisted of the following four key steps:
1. Describing the basic geometric characteristics of typical rural Thru-STOP intersections and then using MnDOT’s crash records data base to identify the actual crash profile (crash frequency, severity, type, etc.) for a set of similar intersections and then identifying high frequency intersections.
2. Reviewing the actual police crash reports of a sample of the total crashes (i.e., all right angle crashes) in order to document the cause of the crash as noted by the investigating officer.
3. Randomly selecting a sample of the high crash frequency intersections, conducting a field review at the selected locations and documenting the basic roadway geometry and intersection area traffic control devices.
4. Identifying potential mitigation strategies that are directly linked to the documented crash causes and contributing factors.
Crash Analysis Results
The crash data analysis began by describing the geometric characteristics of the typical rural intersection in order to screen out those intersections with features that could result in baseline crash patterns that are not representative of the desired conditions. Conversations with a number of county engineers indicated that the typical features of their rural intersections include:
• 2-lane roadways only
• No medians or auxiliary turn lanes
• Four legs of approach
• Thru-STOP intersection control
The search of MnDOT’s transportation information database found a total of 7,634 intersections along the State’s system of trunk highways, of which 3,920 (51%) were classified as Rural and Through/STOP and 1,604 (21%) were found to meet all of the search criteria (see Figure 1). It should be noted that the study was limited to state highway intersections with county highways, county roads and other local roads (primarily township roads) because of the need to access MnDOT’s roadway information data. Similar roadway and traffic control databases do not currently exist for county and local roads.
MnDOT’s crash records database was then used to document the crash characteristics for the group of 1,604 similar intersections and for each intersection in the group over an almost three year study period. The key results of this analysis include the following:
• 721 (45%) intersections had no crashes.
• 883 (55%) intersections had at least one crash.
• There were a total of 2,296 crashes at the 1,604 intersections.
• Right angle crashes were the most common type of intersection crash (768 crashes/33%) and the most severe (62% of serious injuries and 71% of fatalities).
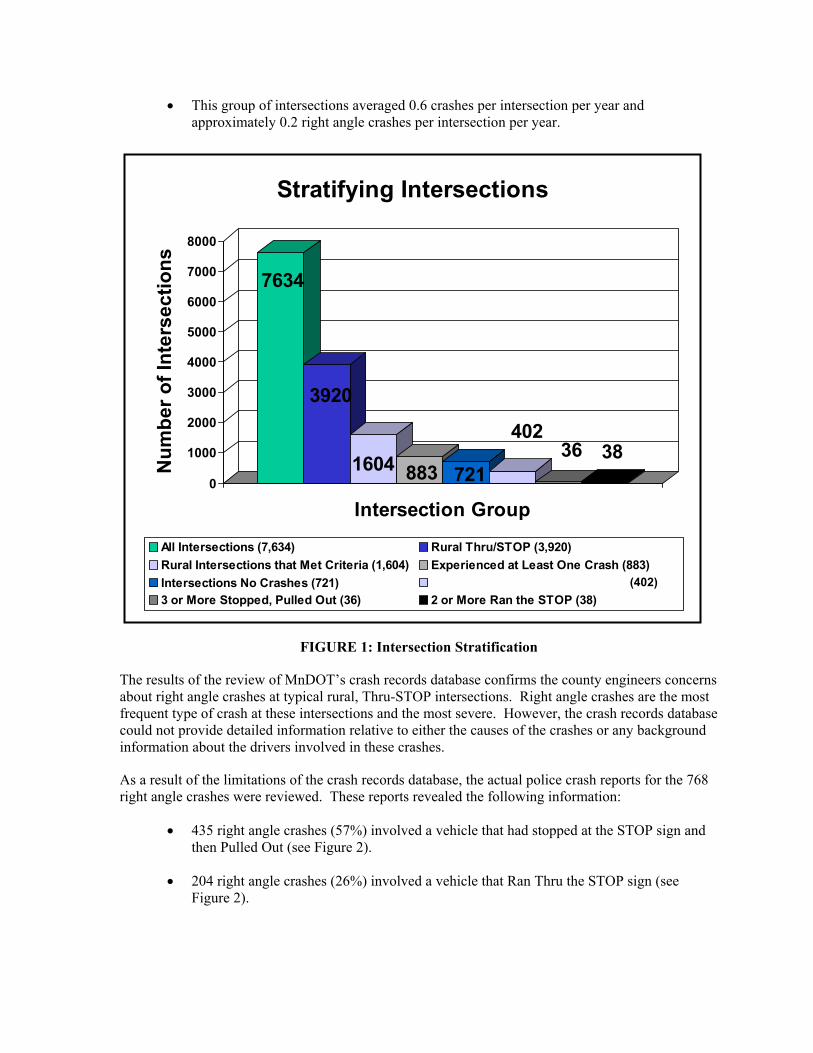
• This group of intersections averaged 0.6 crashes per intersection per year and approximately 0.2 right angle crashes per intersection per year.
FIGURE 1: Intersection Stratification
Intersections with Only One Crash
7634
3920
1604 883 721
40236 38
0
1000
2000
3000
4000
5000
6000
7000
8000
Num
ber o
f Int
erse
ctio
ns
Intersection Group
Stratifying Intersections
All Intersections (7,634) Rural Thru/STOP (3,920)Rural Intersections that Met Criteria (1,604) Experienced at Least One Crash (883)Intersections No Crashes (721) Intersections with One Crash (402)3 or More Stopped, Pulled Out (36) 2 or More Ran the STOP (38)
(402)
The results of the review of MnDOT’s crash records database confirms the county engineers concerns about right angle crashes at typical rural, Thru-STOP intersections. Right angle crashes are the most frequent type of crash at these intersections and the most severe. However, the crash records database could not provide detailed information relative to either the causes of the crashes or any background information about the drivers involved in these crashes.
As a result of the limitations of the crash records database, the actual police crash reports for the 768 right angle crashes were reviewed. These reports revealed the following information:
• 435 right angle crashes (57%) involved a vehicle that had stopped at the STOP sign and then Pulled Out (see Figure 2).
• 204 right angle crashes (26%) involved a vehicle that Ran Thru the STOP sign (see Figure 2).
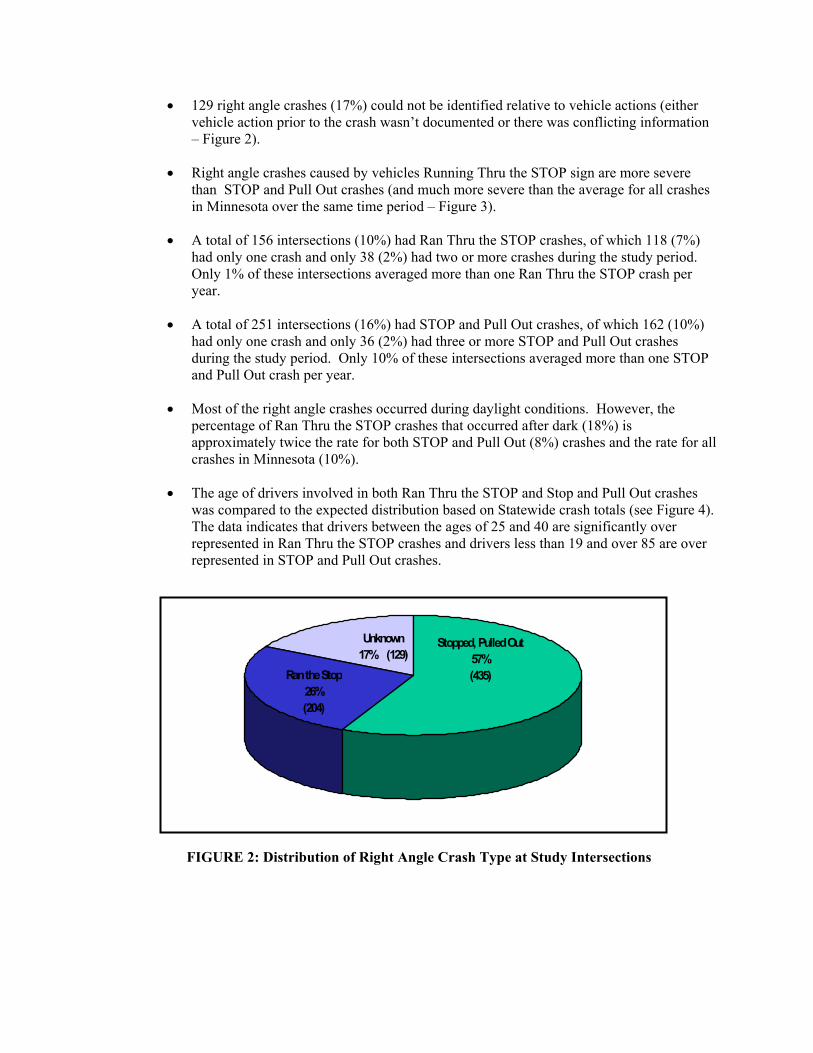
• 129 right angle crashes (17%) could not be identified relative to vehicle actions (either vehicle action prior to the crash wasn’t documented or there was conflicting information – Figure 2).
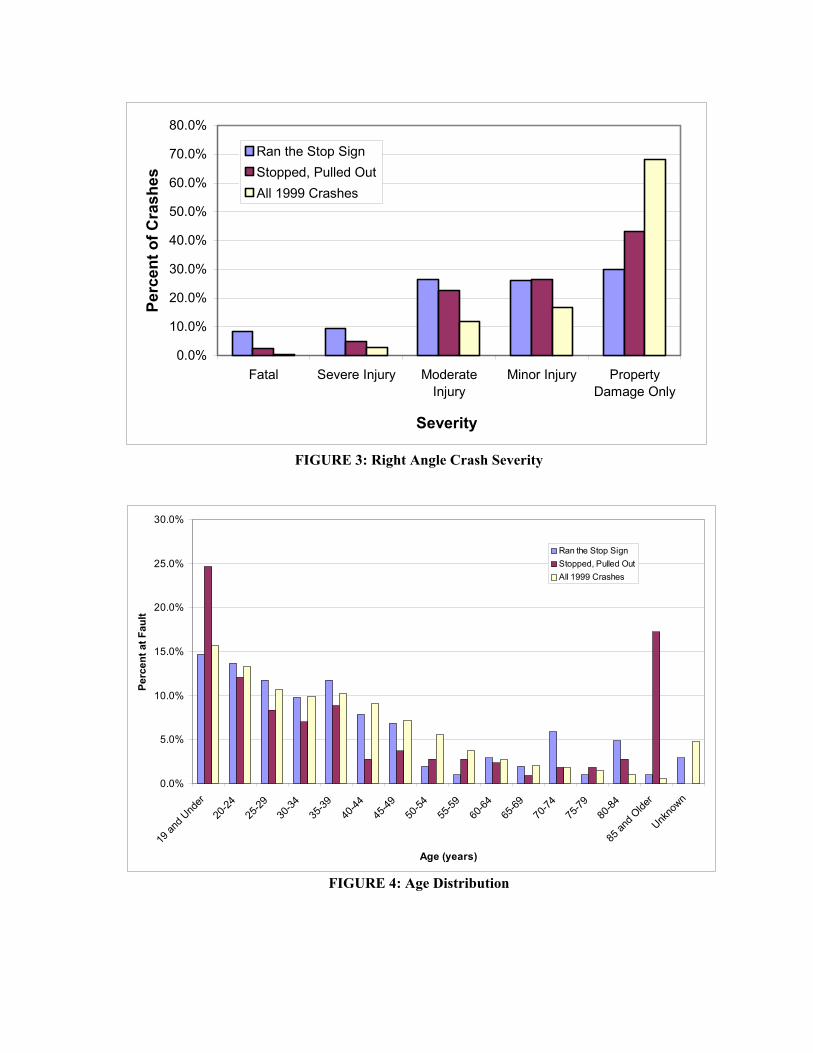
• Right angle crashes caused by vehicles Running Thru the STOP sign are more severe than STOP and Pull Out crashes (and much more severe than the average for all crashes in Minnesota over the same time period – Figure 3).
• A total of 156 intersections (10%) had Ran Thru the STOP crashes, of which 118 (7%) had only one crash and only 38 (2%) had two or more crashes during the study period. Only 1% of these intersections averaged more than one Ran Thru the STOP crash per year.
• A total of 251 intersections (16%) had STOP and Pull Out crashes, of which 162 (10%) had only one crash and only 36 (2%) had three or more STOP and Pull Out crashes during the study period. Only 10% of these intersections averaged more than one STOP and Pull Out crash per year.
• Most of the right angle crashes occurred during daylight conditions. However, the percentage of Ran Thru the STOP crashes that occurred after dark (18%) is approximately twice the rate for both STOP and Pull Out (8%) crashes and the rate for all crashes in Minnesota (10%).
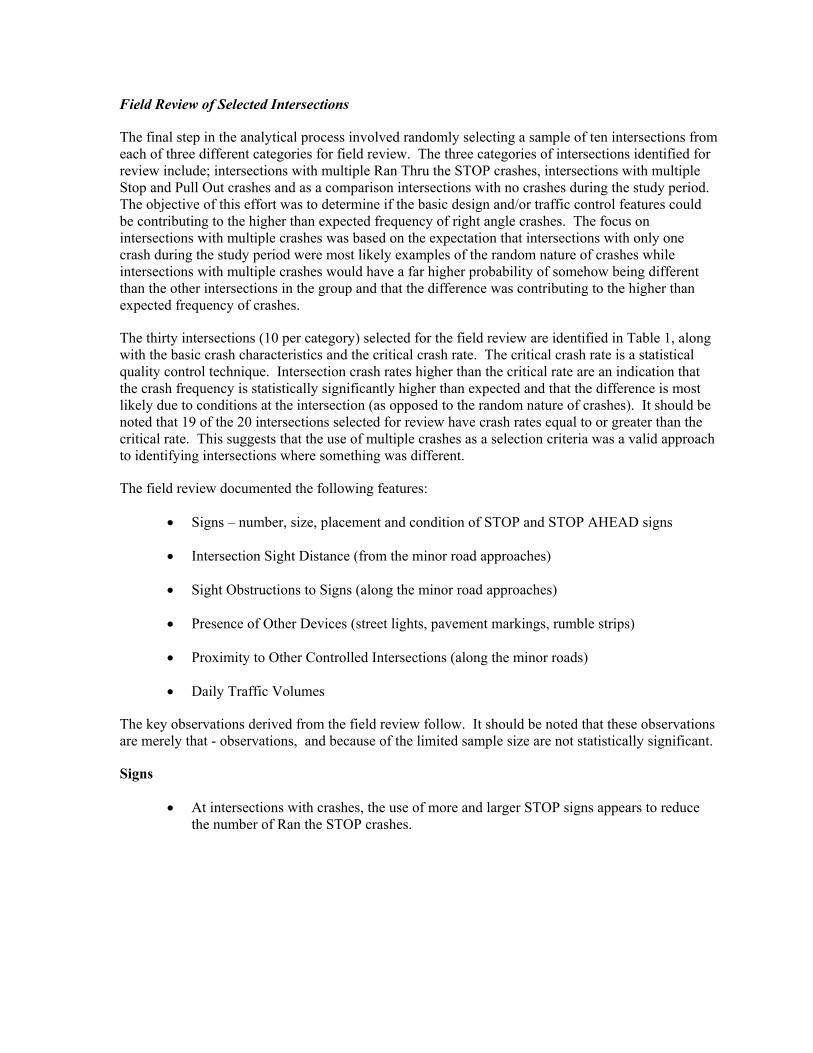
• The age of drivers involved in both Ran Thru the STOP and Stop and Pull Out crashes was compared to the expected distribution based on Statewide crash totals (see Figure 4). The data indicates that drivers between the ages of 25 and 40 are significantly over represented in Ran Thru the STOP crashes and drivers less than 19 and over 85 are over represented in STOP and Pull Out crashes.
FIGURE 2: Distribution of Right Angle Crash Type at Study Intersections
Unknown17% (129)
Ran the Stop26%(204)
Stopped, Pulled Out57%(435)
0.0%
10.0%
20.0%
30.0%
40.0%
50.0%
60.0%
70.0%
80.0%
Fatal Severe Injury ModerateInjury
Minor Injury PropertyDamage Only
Severity
Perc
ent o
f Cra
shes
Ran the Stop SignStopped, Pulled OutAll 1999 Crashes
FIGURE 3: Right Angle Crash Severity
0.0%
5.0%
10.0%
15.0%
20.0%
25.0%
30.0%
19 an
d Und
er
20-24
25-29
30-34
35-39
40-44
45-49
50-54
55-59
60-64
65-69
70-74
75-79
80-84
85 an
d Olde
r
Unkno
wn
Age (years)
Perc
ent a
t Fau
lt
Ran the Stop SignStopped, Pulled OutAll 1999 Crashes
FIGURE 4: Age Distribution
Field Review of Selected Intersections
The final step in the analytical process involved randomly selecting a sample of ten intersections from each of three different categories for field review. The three categories of intersections identified for review include; intersections with multiple Ran Thru the STOP crashes, intersections with multiple Stop and Pull Out crashes and as a comparison intersections with no crashes during the study period. The objective of this effort was to determine if the basic design and/or traffic control features could be contributing to the higher than expected frequency of right angle crashes. The focus on intersections with multiple crashes was based on the expectation that intersections with only one crash during the study period were most likely examples of the random nature of crashes while intersections with multiple crashes would have a far higher probability of somehow being different than the other intersections in the group and that the difference was contributing to the higher than expected frequency of crashes.
The thirty intersections (10 per category) selected for the field review are identified in Table 1, along with the basic crash characteristics and the critical crash rate. The critical crash rate is a statistical quality control technique. Intersection crash rates higher than the critical rate are an indication that the crash frequency is statistically significantly higher than expected and that the difference is most likely due to conditions at the intersection (as opposed to the random nature of crashes). It should be noted that 19 of the 20 intersections selected for review have crash rates equal to or greater than the critical rate. This suggests that the use of multiple crashes as a selection criteria was a valid approach to identifying intersections where something was different.
The field review documented the following features:
• Signs – number, size, placement and condition of STOP and STOP AHEAD signs
• Intersection Sight Distance (from the minor road approaches)
• Sight Obstructions to Signs (along the minor road approaches)
• Presence of Other Devices (street lights, pavement markings, rumble strips)
• Proximity to Other Controlled Intersections (along the minor roads)
• Daily Traffic Volumes
The key observations derived from the field review follow. It should be noted that these observations are merely that - observations, and because of the limited sample size are not statistically significant.
Signs
• At intersections with crashes, the use of more and larger STOP signs appears to reduce the number of Ran the STOP crashes.
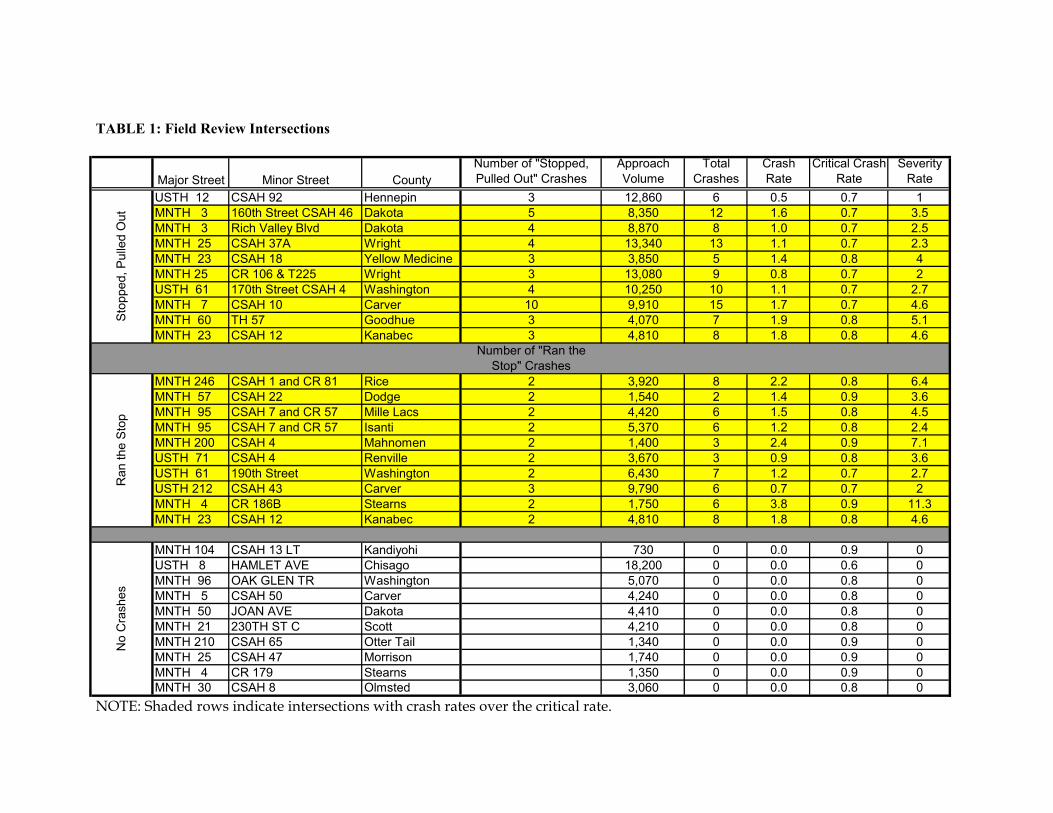
TABLE 1: Field Review Intersections
Major Street Minor Street CountyNumber of "Stopped, Pulled Out" Crashes
Approach Volume
Total Crashes
Crash Rate
Critical Crash Rate
Severity Rate
USTH 12 CSAH 92 Hennepin 3 12,860 6 0.5 0.7 1MNTH 3 160th Street CSAH 46 Dakota 5 8,350 12 1.6 0.7 3.5MNTH 3 Rich Valley Blvd Dakota 4 8,870 8 1.0 0.7 2.5MNTH 25 CSAH 37A Wright 4 13,340 13 1.1 0.7 2.3MNTH 23 CSAH 18 Yellow Medicine 3 3,850 5 1.4 0.8 4MNTH 25 CR 106 & T225 Wright 3 13,080 9 0.8 0.7 2USTH 61 170th Street CSAH 4 Washington 4 10,250 10 1.1 0.7 2.7MNTH 7 CSAH 10 Carver 10 9,910 15 1.7 0.7 4.6MNTH 60 TH 57 Goodhue 3 4,070 7 1.9 0.8 5.1MNTH 23 CSAH 12 Kanabec 3 4,810 8 1.8 0.8 4.6
Number of "Ran the Stop" Crashes
MNTH 246 CSAH 1 and CR 81 Rice 2 3,920 8 2.2 0.8 6.4MNTH 57 CSAH 22 Dodge 2 1,540 2 1.4 0.9 3.6MNTH 95 CSAH 7 and CR 57 Mille Lacs 2 4,420 6 1.5 0.8 4.5MNTH 95 CSAH 7 and CR 57 Isanti 2 5,370 6 1.2 0.8 2.4MNTH 200 CSAH 4 Mahnomen 2 1,400 3 2.4 0.9 7.1USTH 71 CSAH 4 Renville 2 3,670 3 0.9 0.8 3.6USTH 61 190th Street Washington 2 6,430 7 1.2 0.7 2.7USTH 212 CSAH 43 Carver 3 9,790 6 0.7 0.7 2MNTH 4 CR 186B Stearns 2 1,750 6 3.8 0.9 11.3MNTH 23 CSAH 12 Kanabec 2 4,810 8 1.8 0.8 4.6
MNTH 104 CSAH 13 LT Kandiyohi 730 0 0.0 0.9 0USTH 8 HAMLET AVE Chisago 18,200 0 0.0 0.6 0MNTH 96 OAK GLEN TR Washington 5,070 0 0.0 0.8 0MNTH 5 CSAH 50 Carver 4,240 0 0.0 0.8 0MNTH 50 JOAN AVE Dakota 4,410 0 0.0 0.8 0MNTH 21 230TH ST C Scott 4,210 0 0.0 0.8 0MNTH 210 CSAH 65 Otter Tail 1,340 0 0.0 0.9 0MNTH 25 CSAH 47 Morrison 1,740 0 0.0 0.9 0MNTH 4 CR 179 Stearns 1,350 0 0.0 0.9 0MNTH 30 CSAH 8 Olmsted 3,060 0 0.0 0.8 0
Sto
pped
, Pul
led
Out
Ran
the
Sto
pN
o C
rash
es
NOTE: Shaded rows indicate intersections with crash rates over the critical rate.
• The placement of STOP signs does not appear to be an issue. There was very little variation in the placement of the signs from intersection to intersection and the placements were all in substantial compliance with the guidelines in the MNMUTCD.
• The use of brighter retroreflective sheeting material appears to reduce the frequency of both total crashes and right angle crashes. The highest usage of diamond grade sheeting was at intersections with no crashes and the lowest usage was at intersections with multiple Ran the STOP crashes.
• STOP AHEAD signs were in place at all but one intersection. At intersections with crashes, it appears that the use of larger, brighter advance warning signs reduces the frequency of Ran Thru the STOP crashes.
Intersection Sight Distance
• Intersection sight distance does not appear to be related to the frequency of STOP and Pull Out crashes.
• Each category had about the same number of intersections (between 2 and 4) with less than adequate intersection sight distance (Assumed to be 10 seconds, consistent with the basic guidance in the AASHTO Green Book – 5).
• The category with multiple STOP and Pull Out crashes had the fewest number of intersections with less than adequate sight distance.
Sight Obstructions to STOP Signs
• Sight obstructions to STOP signs does not appear to be related to the frequency of Ran the STOP crashes.
• Intersections with no crashes had the lowest frequency of obscured signing (1). However, the intersections with multiple Ran the STOP crashes only had two instances of obscured signing.
Presence of Other Devices
• Intersections with crashes and street lights had a much lower frequency of both night time crashes and Ran the STOP crashes.
• Intersections with STOP AHEAD pavement markings had a lower frequency of Ran the STOP crashes.
• Intersections with rumble strips on the minor road approach had the same frequency of Ran the STOP crashes as intersections without rumble strips.
Proximity to Other Controlled Intersections
• Proximity to other controlled intersections (along the minor road) may be related to total crash frequency. All of the intersections with both multiple STOP and Pull Out and Ran Thru the STOP crashes were more than a mile away form the nearest
Proceedings of the 2003 Mid-Continent Transportation Research Symposium, Ames, Iowa, August 2003. © 2003 by Iowa State University. The contents of this paper reflect the views of the author(s), who are responsible for the facts and accuracy of the information presented herein.
controlled intersection, while only one-half of the intersections with no crashes were more than a mile from another controlled intersection.
Daily Traffic Volumes
• The intersections with multiple STOP and Pull Out crashes had the highest traffic volumes, with the average daily approach volume in the range of 9,000 vehicles per day. The other two intersection categories each had average approach volumes in the range of 4,500 vehicles per day.
During a review of this material with the advisory panel of county engineers, it was requested that the crash data for the sample of intersections with multiple crashes be analyzed to determine if unfamiliar motorists were contributing to the frequency of crashes. The analysis consisted of identifying the location of each crash and the home city of each of the “at fault” drivers and then documenting the distance between the two. The results of this analysis indicate that the average distance between home and crash site is less than 10 miles and 80% of the distances are less than 30 miles. This would suggest that unfamiliar drivers do not appear to be over represented in either STOP and Pull Out or Ran Thru the STOP crashes. This might also suggest that, in rural areas with relatively low traffic volumes, drivers who are in fact familiar with the road and know that traffic is fairly infrequent might not be paying sufficient attention.
POTENTIAL MITIGATION STRATIGIES
The results of the analysis of the crash data and the field review of the selected intersections suggest the need to develop two basic approaches to addressing the issue of right angle crashes at rural through/STOP intersections. The first would have to address the most prevalent type of crash, STOP and Pulled Out, where the primary contributing factor is gap selection. The second would then address the Ran the STOP types of crashes, where the primary contributing factor is intersection recognition. The results of the crash analysis also suggests that due to the very low frequency of occurrence of either type of crash (an average of less than .1 crashes per intersection per year), the most effective implementation would most likely involve a systematic approach instead of an approach focused on the very small number of locations with multiple crashes.
It appears that there are two types of strategies for addressing the issue of gap selection, static and dynamic. The Pennsylvania Department of Transportation has experimented with the use of pavement markings to identify unsafe gaps. Other possibilities include the use of sign posts or street light poles to identify the limits of unsafe gaps on the major street approaches to intersections. An example of how these devices could be deployed would consist of placing a series of street lights on the major street approaches, with the last street light at the limits of the unsafe gap - current research (5) suggests that a safe gap at a rural intersection would be in the range of 650 to 800 feet (approximately 8 to 10 seconds at a posted 55 mile per hour speed limit). A dynamic system could use either a optical detectors or radar to sense the location of vehicles approaching the intersection on the major street and then using some type of changeable message sign to inform the driver waiting at the STOP sign on the minor street. The University of Minnesota has just begun a research project that will look at developing and evaluating alternative dynamic technologies to assist with the gap selection process.
It appears that there are also static and dynamic strategies for addressing the issue of intersection recognition. The static strategies would increase the conspicuity of traffic control devices by making them larger, brighter or using additional signs and markings. The dynamic approach
Preston and Storm 10
could use optical detectors or radar to sense the speed of vehicles on the minor street approaches and then use some type of changeable message sign to warn drivers on the major street to take action to avoid vehicles that appear to be going too fast to stop prior to entering the intersection. Virginia Tech has just begun a research project that will look at developing and evaluating alternative dynamic technologies to warn of STOP sign and traffic signal violators.
In either case, a complementary component to developing and deploying new or additional devices would include an educational program for drivers. Drivers would have to be taught what these devices mean and what they would need to do to effectively use the information in order to prevent crashes.
CONCLUSIONS
The review of MnDOT’s crash records data base and police crash reports indicates the following:
• Almost one-half of the 1,604 rural Through/STOP intersections in the data base experienced no crashes during the 2+ year study period.
• This group of intersections averaged 0.6 crashes per intersection per year and approximately 0.2 right angle crashes.
• Right angle crashes account for more crashes than any other type.
• Right angle crashes are the most severe type of crash, accounting for nearly 71% of the fatal crashes.
• The most common type of right angle crash (approximately 60%) involves a vehicle Stopping and then Pulling Out into an unsafe gap. Approximately 25% of the right angle crashes involved a minor street vehicle Running through the STOP sign. (The remaining right angle crashes could not be classified.)
• The occurrence of STOP and Pull Out crashes is not wide spread. 251 intersections experienced one of these crashes (out of a total of 1,604 intersections over a 2+ year study period). Only 89 intersections experienced two or more STOP and Pull Out crashes.
• The occurrence of Ran the STOP crashes is not wide spread. 118 intersections experienced one of these crashes and only 38 intersections experienced two or more Ran the STOP crashes.
• Light condition at the intersection appears to be a contributing factor. Vehicles are running the STOP signs at intersections without street lights at twice the statewide average for all crashes.
• The age of the driver appears to be a contributing factor. Drivers under 20 and over 85 are over represented in STOP and Pull Out crashes and drivers between the ages of 25 and 40 are over represented in Ran the STOP crashes.
Preston and Storm 11
• Increasing the conspicuity of traffic control devices by using bigger, brighter or additional signs and markings appears to lower the frequency of Ran the STOP crashes.
• Rumble strips do not appear to be effective at reducing the frequency of Ran the STOP crashes (intersections with and without rumble strips had the same frequency of crashes).
• Intersection sight distance does not appear to be related to the frequency of gap selection related crashes.
• Proximity to other controlled intersections may be related to crash frequency.
These conclusions suggest that some of the old strategies in the Intersection Safety Tool Box should be discarded because they have no history of being consistently effective (rumble strips on the approach to intersections, red/yellow overhead flashers and the CROSS TRAFFIC DOES NOT STOP sign). In addition, these conclusions appear to support the development of two new types of mitigation strategies, the first focused on improving the ability of drivers on the minor street to identify safe gaps in traffic approaching on the major road and the second focused on addressing the issue of intersection recognition. These strategies would then be candidates for the Intersection Safety Tool box if and when they are able to demonstrate their effectiveness.
Preston and Storm 12
Preston and Storm 13
REFERENCES
1. Carstens, R. L. “Safety Effects of Rumble Strips on Secondary Roads”, transportation Research Record 926. TRB, National Research Council, Washington D.C., 1983, pg. 12-15.
2. Preston, H. D. “Reducing Risk and Liability in Roadway Design, Construction and Maintenance, University of Minnesota, Center for Transportation Studies, Minneapolis, MN, 2002
3. Stackhouse, S., Cassidy, P. Warning Flashers at Rural Intersections – Research Report 1998-01, Minnesota Department of Transportation, St. Paul, Mn.
4. Gattis, J. L., Cross Traffic Signing for STOP Signs, TRB 75th Annual Meeting, January, 1996, Washington, D.C.
5. A Policy on Geometric Design of Highways and Streets, American Association of State Highway and Transportation Officials, Washington D.C., 2001, pg. 664