reduced proton and alpha particle precipitations at mars during solar wind pressure pulses: mars...
TRANSCRIPT
Reduced proton and alpha particle precipitations at Marsduring solar wind pressure pulses: Mars Express results
C. Diéval,1,2 G. Stenberg,1 H. Nilsson,1,2 N. J. T. Edberg,3 and S. Barabash1
Received 5 November 2012; revised 21 April 2013; accepted 2 June 2013; published 25 June 2013.
[1] We performed a statistical study of downward moving protons and alpha particles of~keV energy (assumed to be of solar wind origin) inside the Martian inducedmagnetosphere from July 2006 to July 2010. Ion and electron data are from the Analyzer ofSpace Plasma and Energetic Atoms (ASPERA-3) package on board Mars Express. Weinvestigated the solar wind ion entry into the ionosphere, excluding intervals of low-altitudemagnetosheath encounters. The study compares periods of quiet solar wind conditions andperiods of solar wind pressure pulses, including interplanetary coronal mass ejections andcorotating interaction regions. The solar wind ion precipitation appears localized and/orintermittent, consistent with previous measurements. Precipitation events are less frequent,and the precipitating fluxes do not increase during pressure pulse encounters. Duringpressure pulses, the occurrence frequency of observed proton precipitation events is reducedby a factor of ~3, and for He2+ events the occurrence frequency is reduced by a factor of ~2.One explanation is that during pressure pulse periods, the mass loading of the solar windplasma increases due to a deeper penetration of the interplanetary magnetic flux tubes intothe ionosphere. The associated decrease of the solar wind speed thus increases the pileupof the interplanetary magnetic field on the dayside of the planet. The magnetic barrierbecomes thicker in terms of solar wind ion gyroradii, causing the observed reduction ofH+/He2+ precipitations.
Citation: Dieval, C., G. Stenberg, H. Nilsson, N. J. T. Edberg, and S. Barabash (2013), Reduced proton and alpha particleprecipitations at Mars during solar wind pressure pulses: Mars Express results, J. Geophys. Res. Space Physics, 118,3421–3429, doi:10.1002/jgra.50375.
1. Introduction
[2] The Martian ionosphere presents a partially conductiveobstacle to the solar wind. When flowing around Mars, thesolar wind, which carries the frozen-in interplanetary mag-netic field (IMF), induces currents in the ionosphere. At thesame time, the IMF diffuses into the ionosphere. There is asuperposition of the magnetic fields from the induced cur-rents, and the IMF partially diffused into the ionosphere.This superposition creates a region of an increased magneticfield above the ionosphere, the so-called magnetic barrier.[3] The inner edge of the magnetic barrier corresponds to
the photoelectron boundary (PEB), below which the iono-sphere starts and where the ionospheric electron densitysteeply increases [Frahm et al., 2006; Dubinin et al., 2008].The outer edge of the magnetic barrier is referred to as theinduced magnetospheric boundary (IMB) [Dubinin et al.,
2006]. There is a pressure balance at the IMB between theupstream dynamic pressure and the magnetic pressure ofthe pileup region. The IMB also separates the solar wind ions(mainly H+, He2+) from the planetary ionospheric ions(mainly O+, O2
+, CO2+) [e.g., Breus et al., 1991].
[4] However, in some circumstances, solar wind ions areable to pass from the magnetosheath to the ionosphere. Inthe hot magnetosheath plasma, there are solar wind ions witha gyroradius comparable to the size of the subsolar magneticbarrier. For example, the gyroradius for a typical 1 keV solarwind proton H+ and for a typical 4 keV solar wind alphaparticle He2+ are 152 km and 306 km, respectively, for abackground magnetic field strength of 30 nT (a typicalstrength of the dayside piled up magnetic field). Thesegyroradii are close to the nominal size of the subsolar mag-netic barrier, estimated to be 300 km, using the mean altitudeof the PEB at 400 km from Mitchell et al. [2001] and themean altitude of the subsolar IMB at 700 km from Dubininet al. [2006]. Modeling studies predict that solar wind ionswith relatively high energies (large gyroradii) can cross theIMB without being deflected away and that they finally traveldown, i.e., precipitate to low altitudes [Brecht, 1997; Kallioand Janhunen, 2001]. The precipitating protons and alphaparticles then deposit their energy into the Martian upperatmosphere, causing charge exchange reactions, momentumtransfer, ionization, and heating of the planetary neutralatoms [Kallio and Janhunen, 2001; Shematovich et al.,
1Swedish Institute of Space Physics, Kiruna, Sweden.2Division of Space Technology, Department of Computer Science,
Electrical and Space Engineering, Luleå University of Technology, Kiruna,Sweden.
3Swedish Institute of Space Physics, Uppsala, Sweden.
Corresponding author: C. Diéval, Swedish Institute of Space Physics,Box 812, SE-98128 Kiruna, Sweden. ([email protected])
©2013. American Geophysical Union. All Rights Reserved.2169-9380/13/10.1002/jgra.50375
3421
JOURNAL OF GEOPHYSICAL RESEARCH: SPACE PHYSICS, VOL. 118, 3421–3429, doi:10.1002/jgra.50375, 2013
2011, 2013]. Downgoing protons and alpha particles withsolar wind energies are regularly observed in the Martianionosphere but found to be localized and/or intermittent[Lundin et al., 2004; Stenberg et al., 2011; Diéval et al.,2012a, 2013].[5] There are two main types of solar disturbance of the
interplanetary medium associated with high dynamic pres-sures: the corotating interaction regions (CIR) and theinterplanetary coronal mass ejections (ICME).[6] CIRs are recurrent structures of the interplanetary
medium [see, e.g., Hundhausen, 1972]. The rotating andtilted Sun emits fast plasma at the poles and slow plasma nearthe equator. The fast solar wind stream overtakes the slowsolar wind stream, forming the CIR. The CIR is a spiral struc-ture which rotates with the Sun.[7] Coronal mass ejections are sporadic ejections of huge
amounts of plasma and twisted magnetic field lines fromthe Sun. ICMEs correspond to the propagation of this mate-rial in the interplanetary medium [see, e.g., Jian et al., 2006].[8] When a solar wind pressure pulse impacts Mars, the
resulting intense solar wind fluxes move closer to the planet,tailward fluxes of accelerated planetary ions are enhanced,and atmospheric escape increases [e.g., Dubinin et al.,2009; Edberg et al., 2010; Nilsson et al., 2011]. Modelingstudies also indicate increased atmospheric escape duringhigh dynamic pressure conditions compared to quiet condi-tions [e.g., Harnett and Winglee, 2006; Kaneda et al., 2009].[9] Hara et al. [2011] reported observations of enhanced
fluxes of O+ ions picked up by the solar wind, precipitatingat the Martian terminator, during solar wind pressure pulses.Under normal solar conditions, the picked up O+ ions havegyroradii larger than the planet (Martian radius = 3397 km)and are quickly swept away by the solar wind. However, dur-ing conditions of high upstream dynamic pressure and/orhigh IMF strength, the magnetic pressure increases in theMartian pileup region, and the gyroradii of the picked up ionsdecrease [Hara et al., 2011], so that these ions are morelikely to impact the planet along their trajectory.[10] In this paper, we investigate how the precipitating H+
and He2+ ions react to pressure pulses. Section 2 presents theinstrumentation and the methodology. Section 3 describesthe results. Section 4 discusses the results in relation to previ-ous work. Section 5 concludes the paper.
2. Instrumentation and Data Selection
[11] We use in situ ion and electron measurements from theAnalyzer of Space Plasma and Energetic Atoms (ASPERA-3)package [Barabash et al., 2006] onboard the Mars Express(MEX) spacecraft. We use the Electron Spectrometer (ELS)and the Ion Mass Analyzer (IMA). ELS measures 2-D distri-butions of the electron flux in the energy range 5 eV to15 keV with a field of view of 4°× 360° divided into 16 azi-muth sectors and a time resolution of 4 s. IMAmeasures distri-butions of the fluxes of different ion species, including H+, He2+, and O+, with m/q resolution in the energy range 200 eV/q to36 keV/q. In practice, the lower energy limit to detect protonsis ~1.2 keV for the intermediate postacceleration level. Thepostacceleration voltage serves to vary the mass resolution ofthe instrument (see details in Barabash et al. [2006]). IMAgives a 2-D measurement of the ion fluxes (16 azimuthsectors), for all energies, at a time resolution of 12 s. A full
distribution with a field of view of 90° × 360° is obtained in192 s (one IMA scan), using electrostatic sweeping to get±45° coverage out of the plane of the aperture (sweep overelevation angles). We use data from July 2006 to July 2010(during the solar minimum) except May 2007 and November2009 when new IMA energy tables were uploaded. We con-sider altitudes from ~260 km (pericenter) up to 2000 km, inthe region XMSO> 0 (dayside). In the Mars Solar Orbital(MSO) Cartesian coordinate system, the XMSO axis pointsfrom the center of Mars toward the Sun, the YMSO axis pointsopposite to the Martian orbital velocity vector, and the ZMSO
axis completes the right-handed system.[12] We are only interested in precipitation events observed
inside the ionosphere, below the PEB. We have manuallyidentified and selected IMA scans presenting proton and alphaparticle fluxes (with ~keV energy) in the presence of iono-spheric photoelectrons and in the absence of magnetosheathelectrons. The method is the same as used by Diéval et al.[2013]. A proton (alpha particle) precipitation event corre-sponds to an IMA scan during which a downward integratedproton (alpha particle) flux exists, i.e., a precipitating flux.We exclude from the consideration time periods when thedata were regarded invalid (instrumental effects, etc.). Weremove precipitation events showing severe contaminationby ultraviolet radiation or by other ion species. To separatesolar wind alpha particles from low-energy planetary H2
+
(both have m/q = 2, where m is the ion mass and q theelementary charge), we consider the mass line m/q = 2 forenergies above 200 eV only.[13] The measurements take place at altitudes >260 km,
well above the altitude of the exobase at solar minimum,~180 km. Thus, we cannot be sure that the measured precip-itating ions will reach the exobase further down and finally belost in the atmosphere. For example, ions moving downwardat a given time may, through the Lorentz force, end up mov-ing upward at a later time and not reach the exobase at all.Conversely, ions moving upward may end up moving down-ward and finally reach the exobase. We then need to knowthe electromagnetic environment to which the ions aresubject: this is a modeling task [see, e.g., Fang et al.,2010], beyond the scope of the paper. We just considerdownward ion fluxes in this study and assume that these ionsreach the exobase.[14] We treat proton events and alpha particle events inde-
pendently, and we do not attempt to examine the differencesin solar wind ion composition during different sets of exter-nal conditions. We note that the data coverage (total numberof IMA scans during the period of study, including the pre-cipitation events) is slightly different for the proton studyand the alpha particle study. This is because, for each sepa-rate study, we removed from the data coverage the scanswhich were identified as potential precipitation events butwere finally discarded due to severe contamination by ultra-violet radiation or by other ion species.[15] We use an extended version of the list of solar wind
pressure pulse encounters with Mars (ICMEs and CIRs)determined by Edberg et al. [2010]. Edberg et al. [2010]describe in detail the automatic selection of solar wind pres-sure pulse intervals from the magnetic field and ion data mea-sured by the Advanced Composition Explorer (ACE)spacecraft, which monitors the solar wind upstream of theEarth. The arrival time at Mars of such solar wind pressure
DIÉVAL ET AL.: SOLAR WIND ION PRECIPITATION AT MARS
3422

pulse is calculated following the method of Vennerstromet al. [2003] [see Edberg et al., 2010]. This calculated timeis then compared with the electron observations from MEXto get a more accurate arrival time as well as an end time ofthe pressure pulse encounter, which we use in this work.During the observation period, 121 automatically selectedICMEs/CIRs had counterparts in the MEX data at Mars (nolarge gap in MEX data). To this list, we add 72 intervals man-ually selected in the MEX data, suggesting an ICME/CIRpassage. For these 72 intervals, we manually check for coun-terparts in the ACE data: either no counterpart can be found(cases of an ICME hitting only MEX but not ACE) or a coun-terpart is identified by eye in the ACE data but does not meetthe automatic selection criterion. The full list contains 193 in-tervals of solar wind pressure pulse encounters at Mars.Finally, we check the intervals for valid dayside IMA databelow the local PEB. The final numbers of pressure pulse in-tervals are 150 for the proton study and 149 for the alpha par-ticle study, respectively.[16] Finally, we do not consider the solar radiation envi-
ronment in this study, i.e., ion fluxes with energies fromtens of keV to GeV. These energies are beyond the upperenergy limit of the IMA instrument, 36 keV/q. Note thatthe detection efficiency of IMA is poor at the high end ofits energy range.
3. Observations
[17] Examples of precipitating H+ and He2+ are shown inFigure 1. The left column shows a proton event (Figures 1a,1b, and 1c) on 11 August 2007 from 0715 to 0730 UT, dur-ing orbit # 4627. The dayside ionosphere electron spectraare characterized by narrow photoelectron peaks (horizontallines between 20 and 30 eV, Frahm et al. [2006]) between0715 and ~0723 UT in Figure 1b. The proton precipitationevent is detected in the ionosphere at 0722 UT (altitude~1000 km, solar zenith angle (SZA) = 29°, energy range
1.1–1.7 keV). The PEB is crossed outbound at ~0723 UT.The IMB is crossed outbound at 0724 UT (SZA= 28°, alti-tude ~1100 km). Afterward, the magnetosheath plasma isrecognized by high fluxes of electrons at suprathermal ener-gies (40–300 eV). This case shows clear crossings of theplasma boundaries, suggesting quiet solar wind conditions.[18] The right column of Figure 1 shows an alpha particle
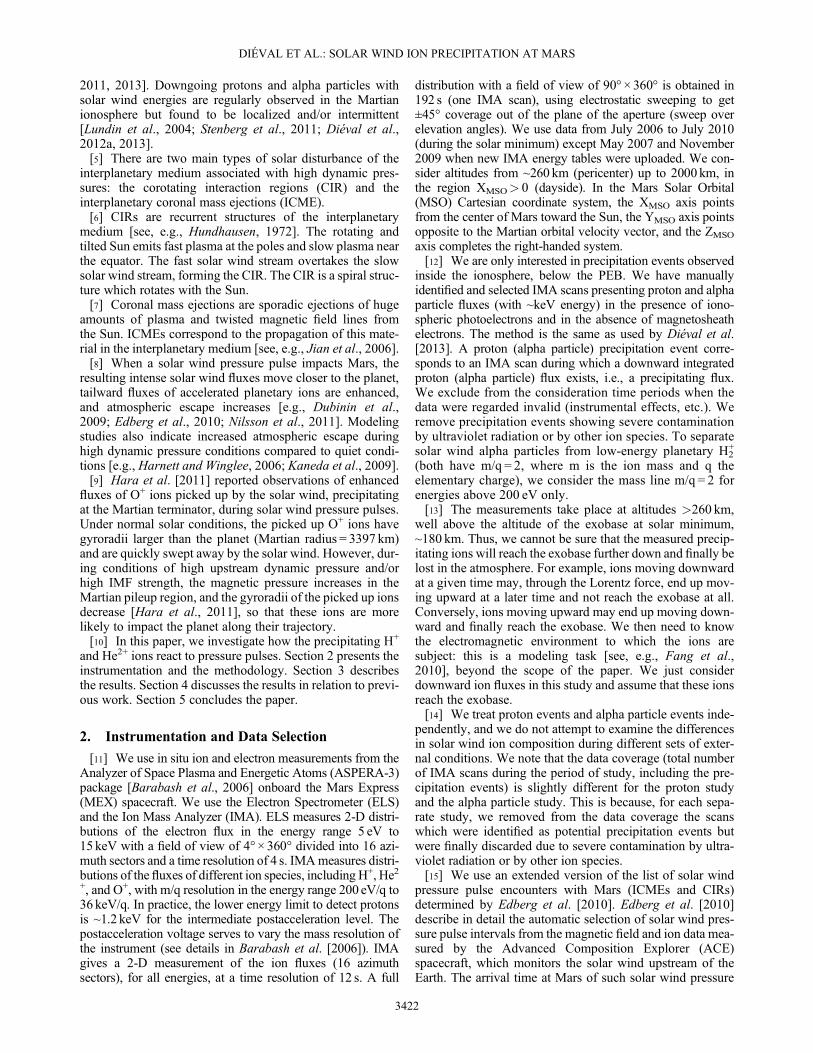
event (Figures 1d, 1e, and 1f), on 13 August 2007 from1930 to 1950 UT, during orbit # 4636. The dayside iono-sphere is visible from 1930 to ~1937 UT (Figure 1e). Theprecipitating He2+ event is detected at 1935–1936 UT inthe ionosphere (altitude ~580–620 km, SZA ~43–44°,energy = 3 keV/q). Between ~1937 and ~1943 UT, thereare multiple crossings of the ionosphere/magnetosheath in-terface, where we see both ionospheric photoelectrons andreduced fluxes of shocked electrons: this is the magneticpileup region. This result suggests unsteady solar wind con-ditions and makes the identification of plasma boundarycrossings difficult. We choose to place the outbound PEBcrossing at ~1937 UT and the outbound IMB crossing at~1943 UT (SZA= 52°, altitude = 440 km). The IMB cross-ing occurs at low altitude on 13 August, compared to thecrossing on 11 August: the magnetosphere was more com-pressed than usual. The magnetosheath is present from~1943 UT. There is a dip in the suprathermal electron fluxbetween 1944 and 1945 UT, indicating that the plasmaboundaries moved to higher altitudes during this interval,likely because of a short-duration decrease of the upstreamdynamic pressure. The disturbed solar wind conditionsshown by the MEX data on 13 August 2007 are the resultsof a CIR encounter with Mars. The same CIR front reachedthe ACE spacecraft earlier on 6 August 2007.[19] Figure 2 gives an overview of the passage of this CIR
at Earth and then at Mars. Figures 2a, 2b, 2c, and 2d are timeseries of ACE data showing the IMF strength, the density, thebulk velocity, and the dynamic pressure of the solar wind
400
600
800
20
40
60
80
100
SZ
A
[deg
ree]
Alpha particle event, 13 August 2007
19:30 19:40 19:50
Time [UT]
500
1000
1500
Alti
tude
[km
]
20
30
40
50
Proton event, 11 August 2007
101
102
103
Ene
rgy
[eV
]
07:20 07:30
103
104
Time [UT]
Ene
rgy
[eV
/q]
9
10
11
12
[eV
/cm
2 /s/
sr/k
eV]
4
5
6
[#/c
m2 /
s/eV
]
Log10
Log10
PEB PEB IMBIMB
a
b
c
d
e
f
Figure 1. (left) A proton precipitation event on 11 August 2007. The vertical solid line marks the IMBcrossing, and the vertical dashed line marks the PEB crossing. (a) Altitude of MEX (black curve, left axis)and SZA of MEX (blue curve, right axis). (b) Energy-time spectrogram of electrons measured by ELS(averaged over all sectors). (c) Energy-time spectrogram of protons measured by IMA (downward fluxsummed over sectors). (right) An alpha particle precipitation event on 13 August 2007. The format is thesame as for Figure 1 (left), except that Figure 1f shows alpha particles.
DIÉVAL ET AL.: SOLAR WIND ION PRECIPITATION AT MARS
3423
protons, respectively, from 6 August 2007 (0000 UT) to 9August 2007 (0000 UT). The magnetic field is given by theMAGnetometer MAG [Smith et al., 1998], and the solarwind parameters are given by the Solar Wind Electrons,Protons, and Alpha Particle Monitor [McComas et al.,1998]. At the beginning of the interval, the solar wind con-ditions are quiet: IMF strength = 4 nT, and solar wind bulkvelocity = 290 km s�1. On 6 August 2007 at 0400 UT, thespacecraft meets the CIR front. During the passage of theCIR, there are increases of the solar wind density (up to26 cm�3), of the IMF strength (up to 18 nT), and of the dy-namic pressure (up to 8 nPa), followed by a decline of theseparameters down to their nominal values at the end of theCIR encounter, on 7 August 2007 at 0830 UT. CIRs are in-deed characterized by high values of the magnetic fieldstrength, plasma density, and dynamic pressure. Inside theCIR, the solar wind bulk speed increases more graduallyto finally reach a maximum value of ~690 km s�1
(Figure 2c). After the passage of the CIR, the bulk velocityslowly decreases during several days.
[20] Figure 2e is an electron energy-time spectrogrammeasured by MEX, from 11 August 2007 (0350 UT) to14August 2007 (2332UT). The panel shows low-altitude dataintervals measured during 14 consecutive orbits (the orbit iselliptical). The estimated period of the impact of the pressurepulse is indicated by a horizontal black bar from 11 August2007 (~0930 UT) to 13 August 2007 (~2300 UT) by visualidentification. Indeed, the electron distribution is hotter andthe flux more intense during this period compared to theperiods before and after the CIR passage. The times of thetwo precipitation events previously discussed are markedby arrows. The proton event on 11 August 2007 occurredduring the quiet upstream conditions which preceded theimpact of the CIR front at Mars. The He2+ event occurredon 13 August 2007 when the upstream conditions were stilldisturbed at the end of the passage of the CIR.[21] Next, we compare the H+ and He2+ precipitation events
during the two regimes of upstream conditions. Figure 3shows the IMA data coverage (that is the number of IMAscans) below the local dayside PEB, in the XMSO-RMSO plane,
B [n
T]
ACE IMF strength
0
10
20
Den
sity
[cm
−3]
ACE Solar wind H+ density
0
10
20
30
Vel
ocity
[km
s−1]
ACE Solar wind H+ bulk velocity
0200400600
Pre
ssur
e[n
Pa]
ACE Solar wind dynamic pressure
08/07 08/08
0
5
10
Time [UT]
ME
X/E
LSe− e
nerg
y [e
V]
08/12 08/13 08/14
101
102
103
9
10
11
[eV
/cm
2 /s/
sr/k
eV]
All
sect
ors
Log10
b
d
e
c
a
Figure 2. Time series of ACE data. (a) IMF strength. (b) Solar wind proton density. The densityuntil 6 August 2007 at 1100 UT is poorly determined and is not shown. (c) Solar wind proton bulkvelocity. (d) Solar wind proton dynamic pressure. The period of the CIR encounter with ACE isindicated by the yellow shading, from 6 August 2007 (0400 UT) to 7 August 2007 (0830 UT).(e) Electron energy-time spectrogram (averaged over all sectors) observed by MEX. The white ver-tical bands are data gaps corresponding to no data taking when the spacecraft is sufficiently far awayfrom the Martian bow shock. The estimated period of the CIR encounter with Mars is indicated by ahorizontal black bar, from 11 August 2007 (~0930 UT) to 13 August 2007 (~2300 UT). The timesof the two precipitation events previously discussed are indicated by arrows.
DIÉVAL ET AL.: SOLAR WIND ION PRECIPITATION AT MARS
3424

for the proton study. Figure 3a shows the data during quietconditions, and Figure 3d shows the data during pressurepulses. The data coverage for the alpha particle study issimilar and is not shown. The ICMEs/CIRs represent22.6% of the data coverage, and the quiet upstream condi-tions represent the rest. Edberg et al. [2010] estimated thatpressure pulses impacted Mars during ~15% of the time.However, we also include pressure pulse intervals at Marswhich were not identified by the automatic selection usedby Edberg et al. [2010], thus increasing our proportion ofpressure pulse periods. Table 1 summarizes the data cover-age during both sets of solar wind conditions, for the protonand alpha particle studies.[22] As seen from Figure 3 (Figures 3a and 3d), the cover-
age below the PEB is best at low altitudes around the termi-nator. The blue pixels above the IMB model of Dubininet al. [2006] (the magenta curve in the figure) indicate thatthe spacecraft sometimes samples the ionosphere at altitudesabove the model, because the altitude of the PEB changeswith varying solar wind conditions. Of the data coverage,0.3% occurs at altitudes >1900 km.[23] The spatial location of the precipitation events in the
XMSO-RMSO plane during quiet solar wind conditions isshown in the top row (Figure 3b, protons and Figure 3c, alphaparticles) and during pressure pulses in the bottom row(Figure 3e, protons and Figure 3f, alpha particles). Most of
the proton and alpha particle events are located below theposition of the IMB model, while a few events can also befound above the model, since we consider all observationsbelow the locally observed PEB, and thus IMB. The eventsare found at both low altitudes and high altitudes duringquiet external conditions. The altitude range of the eventsis restricted to low altitudes during pressure pulse encoun-ters because the induced magnetosphere is compressed.Fewer events are detected during periods of disturbedexternal conditions.
Table 1. IMA Data Coverage Below the Local PEB and ExcludingInvalid Scansa
During QuietConditions
During PressurePulses Total
Proton StudyNumber of scans 8452 2474 10,926% of scans 77.4 22.6 100.0
Alpha Particle StudyNumber of scans 8348 2466 10,814% of scans 77.2 22.8 100.0
aThe data coverage during quiet solar wind conditions and during ICMEs/CIRs passages is given separately for the H+ study and the He2+ study.
0
1000
2000
3000
4000
5000
6000
7000
Coverage below the IMB no pressure pulse
R[k
m]=
sqrt
(Y2 +
Z2 )
R[k
m]=
sqrt
(Y2 +
Z2 )
0 2000 4000 60000
1000
2000
3000
4000
5000
6000
7000
Coverage below the IMB pressure pulse
X [km]
1
1.5
2
2.5
1
1.5
2
2.5
Proton event location no pressure pulse
0 2000 4000 6000
Proton event location pressure pulse
X [km]
Alpha event location no pressure pulse
0 2000 4000 6000
Alpha event location pressure pulse
X [km]
a b c
d e f
IMB
BS
Log10
Log10
Figure 3. The XMSO-RMSO plane. The horizontal axis is the distance along the Mars Sun line. Thevertical axis is the distance RMSO ¼
ffiffiffiffiffiffiffiffiffiffiffiffiffiffiffiffiffiffiffiffiffiffiffiffiffiffiffiffiffiffiffiffiYMSO
2 þ ZMSO2
pfrom the Mars Sun line. The spatial bin size is
200 km × 200 km. The red solid curve, the black solid curve, and the magenta solid curve indicate Mars, thebow shock model of Vignes et al. [2000], and the IMB model of Dubinin et al. [2006], respectively. The reddashed curve shows the altitude limit of 2000km belowwhich data were considered. (top) Periods of quiet solarwind. (bottom) Periods during solar wind pressure pulses. (a and d) Data coverage below the PEB, excludinginvalid scans. The color bar indicates the number of IMA scans obtained in each spatial bin. (b, e, c, and f)Location of the precipitation events indicated by plus symbols.
DIÉVAL ET AL.: SOLAR WIND ION PRECIPITATION AT MARS
3425
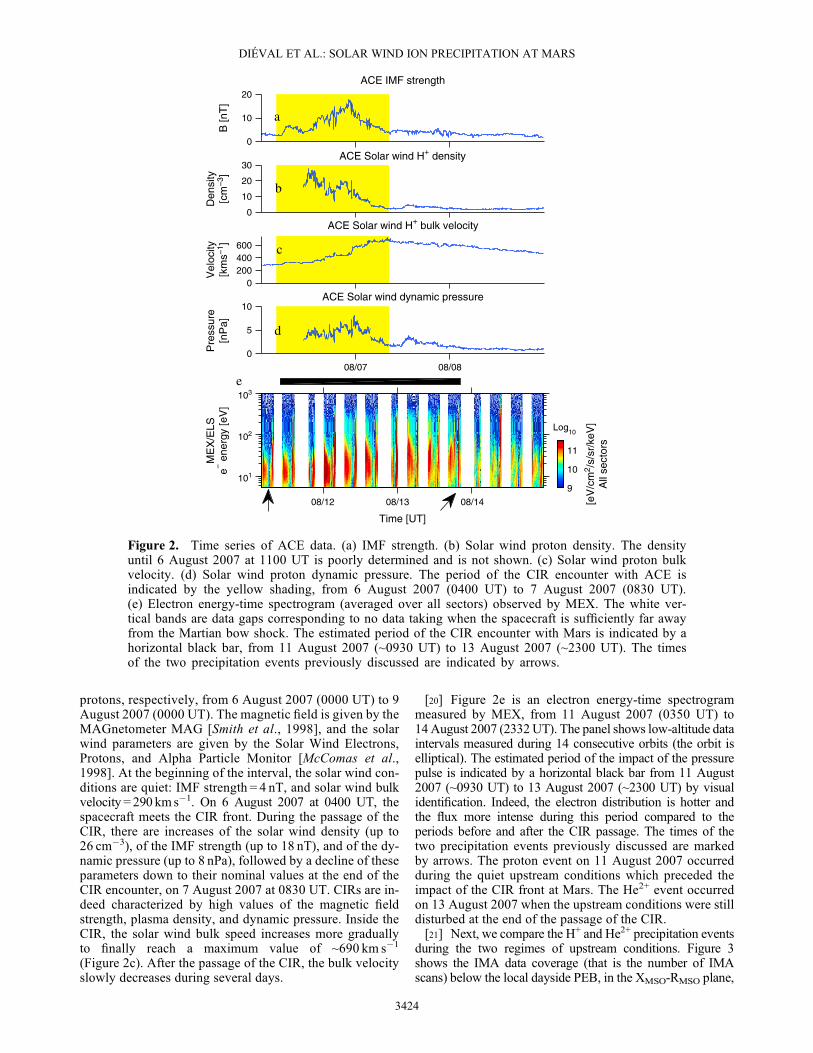
[24] We have examined the distribution of downward par-ticle fluxes for the proton events and for the alpha particleevents, comparing periods of quiet external conditions withperiods of disturbed external conditions. Figure 4 shows his-tograms of the particle flux for the proton events (Figure 4a)and for the alpha particle events (Figure 4b). The black-shaded distribution corresponds to the quiet upstream condi-tions, and the gray-shaded distribution corresponds to theCIR/ICME passages.[25] Figure 4a shows that the shape of the distribution of
fluxes of the proton precipitation events is similar duringquiet external conditions and during pressure pulses, bothranging from 104 to 106 cm�2 s�1, although the statisticsare poorer in the case of the pressure pulse periods due to
the small number of events. During quiet and disturbed up-stream conditions, the median values of the proton event fluxare 1.2 · 105 cm�2 s�1 and 8.6 · 104 cm�2 s�1, respectively.Figure 4b in Figure 4 shows that the distributions of thefluxes of the alpha particle events have a similar shape duringquiet external conditions and during pressure pulses, andboth range from 103 cm�2 s�1 to 106 cm�2 s�1. The statisticsare again poorer in the case of the pressure pulse periods.During quiet and disturbed upstream conditions, the medianvalues of the alpha particle event flux are 8.8 · 104 cm�2 s�1
and 4.3 · 104 cm�2 s�1, respectively.[26] We have used a Student's t test (assuming unequal and
unknown variances) to compare the two distributions (eventfluxes during quiet periods and disturbed periods) for boththe proton study and the alpha particle study. The test showsno significant difference between the two distributions (theprobability p value is 0.7 for the proton study and 0.06 forthe alpha particle study). We conclude that the H+ and He2+
event fluxes do not increase during solar wind disturbances.[27] We also calculate the occurrence frequency of
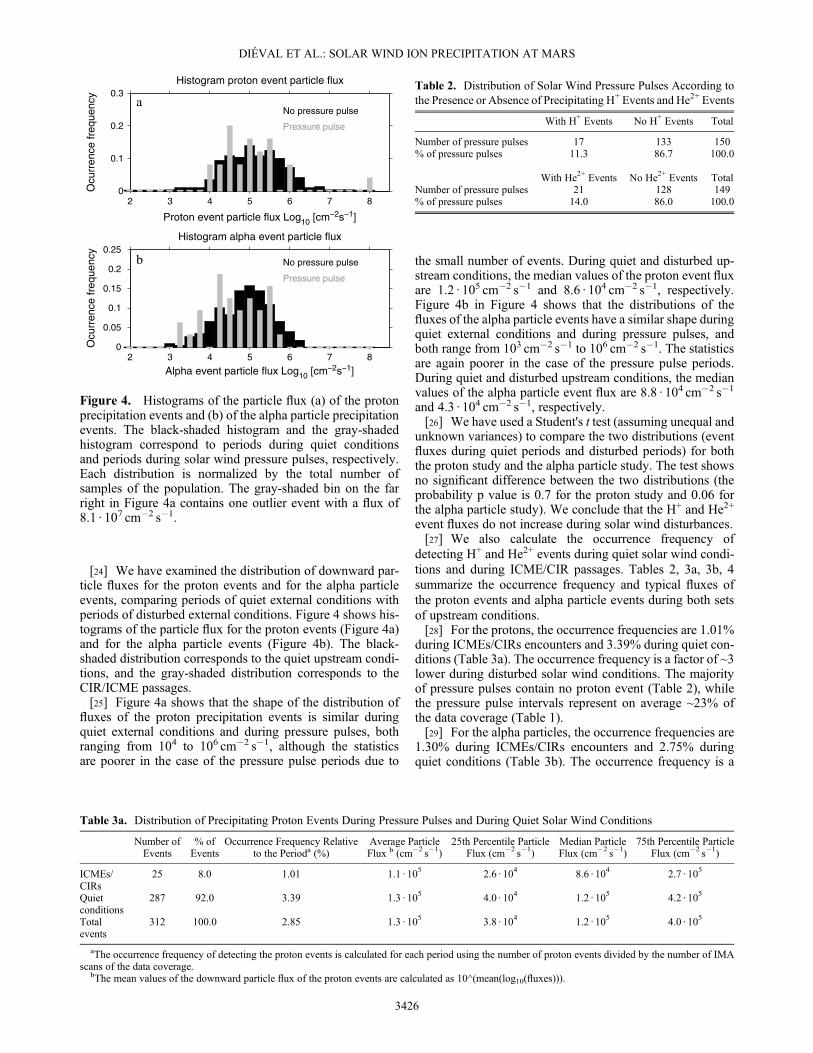
detecting H+ and He2+ events during quiet solar wind condi-tions and during ICME/CIR passages. Tables 2, 3a, 3b, 4summarize the occurrence frequency and typical fluxes ofthe proton events and alpha particle events during both setsof upstream conditions.[28] For the protons, the occurrence frequencies are 1.01%
during ICMEs/CIRs encounters and 3.39% during quiet con-ditions (Table 3a). The occurrence frequency is a factor of ~3lower during disturbed solar wind conditions. The majorityof pressure pulses contain no proton event (Table 2), whilethe pressure pulse intervals represent on average ~23% ofthe data coverage (Table 1).[29] For the alpha particles, the occurrence frequencies are
1.30% during ICMEs/CIRs encounters and 2.75% duringquiet conditions (Table 3b). The occurrence frequency is a
Table 2. Distribution of Solar Wind Pressure Pulses According tothe Presence or Absence of Precipitating H+ Events and He2+ Events
With H+ Events No H+ Events Total
Number of pressure pulses 17 133 150% of pressure pulses 11.3 86.7 100.0
With He2+ Events No He2+ Events TotalNumber of pressure pulses 21 128 149% of pressure pulses 14.0 86.0 100.0
Table 3a. Distribution of Precipitating Proton Events During Pressure Pulses and During Quiet Solar Wind Conditions
Number ofEvents
% ofEvents
Occurrence Frequency Relativeto the Perioda (%)
Average ParticleFlux b (cm�2 s�1)
25th Percentile ParticleFlux (cm�2 s�1)
Median ParticleFlux (cm�2 s�1)
75th Percentile ParticleFlux (cm�2 s�1)
ICMEs/CIRs
25 8.0 1.01 1.1 · 105 2.6 · 104 8.6 · 104 2.7 · 105
Quietconditions
287 92.0 3.39 1.3 · 105 4.0 · 104 1.2 · 105 4.2 · 105
Totalevents
312 100.0 2.85 1.3 · 105 3.8 · 104 1.2 · 105 4.0 · 105
aThe occurrence frequency of detecting the proton events is calculated for each period using the number of proton events divided by the number of IMAscans of the data coverage.
bThe mean values of the downward particle flux of the proton events are calculated as 10^(mean(log10(fluxes))).
2 3 4 5 6 7 80
0.1
0.2
0.3O
curr
ence
freq
uenc
yHistogram proton event particle flux
Proton event particle flux Log10 [cm−2s−1]
2 3 4 5 6 7 80
0.05
0.1
0.15
0.2
0.25
Ocu
rren
ce fr
eque
ncy
Histogram alpha event particle flux
Alpha event particle flux Log10 [cm−2s−1]
a
b No pressure pulse
Pressure pulse
No pressure pulse
Pressure pulse
Figure 4. Histograms of the particle flux (a) of the protonprecipitation events and (b) of the alpha particle precipitationevents. The black-shaded histogram and the gray-shadedhistogram correspond to periods during quiet conditionsand periods during solar wind pressure pulses, respectively.Each distribution is normalized by the total number ofsamples of the population. The gray-shaded bin on the farright in Figure 4a contains one outlier event with a flux of8.1 · 107 cm�2 s�1.
DIÉVAL ET AL.: SOLAR WIND ION PRECIPITATION AT MARS
3426
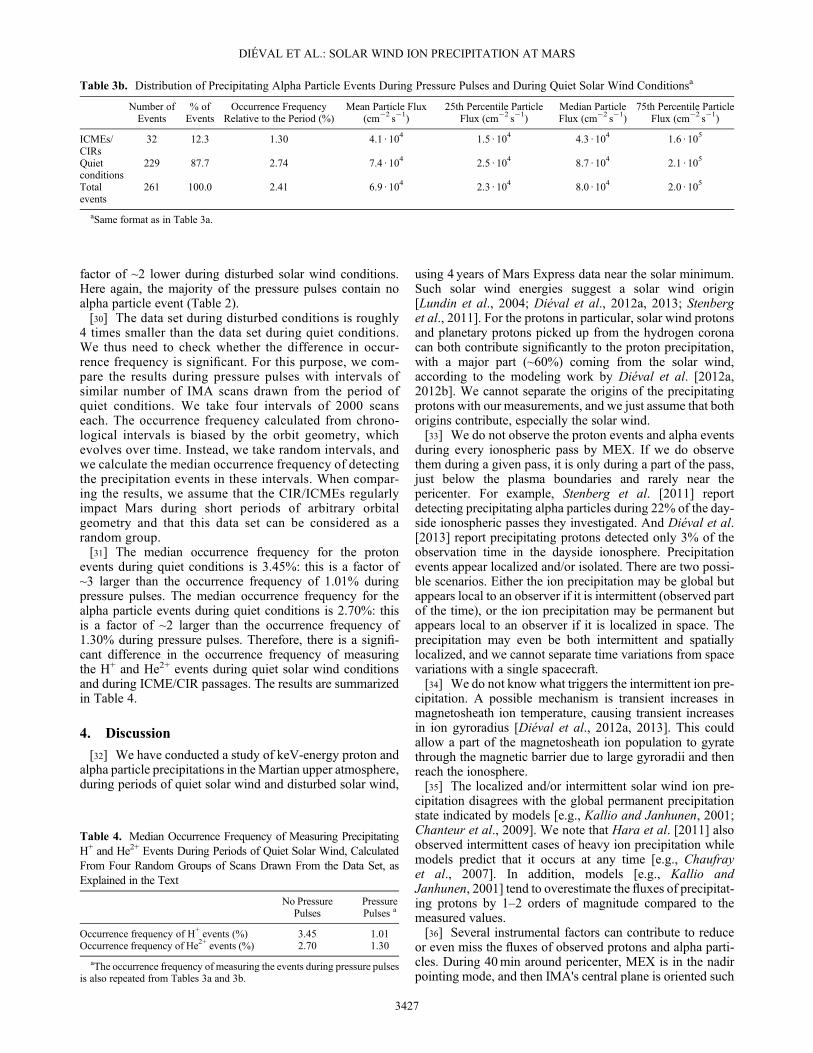
factor of ~2 lower during disturbed solar wind conditions.Here again, the majority of the pressure pulses contain noalpha particle event (Table 2).[30] The data set during disturbed conditions is roughly
4 times smaller than the data set during quiet conditions.We thus need to check whether the difference in occur-rence frequency is significant. For this purpose, we com-pare the results during pressure pulses with intervals ofsimilar number of IMA scans drawn from the period ofquiet conditions. We take four intervals of 2000 scanseach. The occurrence frequency calculated from chrono-logical intervals is biased by the orbit geometry, whichevolves over time. Instead, we take random intervals, andwe calculate the median occurrence frequency of detectingthe precipitation events in these intervals. When compar-ing the results, we assume that the CIR/ICMEs regularlyimpact Mars during short periods of arbitrary orbitalgeometry and that this data set can be considered as arandom group.[31] The median occurrence frequency for the proton
events during quiet conditions is 3.45%: this is a factor of~3 larger than the occurrence frequency of 1.01% duringpressure pulses. The median occurrence frequency for thealpha particle events during quiet conditions is 2.70%: thisis a factor of ~2 larger than the occurrence frequency of1.30% during pressure pulses. Therefore, there is a signifi-cant difference in the occurrence frequency of measuringthe H+ and He2+ events during quiet solar wind conditionsand during ICME/CIR passages. The results are summarizedin Table 4.
4. Discussion
[32] We have conducted a study of keV-energy proton andalpha particle precipitations in theMartian upper atmosphere,during periods of quiet solar wind and disturbed solar wind,
using 4 years of Mars Express data near the solar minimum.Such solar wind energies suggest a solar wind origin[Lundin et al., 2004; Diéval et al., 2012a, 2013; Stenberget al., 2011]. For the protons in particular, solar wind protonsand planetary protons picked up from the hydrogen coronacan both contribute significantly to the proton precipitation,with a major part (~60%) coming from the solar wind,according to the modeling work by Diéval et al. [2012a,2012b]. We cannot separate the origins of the precipitatingprotons with our measurements, and we just assume that bothorigins contribute, especially the solar wind.[33] We do not observe the proton events and alpha events
during every ionospheric pass by MEX. If we do observethem during a given pass, it is only during a part of the pass,just below the plasma boundaries and rarely near thepericenter. For example, Stenberg et al. [2011] reportdetecting precipitating alpha particles during 22% of the day-side ionospheric passes they investigated. And Diéval et al.[2013] report precipitating protons detected only 3% of theobservation time in the dayside ionosphere. Precipitationevents appear localized and/or isolated. There are two possi-ble scenarios. Either the ion precipitation may be global butappears local to an observer if it is intermittent (observed partof the time), or the ion precipitation may be permanent butappears local to an observer if it is localized in space. Theprecipitation may even be both intermittent and spatiallylocalized, and we cannot separate time variations from spacevariations with a single spacecraft.[34] We do not know what triggers the intermittent ion pre-
cipitation. A possible mechanism is transient increases inmagnetosheath ion temperature, causing transient increasesin ion gyroradius [Diéval et al., 2012a, 2013]. This couldallow a part of the magnetosheath ion population to gyratethrough the magnetic barrier due to large gyroradii and thenreach the ionosphere.[35] The localized and/or intermittent solar wind ion pre-
cipitation disagrees with the global permanent precipitationstate indicated by models [e.g., Kallio and Janhunen, 2001;Chanteur et al., 2009]. We note that Hara et al. [2011] alsoobserved intermittent cases of heavy ion precipitation whilemodels predict that it occurs at any time [e.g., Chaufrayet al., 2007]. In addition, models [e.g., Kallio andJanhunen, 2001] tend to overestimate the fluxes of precipitat-ing protons by 1–2 orders of magnitude compared to themeasured values.[36] Several instrumental factors can contribute to reduce
or even miss the fluxes of observed protons and alpha parti-cles. During 40min around pericenter, MEX is in the nadirpointing mode, and then IMA's central plane is oriented such
Table 3b. Distribution of Precipitating Alpha Particle Events During Pressure Pulses and During Quiet Solar Wind Conditionsa
Number ofEvents
% ofEvents
Occurrence FrequencyRelative to the Period (%)
Mean Particle Flux(cm�2 s�1)
25th Percentile ParticleFlux (cm�2 s�1)
Median ParticleFlux (cm�2 s�1)
75th Percentile ParticleFlux (cm�2 s�1)
ICMEs/CIRs
32 12.3 1.30 4.1 · 104 1.5 · 104 4.3 · 104 1.6 · 105
Quietconditions
229 87.7 2.74 7.4 · 104 2.5 · 104 8.7 · 104 2.1 · 105
Totalevents
261 100.0 2.41 6.9 · 104 2.3 · 104 8.0 · 104 2.0 · 105
aSame format as in Table 3a.
Table 4. Median Occurrence Frequency of Measuring PrecipitatingH+ and He2+ Events During Periods of Quiet Solar Wind, CalculatedFrom Four Random Groups of Scans Drawn From the Data Set, asExplained in the Text
No PressurePulses
PressurePulses a
Occurrence frequency of H+ events (%) 3.45 1.01Occurrence frequency of He2+ events (%) 2.70 1.30
aThe occurrence frequency of measuring the events during pressure pulsesis also repeated from Tables 3a and 3b.
DIÉVAL ET AL.: SOLAR WIND ION PRECIPITATION AT MARS
3427

that it can measure upgoing and downgoing ions. However,the field of view is not 4π, and this can contribute tounderestimating ion fluxes. On the other hand, Diéval et al.[2012a] report rather broad angular distributions for protonsobserved in the Martian ionosphere (several IMA angularsectors), so it is unlikely to miss events of proton precipita-tion due to this limitation. In addition, for proton measure-ments, the instrumental energy threshold prevents thedetection of protons with energies <700 eV (most favorablecase, when IMA is run in the highest postacceleration volt-age), and this may lead to underestimate the fluxes or evento miss proton events in some cases. However, the observedproton events have mean energies of typically 1–2 keV[Diéval et al., 2013], and in this case, the maximum in fluxis at energies above the energy threshold of 700 eV. Inaddition, the relatively high background level of IMA mayhide weak ion signals and prevent their detection. A numberof potential precipitation events were also discarded in thisstudy due to severe contamination by ultraviolet radiation orby other ion species. Finally, a single spacecraft performingin situ measurements can be only at a certain place at acertain time and may miss precipitation events if they arelocalized in space.[37] On the other hand, the hybrid models have also their
limitations. The large grid cells prevent an accurate descrip-tion of the near-Mars environment, and localized ion precip-itation zones may not be resolved. Furthermore, the time-stationary inputs to the simulations do not allow reproducingtime-dependent phenomena such as the intermittent ion pre-cipitation. Finally, models lack an accurate description ofthe atmosphere/ionosphere; for example, they may use aspherical conductive ionosphere without implementingchemical reactions. In the case of the model of Brecht[1997], there is even no atmosphere/ionosphere included.The models produce more ion precipitation than they should.We think that solving the discrepancies between models andmeasurements will come in great part from the improvementof current models.[38] The occurrence frequency of detecting the precipitating
solar wind ions is significantly lower during pressure pulsesthan during quiet conditions. Although the magnetosheath fluxis observed to be larger and to reach lower altitudes during thepassage of pressure pulses [e.g., Dubinin et al., 2009], we findthat the precipitating flux itself does not increase. This resultmeans that a smaller fraction of the upstream solar wind fluxcan precipitate under these conditions, contrary to modelers'expectations [Brecht, 1997; Harnett and Winglee, 2006], andsuggests that the magnetic barrier is a more effective obstacleto the H+ and He2+ precipitation during pressure pulses. Werecall that we take the H+ and He2+ events within the iono-sphere, clearly below the IMB. The precipitation eventswe are looking for are thus not related to the motion ofplasma boundaries but to the crossing of boundaries bysome precipitating ions.[39] The effectiveness of the magnetic barrier as an obsta-
cle to the H+ and He2+ precipitation is determined by thethickness of the magnetic barrier in terms of H+ gyroradiiand He2+ gyroradii. The thickness in terms of ion gyroradiidepends on the total magnetic flux in the magnetic barrier.If the total magnetic flux is constant in the magnetic barrier,then a thinner magnetic barrier leads to a higher magneticfield strength and to smaller ion gyroradii, but the thickness
of the obstacle in terms of ion gyroradii remains approxi-mately the same.[40] The total magnetic flux should increase with respect to
quiet upstream conditions in the magnetic barrier during apressure pulse to explain the lesser solar wind ion precipita-tion. We suggest that this is possible when the magnetosheathflow is decelerated by a stronger mass loading under theseconditions. The increased magnetic field in the magnetic bar-rier region penetrates deeper into the ionosphere (we assumeno change in the ionosphere conductivity during the pressurepulse events). Therefore, the magnetic field tubes are draggedthrough the ionosphere layers with higher ion density and,thus, get more loaded by the planetary ions, mostly O+. Thisresults in the increase of the ionospheric erosion and the totalion escape, indeed, reported by modelers [e.g., Kaneda et al.,2009] and observers [e.g., Edberg et al., 2010, 2011]. Theadditional mass of planetary ions into the solar wind causes adeceleration of the solar wind at low altitudes due to the con-servation of momentum [e.g., Dubinin et al., 2000]. The solarwind magnetic field, frozen-in into the plasma flow, takes alonger time to sweep past the planet. The IMF piles up evenmore on the dayside before it is convected to the nightside,leading to a larger total magnetic flux in the magnetic barrier.Furthermore, the IMF strength in the upstream solar wind istypically larger than usual (several tens of nT), and this alsocan contribute to increase the total magnetic flux in the mag-netic barrier. Measurements by the Mars Global Surveyororbiter indeed showed an enhanced magnetic field strengthin the magnetic barrier during solar wind disturbances [e.g.,Crider et al., 2005]. Also, models indicate that the magneticbarrier is more developed during conditions of high IMFstrength and high dynamic pressure, [e.g., McKenna-Lawloret al., 2012]. The magnetic barrier becomes a thicker obstaclein terms of solar wind ion gyroradii, and the solar windprecipitation decreases.[41] We can compare the results for the precipitation
events with the modeling results by Brecht [1997] andHarnett and Winglee [2006]. They performed simulationswith nominal and high values of solar wind density, speed,and IMF strength, and they found that the solar wind precip-itation is largest for extreme upstream conditions. Theseresults are consistent with the more frequent observationsof solar wind plasma at low altitudes reported during highdynamic pressure conditions [e.g., Brain et al., 2005].However, the models predict that the solar wind precipitationoccurs all the time and for any set of upstream conditions.The models and their stationary inputs do not reproduce theintermittent and/or localized solar wind ion precipitation asit is observed [Diéval et al., 2012a, 2013; Stenberg et al.,2011]. Furthermore, the modelers may simply consider thealtitude of the IMB as an indicator of the depth reached bythe magnetosheath plasma. In contrast, we made our analy-sis for intervals of ionosphere without magnetosheath elec-tron spikes, because we want to be sure not to include anylow-altitude magnetosheath encounters.
5. Conclusion
[42] We performed a statistical study of precipitating pro-ton and alpha particle events with ~keV energy measured inthe Martian dayside ionosphere byMars Express. We assumethat the measured proton and alpha particles come primarily
DIÉVAL ET AL.: SOLAR WIND ION PRECIPITATION AT MARS
3428
from the solar wind, although planetary proton precipitationmay still be significant according to hybrid models [Diévalet al., 2012a, 2012b]. Proton and alpha particle precipitationsare found to be intermittent and/or localized, consistent withprevious measurements [Diéval et al., 2012a, 2012b;Stenberg et al., 2011]. We found that the solar wind ion pre-cipitation is less frequent during ICME/CIR encounters: afactor of ~3 for the H+ precipitation and a factor of ~2 forthe He2+ precipitation. In addition, the precipitating flux doesnot increase during pressure pulses.[43] The total magnetic flux in the magnetic barrier deter-
mines the thickness of the magnetic barrier in terms of iongyroradii and, thus, the effectiveness of the obstacle to thesolar wind ion precipitation. We suggest that the total mag-netic flux can increase in the magnetic barrier during theimpact of a pressure pulse. This is possible since the massloading of the solar wind by planetary O+ ions is expectedto be stronger during pressure pulses, due to the penetrationof the IMF to lower altitudes. The more effective mass load-ing decelerates the solar wind flow close to Mars. This in turnincreases the pileup of the magnetic field on the dayside ofMars, and thus the total magnetic flux increases in the mag-netic barrier. The magnetic barrier becomes thicker in termsof solar wind ion gyroradii, which causes the reduction ofthe H+ and He2+ precipitation during pressure pulses.
[44] Acknowledgments. C.D. and G.S. are supported by the SwedishNational Graduate School of Space Technology of the Luleå University ofTechnology. C.D. acknowledges funding from Kungliga Vetenskapsakademien.N.J.T.E. is supported by the Swedish National Space Board. The Swedishcontribution to the ASPERA-3 experiment is supported by the SwedishNational Space Board.[45] Philippa Browning thanks the reviewer for assistance in evaluating
this paper.
ReferencesBarabash, S., et al. (2006), The Analyzer of Space Plasmas and EnergeticAtoms (ASPERA-3) for the Mars Express Mission, Space Sci. Rev.,126(1-4), 113–164, doi:10.1007/s11214-006-9124-8.
Brain, D. A., et al. (2005), Variability of the altitude of the Martian sheath,Geophys. Res. Lett., 32, L18203, doi:10.1029/2005GL023126.
Brecht, S. H. (1997), Solar wind proton deposition into theMartian atmosphere,J. Geophys. Res., 102(A6), 11287–11294, doi:10.1029/97JA00561.
Breus, T. K., et al. (1991), The solar wind interactionwithMars—Considerationof Phobos 2 mission observations of an ion composition boundary on thedayside, J. Geophys. Res., 96, 11,165–11,174, doi:10.1029/91JA01131.
Chanteur, G.M., et al. (2009), Capture of solar wind alpha particles in theMartianatmosphere, Geophys. Res. Lett., 36, L23105, doi:10.1029/2009GL040235.
Chaufray, J. Y., et al. (2007), Mars solar wind interaction: Formation of theMartian corona and atmospheric loss to space, J. Geophys. Res., 112,E09009, doi:10.1029/2007JE002915.
Crider, D. H., et al. (2005), Mars global surveyor observations of theHalloween 2003 solar superstorm's encounter with Mars, J. Geophys.Res., 110, A09251, doi:10.1029/2004JA010.881.
Diéval, C., et al. (2012a), A case study of proton precipitation at Mars: MarsExpress observations and hybrid simulations, J. Geophys. Res., 117,A06222, doi:10.1029/2012JA017537.
Diéval, C., et al. (2012b), Hybrid simulations of proton precipitation patternsonto the upper atmosphere of Mars, Earth Planets Space, 64, 121–134,doi:10.5047/eps.2011.08.015.
Diéval, C., et al. (2013), A statistical study of proton precipitation onto theMartian upper atmosphere: Mars Express observations, J. Geophys. Res.,118, doi:10.1002/jgra.50229, in press.
Dubinin, E., et al. (2000),Multi-instrument study of the upstream region nearMars: The Phobos 2 observations, J. Geophys. Res., 105, 7557–7572,doi:10.1029/1999JA900400.
Dubinin, E., et al. (2006), Plasma morphology at Mars. Aspera-3 observa-tions, Space Sci. Rev., 126, 209–238, doi:10.1007/s.11214-006-9039-4.
Dubinin, E., et al. (2008), Structure and dynamics of the solar wind/iono-sphere interface on Mars: MEX-ASPERA-3 and MEX-MARSIS observa-tions, Geophys. Res. Lett., 35, L11103, doi:10.1029/2008GL033730.
Dubinin, E., et al. (2009), Ionospheric storms on Mars: Impact of thecorotating interaction region, Geophys. Res. Lett., 36, L01105, doi:10.1029/2008GL036559.
Edberg, N. J. T., et al. (2010), Pumping out the atmosphere of Mars throughsolar wind pressure pulses, Geophys. Res. Lett., 37, L03107, doi:10.1029/2009GL041814.
Edberg, N. J. T., et al. (2011), Atmospheric erosion of Venus duringstormy space weather, J. Geophys. Res., 116, A09308, doi:10.1029/2011JA016749.
Fang, X., et al. (2010), Escape probability of Martian atmospheric ions:Controlling effects of the electromagnetic fields, J. Geophys. Res.,115(A4), A04308, doi:10.1029/2009JA014929.
Frahm, R. A., et al. (2006), Carbon dioxide photoelectron energy peaks atMars, Icarus, 182(2), 371–382, doi:10.1016/j.icarus.2006.01.014.
Hara, T., et al. (2011), Heavy-ion flux enhancement in the vicinity of theMartian ionosphere during CIR passage: Mars Express ASPERA-3 obser-vations, J. Geophys. Res., 116, A02309, doi:10.1029/2010JA015778.
Harnett, E. M., and R.M.Winglee (2006), Three dimensional multifluid sim-ulations of ionospheric loss at Mars from nominal solar wind conditions tomagnetic cloud events, J. Geophys. Res., 111, A09213, doi:10.1029/2006JA011724.
Hundhausen, A. J. (1972),Coronal Expansion and Solar Wind, Phys. Chem.Space, vol. 5, Springer, New York.
Jian, L., et al. (2006), Properties of coronal mass ejections at one AUduring 1995–2004, Sol. Phys., 239, 393–436, doi:10.1007/s11207-006-0133-2.
Kallio, E., and P. Janhunen (2001), Atmospheric effects of proton precip-itation in the Martian atmosphere and its connection to the Mars-solarwind interaction, J. Geophys. Res., 106, 5617–5634, doi:10.1029/2000JA239.
Kaneda, K., et al. (2009), Solar wind control of the hot oxygen coronaaroundMars, J. Geophys. Res., 114, E02007, doi:10.1029/2008JE003234.
Lundin, R., et al. (2004), Solar wind-induced atmospheric erosion at Mars:First results from ASPERA-3 on Mars Express, Science, 305(5692),1933–1936, doi:10.1126/science.1101860.
McComas, D., et al. (1998), Solar Wind Electron Proton Alpha ParticleMonitor (SWEPAM), Space Sci. Rev., 86(1-4), 563–612, doi:10.1023/A:1005040232597.
McKenna-Lawlor, S., et al. (2012), Magnetic shadowing of high energy ionsat Mars and how this effect can be simulated using a hybrid model, EarthPlanets Space, 64, 247–256, doi:10.5047/eps.2011.06.039.
Mitchell, D. L., et al. (2001), Probing Mars' crustal magnetic field andionosphere with the MGS electron reflectometer, J. Geophys. Res., 106,23,419–23,427, doi:10.1029/2000JE001435.
Nilsson, H. et al. (2011), Heavy ion escape fromMars, influence from solarwind conditions and crustal magnetic fields, Icarus, 215, 475–484,doi:10.1016/j.icarus.2011.08.003.
Shematovich, V. I., et al. (2011), Protons and hydrogen atoms transport inthe Martian upper atmosphere with an induced magnetic field,J. Geophys. Res., 116, A11320, doi:10.1029/2011JA017007.
Shematovich, V. I., et al. (2013), He2+ transport in the Martian upper atmo-sphere with an induced magnetic field, J. Geophys. Res. Space Physics,118(3), 1231–1242, doi:10.1002/jgra.50184.
Smith, C. W., et al. (1998), The ACE magnetic fields experiment, Space Sci.Rev., 86(1-4), 613–632, doi:10.1023/A:1005092216668.
Stenberg, G., et al. (2011), Observational evidence of alpha particle captureat Mars, Geophys. Res. Lett., 38, L09101, doi:10.1029/2011GL047155.
Vennerstrom, S., et al. (2003), The magnetic field in the pile-up region ofMars, and its variation with the solar wind, Geophys. Res. Lett., 30(7),1369, doi:10.1029/2003GL016883.
Vignes, D., et al. (2000), The solar wind interaction with Mars: Locationsand shapes of the Bow Shock and the magnetic pileup boundary fromthe observations of the MAG/ER experiment onboard Mars GlobalSurveyor, Geophys. Res. Lett., 27, 49–52, doi:10.1029/1999GL010703.
DIÉVAL ET AL.: SOLAR WIND ION PRECIPITATION AT MARS
3429