reduced european emissions of s and n – effects on air concentrations, deposition and soil water...
TRANSCRIPT
lable at ScienceDirect
Environmental Pollution 159 (2011) 3571e3582
Contents lists avai
Environmental Pollution
journal homepage: www.elsevier .com/locate/envpol
Reduced European emissions of S and N e Effects on air concentrations,deposition and soil water chemistry in Swedish forests
Gunilla Pihl Karlsson a,*, Cecilia Akselsson b, Sofie Hellsten a, Per Erik Karlsson a
a IVL Swedish Environmental Research Institute, Box 5302, SE-400 14 Gothenburg, SwedenbDepartment of Earth and Ecosystem Sciences, Lund University, Sölvegatan 12, SE-223 62 Lund, Sweden
a r t i c l e i n f o
Article history:Received 30 March 2011Received in revised form15 July 2011Accepted 1 August 2011
Keywords:AcidificationNitrogen leachingRecoveryForestSwedish Throughfall Monitoring Network(SWETHRO)
* Corresponding author.E-mail addresses: [email protected] (G. Pih
nateko.lu.se (C. Akselsson), [email protected] (S. Hel(P. E. Karlsson).
0269-7491/$ e see front matter � 2011 Elsevier Ltd.doi:10.1016/j.envpol.2011.08.007
a b s t r a c t
Changes in sulphur and nitrogen pollution in Swedish forests have been assessed in relation to Europeanemission reductions, based on measurements in the Swedish Throughfall Monitoring Network.Measurements were analysed over 20 years with a focus on the 12-year period 1996 to 2008. Airconcentrations of SO2 and NO2, have decreased. The SO4-deposition has decreased in parallel with theEuropean emission reductions. Soil water SO4-concentrations have decreased at most sites but the pH,ANC and inorganic Al-concentrations indicated acidification recovery only at some of the sites. Nochanges in the bulk deposition of inorganic nitrogen could be demonstrated. Elevated NO3-concentra-tions in the soil water occurred at irregular occasions at some southern sites. Despite considerable airpollution emission reductions in Europe, acidification recovery in Swedish forests soils is slow. Nitrogendeposition to Swedish forests continues at elevated levels that may lead to leaching of nitrate to surfacewaters.
� 2011 Elsevier Ltd. All rights reserved.
1. Introduction
Anthropogenic emissions of sulphur and nitrogen have causedacidification and eutrophication of terrestrial and aquatic ecosys-tems in Europe (Reuss and Johnson, 1986; Galloway et al., 2004).The emissions have however decreased considerably since 1990(Nyiri et al., 2009). Over the period 1990e2008, the emissionreductions reported by EMEP for the 27 EUmember countries were73, 39 and 22% for oxidized sulphur, oxidized nitrogen and reducednitrogen, respectively. The corresponding values for emissionreductions for Sweden were 71, 49 and 8% for oxidized sulphur,oxidized nitrogen and reduced nitrogen, respectively.
The emission reductions have improved the situation to someextent e.g. in streams and lakes in Sweden (Skjelvåle et al., 2001;Fölster and Wilander, 2002). But the recovery is often slow andmodel simulations show that a full recovery is far away in the futurein many regions, where the soils have been depleted of base cations(Sverdrup et al., 2005). Continuous evaluations of effects of thereduced emissions on air pollutant concentrations, on deposition tothe forests and on soil and soil water chemistry are necessary in
l Karlsson), cecilia.akselsson@lsten), [email protected]
All rights reserved.
order to assess whether or not the emission reductions are largeenough to allow for sufficient ecosystem recovery.
The Swedish Throughfall Monitoring (SWETHRO) networkstarted in 1985, with the aim to measure air concentrations, depo-sition and soil water chemistry inmanaged forest ecosystems acrossSweden. Themeasurements started in southern Sweden, where theacidification problems were largest, but the network has expandedand today measurements are carried out across the entire country.Evaluation of data for the period 1985e1994 has shown a gradientwith the highest S and N deposition in the south-western part ofSweden (Hallgren Larsson et al., 1995). Furthermore, there wasa temporal trend with decreasing sulphur deposition during thisperiod.
In this article, air concentrations, deposition and soil waterchemistry were evaluated with respect to trends over time andgeographical gradients for the different monitoring sites within theSWETHRO network. Focus was on the period of October 1996eSeptember 2008, for which continuous time series of measure-ments are available for more than 50 sites for throughfall and soilwater chemistry, covering the entire country. Results are alsoshown from a few long time series in southern Sweden, starting inthe late ‘80s or early ‘90s. The changes in air concentrations anddeposition to Swedish forests are compared to the reported Euro-pean emission reductions and discussed in relation to the progressof recovery of soil water chemistry.
G. Pihl Karlsson et al. / Environmental Pollution 159 (2011) 3571e35823572
2. Materials and methods
2.1. Sites and measurements
The SWETHRO network is financed by regional air quality protection associa-tions and local county administrative boards. They decide what to measure andwhen, in collaboration with the SWETHRO scientists. As a result, the measurementsat different monitoring sites cover different time periods.
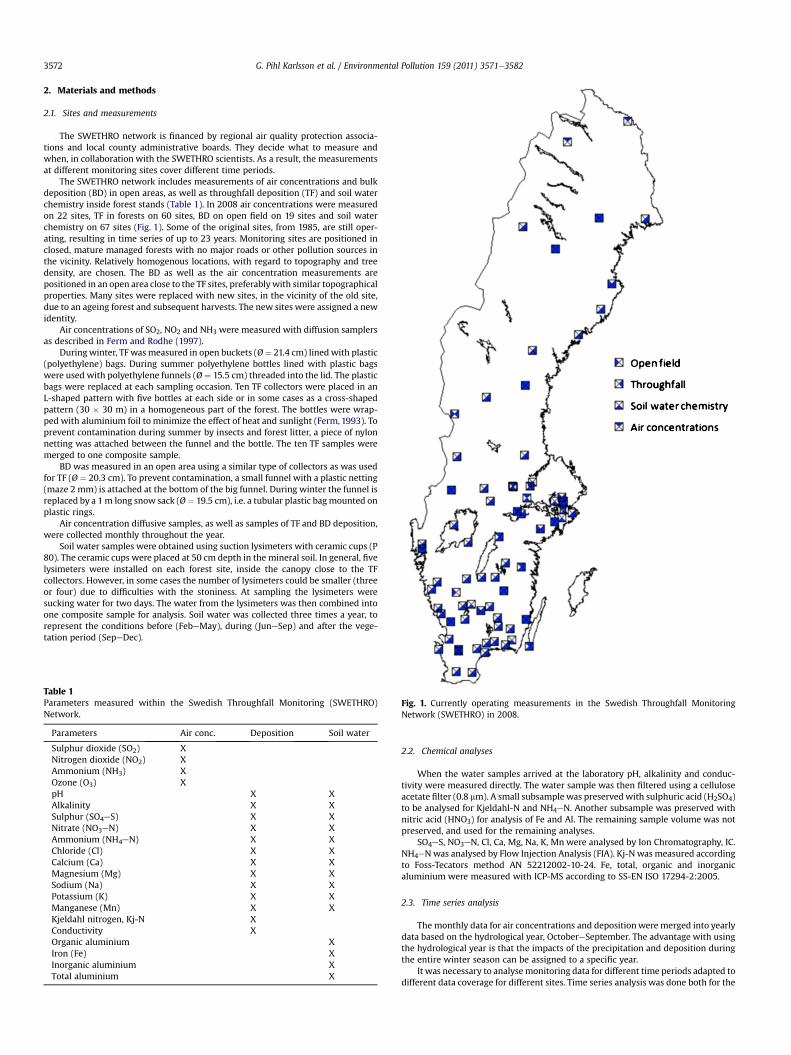
The SWETHRO network includes measurements of air concentrations and bulkdeposition (BD) in open areas, as well as throughfall deposition (TF) and soil waterchemistry inside forest stands (Table 1). In 2008 air concentrations were measuredon 22 sites, TF in forests on 60 sites, BD on open field on 19 sites and soil waterchemistry on 67 sites (Fig. 1). Some of the original sites, from 1985, are still oper-ating, resulting in time series of up to 23 years. Monitoring sites are positioned inclosed, mature managed forests with no major roads or other pollution sources inthe vicinity. Relatively homogenous locations, with regard to topography and treedensity, are chosen. The BD as well as the air concentration measurements arepositioned in an open area close to the TF sites, preferablywith similar topographicalproperties. Many sites were replaced with new sites, in the vicinity of the old site,due to an ageing forest and subsequent harvests. The new sites were assigned a newidentity.
Air concentrations of SO2, NO2 and NH3 were measured with diffusion samplersas described in Ferm and Rodhe (1997).
During winter, TF was measured in open buckets (ؼ 21.4 cm) lined with plastic(polyethylene) bags. During summer polyethylene bottles lined with plastic bagswere used with polyethylene funnels (ؼ 15.5 cm) threaded into the lid. The plasticbags were replaced at each sampling occasion. Ten TF collectors were placed in anL-shaped pattern with five bottles at each side or in some cases as a cross-shapedpattern (30 � 30 m) in a homogeneous part of the forest. The bottles were wrap-ped with aluminium foil to minimize the effect of heat and sunlight (Ferm, 1993). Toprevent contamination during summer by insects and forest litter, a piece of nylonnetting was attached between the funnel and the bottle. The ten TF samples weremerged to one composite sample.
BD was measured in an open area using a similar type of collectors as was usedfor TF (Ø ¼ 20.3 cm). To prevent contamination, a small funnel with a plastic netting(maze 2 mm) is attached at the bottom of the big funnel. During winter the funnel isreplaced by a 1m long snow sack (ؼ 19.5 cm), i.e. a tubular plastic bagmounted onplastic rings.
Air concentration diffusive samples, as well as samples of TF and BD deposition,were collected monthly throughout the year.
Soil water samples were obtained using suction lysimeters with ceramic cups (P80). The ceramic cups were placed at 50 cm depth in the mineral soil. In general, fivelysimeters were installed on each forest site, inside the canopy close to the TFcollectors. However, in some cases the number of lysimeters could be smaller (threeor four) due to difficulties with the stoniness. At sampling the lysimeters weresucking water for two days. The water from the lysimeters was then combined intoone composite sample for analysis. Soil water was collected three times a year, torepresent the conditions before (FebeMay), during (JuneSep) and after the vege-tation period (SepeDec).
Table 1Parameters measured within the Swedish Throughfall Monitoring (SWETHRO)Network.
Parameters Air conc. Deposition Soil water
Sulphur dioxide (SO2) XNitrogen dioxide (NO2) XAmmonium (NH3) XOzone (O3) XpH X XAlkalinity X XSulphur (SO4eS) X XNitrate (NO3eN) X XAmmonium (NH4eN) X XChloride (Cl) X XCalcium (Ca) X XMagnesium (Mg) X XSodium (Na) X XPotassium (K) X XManganese (Mn) X XKjeldahl nitrogen, Kj-N XConductivity XOrganic aluminium XIron (Fe) XInorganic aluminium XTotal aluminium X
Fig. 1. Currently operating measurements in the Swedish Throughfall MonitoringNetwork (SWETHRO) in 2008.
2.2. Chemical analyses
When the water samples arrived at the laboratory pH, alkalinity and conduc-tivity were measured directly. The water sample was then filtered using a celluloseacetate filter (0.8 mm). A small subsample was preserved with sulphuric acid (H2SO4)to be analysed for Kjeldahl-N and NH4eN. Another subsample was preserved withnitric acid (HNO3) for analysis of Fe and Al. The remaining sample volume was notpreserved, and used for the remaining analyses.
SO4eS, NO3eN, Cl, Ca, Mg, Na, K, Mn were analysed by Ion Chromatography, IC.NH4eNwas analysed by Flow Injection Analysis (FIA). Kj-N was measured accordingto Foss-Tecators method AN 52212002-10-24. Fe, total, organic and inorganicaluminium were measured with ICP-MS according to SS-EN ISO 17294-2:2005.
2.3. Time series analysis
The monthly data for air concentrations and depositionwere merged into yearlydata based on the hydrological year, OctobereSeptember. The advantage with usingthe hydrological year is that the impacts of the precipitation and deposition duringthe entire winter season can be assigned to a specific year.
It was necessary to analysemonitoring data for different time periods adapted todifferent data coverage for different sites. Time series analysis was done both for the
G. Pihl Karlsson et al. / Environmental Pollution 159 (2011) 3571e3582 3573
sites with long time series, starting around 1990 or earlier, all situated in southernSweden, and for sites with time series starting in October 1996. The latter time seriescovered the whole country and yet the time series was long enough to enable thedetection of time trends. As far as possible the same periods have been chosen for airconcentrations, deposition and soil water chemistry.
The time series were statistically analysed using the non-parametric Mann-Kendall and Seasonal-Kendall methodologies (Mann, 1945; Hirsch and Slack, 1984).Mann-Kendall was used for air concentrations and deposition trends, where annualdata were analysed, whereas Seasonal Kendall was used on soil water chemistry,where the data from each sampling occasion (three times a year) were analysed. Thechanges are referred to as statistically significant when the Mann-Kendall orSeasonal Kendall test results in a p value �0.05.
Non-marine S depositionwas calculated according to LRTAP (2004). Non-marineSO4eS ¼ Total SO4eS � (Cl � 0.0462). Cl was used instead of Na for sea saltcorrections since Na deposition measurements were lacking for some sites while Cldeposition was measured at all sites.
3. Results
3.1. Air concentrations
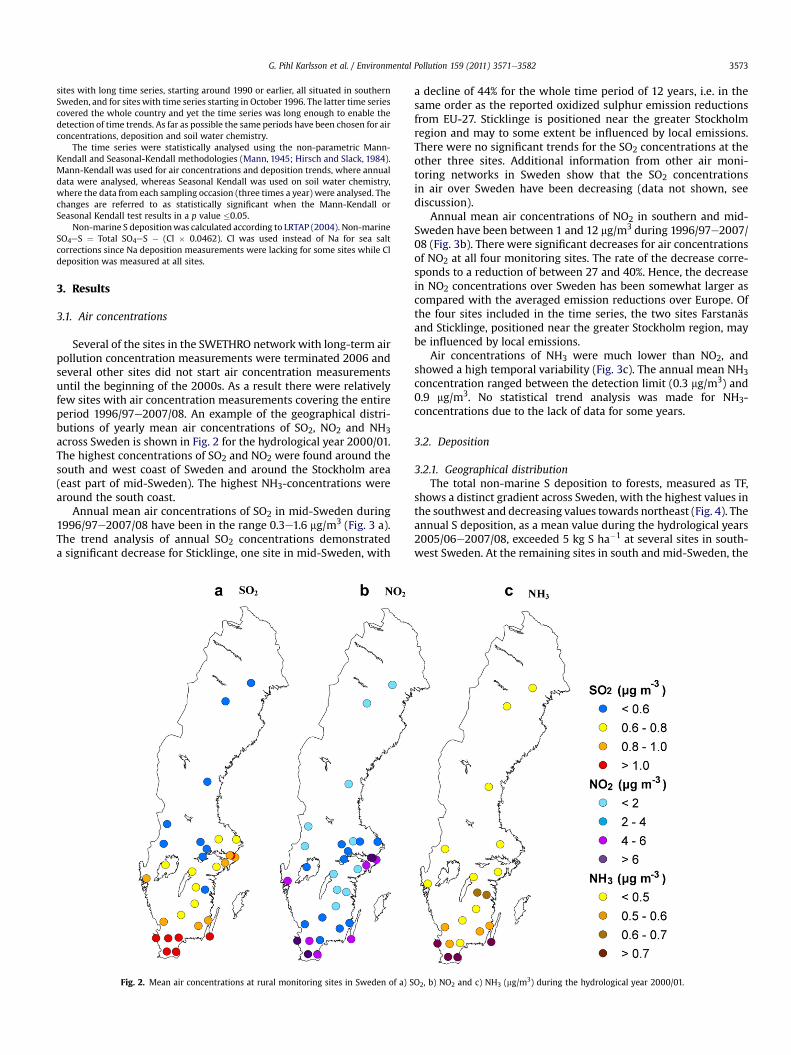
Several of the sites in the SWETHRO network with long-term airpollution concentration measurements were terminated 2006 andseveral other sites did not start air concentration measurementsuntil the beginning of the 2000s. As a result there were relativelyfew sites with air concentration measurements covering the entireperiod 1996/97e2007/08. An example of the geographical distri-butions of yearly mean air concentrations of SO2, NO2 and NH3across Sweden is shown in Fig. 2 for the hydrological year 2000/01.The highest concentrations of SO2 and NO2 were found around thesouth and west coast of Sweden and around the Stockholm area(east part of mid-Sweden). The highest NH3-concentrations werearound the south coast.
Annual mean air concentrations of SO2 in mid-Sweden during1996/97e2007/08 have been in the range 0.3e1.6 mg/m3 (Fig. 3 a).The trend analysis of annual SO2 concentrations demonstrateda significant decrease for Sticklinge, one site in mid-Sweden, with
Fig. 2. Mean air concentrations at rural monitoring sites in Sweden of a) S
a decline of 44% for the whole time period of 12 years, i.e. in thesame order as the reported oxidized sulphur emission reductionsfrom EU-27. Sticklinge is positioned near the greater Stockholmregion and may to some extent be influenced by local emissions.There were no significant trends for the SO2 concentrations at theother three sites. Additional information from other air moni-toring networks in Sweden show that the SO2 concentrationsin air over Sweden have been decreasing (data not shown, seediscussion).
Annual mean air concentrations of NO2 in southern and mid-Sweden have been between 1 and 12 mg/m3 during 1996/97e2007/08 (Fig. 3b). There were significant decreases for air concentrationsof NO2 at all four monitoring sites. The rate of the decrease corre-sponds to a reduction of between 27 and 40%. Hence, the decreasein NO2 concentrations over Sweden has been somewhat larger ascompared with the averaged emission reductions over Europe. Ofthe four sites included in the time series, the two sites Farstanäsand Sticklinge, positioned near the greater Stockholm region, maybe influenced by local emissions.
Air concentrations of NH3 were much lower than NO2, andshowed a high temporal variability (Fig. 3c). The annual mean NH3
concentration ranged between the detection limit (0.3 mg/m3) and0.9 mg/m3. No statistical trend analysis was made for NH3-concentrations due to the lack of data for some years.
3.2. Deposition
3.2.1. Geographical distributionThe total non-marine S deposition to forests, measured as TF,
shows a distinct gradient across Sweden, with the highest values inthe southwest and decreasing values towards northeast (Fig. 4). Theannual S deposition, as a mean value during the hydrological years2005/06e2007/08, exceeded 5 kg S ha�1 at several sites in south-west Sweden. At the remaining sites in south and mid-Sweden, the
O2, b) NO2 and c) NH3 (mg/m3) during the hydrological year 2000/01.
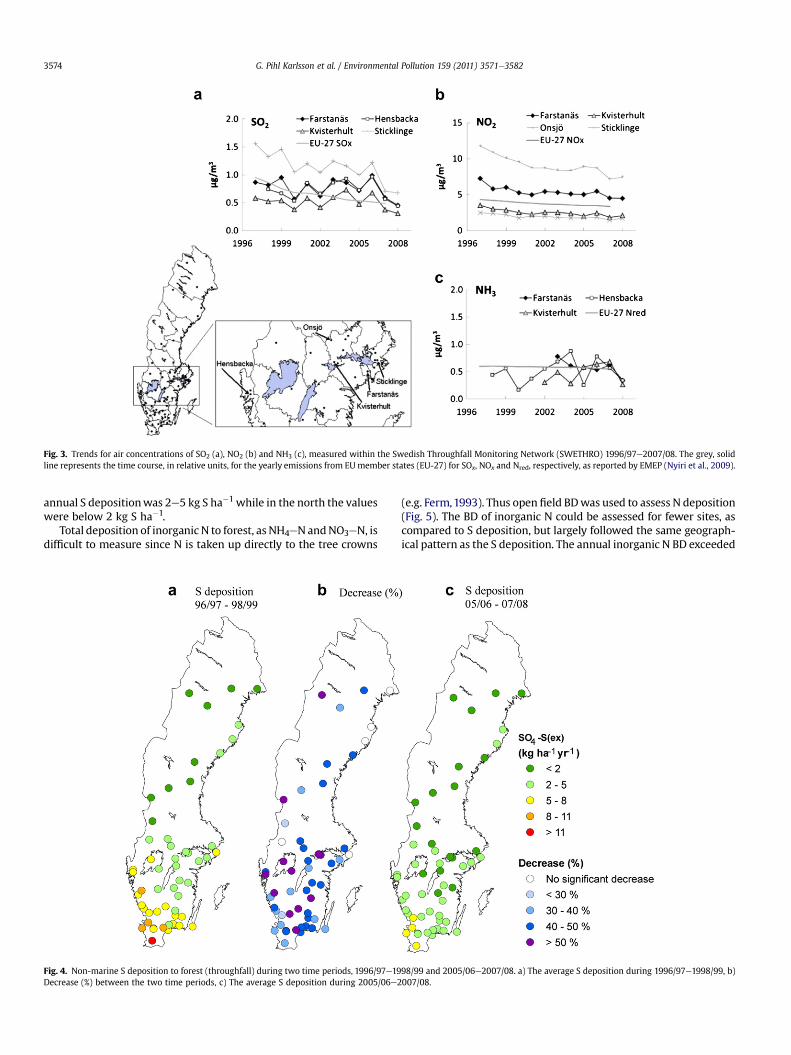
Fig. 3. Trends for air concentrations of SO2 (a), NO2 (b) and NH3 (c), measured within the Swedish Throughfall Monitoring Network (SWETHRO) 1996/97e2007/08. The grey, solidline represents the time course, in relative units, for the yearly emissions from EUmember states (EU-27) for SOx, NOx and Nred, respectively, as reported by EMEP (Nyiri et al., 2009).
G. Pihl Karlsson et al. / Environmental Pollution 159 (2011) 3571e35823574
annual S depositionwas 2e5 kg S ha�1 while in the north the valueswere below 2 kg S ha�1.
Total deposition of inorganic N to forest, as NH4eNandNO3eN, isdifficult to measure since N is taken up directly to the tree crowns
Fig. 4. Non-marine S deposition to forest (throughfall) during two time periods, 1996/97e19Decrease (%) between the two time periods, c) The average S deposition during 2005/06e2
(e.g. Ferm,1993). Thus open field BDwas used to assess N deposition(Fig. 5). The BD of inorganic N could be assessed for fewer sites, ascompared to S deposition, but largely followed the same geograph-ical pattern as the S deposition. The annual inorganic N BD exceeded
98/99 and 2005/06e2007/08. a) The average S deposition during 1996/97e1998/99, b)007/08.
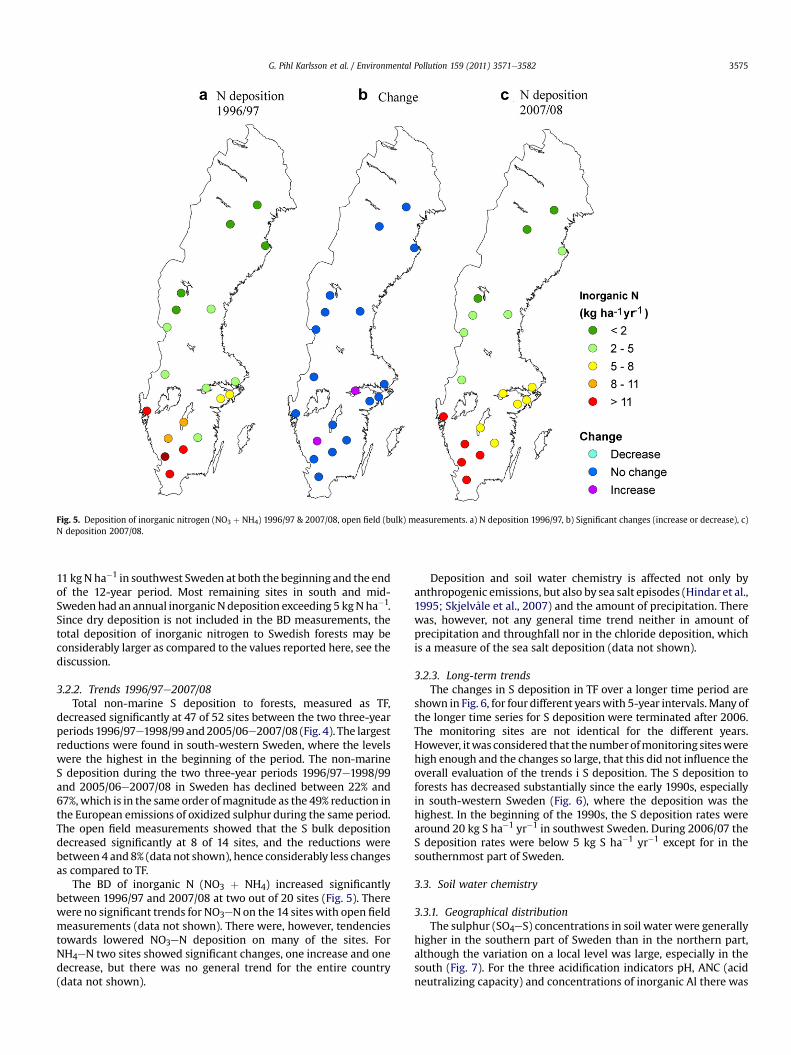
Fig. 5. Deposition of inorganic nitrogen (NO3 þ NH4) 1996/97 & 2007/08, open field (bulk) measurements. a) N deposition 1996/97, b) Significant changes (increase or decrease), c)N deposition 2007/08.
G. Pihl Karlsson et al. / Environmental Pollution 159 (2011) 3571e3582 3575
11 kgNha�1 in southwest Sweden at both the beginning and the endof the 12-year period. Most remaining sites in south and mid-Swedenhad an annual inorganic Ndeposition exceeding 5 kgNha�1.Since dry deposition is not included in the BD measurements, thetotal deposition of inorganic nitrogen to Swedish forests may beconsiderably larger as compared to the values reported here, see thediscussion.
3.2.2. Trends 1996/97e2007/08Total non-marine S deposition to forests, measured as TF,
decreased significantly at 47 of 52 sites between the two three-yearperiods 1996/97e1998/99 and2005/06e2007/08 (Fig. 4). The largestreductions were found in south-western Sweden, where the levelswere the highest in the beginning of the period. The non-marineS deposition during the two three-year periods 1996/97e1998/99and 2005/06e2007/08 in Sweden has declined between 22% and67%,which is in the same order ofmagnitude as the 49% reduction inthe European emissions of oxidized sulphur during the same period.The open field measurements showed that the S bulk depositiondecreased significantly at 8 of 14 sites, and the reductions werebetween 4 and8% (data not shown), hence considerably less changesas compared to TF.
The BD of inorganic N (NO3 þ NH4) increased significantlybetween 1996/97 and 2007/08 at two out of 20 sites (Fig. 5). Therewere no significant trends for NO3eNon the 14 siteswith open fieldmeasurements (data not shown). There were, however, tendenciestowards lowered NO3eN deposition on many of the sites. ForNH4eN two sites showed significant changes, one increase and onedecrease, but there was no general trend for the entire country(data not shown).
Deposition and soil water chemistry is affected not only byanthropogenic emissions, but also by sea salt episodes (Hindar et al.,1995; Skjelvåle et al., 2007) and the amount of precipitation. Therewas, however, not any general time trend neither in amount ofprecipitation and throughfall nor in the chloride deposition, whichis a measure of the sea salt deposition (data not shown).
3.2.3. Long-term trendsThe changes in S deposition in TF over a longer time period are
shown in Fig. 6, for four different yearswith 5-year intervals.Many ofthe longer time series for S deposition were terminated after 2006.The monitoring sites are not identical for the different years.However, itwas considered that the numberofmonitoring siteswerehigh enough and the changes so large, that this did not influence theoverall evaluation of the trends i S deposition. The S deposition toforests has decreased substantially since the early 1990s, especiallyin south-western Sweden (Fig. 6), where the deposition was thehighest. In the beginning of the 1990s, the S deposition rates werearound 20 kg S ha�1 yr�1 in southwest Sweden. During 2006/07 theS deposition rates were below 5 kg S ha�1 yr�1 except for in thesouthernmost part of Sweden.
3.3. Soil water chemistry
3.3.1. Geographical distributionThe sulphur (SO4eS) concentrations in soil water were generally
higher in the southern part of Sweden than in the northern part,although the variation on a local level was large, especially in thesouth (Fig. 7). For the three acidification indicators pH, ANC (acidneutralizing capacity) and concentrations of inorganic Al there was

Fig. 6. Deposition of non-marine S in throughfall (kg S ha�1 yr�1) interpolated with the Inverse distance weighted (IDW) method, based on the SWETHRO sites: a) 1991/92, b) 1996/97, c) 2001/02, d) 2006/07. The black dots show active monitoring sites during the different time periods. Yearly mean values were calculated for hydrological years,OctobereSeptember.
G. Pihl Karlsson et al. / Environmental Pollution 159 (2011) 3571e35823576
a distinct gradient with increasing pH and ANC and decreasingconcentrations of inorganic Al from the southwest to the north.The pH of soil water was below 4.5 and the ANC was considerablynegative on several sites in southern Sweden during 2005/06e2007/08, indicating severe acidification of the soil water(Figs. 8 and 10).
a b
Fig. 7. Sulphur (SO4eS) concentration in soil water sampled at 50 cm depth in 1996/97e19sulphur concentrations 2005/06e2007/08 (median value) (c).
The concentrations of nitrate (NO3eN) in soil water weregenerally very low, in particular in northern Sweden (Fig. 11). In thesouth-western part of Sweden there were several sites withelevated concentrations, e.g. in Arkelstorp where there has beenfrequent elevated NO3eN concentrations during the entire period1996/97e2007/08 (Fig.11). Twoof the sites, Vallåsen andAlandsryd,
c
98/99 (median value), mg l�1 (a), significant changes from 1996/97 to 2007/08 (b) and
a b c
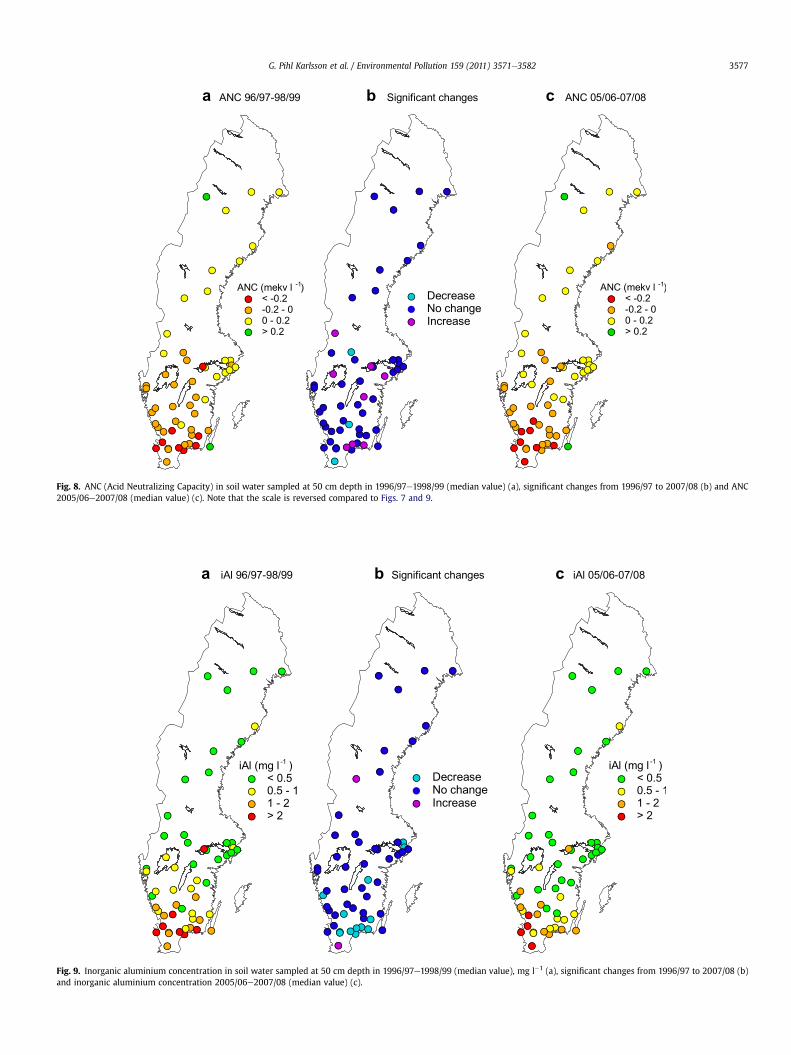
Fig. 8. ANC (Acid Neutralizing Capacity) in soil water sampled at 50 cm depth in 1996/97e1998/99 (median value) (a), significant changes from 1996/97 to 2007/08 (b) and ANC2005/06e2007/08 (median value) (c). Note that the scale is reversed compared to Figs. 7 and 9.
a b c
Fig. 9. Inorganic aluminium concentration in soil water sampled at 50 cm depth in 1996/97e1998/99 (median value), mg l�1 (a), significant changes from 1996/97 to 2007/08 (b)and inorganic aluminium concentration 2005/06e2007/08 (median value) (c).
G. Pihl Karlsson et al. / Environmental Pollution 159 (2011) 3571e3582 3577
a b c
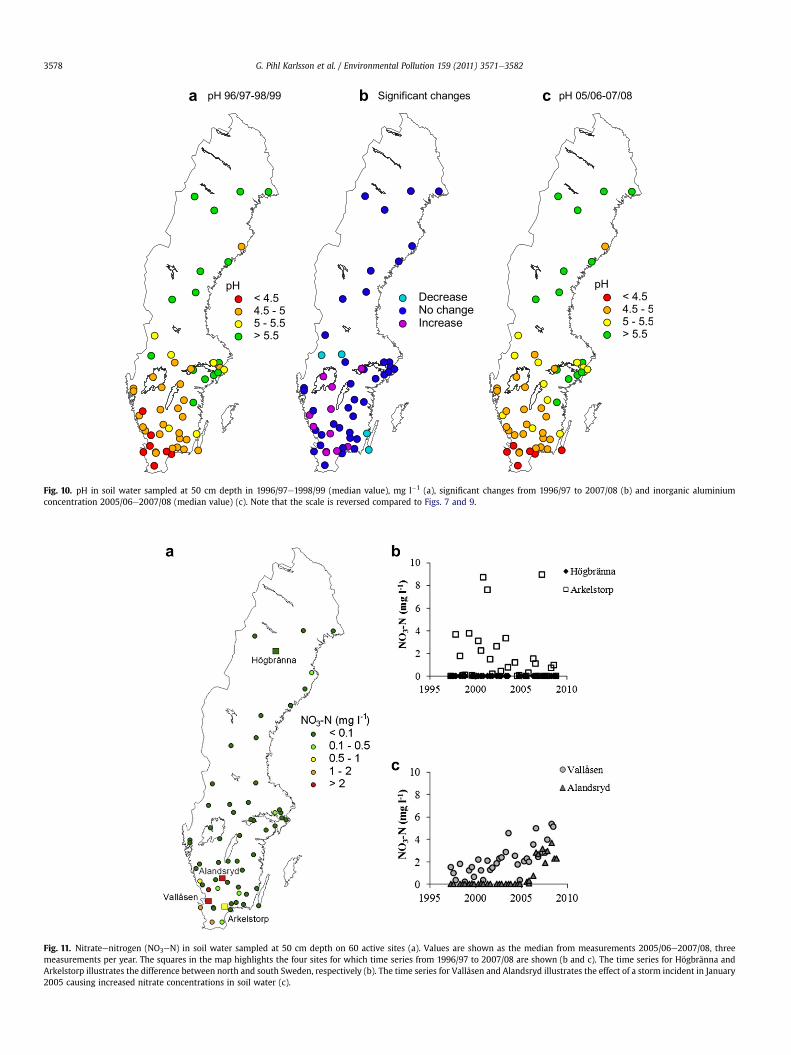
Fig. 10. pH in soil water sampled at 50 cm depth in 1996/97e1998/99 (median value), mg l�1 (a), significant changes from 1996/97 to 2007/08 (b) and inorganic aluminiumconcentration 2005/06e2007/08 (median value) (c). Note that the scale is reversed compared to Figs. 7 and 9.
Fig. 11. Nitrateenitrogen (NO3eN) in soil water sampled at 50 cm depth on 60 active sites (a). Values are shown as the median from measurements 2005/06e2007/08, threemeasurements per year. The squares in the map highlights the four sites for which time series from 1996/97 to 2007/08 are shown (b and c). The time series for Högbränna andArkelstorp illustrates the difference between north and south Sweden, respectively (b). The time series for Vallåsen and Alandsryd illustrates the effect of a storm incident in January2005 causing increased nitrate concentrations in soil water (c).
G. Pihl Karlsson et al. / Environmental Pollution 159 (2011) 3571e35823578
G. Pihl Karlsson et al. / Environmental Pollution 159 (2011) 3571e3582 3579
were damaged by a storm incident in January 2005 which led toincreased concentrations (Fig. 11). In Vallåsen the concentrationswere elevated already before the storm, but the concentrations wasfurther increased after the storm.
3.3.2. Trends 1996/97e2007/08The concentrations of SO4eS in the soil water have decreased
significantly on more than half of the sites, and the fraction of siteswith decreasing concentration was highest in the southwest(Fig. 7). Also, the concentrations of Ca have decreased significantlyon many of the sites (data not shown). Chloride concentrationshave been higher in the end of the period than in the beginning oneight of the 55 sites (data not shown).
pH, ANC and concentrations of inorganic aluminium showedreduced acidification on several of the sites in southern Sweden(Figs. 8e10). There were also a few examples with a change in theopposite direction. Although there seemed to be a recovery onseveral of the sites in the worst acidified areas, there were alsomany sites with no significant change. This showed that therecovery was slow on many sites.
There were no significant time trends in the NO3eN concen-trations, except for the increases caused by the storm in January2005. Elevated concentrations of ammonium in the soil water wererare, but sometimes occurred in connectionwith the storm incident2005 (data not shown).
3.3.3. Long-term trendsTwo 15-year time series for soil water S concentrations in
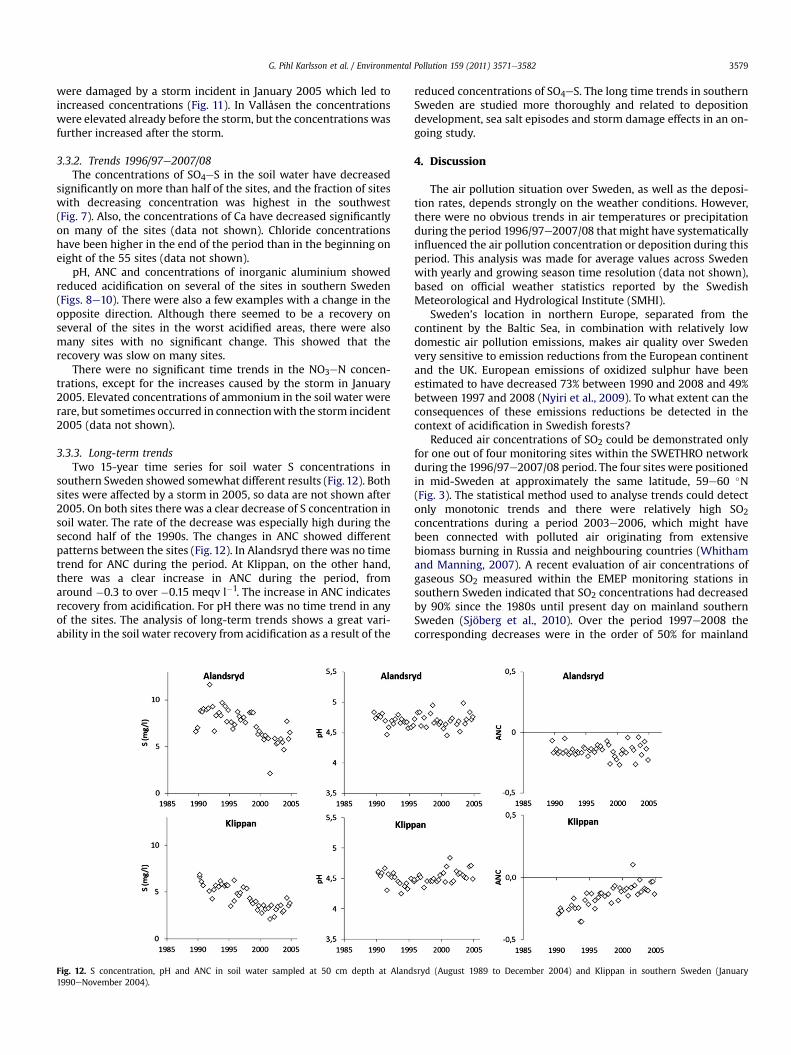
southern Sweden showed somewhat different results (Fig.12). Bothsites were affected by a storm in 2005, so data are not shown after2005. On both sites there was a clear decrease of S concentration insoil water. The rate of the decrease was especially high during thesecond half of the 1990s. The changes in ANC showed differentpatterns between the sites (Fig. 12). In Alandsryd there was no timetrend for ANC during the period. At Klippan, on the other hand,there was a clear increase in ANC during the period, fromaround �0.3 to over �0.15 meqv l�1. The increase in ANC indicatesrecovery from acidification. For pH there was no time trend in anyof the sites. The analysis of long-term trends shows a great vari-ability in the soil water recovery from acidification as a result of the
Fig. 12. S concentration, pH and ANC in soil water sampled at 50 cm depth at Aland1990eNovember 2004).
reduced concentrations of SO4eS. The long time trends in southernSweden are studied more thoroughly and related to depositiondevelopment, sea salt episodes and storm damage effects in an on-going study.
4. Discussion
The air pollution situation over Sweden, as well as the deposi-tion rates, depends strongly on the weather conditions. However,there were no obvious trends in air temperatures or precipitationduring the period 1996/97e2007/08 that might have systematicallyinfluenced the air pollution concentration or deposition during thisperiod. This analysis was made for average values across Swedenwith yearly and growing season time resolution (data not shown),based on official weather statistics reported by the SwedishMeteorological and Hydrological Institute (SMHI).
Sweden’s location in northern Europe, separated from thecontinent by the Baltic Sea, in combination with relatively lowdomestic air pollution emissions, makes air quality over Swedenvery sensitive to emission reductions from the European continentand the UK. European emissions of oxidized sulphur have beenestimated to have decreased 73% between 1990 and 2008 and 49%between 1997 and 2008 (Nyiri et al., 2009). To what extent can theconsequences of these emissions reductions be detected in thecontext of acidification in Swedish forests?
Reduced air concentrations of SO2 could be demonstrated onlyfor one out of four monitoring sites within the SWETHRO networkduring the 1996/97e2007/08 period. The four sites were positionedin mid-Sweden at approximately the same latitude, 59e60 �N(Fig. 3). The statistical method used to analyse trends could detectonly monotonic trends and there were relatively high SO2concentrations during a period 2003e2006, which might havebeen connected with polluted air originating from extensivebiomass burning in Russia and neighbouring countries (Whithamand Manning, 2007). A recent evaluation of air concentrations ofgaseous SO2 measured within the EMEP monitoring stations insouthern Sweden indicated that SO2 concentrations had decreasedby 90% since the 1980s until present day on mainland southernSweden (Sjöberg et al., 2010). Over the period 1997e2008 thecorresponding decreases were in the order of 50% for mainland
sryd (August 1989 to December 2004) and Klippan in southern Sweden (January
G. Pihl Karlsson et al. / Environmental Pollution 159 (2011) 3571e35823580
southern Sweden. A recent analysis by Anttila and Tuovinen (2010)demonstrated significant decreases in air SO2 concentrations atsix out of eight Finnish rural background sites, with yearlydecreases in the order of 3e8%. They concluded that the declineof air SO2 concentrations in Finnish background areas continuedalso after the year 2000. Corresponding measurements of airSO2 þ SO4-concentrations at four EMEP stations in Norway alsoshowed a decrease in the order of 50% during the period1997e2009 (SPFO, 2010). Hence, overall, is seems likely that the airoxidized sulphur concentrations across the Nordic countries havedecreased in parallel with European emission reductions. Thestrong geographical gradient in the measured air concentrations ofSO2 from southwest towards northeast supports what has beenreported by EMEP (Nyiri et al., 2009), that the most importantsources for sulphur deposition in Sweden are long-range transportfrom continental Europe and from ship emissions in the North seaand the Baltic sea.
Sulphur deposition to Swedish forests has declined to the extentexpected from European emission reductions, ranging from 22% upto 67% for different sites between the two three-year periods1996/97e1998/99 and 2005/06e2007/08. The larger changes in TFsulphur deposition to forests, as compared to changes in bulkdeposition, indicate that the dry deposition, which decreasedsubstantially between 1985 and 1994 (Hallgren Larsson et al., 1995),has continued to decrease over the 1996/97e2007/08 period.
Sulphur concentrations in the soil water at 50 cm depth atSwedish forest sites showed a considerable variability betweennearby monitoring sites due to differences in soil conditions.However, the highest concentrations occurred in the south andsouth-east part of Sweden but also in mid-Sweden around theStockholm region and around the lake Mälaren. The soil wateracidification parameters pH and ANC were clearly lowest towardsthe southwest part of Sweden, where the acid deposition has beenthe highest. The soil water concentrations of S, Ca and inorganic Alare affected by the amount of precipitation and runoff. High flow ofwater lowers the concentrations due to dilution effects. Since flowvaries geographically, with the highest flow in the southwest,differences in concentrations between geographical areas shouldbe interpreted with caution. This effect, however, acts in theopposite direction as compared with the geographical variations insoil water concentrations that was found across Sweden, withhigher concentrations in the south.
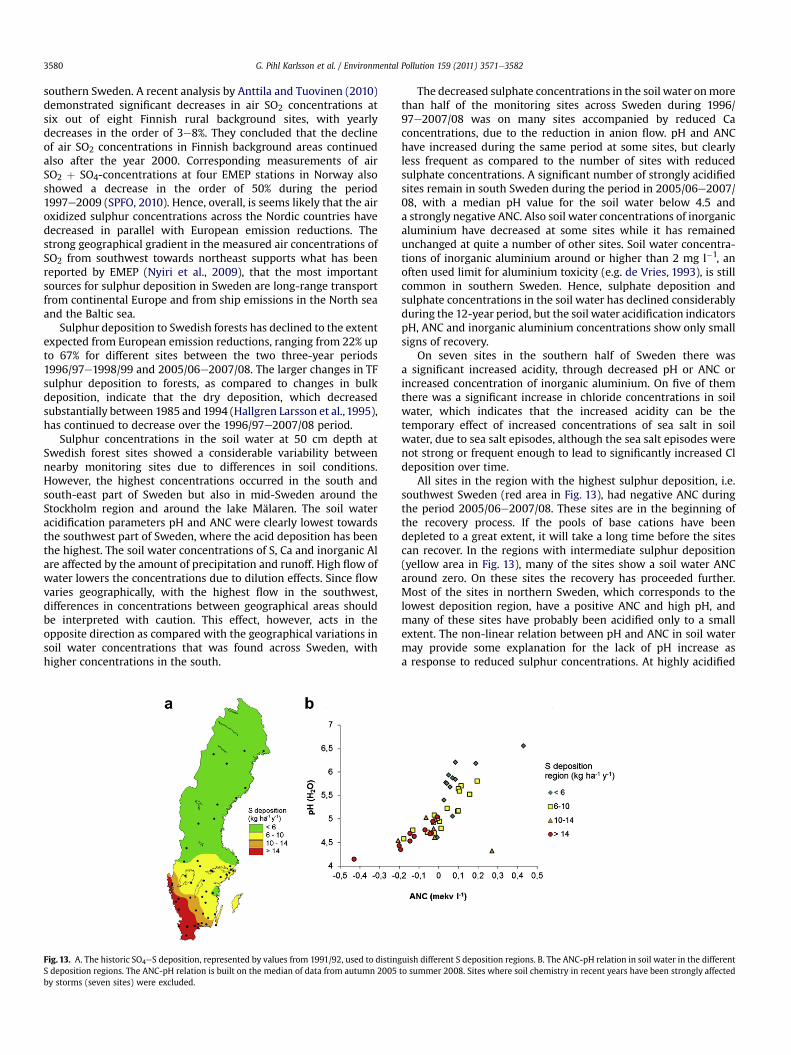
Fig. 13. A. The historic SO4eS deposition, represented by values from 1991/92, used to distingS deposition regions. The ANC-pH relation is built on the median of data from autumn 2005by storms (seven sites) were excluded.
The decreased sulphate concentrations in the soil water onmorethan half of the monitoring sites across Sweden during 1996/97e2007/08 was on many sites accompanied by reduced Caconcentrations, due to the reduction in anion flow. pH and ANChave increased during the same period at some sites, but clearlyless frequent as compared to the number of sites with reducedsulphate concentrations. A significant number of strongly acidifiedsites remain in south Sweden during the period in 2005/06e2007/08, with a median pH value for the soil water below 4.5 anda strongly negative ANC. Also soil water concentrations of inorganicaluminium have decreased at some sites while it has remainedunchanged at quite a number of other sites. Soil water concentra-tions of inorganic aluminium around or higher than 2 mg l�1, anoften used limit for aluminium toxicity (e.g. de Vries, 1993), is stillcommon in southern Sweden. Hence, sulphate deposition andsulphate concentrations in the soil water has declined considerablyduring the 12-year period, but the soil water acidification indicatorspH, ANC and inorganic aluminium concentrations show only smallsigns of recovery.
On seven sites in the southern half of Sweden there wasa significant increased acidity, through decreased pH or ANC orincreased concentration of inorganic aluminium. On five of themthere was a significant increase in chloride concentrations in soilwater, which indicates that the increased acidity can be thetemporary effect of increased concentrations of sea salt in soilwater, due to sea salt episodes, although the sea salt episodes werenot strong or frequent enough to lead to significantly increased Cldeposition over time.
All sites in the region with the highest sulphur deposition, i.e.southwest Sweden (red area in Fig. 13), had negative ANC duringthe period 2005/06e2007/08. These sites are in the beginning ofthe recovery process. If the pools of base cations have beendepleted to a great extent, it will take a long time before the sitescan recover. In the regions with intermediate sulphur deposition(yellow area in Fig. 13), many of the sites show a soil water ANCaround zero. On these sites the recovery has proceeded further.Most of the sites in northern Sweden, which corresponds to thelowest deposition region, have a positive ANC and high pH, andmany of these sites have probably been acidified only to a smallextent. The non-linear relation between pH and ANC in soil watermay provide some explanation for the lack of pH increase asa response to reduced sulphur concentrations. At highly acidified
uish different S deposition regions. B. The ANC-pH relation in soil water in the differentto summer 2008. Sites where soil chemistry in recent years have been strongly affected
G. Pihl Karlsson et al. / Environmental Pollution 159 (2011) 3571e3582 3581
sites, ANC has to increase considerably before there will bea substantial increase in pH. However, the analysis of the soil waterchemistry changes during the time series 1989e2005, demon-strated that also the response of ANC to a reduced sulphateconcentration in the soil water can be quite different (Fig. 12).
The sulphate concentrations in soil water have decreased also atICP Forest level II plots in Norway over the period 1990e2008(Andreassen et al., 2009). However, most of the decrease occurredduring the 1990s and in recent years the changes have been small.Also the Norwegian forest plots show a parallel decrease in the soilwater calcium concentrations while there were small changes inthe soil water pH and inorganic aluminium concentrations(Andreassen et al., 2009).
European emissions of oxidized and reduced nitrogen havedecreased 22 and 8% between 1997 and 2008, respectively (Nyiriet al., 2009). There was a substantial decline in air NO2 concen-trations at all four monitoring sites in mid-Sweden between 1997and 2008. This decline was even larger than what was expectedfrom the European emission reductions. The decrease in air NO2concentrations was consistent with reported decreases in air NO2concentrations at the two EMEP monitoring sites Råö, at the westcoast of Sweden, and at Vavihill, in southernmost Sweden (Sjöberget al., 2010). Furthermore, Anttila and Tuovinen (2010) demon-strated significant decreases in air NO2 concentrations at two out offour Finnish rural background sites during a period 1994e2007.Significant yearly decreases were in the order of 1e2%. Trends inNH3 air concentrations have been more difficult to assess due tolower concentrations and higher variability.
The bulk deposition of inorganic nitrogen over Sweden did notdecrease during the 1996/97e2007/08 period. The bulk deposi-tion of inorganic N even increased significantly at two out of20 sites, while there were no statistically significant changes atthe remaining sites. The increases were mainly a result of anincreasing ammonium bulk deposition. In accordance with theresults in this study, the bulk deposition of inorganic nitrogen didnot change over time for the Norwegian ICP Forest level II plotsover the period 1990e2008 (Andreassen et al., 2009) as well asfor two Danish monitoring sites with Norway spruce and beech,respectively, over the period 1986e2005 (Hansen et al., 2006).Fowler et al. (2007) reported that the concentrations of NO3 inprecipitation have increased in remote areas of Europe overthe period 1980e2000, even though the emissions from moredensely populated parts of Europe decreased over the sameperiod. Moreover, a recent report from the UK concluded thatthe bulk nitrogen deposition over the UK had not, with a fewexceptions, changed significantly over a recent twenty-yearperiod (Kernan et al., 2010). Thus, due to non-linearity’s inatmospheric chemistry (Fowler et al., 2007; Fagerli and Aas, 2008)the reductions in European NOx emissions were not reflected inbulk nitrate deposition to Swedish forests.
Total deposition of inorganic N to forest as NH4eN and NO3eNin throughfall, which in theory should include also dry deposition,is difficult to measure due to direct nitrogen uptake by the cano-pies. A newly developed method to assess nitrogen dry depositionto forests based on the use of surrogate surfaces (Ferm andHultberg, 1999; Karlsson et al., 2010) indicated that nitrogen drydeposition to forests may be in the order of 40% of the totaldeposition in southwest Sweden, while it is considerably lowerin the north. The lack of correlations between the trends in airconcentrations of NO2/NH3 and the trends in inorganic nitrogendeposition may in part be explained by the fact that the nitrogendry deposition could not be included in the assessment in thepresent study. Dry nitrogen deposition should be more stronglyconnected to air nitrogen concentrations, as compared to the bulkdeposition.
N leaching due to high N input is generally reflected in increasedNO3eN concentrations in soil water. Therewas no continuous trendfor NO3eN concentrations in soil water. Elevated NO3eN concen-trations in the soil water occurred at irregular occasions, but alsoafter massive fellings caused by a severe storm events, at some sitesparticularly in southern Sweden (Hellsten et al., 2009). This indi-cated that nitrogen stocks in the forest soils in southern Sweden areincreasing and are in some areas approaching levels where they aresensitive to disturbances. In accordance with these results, thesouth-western part of Sweden was identified as a risk area fornitrogen leaching in a study where four different modelling andmonitoring approaches, including SWETHRO, were used to assessthe risk of nitrogen leaching (Akselsson et al., 2010).
Future trends in air concentrations, deposition and soil waterchemistry will be affected by direct and indirect effects of climatechange. Changed wind and precipitation patterns may affect airconcentrations and deposition (Langner et al., 2005). Changes intemperature and moisture will affect tree growth (Laubhann et al.,2009), weathering, decomposition, and other processes in theforest ecosystems, which will affect soil water chemistry. Adapta-tion and mitigation of climate change may lead to changed emis-sion patterns of S and N and intensified forestry for production ofbiofuels and/or increased C sequestration (Beland Lindahl andWestholm, 2011). Increased biofuel harvesting may hamperrecovery from acidification (Olsson et al., 1993; Joki-Heiskala et al.,2003; Akselsson et al., 2007) and N fertilization leads to build-up ofN in the forest soils, which may lead to N saturation and N leachingin areas with high N status (Emmett, 2007; Akselsson et al., 2010).In order to be able to optimize abatement strategies for climate gasemissions, it is important to keep track of the concentrations ofpollutants as well as the forest deposition and soil water chemistrytrends in the changing climate.
5. Conclusions
Changes over time in sulphur and nitrogen air concentrations,deposition and soil water concentrations in forest ecosystems inSweden as well as in other Nordic countries were assessed inrelation to European emission reductions for oxidized sulphur andoxidized and reduced nitrogen. The analysis of the time series1996/97e2007/08 gave the following results.
� The SO2 and NO2 air concentrations have decreased substan-tially, whereas there was no trend for NH3.
� Reductions in SO4-deposition were found for the majority ofmonitoring sites across Sweden, as well as for the other Nordiccountries, and the reductions were in the same order ofmagnitude as the European emission reductions.
� Soil water SO4-concentrations decreased at most, but not all,monitoring sites across Sweden in parallel with the SO4-deposition reductions. The soil water acidification indicatorspH, ANC and inorganic Al-concentrations indicated acidifica-tion recovery on some of the sites but there were also manysites with no significant change.
� Despite the substantial decrease in NO2 air concentrations, nostatistically significant decreases in the bulk deposition ofinorganic nitrogen deposition could be demonstrated.However, we were not able to include the dry nitrogen depo-sition in the trend analyses.
� Elevated NO3-concentrations in the soil water occurred atirregular occasions, but also after massive fellings caused bysevere storm events, at some sites particularly in southernSweden. This indicated that nitrogen stocks in the forest soils insouthern Sweden are increasing and may be approachingsaturation.
G. Pihl Karlsson et al. / Environmental Pollution 159 (2011) 3571e35823582
We conclude that, despite considerable air pollution emissionreductions in Europe, the recovery from acidification is slow and formany sites far from complete. Furthermore, the relatively highnitrogen deposition to Swedish forests still appears to continue ata constant rate and this level is probably high enough to influencethe biodiversity of the forest ground vegetation (c.f. Nordin et al.,2005) as well as to cause increasing nitrogen stocks in the forestecosystem, resulting in an increasing risk for leakage of nitrate tosurface waters. The careful monitoring of Swedish forest ecosys-tems needs to proceed in order to follow up the trends of recoveryand nitrogen leaching.
Acknowledgements
This research has been funded by various regional air qualityprotection associations, county administrative boards and theSwedish Environmental Protection Agency. The Swedish Through-fall Monitoring Network (SWERHRO) is run by IVL Swedish Envi-ronmental Research Institute. The work with this publication wasfunded by the unit Monitoring at the Swedish EnvironmentalProtection Agency. We would also like to thank all field and labo-ratory personnel and all other devoted colleagues.
References
Akselsson, C., Belyazid, S., Hellsten, S., Klarqvist, M., Pihl-Karlsson, G., Karlsson, P.E.,Lundin, L., 2010. Assessing the risk of N leaching from forest soils across a steepN deposition gradient in Sweden. Environmental Pollution 158, 3588e3595.
Akselsson, C., Westling, O., Sverdrup, H., Holmqvist, J., Thelin, G., Uggla, E., Malm, G.,2007. Impact of harvest intensity on long-term base cation budgets in Swedishforest soils. Water, Air, and Soil Pollution: Focus 7, 201e210.
Andreassen, K., Clarke, N., Røsberg, I., Timmermann, W., Aas, W., 2009. IntensiveForest Monitoring in 2008. Results From ICP Forests Level 2 Plots in Norway.Forskning fra Skog og landskap - 3/09, ISBN 978-82-311-0089-8 (in Norwegian,English summary).
Anttila, P., Tuovinen, J.P., 2010. Trends of primary and secondary pollutantconcentrations in Finland in 1994e2007. Atmospheric Environment 44, 30e41.
Beland Lindahl, K., Westholm, E., 2011. Food, paper, wood, or energy? Global trendsand future Swedish forest use. Forests 2, 51e65.
de Vries, W., 1993. Average critical loads for nitrogen and sulphur and its use inacidification abatement policy in the Netherlands. Water, Air, and Soil Pollution68, 399e434.
Emmett, B., 2007. Nitrogen saturation of terrestrial ecosystems: some recent find-ings and their implications for our conceptual framework. Water, Air, and SoilPollution: Focus 7, 99e109.
Fagerli, H., Aas, W., 2008. Trends of nitrogen in air and recipitation: model resultsand observations at EMEP sites in Europe, 1980e2003. Environmental Pollution154, 448e461.
Ferm, M., 1993. Throughfall measurements of nitrogen and sulphur compounds.International Journal of Analytical Chemistry 50, 29e43.
Ferm, M., Rodhe, H., 1997. Measurements of air concentrations of SO2, NO2 and NH3at rural and remote sites in Asia. Journal of Atmospheric Chemistry 27, 17e29.
Ferm, M., Hultberg, H., 1999. Dry deposition and internal circulation of nitrogen,sulphur and base cations to a coniferous forest. Atmospheric Environment 33,4421e4430.
Fowler, D., Smith, R., Muller, J., Cape, J.N., Sutton, M., Erisman, J.W., Fagerli, H., 2007.Long term trends in sulphur and nitrogen deposition in Europe and the cause ofnon-linearities. Water Air and Soil Pollution 7, 41e47.
Fölster, J., Wilander, A., 2002. Recovery from acidification in Swedish forest streams.Environmental Pollution 117, 379e389.
Galloway, J.N., Aber, J.A., Erisman, J.W., Seitzinger, S.P., Howarth, R.W., Cowling, E.B.,Cosby, B.J., 2004. The nitrogen cascade. BioScience 53, 341e356.
Hallgren Larsson, E., Knulst, J., Malm, G., Westling, O., 1995. Deposition of acidifyingcompounds in Sweden. Water, Air, and Soil Pollution 85, 2271e2276.
Hansen, K., Sevel, L., Vesterdal, L., Hovmand, M., Andersen, H.V., Bastrup-Birk, A.,Bille-Hansen, J., 2006. Tilførsel af svovl og kvælstof til skov gennem 20 år.SKOVEN 11, 518e520 (in Danish).
Hellsten, S., Stadmark, J., Akselson, C., Pihl Karlsson, G., Karlsson, P.E., 2009. Effectsof the Storm Gudrun on Nitrogen Leaching from Forest Soils. IVL Report B1926(in Swedish).
Hindar, A., Henriksen, A., Kaste, Ø, Tørseth, K., 1995. Extreme acidification in smallcatchments in southwestern Norway associated with a sea salt episode. Water,Air, and Soil Pollution 85, 547e552.
Hirsch, R.M., Slack, J.R., 1984. A nonparametric trend test for seasonal data withserial dependence. Water Resource Research 20, 727e732.
Joki-Heiskala, P., Johansson, M., Holmberg, M., Mattsson, T., Forsius, M.,Kortelainen, O., 2003. Long-term base cation balances of forest mineral soils inFinland. Water, Air, and Soil Pollution 150, 255e273.
Karlsson, P.E., Ferm, M., Hultberg, H., Hellsten, S., Akselsson, C., Pihl Karlsson, G.,2010. Total Deposition of Nitrogen to Forests. IVL Report B1952 (in Swedish).
Kernan, M., Battarbee, R.W., Curtis, C.J., Monteith, D.T., Shilland, E.M., 2010. UK AcidWaters Monitoring Network 20 Year Interpretative Report. Report to DEFRA.Environmental Change Research Centre. University College of London. ISSN1366e7300.
Langner, J., Bergström, R., Foltescu, V., 2005. Impact of climate change on surfaceozone and deposition of sulphur and nitrogen in Europe. Atmospheric Envi-ronment 39, 1129e1141.
Laubhann, D., Sterba, H., Reinds, G.J., de Vries, W., 2009. The impact of atmo-spheric deposition and climate on forest growth in European monitoringplots: an individual tree growth model. Forest Ecology and Management 258,1751e1781.
LRTAP, 2004. Manual on Methodologies and Criteria for Modelling and MappingCritical Loads and Levels; and Air Pollution Effects, Risks and Trends. Chapter 2.Guidance on Mapping Concentration Levels and Deposition Loads. http://www.rivm.nl/en/themasites/icpmm/manual-and-downloads/manual-english/index.html.
Mann, H.B., 1945. Non-parametric tests against trend. Econometrica 13, 245e259.Nordin, A., Strengbom, J., Witzell, j., Näsholm, T., Ericsson, L., 2005. Nitrogen
deposition and the biodiversity of boreal forests: implications for the nitrogencritical load. Ambio 34, 20e24.
Nyiri, A., Gauss, M., Klein, H., 2009. Transboundary Air Pollution by Main Pollutants(S, N, O3) and PM. MSC-W Data Note 1/2009.
Olsson, M., Rosén, K., Melkerud, P.-A., 1993. Regional modelling of base cation lossesfrom Swedish forest soils due to whole-tree harvesting. Applied Geochemistry2, 189e194.
Reuss, J.O., Johnson, D.W., 1986. Acid Deposition and the Acidification of Soils andWaters. Ecological Studies, vol. 59. Springer-Verlag, New York, USA, 119e123 pp.
SPFO, 2010. Overvåking av langtransporterste forurensninger 2009. SPFO rapport1073/2010, ISBN 978-82-577-5721-2 (in norwegian, english summary).
Sjöberg, K., Pihl Karlsson, G., Svensson, A., Wängberg, I., Brorström-Lundén, E.,Potter, A., Hansson, K., Rehngren, E., Persson, K., Areskoug, H., Kreuger, J., 2010.National Environmental Monitoring in Air e Results Until 2009. IVL Report B1968 (in swedish).
Skjelvåle, B.L., Mannio, J., Wilander, A., Andersen, T., 2001. Recovery from acidifi-cation of lakes in Finland, Norway and Sweden 1990e1999. Hydrology andEarth System Sciences 5 (3), 327e337.
Skjelvåle, B., Borg, H., Hindar, A., Wilander, A., 2007. Large scale patterns of chemicalrecovery in lakes in Norway and Sweden: importance of seasalt episodes andchanges in dissolved organic carbon. Applied Geochemistry 22, 1174e1180.
Sverdrup, H., Martinson, L., Alveteg, M., Moldan, F., Kronnäs, V., Munthe, J., 2005.Modeling recovery of Swedish ecosystems from acidification. Ambio 34 (1),25e31.
Whitham, C., Manning, A., 2007. Impacts of Russian biomass burning on UK airquality. Atmospheric Environment 41, 8075e8090.