reduce inspection costs with acceptance sampling sampling is a practical, affordable alternative to...
TRANSCRIPT
hile there are a number of methods, including control charts, available to protect you and your customers from poor quality, these methods are not
always possible or appropriate. In such cases you might think that you have to
inspect every part you receive or ship to ensure quality, but 100 per cent inspection is impractical, as well as expensive and time consuming.
Acceptance sampling is a practical, affordable alternative to costly 100 per cent inspection. It offers an efficient way to assess the quality of an entire lot of product and to decide whether to accept or reject it.
Acceptance sampling plansAn acceptance sampling plan tells you how many units to sample from a lot or shipment and how many defects you can allow in that sample. If you discover more than the allowed number of defects in the sample, you simply reject the entire lot.
When you create an acceptance sampling plan, you specify the worst quality that you will accept on a regular basis (referred to as AQL) and the quality level that you will reject (referred to as RQL). Set your standards too low, and you risk wasting money on a lot of poor quality. Set your standards too high, and you could alienate your suppliers by rejecting acceptable lots.
With AQL and RQL values, and your statistical software package of choice, you can calculate the sampling requirements that match the risks you are willing to take. In this article, we will use Minitab Statistical Software to create acceptance sampling plans.
Creating a planSuppose you work for a company that manufactures kitchen appliances. You have many different suppliers providing parts to your line for appliance assembly. For this example, we will focus on one part, the appliance light bulb.
Because incoming light bulbs can be defective, you want to develop a sampling plan to make decisions
regarding entire lots of bulbs without having to inspect every single light bulb your company receives. Although it is ideal to have zero defects, some defects are inevitable.
You and your light bulb supplier decide on quality levels and risks that allow some defects while maintaining profitability for both of you.
You decide that the worst quality you are willing to accept on a regular basis is 0.65 per cent defective (AQL) and the quality that you want to reject most of the time is 5.5 per cent defective (RQL).
The producer’s risk, also known as alpha, is the risk you will reject a good lot, while the consumer’s risk, or beta, is the risk you will accept a poor lot. We will use a producer’s risk of 0.05 and a consumer’s risk of 0.10.
It is important to work closely with your suppliers in determining your own AQL, RQL, and risk levels. For instance, some quality practitioners may find the values of 0.65percent for AQL and 5.5percent for RQL too high for their application. However, in our light bulb example, we know that all light bulbs are checked upon installation, so we are willing to accept more defective bulbs during manufacturing.
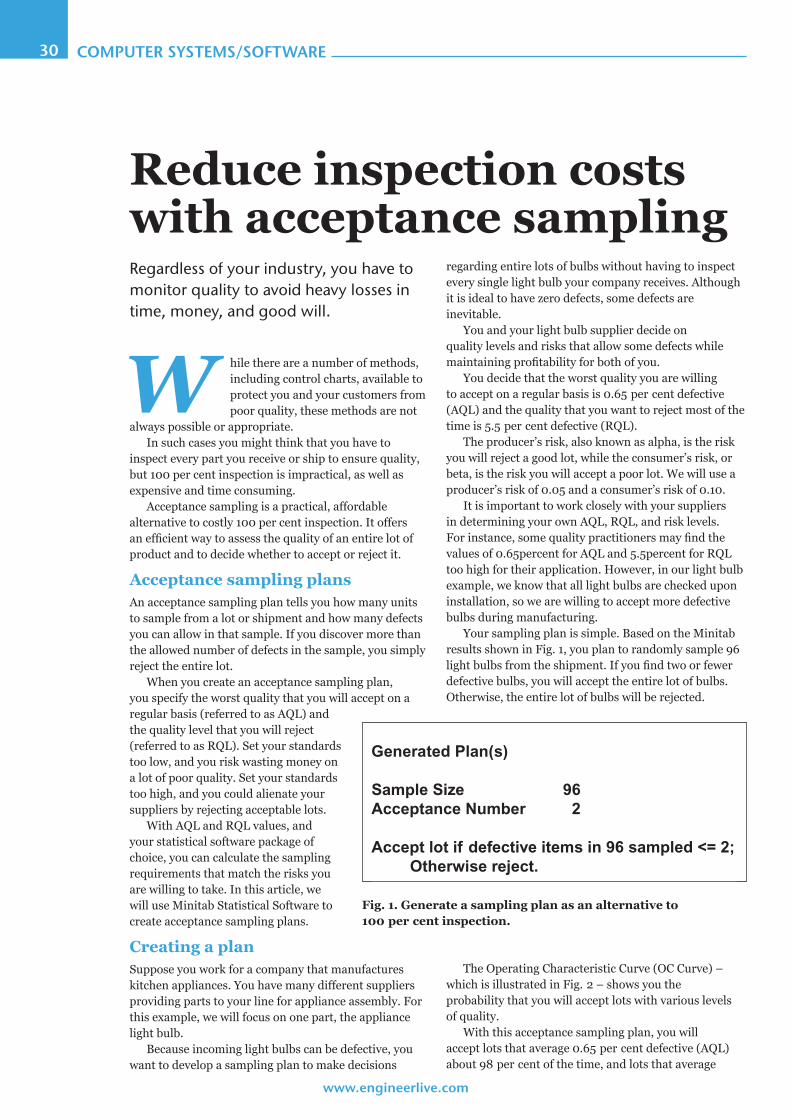
Your sampling plan is simple. Based on the Minitab results shown in Fig. 1, you plan to randomly sample 96 light bulbs from the shipment. If you find two or fewer defective bulbs, you will accept the entire lot of bulbs. Otherwise, the entire lot of bulbs will be rejected.
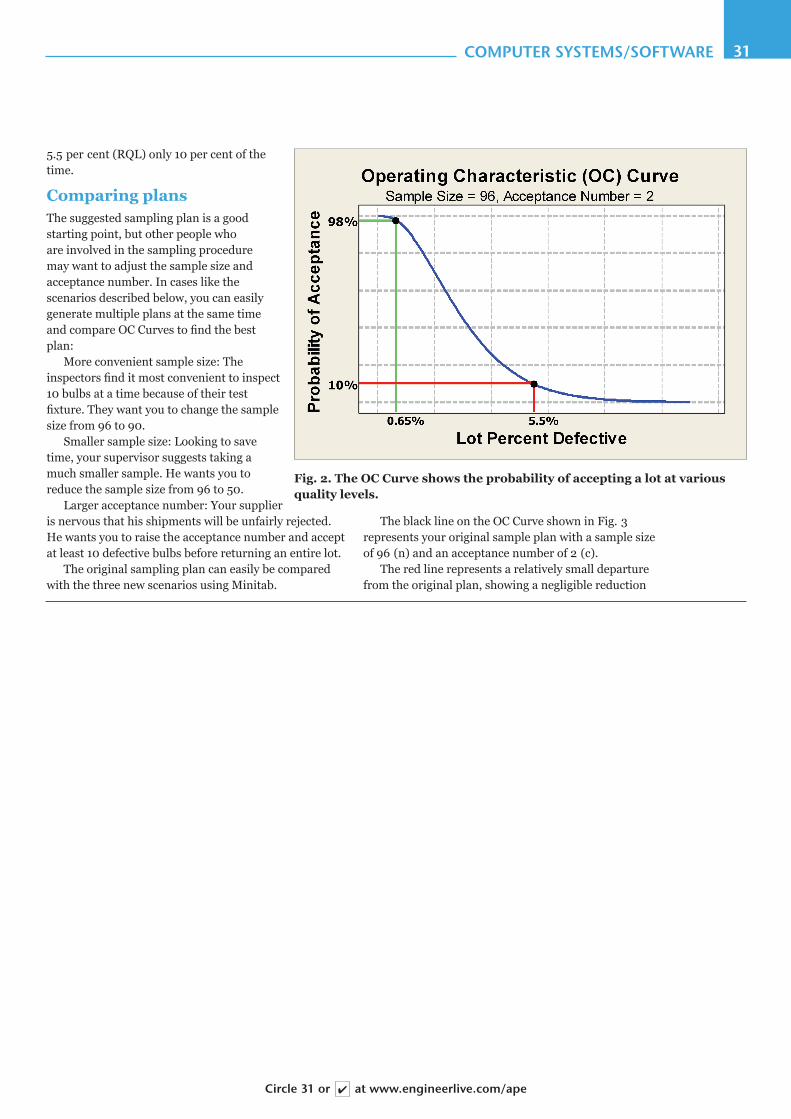
The Operating Characteristic Curve (OC Curve) – which is illustrated in Fig. 2 – shows you the probability that you will accept lots with various levels of quality.
With this acceptance sampling plan, you will accept lots that average 0.65 per cent defective (AQL) about 98 per cent of the time, and lots that average
www.engineerlive.com
Reduce inspection costs with acceptance samplingRegardless of your industry, you have to monitor quality to avoid heavy losses in time, money, and good will.
computer systems/software30
W
Fig. 1. Generate a sampling plan as an alternative to 100 per cent inspection.
Generated Plan(s)
Sample Size 96Acceptance Number 92
Accept lot if defective items in 96 sampled <= 2; Otherwise reject.
computer systems/software 31
5.5 per cent (RQL) only 10 per cent of the time.
Comparing plansThe suggested sampling plan is a good starting point, but other people who are involved in the sampling procedure may want to adjust the sample size and acceptance number. In cases like the scenarios described below, you can easily generate multiple plans at the same time and compare OC Curves to find the best plan:
More convenient sample size: The inspectors find it most convenient to inspect 10 bulbs at a time because of their test fixture. They want you to change the sample size from 96 to 90.
Smaller sample size: Looking to save time, your supervisor suggests taking a much smaller sample. He wants you to reduce the sample size from 96 to 50.
Larger acceptance number: Your supplier is nervous that his shipments will be unfairly rejected. He wants you to raise the acceptance number and accept at least 10 defective bulbs before returning an entire lot.
The original sampling plan can easily be compared with the three new scenarios using Minitab.
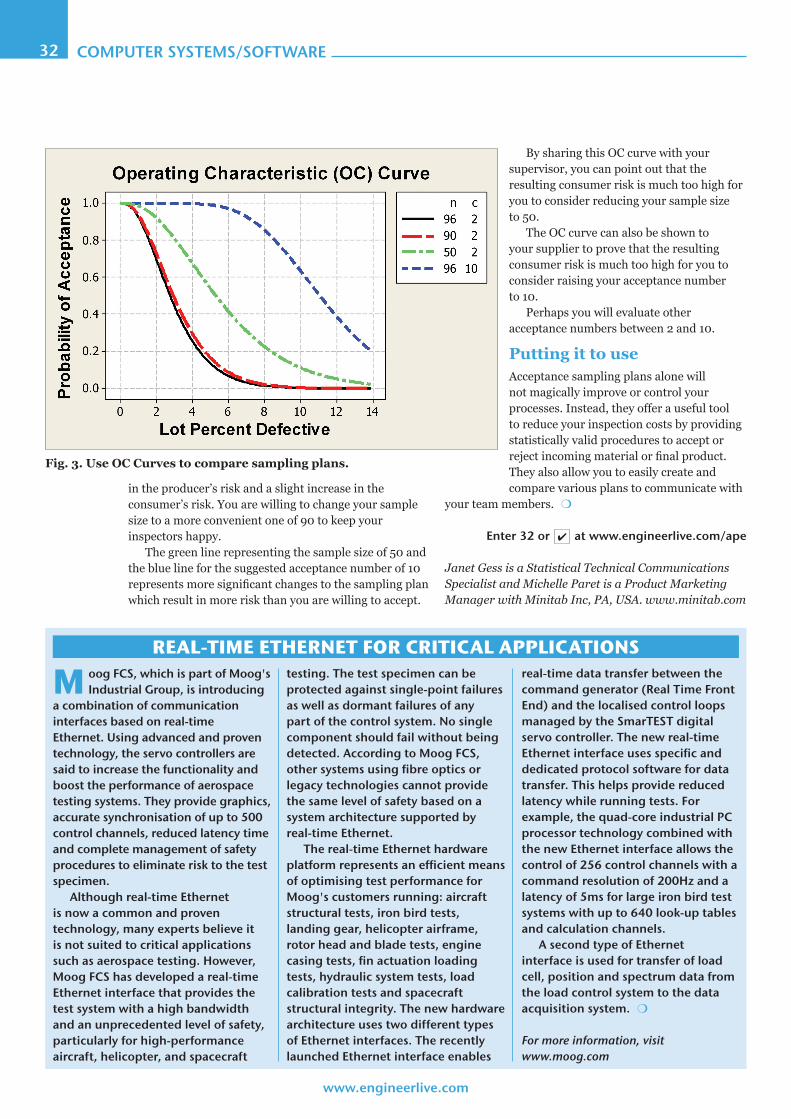
The black line on the OC Curve shown in Fig. 3 represents your original sample plan with a sample size of 96 (n) and an acceptance number of 2 (c).
The red line represents a relatively small departure from the original plan, showing a negligible reduction
circle 31 or ✔ at www.engineerlive.com/ape
Fig. 2. The OC Curve shows the probability of accepting a lot at various quality levels.
computer systems/software32
in the producer’s risk and a slight increase in the consumer’s risk. You are willing to change your sample size to a more convenient one of 90 to keep your inspectors happy.
The green line representing the sample size of 50 and the blue line for the suggested acceptance number of 10 represents more significant changes to the sampling plan which result in more risk than you are willing to accept.
By sharing this OC curve with your supervisor, you can point out that the resulting consumer risk is much too high for you to consider reducing your sample size to 50.
The OC curve can also be shown to your supplier to prove that the resulting consumer risk is much too high for you to consider raising your acceptance number to 10.
Perhaps you will evaluate other acceptance numbers between 2 and 10.
Putting it to useAcceptance sampling plans alone will not magically improve or control your processes. Instead, they offer a useful tool to reduce your inspection costs by providing statistically valid procedures to accept or reject incoming material or final product. They also allow you to easily create and compare various plans to communicate with
your team members. m
enter 32 or ✔ at www.engineerlive.com/ape
Janet Gess is a Statistical Technical Communications Specialist and Michelle Paret is a Product Marketing Manager with Minitab Inc, PA, USA. www.minitab.com
www.engineerlive.com
Fig. 3. Use OC Curves to compare sampling plans.
Real-time etheRnet foR cRitical applications
m oog fcs, which is part of moog's Industrial Group, is introducing
a combination of communication interfaces based on real-time ethernet. using advanced and proven technology, the servo controllers are said to increase the functionality and boost the performance of aerospace testing systems. they provide graphics, accurate synchronisation of up to 500 control channels, reduced latency time and complete management of safety procedures to eliminate risk to the test specimen.
although real-time ethernet is now a common and proven technology, many experts believe it is not suited to critical applications such as aerospace testing. However, moog fcs has developed a real-time ethernet interface that provides the test system with a high bandwidth and an unprecedented level of safety, particularly for high-performance aircraft, helicopter, and spacecraft
testing. the test specimen can be protected against single-point failures as well as dormant failures of any part of the control system. No single component should fail without being detected. according to moog fcs, other systems using fibre optics or legacy technologies cannot provide the same level of safety based on a system architecture supported by real-time ethernet.
the real-time ethernet hardware platform represents an efficient means of optimising test performance for moog's customers running: aircraft structural tests, iron bird tests, landing gear, helicopter airframe, rotor head and blade tests, engine casing tests, fin actuation loading tests, hydraulic system tests, load calibration tests and spacecraft structural integrity. the new hardware architecture uses two different types of ethernet interfaces. the recently launched ethernet interface enables
real-time data transfer between the command generator (real time front end) and the localised control loops managed by the smartest digital servo controller. the new real-time ethernet interface uses specific and dedicated protocol software for data transfer. this helps provide reduced latency while running tests. for example, the quad-core industrial pc processor technology combined with the new ethernet interface allows the control of 256 control channels with a command resolution of 200Hz and a latency of 5ms for large iron bird test systems with up to 640 look-up tables and calculation channels.
a second type of ethernet interface is used for transfer of load cell, position and spectrum data from the load control system to the data acquisition system. m
For more information, visit www.moog.com