rediscover asean - ey.com · with 2017 marking the 50th anniversary of asean, it is amazing to...
TRANSCRIPT
Rediscover ASEAN A growth story of 10 countries

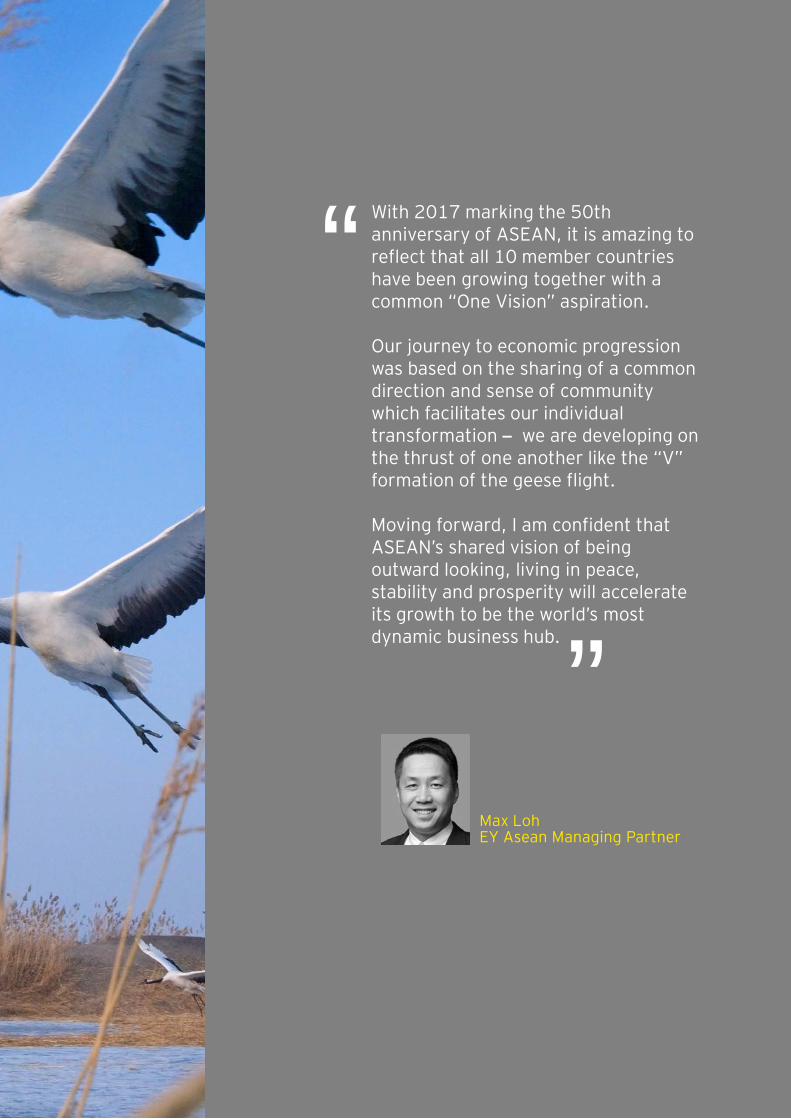
With 2017 marking the 50th anniversary of ASEAN, it is amazing to reflect that all 10 member countries have been growing together with a common “One Vision” aspiration.
Our journey to economic progression was based on the sharing of a common direction and sense of community which facilitates our individual transformation – we are developing on the thrust of one another like the “V” formation of the geese flight.
Moving forward, I am confident that ASEAN’s shared vision of being outward looking, living in peace, stability and prosperity will accelerate its growth to be the world’s most dynamic business hub.
Max LohEY Asean Managing Partner
“
“

Page 3 Rediscover ASEAN: a growth story of 10 countries
ASEAN is increasingly in focus to be the next global investment destination of choice by both regional and global investors.
Strategically located in the central hub of Asia Pacific, where two-thirds of the world population reside, ASEAN is a dynamic economic hub of over 630 million people, generating Gross Domestic Product (GDP) of US$2.5t and international trade of US$2.3t.
Despite ASEAN’s stable track record of above-average GDP growth of 5.2% compound annual growth rate (CAGR) in the last decade, her young and dynamic profile presents wide opportunities for investors to participate in her continued growth ascent.
ASEAN’s economic dynamism is driven by her regional centrality, sheer demographic volume, breadth of diversified industries, conducive and resource-rich ecosystems, strong global and regional trade links, and buoyant tourism activities supported by well-connected transportation logistics.
Looking ahead, ASEAN’s growth momentum and resilience will be determined by geopolitical trade trends, member country economic policies as well as the business investment and influence of regional titans on ASEAN’s resource deployment and infrastructure investments, including physical and digital aspects.
► Buoyant growth dynamics, economies and demographics
► Significant investment on infrastructure − physical and digital
► Rising foreign direct investment (FDI) interest from global and regional investors
► Burgeoning middle-class consumers base
► Attractive tax incentives to set up business or regional hub
Why rediscover ASEAN?
Rediscover ASEAN
Page 4Rediscover ASEAN: a growth story of 10 countries
Cont
ents ► Rediscover ASEAN
► Foreword► The story you already know► The new story you need to know► Investment radar► Economic dynamics► Infrastructure progress► Country profiles► Appendices:► Incentives to establish regional hub in ASEAN► Selected tax holidays and allowances► ASEAN tax: personal, corporate and VAT or GST
ReferencesChartsEY thought leadershipEY contacts
3
5
7
8
9
21
25
32
53
59
60
61
62
Page 5 Rediscover ASEAN: a growth story of 10 countries
ASEAN, a diverse community of 10 countries, home to over 630 million people and strategically located in the central nexus of Asia, between China and India, is rapidly progressing to be a key investment destination of choice.
Despite challenging economic externalities, regional and global investors remain vested in ASEAN in view of her relatively stable economies − member countries are anticipated to generate healthy GDP growth rates between 3% and 8% over 2017 to 2021.
Aside from her robust economic dynamics, ASEAN has a relatively young and diverse multilingual talent pool, burgeoning middle-class segment and a strong investment pipeline of infrastructure development projects.
ASEAN is now on the cusp of improving her regional intra- and intercountry transport connectivity, including implementing the ASEAN Connectivity 2025 masterplan.
In the longer term, ASEAN’s growth will continue to be shaped by economic policies, regional trade policies (including the Regional Comprehensive Economic Partnership or RCEP), investment incentives, and infrastructure financing capacities and capabilities.
With 2017 marking the 50th anniversary of ASEAN, we hope EY’s Rediscover ASEANcan refresh your insights on the new developments in this region.
Should your company or organization consider exploring investment opportunities in any of these countries, we look forward to assisting you.
Sincerely,
Foreword
Selamat Datang, Sawasdee Kha, Yin dee dtôn ráp, Chào Mừng, Nyín Dee, Soum swa-kumm, Kyaosopartaal, Maligayang pagdating
Welcome to ASEAN
Yeo Eng PingEY Asean Tax Leader
At a time of volatility in various parts of the world, ASEAN may well be the prized ecosystem of certainty − consistent and resilient economic growth.
Dato’ Abdul Rauf RashidEY Asean Assurance Leader
“ “
Page 7 Rediscover ASEAN: a growth story or 10 countries
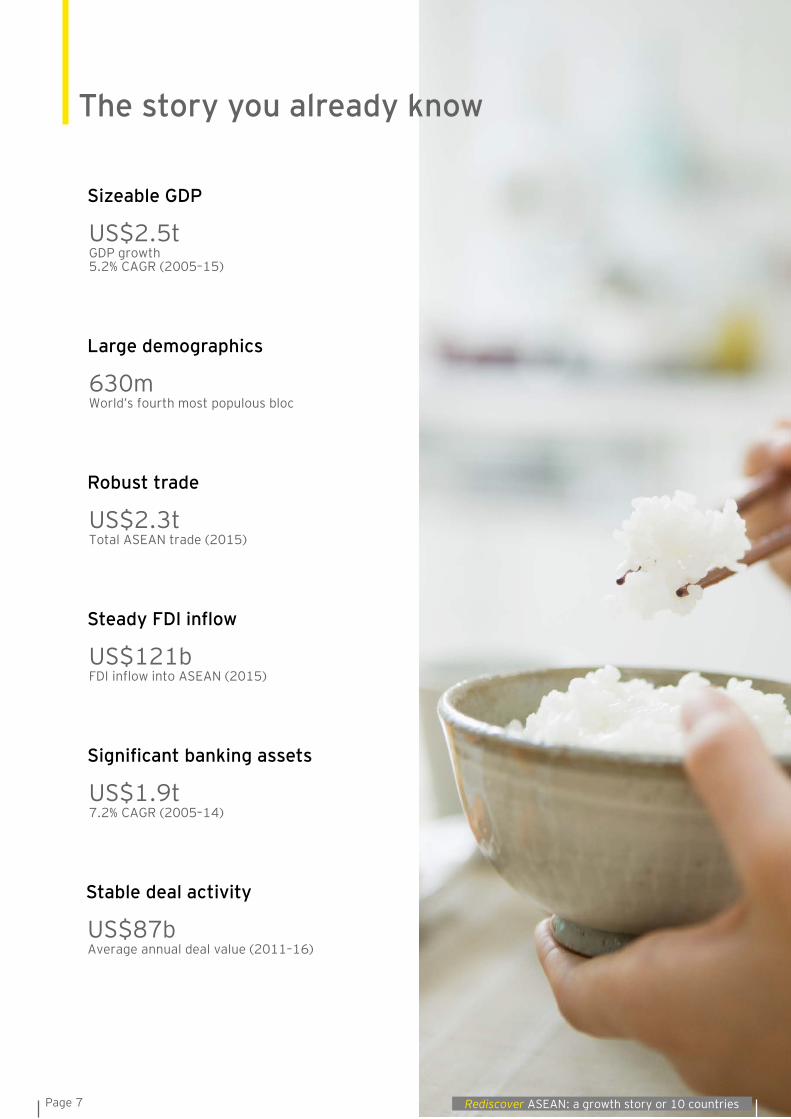
Sizeable GDP
US$2.5tGDP growth5.2% CAGR (2005–15)
The story you already know
Large demographics
630mWorld’s fourth most populous bloc
Robust trade
US$2.3tTotal ASEAN trade (2015)
Steady FDI inflow
US$121bFDI inflow into ASEAN (2015)
Significant banking assets
US$1.9t7.2% CAGR (2005–14)
Stable deal activity
US$87bAverage annual deal value (2011–16)
Page 8Rediscover ASEAN: a growth story or 10 countries
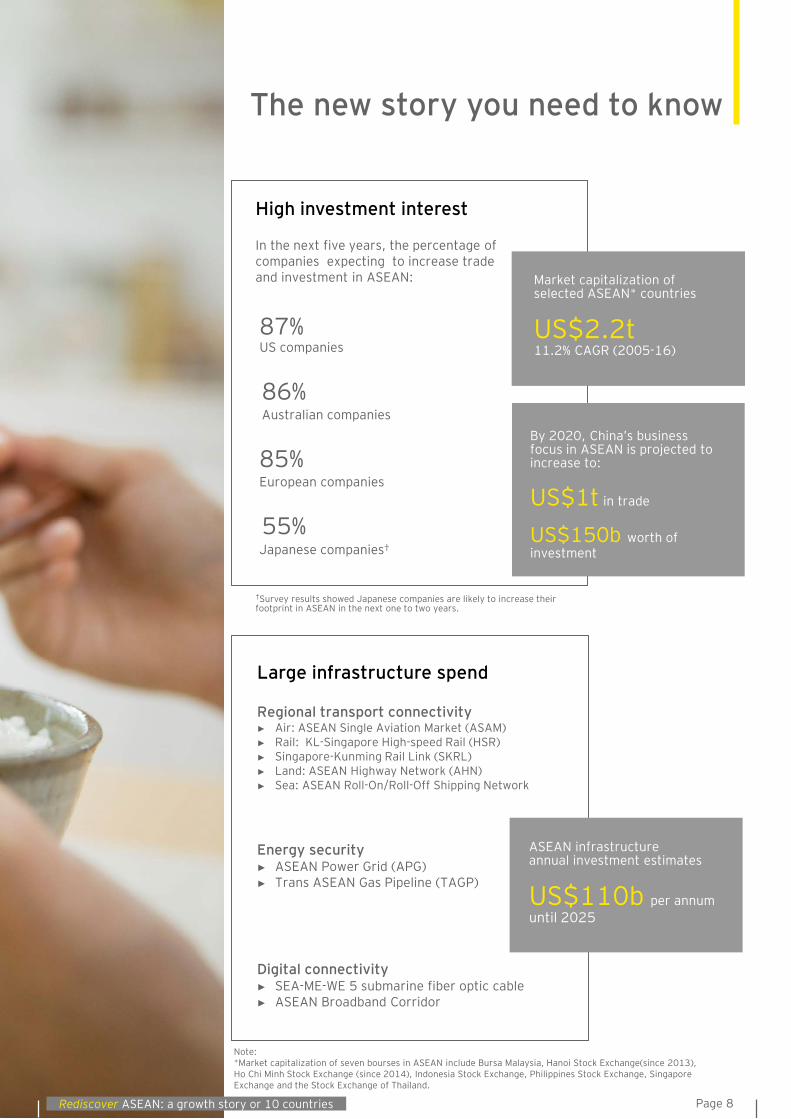
Australian companies86%
In the next five years, the percentage of companies expecting to increase trade and investment in ASEAN:
US companies87%
European companies85%
Japanese companies†
55%
†Survey results showed Japanese companies are likely to increase their footprint in ASEAN in the next one to two years.
High investment interest
By 2020, China’s business focus in ASEAN is projected to increase to:
US$1t in trade
US$150b worth of investment
Large infrastructure spend
Regional transport connectivity► Air: ASEAN Single Aviation Market (ASAM)► Rail: KL-Singapore High-speed Rail (HSR)► Singapore-Kunming Rail Link (SKRL)► Land: ASEAN Highway Network (AHN)► Sea: ASEAN Roll-On/Roll-Off Shipping Network
Energy security► ASEAN Power Grid (APG)► Trans ASEAN Gas Pipeline (TAGP)
Digital connectivity► SEA-ME-WE 5 submarine fiber optic cable► ASEAN Broadband Corridor
Market capitalization of selected ASEAN* countries
US$2.2t11.2% CAGR (2005-16)
Note: *Market capitalization of seven bourses in ASEAN include Bursa Malaysia, Hanoi Stock Exchange(since 2013), Ho Chi Minh Stock Exchange (since 2014), Indonesia Stock Exchange, Philippines Stock Exchange, Singapore Exchange and the Stock Exchange of Thailand.
ASEAN infrastructureannual investment estimates
US$110b per annum until 2025
The new story you need to know
Today’s ‘volatile, uncertain, complex and ambiguous’ world demands predictive insights and the right set of data and tools to identify long-term growth opportunities.
Chow Sang HoeEY Asean Advisory Leader
“ “
Investment radar
Page 10Rediscover ASEAN: a growth story of 10 countries
25%Intra-ASEAN
US$44b34%Other international-ASEAN
US$61b
41%Asia-Pacific-ASEAN
US$73b
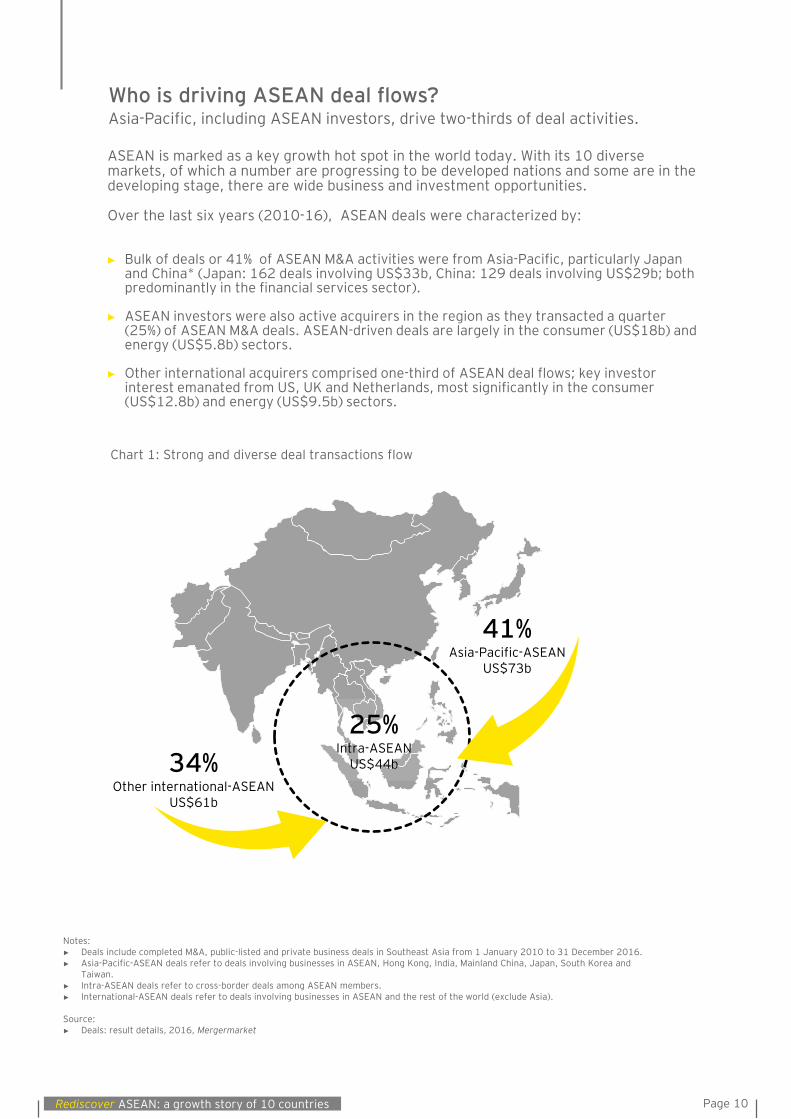
Chart 1: Strong and diverse deal transactions flow
Who is driving ASEAN deal flows?Asia-Pacific, including ASEAN investors, drive two-thirds of deal activities.
ASEAN is marked as a key growth hot spot in the world today. With its 10 diverse markets, of which a number are progressing to be developed nations and some are in the developing stage, there are wide business and investment opportunities.
Over the last six years (2010-16), ASEAN deals were characterized by:
► Bulk of deals or 41% of ASEAN M&A activities were from Asia-Pacific, particularly Japan and China* (Japan: 162 deals involving US$33b, China: 129 deals involving US$29b; both predominantly in the financial services sector).
► ASEAN investors were also active acquirers in the region as they transacted a quarter (25%) of ASEAN M&A deals. ASEAN-driven deals are largely in the consumer (US$18b) and energy (US$5.8b) sectors.
► Other international acquirers comprised one-third of ASEAN deal flows; key investor interest emanated from US, UK and Netherlands, most significantly in the consumer (US$12.8b) and energy (US$9.5b) sectors.
Notes:► Deals include completed M&A, public-listed and private business deals in Southeast Asia from 1 January 2010 to 31 December 2016.► Asia-Pacific-ASEAN deals refer to deals involving businesses in ASEAN, Hong Kong, India, Mainland China, Japan, South Korea and
Taiwan.► Intra-ASEAN deals refer to cross-border deals among ASEAN members.► International-ASEAN deals refer to deals involving businesses in ASEAN and the rest of the world (exclude Asia).
Source: ► Deals: result details, 2016, Mergermarket
Page 11 Rediscover ASEAN: a growth story of 10 countries
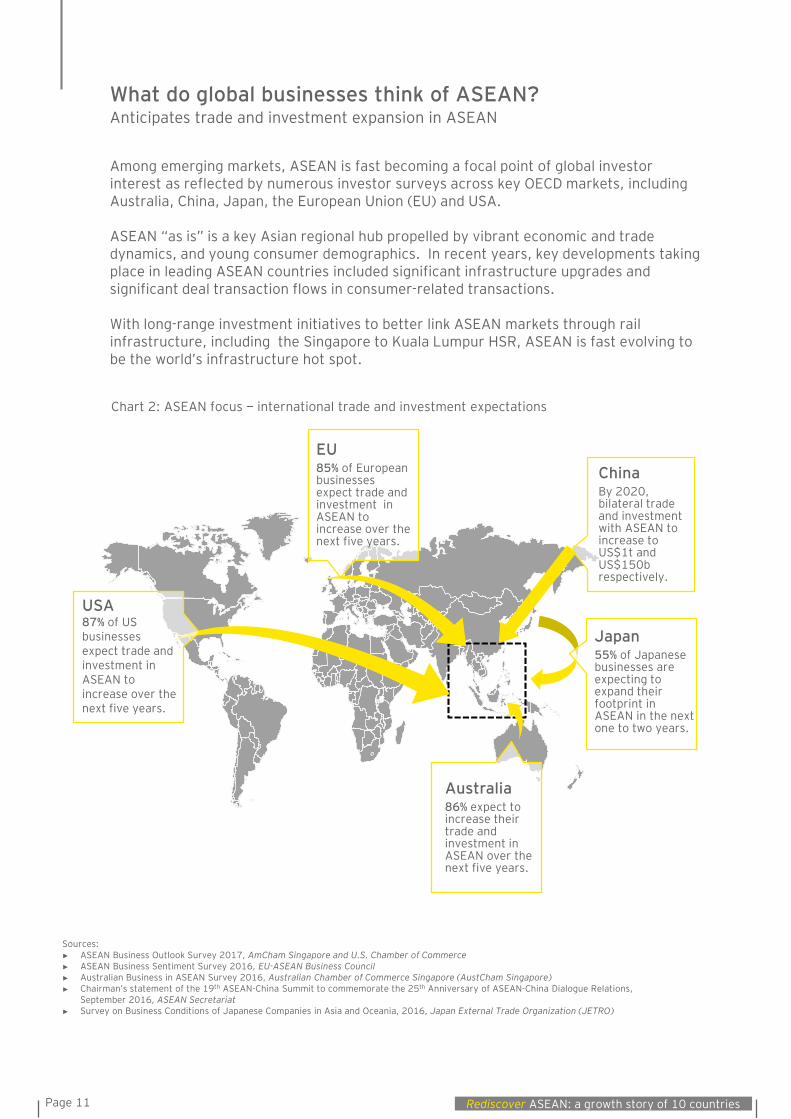
What do global businesses think of ASEAN?Anticipates trade and investment expansion in ASEAN
Among emerging markets, ASEAN is fast becoming a focal point of global investor interest as reflected by numerous investor surveys across key OECD markets, including Australia, China, Japan, the European Union (EU) and USA.
ASEAN “as is” is a key Asian regional hub propelled by vibrant economic and trade dynamics, and young consumer demographics. In recent years, key developments taking place in leading ASEAN countries included significant infrastructure upgrades and significant deal transaction flows in consumer-related transactions.
With long-range investment initiatives to better link ASEAN markets through rail infrastructure, including the Singapore to Kuala Lumpur HSR, ASEAN is fast evolving to be the world’s infrastructure hot spot.
Chart 2: ASEAN focus − international trade and investment expectations
Japan55% of Japanese businesses are expecting to expand their footprint in ASEAN in the next one to two years.
ChinaBy 2020, bilateral trade and investment with ASEAN to increase to US$1t and US$150b respectively.
EU85% of European businesses expect trade and investment in ASEAN to increase over the next five years.
USA87% of US businesses expect trade and investment in ASEAN to increase over the next five years.
Australia86% expect to increase their trade and investment in ASEAN over the next five years.
Sources:► ASEAN Business Outlook Survey 2017, AmCham Singapore and U.S. Chamber of Commerce► ASEAN Business Sentiment Survey 2016, EU-ASEAN Business Council► Australian Business in ASEAN Survey 2016, Australian Chamber of Commerce Singapore (AustCham Singapore)► Chairman’s statement of the 19th ASEAN-China Summit to commemorate the 25th Anniversary of ASEAN-China Dialogue Relations,
September 2016, ASEAN Secretariat► Survey on Business Conditions of Japanese Companies in Asia and Oceania, 2016, Japan External Trade Organization (JETRO)

Page 13 Rediscover ASEAN: a growth story of 10 countries
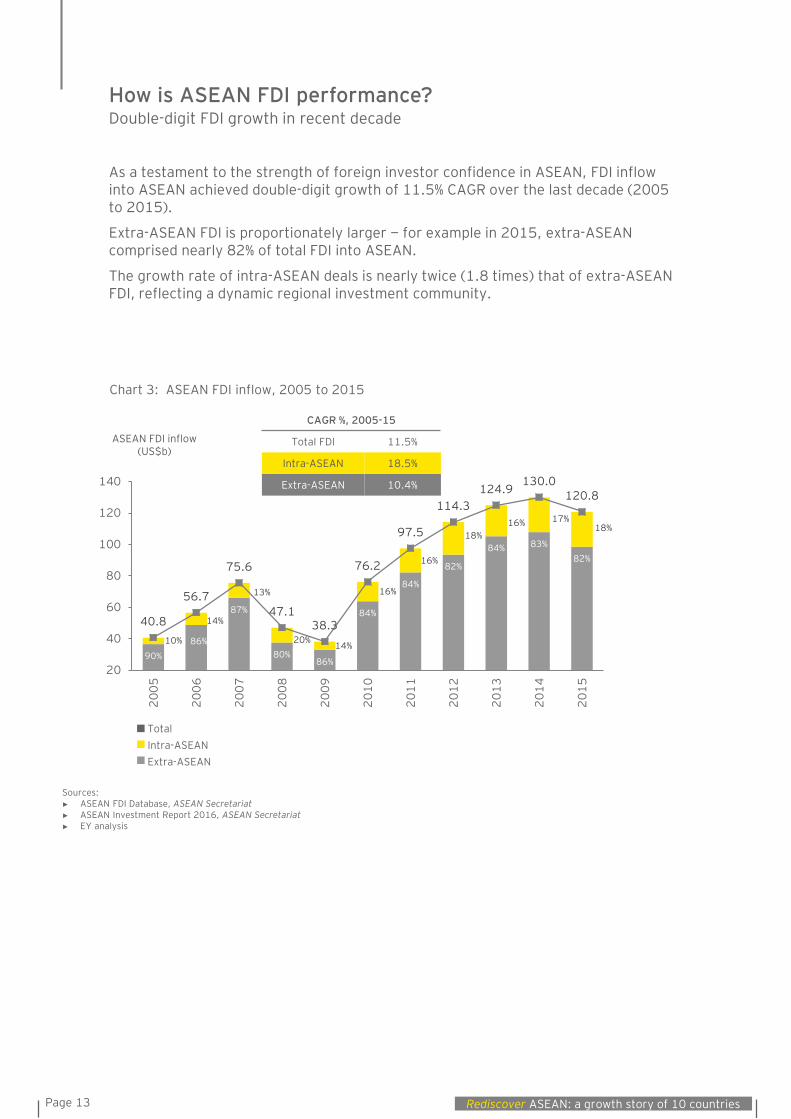
Chart 3: ASEAN FDI inflow, 2005 to 2015
Intra-ASEANExtra-ASEAN
Total
How is ASEAN FDI performance?Double-digit FDI growth in recent decade
As a testament to the strength of foreign investor confidence in ASEAN, FDI inflow into ASEAN achieved double-digit growth of 11.5% CAGR over the last decade (2005 to 2015).
Extra-ASEAN FDI is proportionately larger − for example in 2015, extra-ASEAN comprised nearly 82% of total FDI into ASEAN.
The growth rate of intra-ASEAN deals is nearly twice (1.8 times) that of extra-ASEAN FDI, reflecting a dynamic regional investment community.
90%86%
87%
80%86%
84%
84%
82%
84% 83%82%
10%
14%
13%
20% 14%
16%
16%
18%16% 17%
18%
40.8
56.7
75.6
47.138.3
76.2
97.5
114.3124.9
130.0120.8
20
40
60
80
100
120
140
2005
2006
2007
2008
2009
2010
2011
2012
2013
2014
2015
ASEAN FDI inflow (US$b)
CAGR %, 2005-15
Total FDI 11.5%
Intra-ASEAN 18.5%
Extra-ASEAN 10.4%
Sources: ► ASEAN FDI Database, ASEAN Secretariat► ASEAN Investment Report 2016, ASEAN Secretariat► EY analysis
Page 14Rediscover ASEAN: a growth story of 10 countries
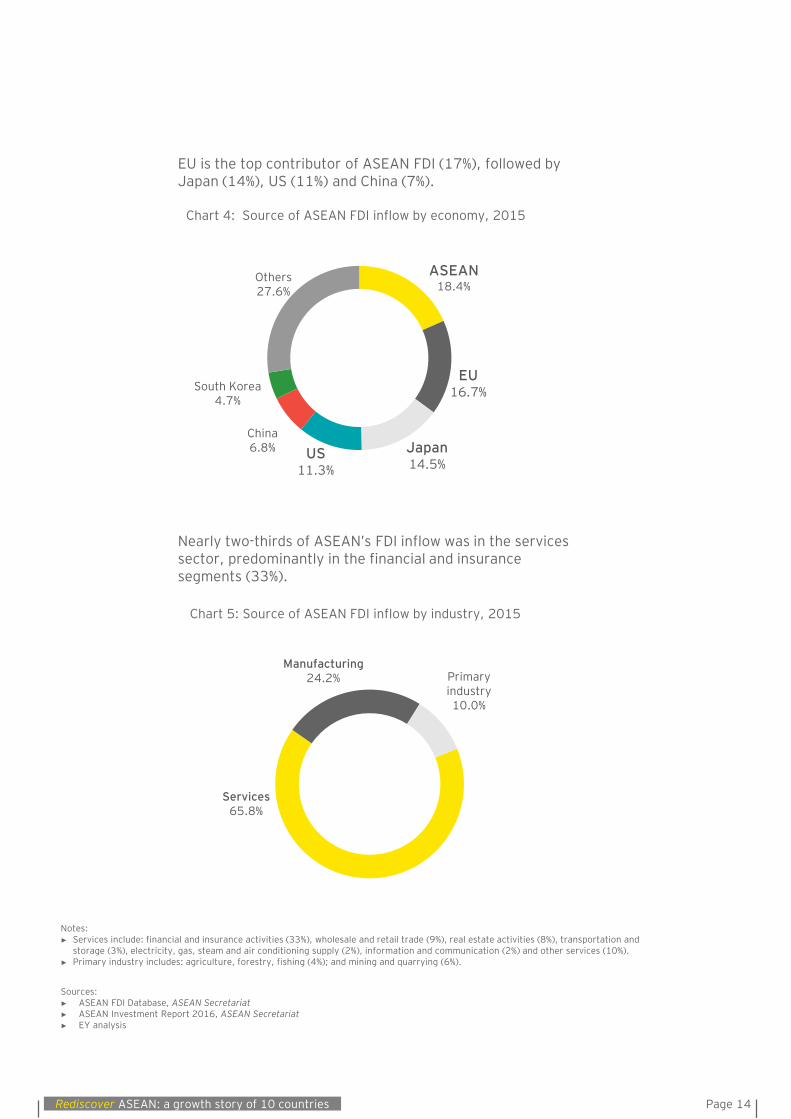
EU is the top contributor of ASEAN FDI (17%), followed by Japan (14%), US (11%) and China (7%).
ASEAN18.4%
EU16.7%
Japan14.5%
US11.3%
China6.8%
South Korea4.7%
Others27.6%
Chart 4: Source of ASEAN FDI inflow by economy, 2015
Services65.8%
Manufacturing24.2% Primary
industry10.0%
Chart 5: Source of ASEAN FDI inflow by industry, 2015
Nearly two-thirds of ASEAN’s FDI inflow was in the services sector, predominantly in the financial and insurance segments (33%).
Notes:► Services include: financial and insurance activities (33%), wholesale and retail trade (9%), real estate activities (8%), transportation and
storage (3%), electricity, gas, steam and air conditioning supply (2%), information and communication (2%) and other services (10%).► Primary industry includes: agriculture, forestry, fishing (4%); and mining and quarrying (6%).
Sources: ► ASEAN FDI Database, ASEAN Secretariat► ASEAN Investment Report 2016, ASEAN Secretariat► EY analysis
Page 15 Rediscover ASEAN: a growth story of 10 countries
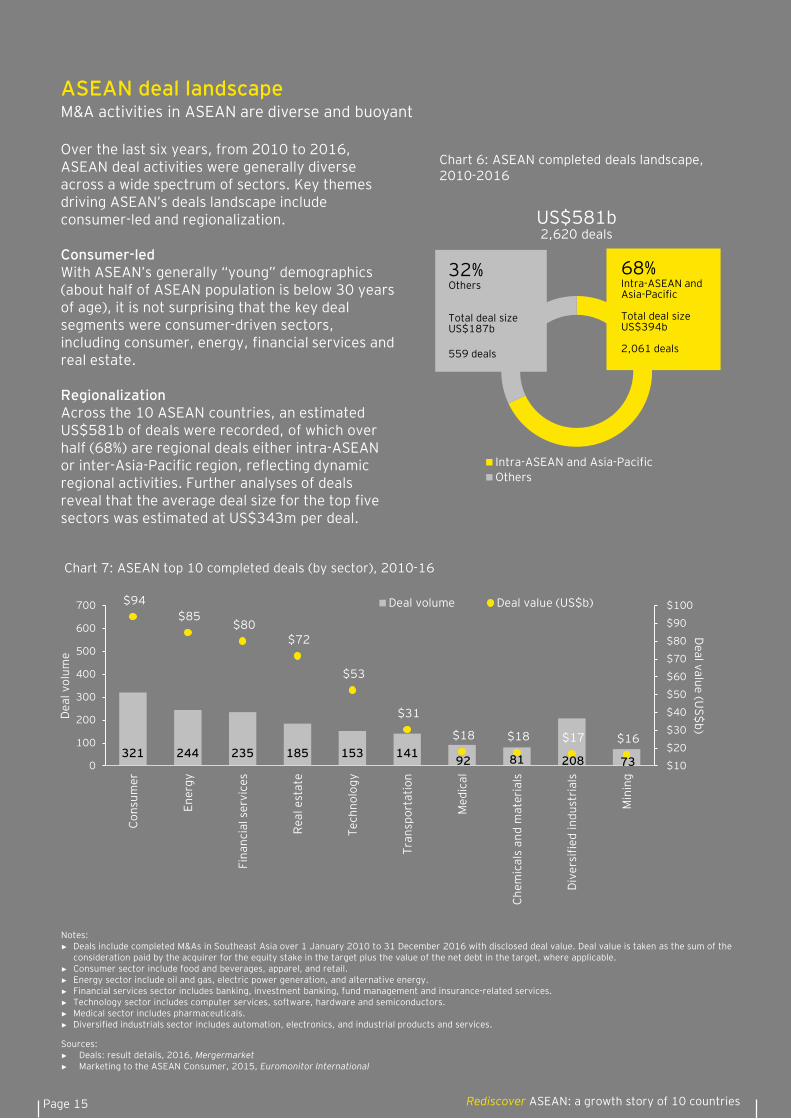
Over the last six years, from 2010 to 2016, ASEAN deal activities were generally diverse across a wide spectrum of sectors. Key themes driving ASEAN’s deals landscape include consumer-led and regionalization.
Consumer-led With ASEAN’s generally “young” demographics (about half of ASEAN population is below 30 years of age), it is not surprising that the key deal segments were consumer-driven sectors, including consumer, energy, financial services and real estate.
RegionalizationAcross the 10 ASEAN countries, an estimated US$581b of deals were recorded, of which over half (68%) are regional deals either intra-ASEAN or inter-Asia-Pacific region, reflecting dynamic regional activities. Further analyses of deals reveal that the average deal size for the top five sectors was estimated at US$343m per deal.
Chart 6: ASEAN completed deals landscape, 2010-2016
Chart 7: ASEAN top 10 completed deals (by sector), 2010-16
Intra-ASEAN and Asia-PacificOthers
US$581b2,620 deals
68%Intra-ASEAN and Asia-Pacific
Total deal sizeUS$394b
2,061 deals
32%Others
Total deal sizeUS$187b
559 deals
321 244 235 185 153 141 92 81 208 73
$94 $85
$80 $72
$53
$31
$18 $18 $17 $16
$10
$20
$30
$40
$50
$60
$70
$80
$90
$100
0
100
200
300
400
500
600
700
Cons
umer
Ener
gy
Fina
ncia
l ser
vice
s
Rea
l est
ate
Tech
nolo
gy
Tran
spor
tatio
n
Med
ical
Chem
ical
s an
d m
ater
ials
Div
ersi
fied
indu
stri
als
Min
ing
Deal value (U
S$b)
Dea
l vol
ume
Deal volume Deal value (US$b)
ASEAN deal landscapeM&A activities in ASEAN are diverse and buoyant
Sources: ► Deals: result details, 2016, Mergermarket► Marketing to the ASEAN Consumer, 2015, Euromonitor International
Notes:► Deals include completed M&As in Southeast Asia over 1 January 2010 to 31 December 2016 with disclosed deal value. Deal value is taken as the sum of the
consideration paid by the acquirer for the equity stake in the target plus the value of the net debt in the target, where applicable. ► Consumer sector include food and beverages, apparel, and retail.► Energy sector include oil and gas, electric power generation, and alternative energy.► Financial services sector includes banking, investment banking, fund management and insurance-related services. ► Technology sector includes computer services, software, hardware and semiconductors.► Medical sector includes pharmaceuticals.► Diversified industrials sector includes automation, electronics, and industrial products and services.
Page 16Rediscover ASEAN: a growth story of 10 countries
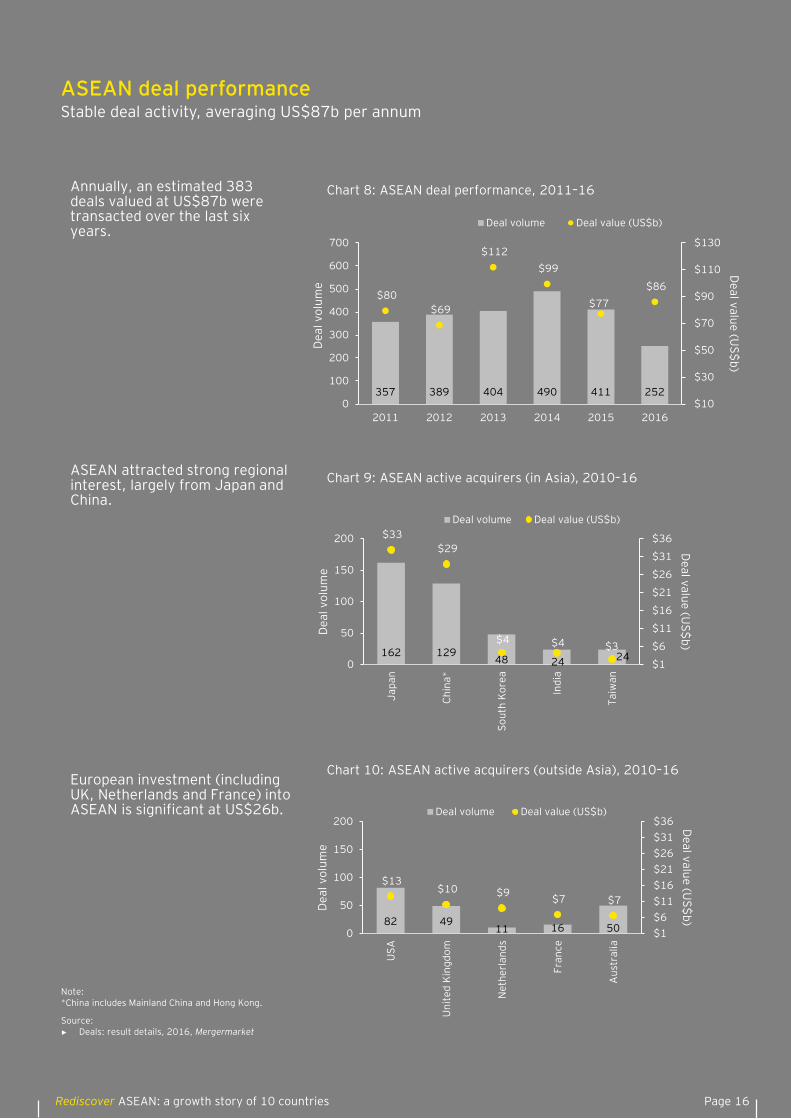
Annually, an estimated 383 deals valued at US$87b were transacted over the last six years.
Chart 8: ASEAN deal performance, 2011–16
Chart 9: ASEAN active acquirers (in Asia), 2010–16ASEAN attracted strong regional interest, largely from Japan and China.
357 389 404 490 411 252
$80 $69
$112 $99
$77 $86
$10
$30
$50
$70
$90
$110
$130
0
100
200
300
400
500
600
700
2011 2012 2013 2014 2015 2016
Deal value (U
S$b)
Dea
l vol
ume
Deal volume Deal value (US$b)
162 12948 24 24
$33 $29
$4 $4 $3
$1
$6
$11
$16
$21
$26
$31
$36
0
50
100
150
200
Japa
n
Chin
a*
Sout
h Ko
rea
Indi
a
Taiw
an
Deal value (U
S$b)
Dea
l vol
ume
Deal volume Deal value (US$b)
82 4911 16 50
$13 $10 $9 $7 $7
$1 $6 $11 $16 $21 $26 $31 $36
0
50
100
150
200
USA
Uni
ted
King
dom
Net
herl
ands
Fran
ce
Aus
tral
ia
Deal value (U
S$b)
Dea
l vol
ume
Deal volume Deal value (US$b)
Chart 10: ASEAN active acquirers (outside Asia), 2010–16
ASEAN deal performanceStable deal activity, averaging US$87b per annum
European investment (including UK, Netherlands and France) into ASEAN is significant at US$26b.
Source: ► Deals: result details, 2016, Mergermarket
Note:*China includes Mainland China and Hong Kong.
Ultimately, ASEAN is one of the few regions that still has robust fundamentals — it has three stages of economic development, from advanced to developing to emerging economies which excite investors. Businesses need to hold a long-term view of their prospects in the region.
Vikram Chakravarty EY AseanTransactions Advisory Services Leader
“
“
Page 18Rediscover ASEAN: a growth story of 10 countries
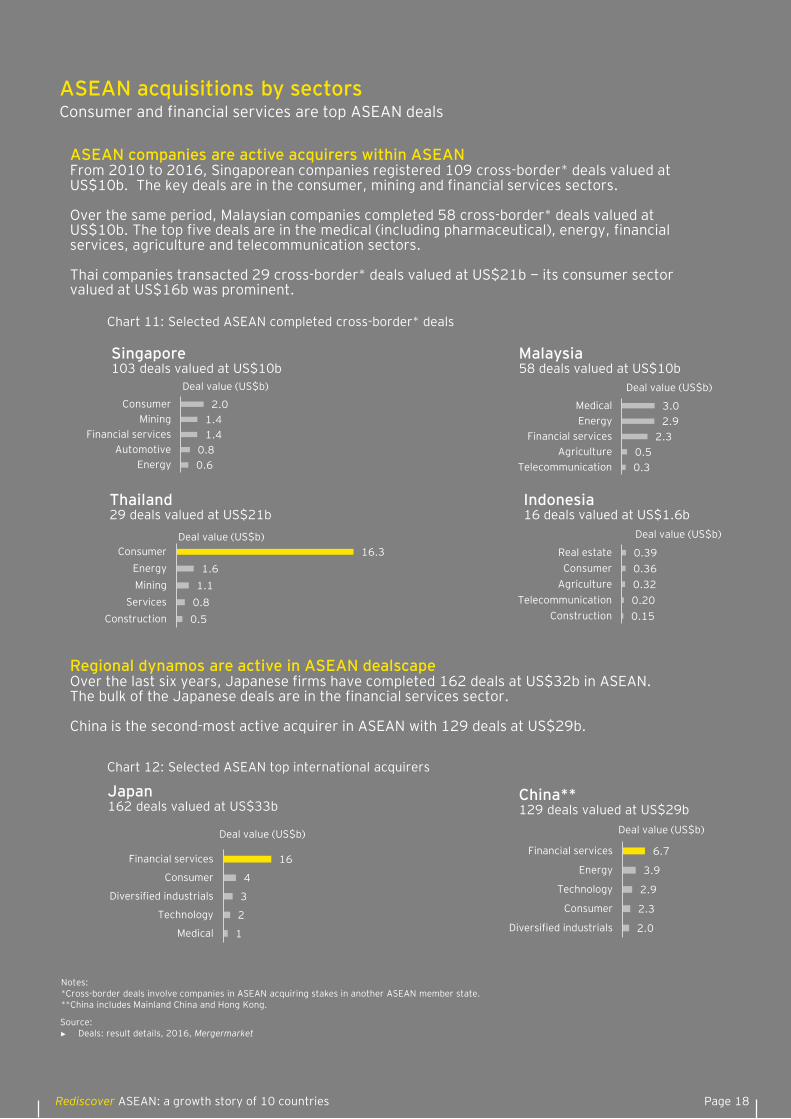
ASEAN companies are active acquirers within ASEANFrom 2010 to 2016, Singaporean companies registered 109 cross-border* deals valued at US$10b. The key deals are in the consumer, mining and financial services sectors.
Over the same period, Malaysian companies completed 58 cross-border* deals valued at US$10b. The top five deals are in the medical (including pharmaceutical), energy, financial services, agriculture and telecommunication sectors.
Thai companies transacted 29 cross-border* deals valued at US$21b − its consumer sector valued at US$16b was prominent.
Malaysia58 deals valued at US$10b
Singapore103 deals valued at US$10b
16
4
3
2
1
Financial services
Consumer
Diversified industrials
Technology
Medical
Deal value (US$b)6.7
3.9
2.9
2.3
2.0
Financial services
Energy
Technology
Consumer
Diversified industrials
Deal value (US$b)
Chart 11: Selected ASEAN completed cross-border* deals
0.390.360.320.200.15
Real estateConsumer
AgricultureTelecommunication
Construction
Deal value (US$b)
2.01.41.4
0.80.6
ConsumerMining
Financial servicesAutomotive
Energy
Deal value (US$b)
3.02.9
2.30.50.3
MedicalEnergy
Financial servicesAgriculture
Telecommunication
Deal value (US$b)
16.31.6
1.10.80.5
ConsumerEnergyMining
ServicesConstruction
Deal value (US$b)
Regional dynamos are active in ASEAN dealscape Over the last six years, Japanese firms have completed 162 deals at US$32b in ASEAN. The bulk of the Japanese deals are in the financial services sector.
China is the second-most active acquirer in ASEAN with 129 deals at US$29b.
Chart 12: Selected ASEAN top international acquirers
ASEAN acquisitions by sectorsConsumer and financial services are top ASEAN deals
Indonesia16 deals valued at US$1.6b
Thailand29 deals valued at US$21b
Japan162 deals valued at US$33b
China**129 deals valued at US$29b
Source: ► Deals: result details, 2016, Mergermarket
Notes:*Cross-border deals involve companies in ASEAN acquiring stakes in another ASEAN member state.**China includes Mainland China and Hong Kong.
Page 19 Rediscover ASEAN: a growth story of 10 countries
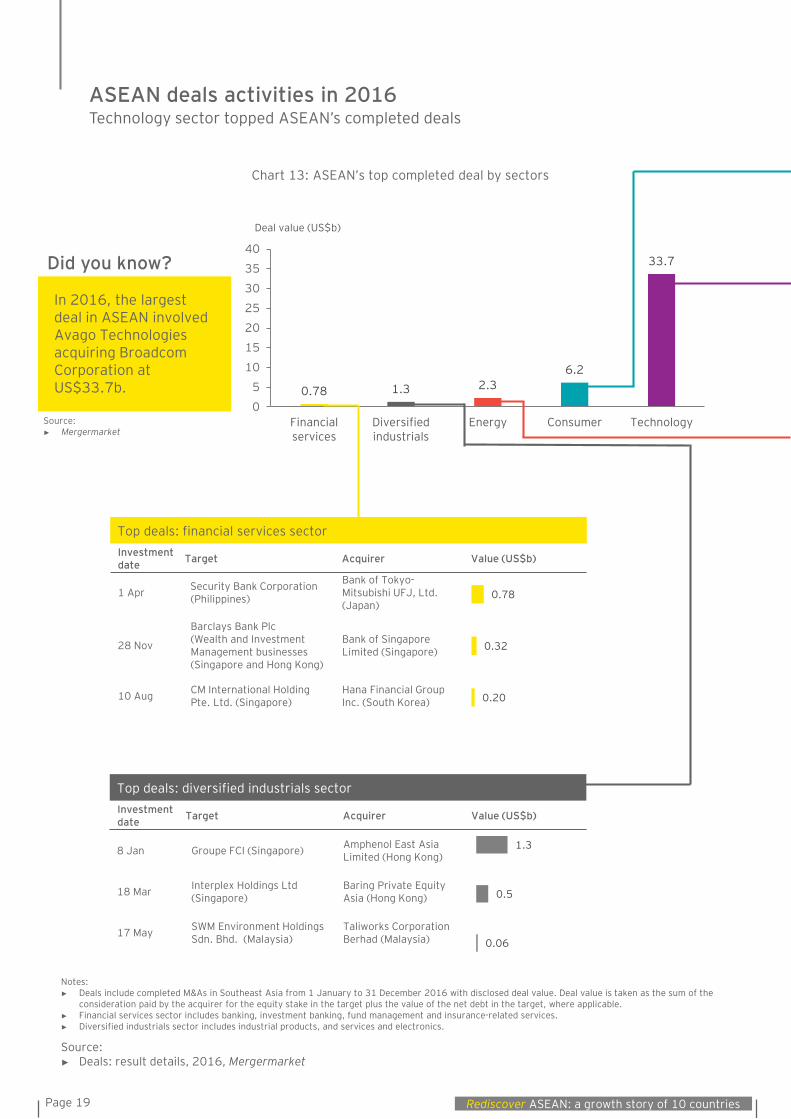
0.78 1.3 2.36.2
33.7
0
5
10
15
20
25
30
35
40
Financialservices
Diversifiedindustrials
Energy Consumer Technology
Deal value (US$b)
Top deals: financial services sectorInvestment date Target Acquirer Value (US$b)
1 Apr Security Bank Corporation (Philippines)
Bank of Tokyo-Mitsubishi UFJ, Ltd. (Japan)
28 Nov
Barclays Bank Plc (Wealth and Investment Management businesses (Singapore and Hong Kong)
Bank of Singapore Limited (Singapore)
10 Aug CM International Holding Pte. Ltd. (Singapore)
Hana Financial Group Inc. (South Korea)
Top deals: diversified industrials sectorInvestment date Target Acquirer Value (US$b)
8 Jan Groupe FCI (Singapore) Amphenol East Asia Limited (Hong Kong)
18 Mar Interplex Holdings Ltd (Singapore)
Baring Private Equity Asia (Hong Kong)
17 May SWM Environment Holdings Sdn. Bhd. (Malaysia)
Taliworks Corporation Berhad (Malaysia)
Chart 13: ASEAN’s top completed deal by sectors
ASEAN deals activities in 2016Technology sector topped ASEAN’s completed deals
In 2016, the largest deal in ASEAN involved Avago Technologies acquiring Broadcom Corporation at US$33.7b.
Did you know?
Source: ► Deals: result details, 2016, Mergermarket
Notes:► Deals include completed M&As in Southeast Asia from 1 January to 31 December 2016 with disclosed deal value. Deal value is taken as the sum of the
consideration paid by the acquirer for the equity stake in the target plus the value of the net debt in the target, where applicable. ► Financial services sector includes banking, investment banking, fund management and insurance-related services.► Diversified industrials sector includes industrial products, and services and electronics.
Source: ► Mergermarket
0.20
0.32
0.78
0.06
0.5
1.3
Page 20Rediscover ASEAN: a growth story of 10 countries
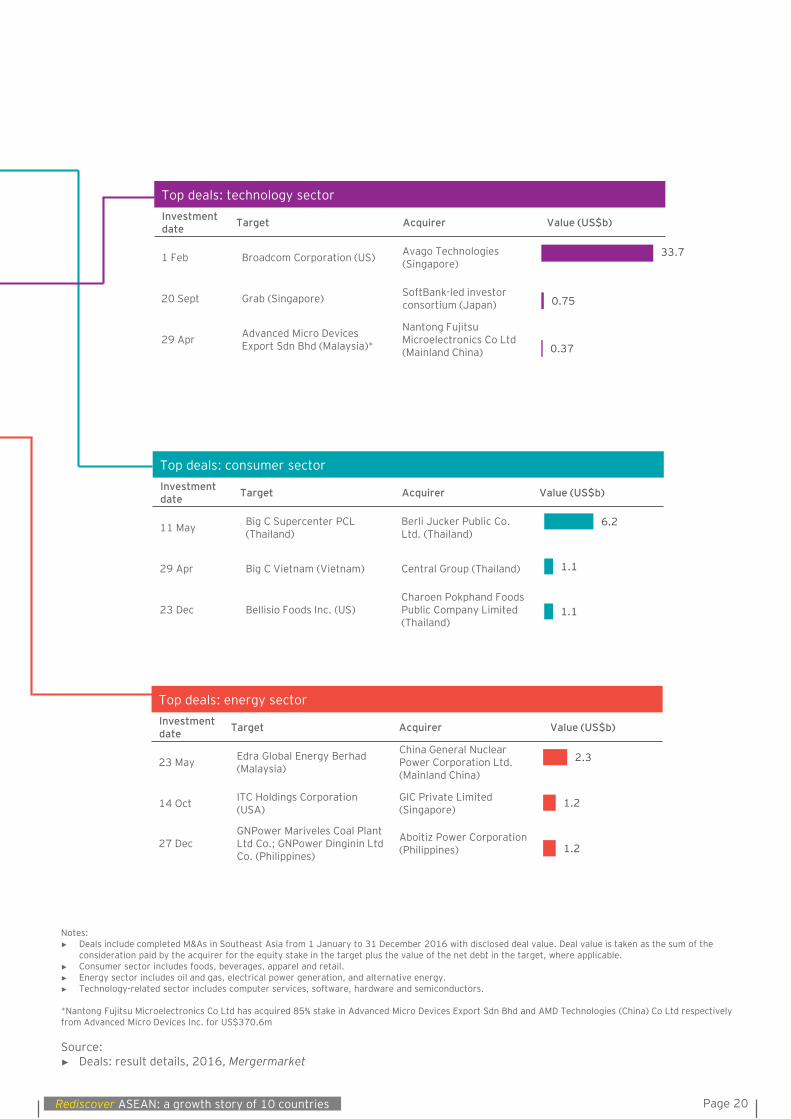
Top deals: energy sectorInvestment date Target Acquirer Value (US$b)
23 May Edra Global Energy Berhad (Malaysia)
China General Nuclear Power Corporation Ltd.(Mainland China)
14 Oct ITC Holdings Corporation (USA)
GIC Private Limited (Singapore)
27 DecGNPower Mariveles Coal Plant Ltd Co.; GNPower Dinginin Ltd Co. (Philippines)
Aboitiz Power Corporation (Philippines)
Top deals: consumer sectorInvestment date Target Acquirer Value (US$b)
11 May Big C Supercenter PCL (Thailand)
Berli Jucker Public Co. Ltd. (Thailand)
29 Apr Big C Vietnam (Vietnam) Central Group (Thailand)
23 Dec Bellisio Foods Inc. (US)Charoen Pokphand Foods Public Company Limited (Thailand)
Top deals: technology sectorInvestment date Target Acquirer Value (US$b)
1 Feb Broadcom Corporation (US) Avago Technologies (Singapore)
20 Sept Grab (Singapore) SoftBank-led investor consortium (Japan)
29 Apr Advanced Micro Devices Export Sdn Bhd (Malaysia)*
Nantong Fujitsu Microelectronics Co Ltd (Mainland China)
Source:► Deals: result details, 2016, Mergermarket
Notes:► Deals include completed M&As in Southeast Asia from 1 January to 31 December 2016 with disclosed deal value. Deal value is taken as the sum of the
consideration paid by the acquirer for the equity stake in the target plus the value of the net debt in the target, where applicable. ► Consumer sector includes foods, beverages, apparel and retail.► Energy sector includes oil and gas, electrical power generation, and alternative energy.► Technology-related sector includes computer services, software, hardware and semiconductors.
*Nantong Fujitsu Microelectronics Co Ltd has acquired 85% stake in Advanced Micro Devices Export Sdn Bhd and AMD Technologies (China) Co Ltd respectively from Advanced Micro Devices Inc. for US$370.6m
0.37
0.75
33.7
1.1
1.1
6.2
1.2
1.2
2.3
Economic dynamics
Page 22Rediscover ASEAN: a growth story of 10 countries
0%2%4%6%8%
10%12%14%16%
2005
2006
2007
2008
2009
2010
2011
2012
2013
2014
2015
2016
e
2017
2018
2019
2020
2021
GDP growth (%)
Last 10 years Next five years
2005–15GDP CAGR (%)
2016–21Forecast GDP CAGR (%)
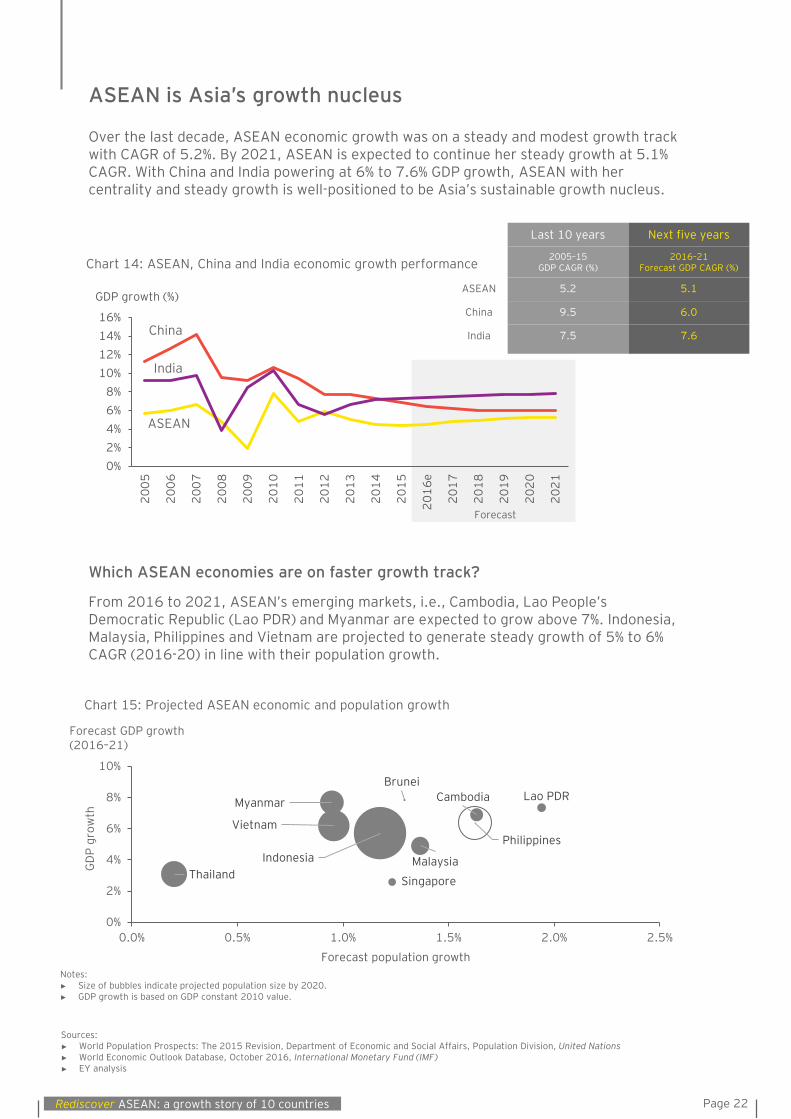
ASEAN 5.2 5.1
China 9.5 6.0
India 7.5 7.6
Over the last decade, ASEAN economic growth was on a steady and modest growth track with CAGR of 5.2%. By 2021, ASEAN is expected to continue her steady growth at 5.1% CAGR. With China and India powering at 6% to 7.6% GDP growth, ASEAN with her centrality and steady growth is well-positioned to be Asia’s sustainable growth nucleus.
Chart 15: Projected ASEAN economic and population growth
From 2016 to 2021, ASEAN’s emerging markets, i.e., Cambodia, Lao People’s Democratic Republic (Lao PDR) and Myanmar are expected to grow above 7%. Indonesia, Malaysia, Philippines and Vietnam are projected to generate steady growth of 5% to 6% CAGR (2016-20) in line with their population growth.
Which ASEAN economies are on faster growth track?
Forecast
Chart 14: ASEAN, China and India economic growth performance
Sources: ► World Population Prospects: The 2015 Revision, Department of Economic and Social Affairs, Population Division, United Nations► World Economic Outlook Database, October 2016, International Monetary Fund (IMF)► EY analysis
BruneiCambodia
Indonesia
Lao PDR
Malaysia
Myanmar
Philippines
SingaporeThailand
Vietnam
0%
2%
4%
6%
8%
10%
0.0% 0.5% 1.0% 1.5% 2.0% 2.5%
Forecast population growth
GD
P gr
owth
Forecast GDP growth(2016–21)
Notes: ► Size of bubbles indicate projected population size by 2020.► GDP growth is based on GDP constant 2010 value.
ASEAN is Asia’s growth nucleus
India
China
ASEAN

Page 23 Rediscover ASEAN: a growth story of 10 countries
113
154
115
154
48
47
41
45
23
31
5
6
345
238
228
212
122
106
94
91
58
52
13
12
Mainland China
Japan
EU
US
South Korea
Middle East
Taiwan
Hong Kong
India
Australia
Russia
Canada
Trade value (US$b)
2005 2015
CAGR %, 2005-15
Total trade 6.4%
Extra-ASEAN 6.0%
Intra-ASEAN 6.5%
1,225 1,405
1,611 1,897
1,537
2,009
2,388 2,476 2,512 2,529 2,270
305 353 402 470 376 511 598 602 609 608 544
920 1,052
1,209 1,427
1,161
1,498 1,790 1,874 1,903 1,920
1,726
-
500
1,000
1,500
2,000
2,500
3,000
2005
2006
2007
2008
2009
2010
2011
2012
2013
2014
2015
US$b
Chart 16: ASEAN trade trends
Total trade
Extra-ASEAN
Intra-ASEAN
Rank
2005 2015
4 1
1 2
3 3 -
2 4
5 5 -
6 6 -
8 7
7 8
10 9
9 10
12 11
11 12
CAGR %, 2005–15
12%
4%
7%
3%
10%
8%
9%
7%
10%
5%
10%
7%
ASEAN trade linkages with the rest of the world is well-entrenched, as reflected by ASEAN’s trade with over 230 markets globally. Over the last decade, ASEAN’s total trade increased steadily by 6.4% CAGR to US$2.3t in 2015. Intra-ASEAN trade also grew at a steady pace of 6.5%.
With the wider integration of economic activities within the ASEAN Economic Community (AEC), there is higher upside for intra-ASEAN trade growth. In the longer term, the RCEP involving ASEAN, Australia, China, India, New Zealand, Japan and South Korea may spur wider regional trade growth.
Mainland China’s ranking as ASEAN’s key trading partner rose to the top position.
ASEAN’s other key trade partners include Japan, EU and US.
Chart 17: ASEAN’s key trading partners
Who are ASEAN’s key trading partners?
Sources: ► ASEAN Statistical Yearbook 2015, The ASEAN Secretariat► ASEAN External Trade Statistics, 2005 and 2015, The ASEAN Secretariat► EY analysis
Notes:► Some figures may not add up to 100% due to rounding errors.► EU includes Austria, Belgium, Cyprus, Czech Republic, Denmark, Estonia, Finland, France, Germany, Greece, Hungary, Ireland, Italy, Latvia, Lithuania,
Luxembourg, Malta, Netherlands, Poland, Portugal, Slovakia, Slovenia, Spain, Sweden, United Kingdom and Croatia.► Middle East includes Bahrain, Egypt, Iran, Iraq, Israel, Jordan, Kuwait, Lebanon, Oman, Qatar, Saudi Arabia, Syria, Turkey, United Arab Emirates and Yemen.
ASEAN’s expanding trade with global economies
Page 24Rediscover ASEAN: a growth story of 10 countries
683 967 1,376
708 1,249
1,851 1,818 2,279 2,203 2,379
2,023 2,198
500
1,000
1,500
2,000
2,500
2005
2006
2007
2008
2009
2010
2011
2012
2013
2014
2015
2016
US$b
265 334 416 404
486 604 635
761 753 777 712 757
103 131 163 171 191 233 249
311 317 333 324 340
368 464 579 575 677 836 885
1,072 1,070 1,111 1,036 1,097
-
500
1,000
1,500
2,000
2,500
2005
2006
2007
2008
2009
2010
2011
2012
2013
2014
2015
2016
US$bCorporate
Government
Total outstandingbonds
CAGR %, 2005–16
Total 10.4%
Corporate 11.5%
Government 10.0%
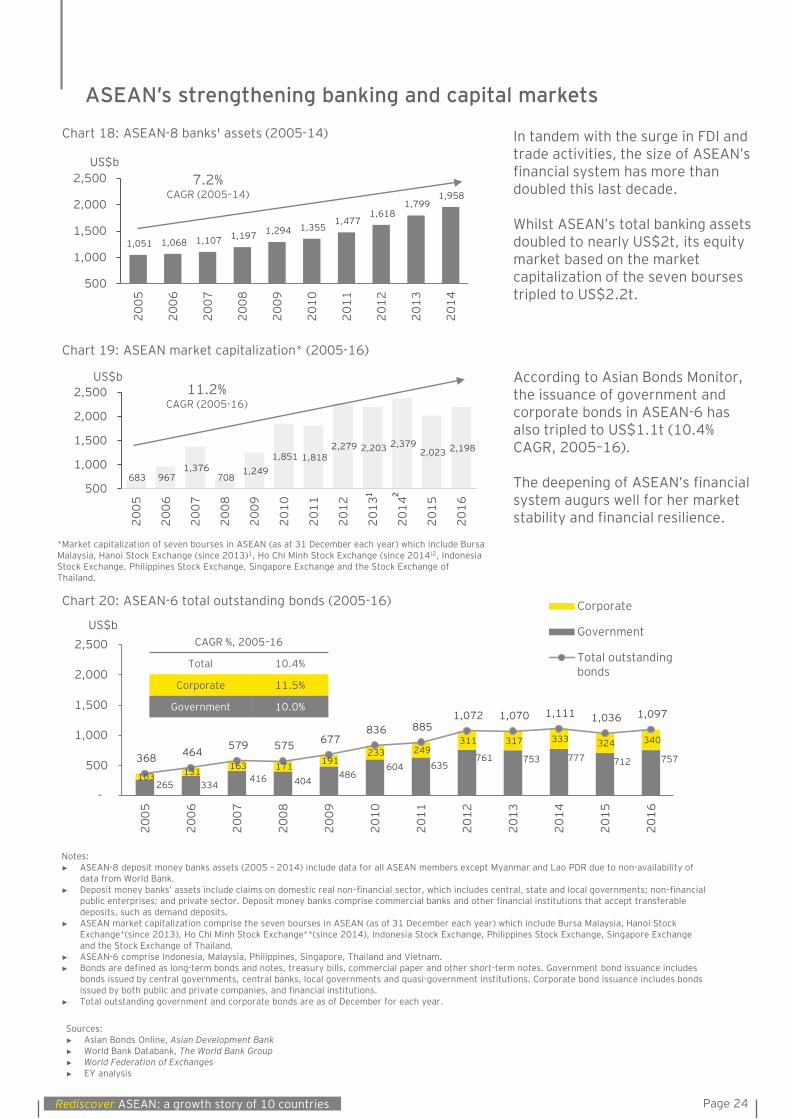
Chart 20: ASEAN-6 total outstanding bonds (2005-16)
Chart 18: ASEAN-8 banks' assets (2005-14)
1,051 1,068 1,107 1,197 1,294 1,355 1,477
1,618 1,799
1,958
500
1,000
1,500
2,000
2,500
2005
2006
2007
2008
2009
2010
2011
2012
2013
2014
US$b7.2%
CAGR (2005–14)
11.2%CAGR (2005-16)
Chart 19: ASEAN market capitalization* (2005-16)
In tandem with the surge in FDI and trade activities, the size of ASEAN’s financial system has more than doubled this last decade.
Whilst ASEAN’s total banking assets doubled to nearly US$2t, its equity market based on the market capitalization of the seven bourses tripled to US$2.2t.
Sources:► Asian Bonds Online, Asian Development Bank► World Bank Databank, The World Bank Group► World Federation of Exchanges► EY analysis
Notes:► ASEAN-8 deposit money banks assets (2005 – 2014) include data for all ASEAN members except Myanmar and Lao PDR due to non-availability of
data from World Bank.► Deposit money banks’ assets include claims on domestic real non–financial sector, which includes central, state and local governments; non–financial
public enterprises; and private sector. Deposit money banks comprise commercial banks and other financial institutions that accept transferable deposits, such as demand deposits.
► ASEAN market capitalization comprise the seven bourses in ASEAN (as of 31 December each year) which include Bursa Malaysia, Hanoi Stock Exchange*(since 2013), Ho Chi Minh Stock Exchange**(since 2014), Indonesia Stock Exchange, Philippines Stock Exchange, Singapore Exchange and the Stock Exchange of Thailand.
► ASEAN-6 comprise Indonesia, Malaysia, Philippines, Singapore, Thailand and Vietnam.► Bonds are defined as long-term bonds and notes, treasury bills, commercial paper and other short-term notes. Government bond issuance includes
bonds issued by central governments, central banks, local governments and quasi-government institutions. Corporate bond issuance includes bonds issued by both public and private companies, and financial institutions.
► Total outstanding government and corporate bonds are as of December for each year.
ASEAN’s strengthening banking and capital markets
According to Asian Bonds Monitor, the issuance of government and corporate bonds in ASEAN-6 has also tripled to US$1.1t (10.4% CAGR, 2005–16).
The deepening of ASEAN’s financial system augurs well for her market stability and financial resilience.
*Market capitalization of seven bourses in ASEAN (as at 31 December each year) which include Bursa Malaysia, Hanoi Stock Exchange (since 2013)1, Ho Chi Minh Stock Exchange (since 2014)2, Indonesia Stock Exchange, Philippines Stock Exchange, Singapore Exchange and the Stock Exchange of Thailand.
1 2

Infrastructure progress

Page 27 Rediscover ASEAN: a growth story of 10 countries
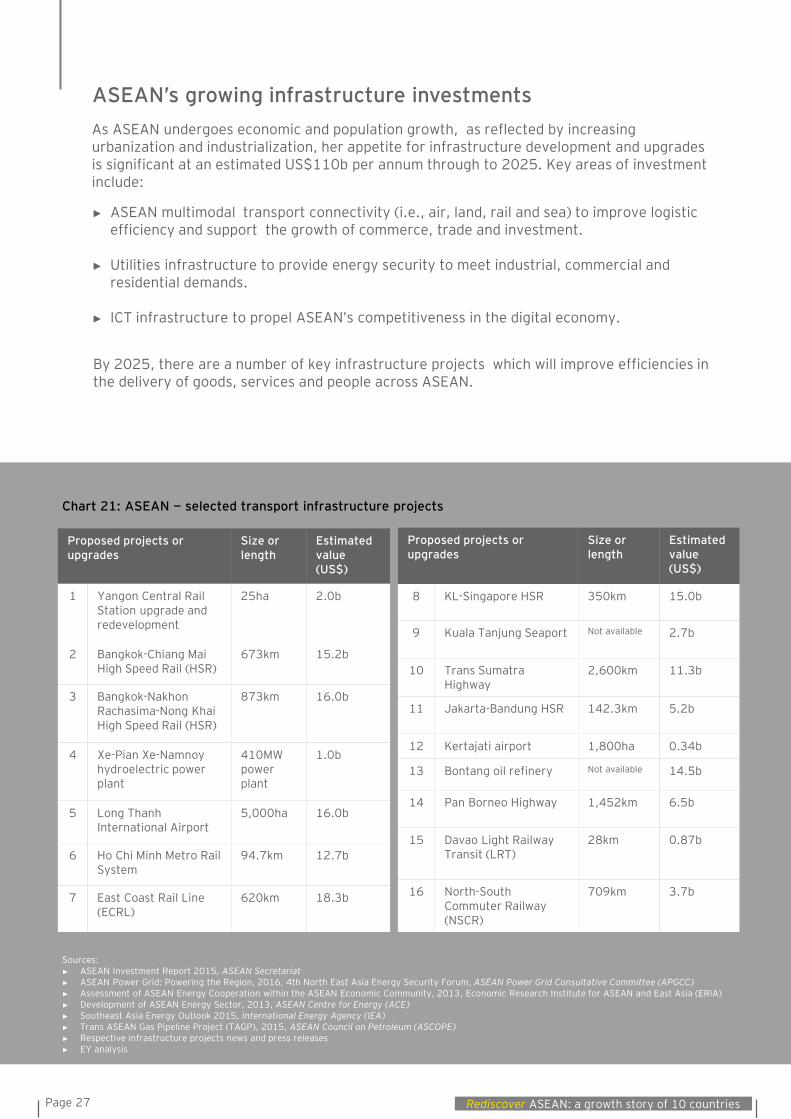
As ASEAN undergoes economic and population growth, as reflected by increasing urbanization and industrialization, her appetite for infrastructure development and upgrades is significant at an estimated US$110b per annum through to 2025. Key areas of investment include:
By 2025, there are a number of key infrastructure projects which will improve efficiencies in the delivery of goods, services and people across ASEAN.
► ASEAN multimodal transport connectivity (i.e., air, land, rail and sea) to improve logistic efficiency and support the growth of commerce, trade and investment.
► Utilities infrastructure to provide energy security to meet industrial, commercial and residential demands.
► ICT infrastructure to propel ASEAN’s competitiveness in the digital economy.
ASEAN’s growing infrastructure investments
Proposed projects or upgrades
Size or length
Estimated value(US$)
1 Yangon Central Rail Station upgrade and redevelopment
25ha 2.0b
2 Bangkok-Chiang Mai High Speed Rail (HSR)
673km 15.2b
3 Bangkok-NakhonRachasima-Nong Khai High Speed Rail (HSR)
873km 16.0b
4 Xe-Pian Xe-Namnoy hydroelectric power plant
410MW powerplant
1.0b
5 Long Thanh International Airport
5,000ha 16.0b
6 Ho Chi Minh Metro Rail System
94.7km 12.7b
7 East Coast Rail Line (ECRL)
620km 18.3b
Proposed projects or upgrades
Size or length
Estimated value(US$)
8 KL-Singapore HSR 350km 15.0b
9 Kuala Tanjung Seaport Not available 2.7b
10 Trans Sumatra Highway
2,600km 11.3b
11 Jakarta-Bandung HSR 142.3km 5.2b
12 Kertajati airport 1,800ha 0.34b
13 Bontang oil refinery Not available 14.5b
14 Pan Borneo Highway 1,452km 6.5b
15 Davao Light RailwayTransit (LRT)
28km 0.87b
16 North-South Commuter Railway(NSCR)
709km 3.7b
Chart 21: ASEAN − selected transport infrastructure projects
Sources:► ASEAN Investment Report 2015, ASEAN Secretariat► ASEAN Power Grid: Powering the Region, 2016, 4th North East Asia Energy Security Forum, ASEAN Power Grid Consultative Committee (APGCC)► Assessment of ASEAN Energy Cooperation within the ASEAN Economic Community, 2013, Economic Research Institute for ASEAN and East Asia (ERIA)► Development of ASEAN Energy Sector, 2013, ASEAN Centre for Energy (ACE)► Southeast Asia Energy Outlook 2015, International Energy Agency (IEA)► Trans ASEAN Gas Pipeline Project (TAGP), 2015, ASEAN Council on Petroleum (ASCOPE) ► Respective infrastructure projects news and press releases► EY analysis
Page 28Rediscover ASEAN: a growth story of 10 countries
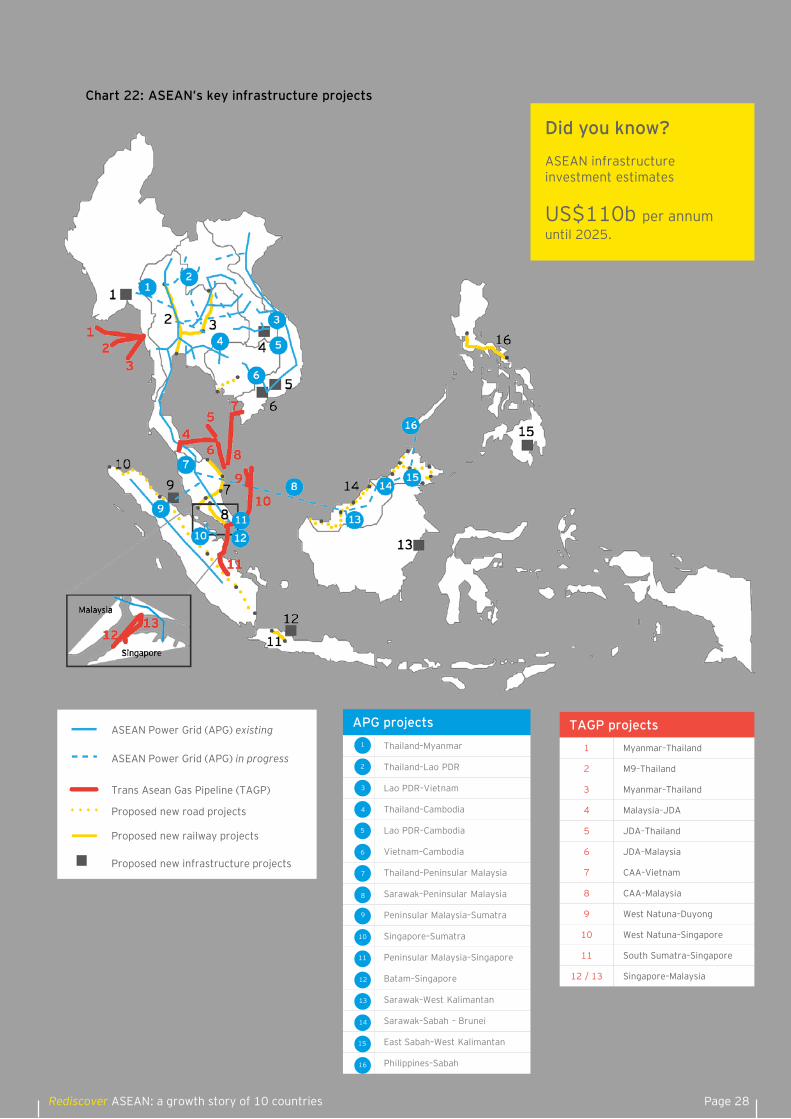
APG projects
Thailand–Myanmar
Thailand–Lao PDR
Lao PDR–Vietnam
Thailand–Cambodia
Lao PDR–Cambodia
Vietnam–Cambodia
Thailand–Peninsular Malaysia
Sarawak–Peninsular Malaysia
Peninsular Malaysia–Sumatra
Singapore–Sumatra
Peninsular Malaysia–Singapore
Batam–Singapore
Sarawak–West Kalimantan
Sarawak–Sabah – Brunei
East Sabah–West Kalimantan
Philippines–Sabah
Did you know?
ASEAN infrastructure investment estimates
US$110b per annumuntil 2025.
TAGP projects
1 Myanmar–Thailand
2 M9–Thailand
3 Myanmar–Thailand
4 Malaysia–JDA
5 JDA–Thailand
6 JDA–Malaysia
7 CAA–Vietnam
8 CAA–Malaysia
9 West Natuna–Duyong
10 West Natuna–Singapore
11 South Sumatra–Singapore
12 / 13 Singapore–Malaysia
1
2
3
4
5
6
7
8
9
10
11
12
13
14
15
16
ASEAN Power Grid (APG) existing
ASEAN Power Grid (APG) in progress
Trans Asean Gas Pipeline (TAGP)
Proposed new road projects
Proposed new railway projects
Proposed new infrastructure projects
Chart 22: ASEAN’s key infrastructure projects
Page 29 Rediscover ASEAN: a growth story of 10 countries
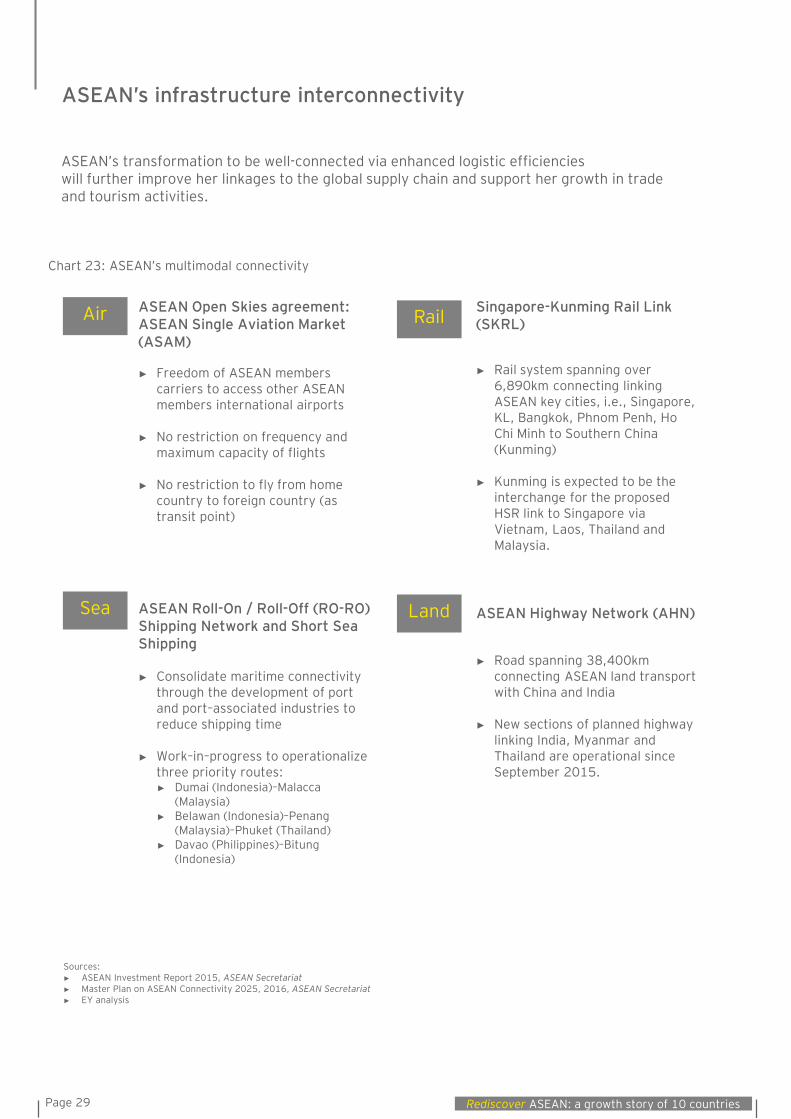
ASEAN’s transformation to be well-connected via enhanced logistic efficiencies will further improve her linkages to the global supply chain and support her growth in trade and tourism activities.
ASEAN Open Skies agreement: ASEAN Single Aviation Market (ASAM)
► Freedom of ASEAN members carriers to access other ASEAN members international airports
► No restriction on frequency and maximum capacity of flights
► No restriction to fly from home country to foreign country (as transit point)
ASEAN Highway Network (AHN)
► Road spanning 38,400km connecting ASEAN land transport with China and India
► New sections of planned highway linking India, Myanmar and Thailand are operational since September 2015.
Singapore-Kunming Rail Link (SKRL)
► Rail system spanning over 6,890km connecting linking ASEAN key cities, i.e., Singapore, KL, Bangkok, Phnom Penh, Ho Chi Minh to Southern China (Kunming)
► Kunming is expected to be the interchange for the proposed HSR link to Singapore via Vietnam, Laos, Thailand and Malaysia.
ASEAN Roll-On / Roll-Off (RO-RO) Shipping Network and Short Sea Shipping
► Consolidate maritime connectivity through the development of port and port–associated industries to reduce shipping time
► Work–in–progress to operationalize three priority routes:► Dumai (Indonesia)–Malacca
(Malaysia) ► Belawan (Indonesia)–Penang
(Malaysia)–Phuket (Thailand)► Davao (Philippines)–Bitung
(Indonesia)
Chart 23: ASEAN’s multimodal connectivity
Air
Sources:► ASEAN Investment Report 2015, ASEAN Secretariat► Master Plan on ASEAN Connectivity 2025, 2016, ASEAN Secretariat► EY analysis
ASEAN’s infrastructure interconnectivity
Rail
LandSea
Page 30Rediscover ASEAN: a growth story of 10 countries
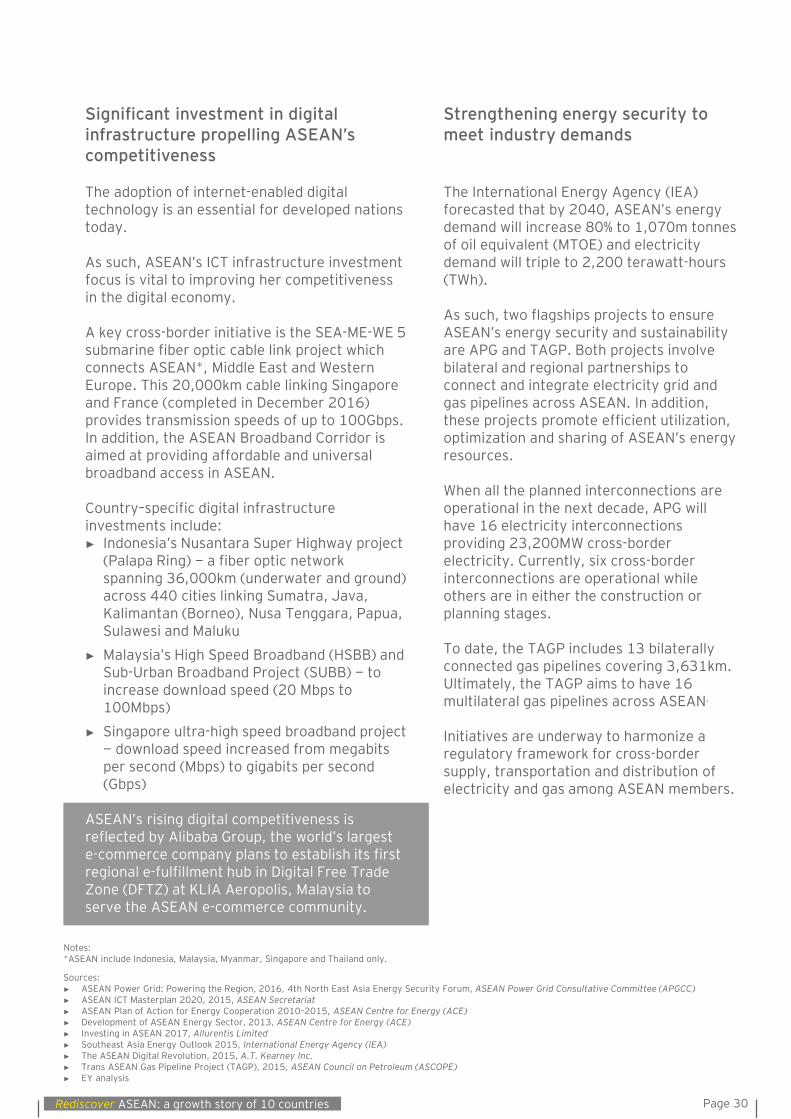
Strengthening energy security to meet industry demands
The International Energy Agency (IEA) forecasted that by 2040, ASEAN’s energy demand will increase 80% to 1,070m tonnes of oil equivalent (MTOE) and electricity demand will triple to 2,200 terawatt-hours (TWh).
As such, two flagships projects to ensure ASEAN’s energy security and sustainability are APG and TAGP. Both projects involve bilateral and regional partnerships to connect and integrate electricity grid and gas pipelines across ASEAN. In addition, these projects promote efficient utilization, optimization and sharing of ASEAN’s energy resources.
When all the planned interconnections are operational in the next decade, APG will have 16 electricity interconnections providing 23,200MW cross-border electricity. Currently, six cross-border interconnections are operational while others are in either the construction or planning stages.
To date, the TAGP includes 13 bilaterally connected gas pipelines covering 3,631km. Ultimately, the TAGP aims to have 16 multilateral gas pipelines across ASEAN.
Initiatives are underway to harmonize a regulatory framework for cross-border supply, transportation and distribution of electricity and gas among ASEAN members.
Significant investment in digital infrastructure propelling ASEAN’s competitiveness
The adoption of internet-enabled digital technology is an essential for developed nations today.
As such, ASEAN’s ICT infrastructure investment focus is vital to improving her competitiveness in the digital economy.
A key cross-border initiative is the SEA-ME-WE 5 submarine fiber optic cable link project which connects ASEAN*, Middle East and Western Europe. This 20,000km cable linking Singapore and France (completed in December 2016) provides transmission speeds of up to 100Gbps. In addition, the ASEAN Broadband Corridor is aimed at providing affordable and universal broadband access in ASEAN.
Country–specific digital infrastructure investments include:► Indonesia’s Nusantara Super Highway project
(Palapa Ring) − a fiber optic network spanning 36,000km (underwater and ground) across 440 cities linking Sumatra, Java, Kalimantan (Borneo), Nusa Tenggara, Papua, Sulawesi and Maluku
► Malaysia’s High Speed Broadband (HSBB) and Sub-Urban Broadband Project (SUBB) − to increase download speed (20 Mbps to 100Mbps)
► Singapore ultra-high speed broadband project − download speed increased from megabits per second (Mbps) to gigabits per second (Gbps)
ASEAN’s rising digital competitiveness is reflected by Alibaba Group, the world’s largest e-commerce company plans to establish its first regional e-fulfillment hub in Digital Free Trade Zone (DFTZ) at KLIA Aeropolis, Malaysia to serve the ASEAN e-commerce community.
Sources:► ASEAN Power Grid: Powering the Region, 2016, 4th North East Asia Energy Security Forum, ASEAN Power Grid Consultative Committee (APGCC)► ASEAN ICT Masterplan 2020, 2015, ASEAN Secretariat► ASEAN Plan of Action for Energy Cooperation 2010–2015, ASEAN Centre for Energy (ACE)► Development of ASEAN Energy Sector, 2013, ASEAN Centre for Energy (ACE)► Investing in ASEAN 2017, Allurentis Limited► Southeast Asia Energy Outlook 2015, International Energy Agency (IEA)► The ASEAN Digital Revolution, 2015, A.T. Kearney Inc.► Trans ASEAN Gas Pipeline Project (TAGP), 2015, ASEAN Council on Petroleum (ASCOPE)► EY analysis
Notes:*ASEAN include Indonesia, Malaysia, Myanmar, Singapore and Thailand only.
Page 31 Rediscover ASEAN: a growth story of 10 countries
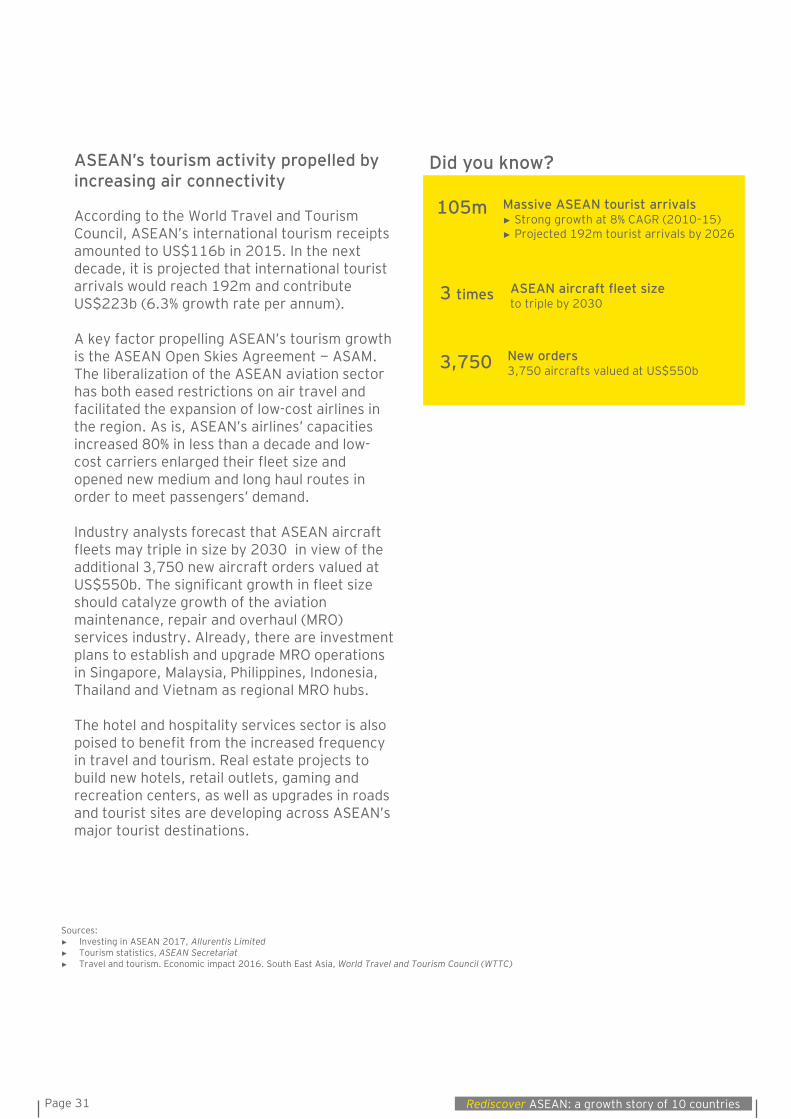
ASEAN’s tourism activity propelled by increasing air connectivity
According to the World Travel and Tourism Council, ASEAN’s international tourism receipts amounted to US$116b in 2015. In the next decade, it is projected that international tourist arrivals would reach 192m and contribute US$223b (6.3% growth rate per annum).
A key factor propelling ASEAN’s tourism growth is the ASEAN Open Skies Agreement − ASAM. The liberalization of the ASEAN aviation sector has both eased restrictions on air travel and facilitated the expansion of low-cost airlines in the region. As is, ASEAN’s airlines’ capacities increased 80% in less than a decade and low-cost carriers enlarged their fleet size and opened new medium and long haul routes in order to meet passengers’ demand.
Industry analysts forecast that ASEAN aircraft fleets may triple in size by 2030 in view of the additional 3,750 new aircraft orders valued at US$550b. The significant growth in fleet size should catalyze growth of the aviation maintenance, repair and overhaul (MRO) services industry. Already, there are investment plans to establish and upgrade MRO operations in Singapore, Malaysia, Philippines, Indonesia, Thailand and Vietnam as regional MRO hubs.
The hotel and hospitality services sector is also poised to benefit from the increased frequency in travel and tourism. Real estate projects to build new hotels, retail outlets, gaming and recreation centers, as well as upgrades in roads and tourist sites are developing across ASEAN’s major tourist destinations.
Sources:► Investing in ASEAN 2017, Allurentis Limited► Tourism statistics, ASEAN Secretariat► Travel and tourism. Economic impact 2016. South East Asia, World Travel and Tourism Council (WTTC)
105m
Did you know?
3 times
3,750
Massive ASEAN tourist arrivals► Strong growth at 8% CAGR (2010–15)► Projected 192m tourist arrivals by 2026
ASEAN aircraft fleet size to triple by 2030
New orders3,750 aircrafts valued at US$550b
Country profiles
Page 33 Rediscover ASEAN: a growth story of 10 countries
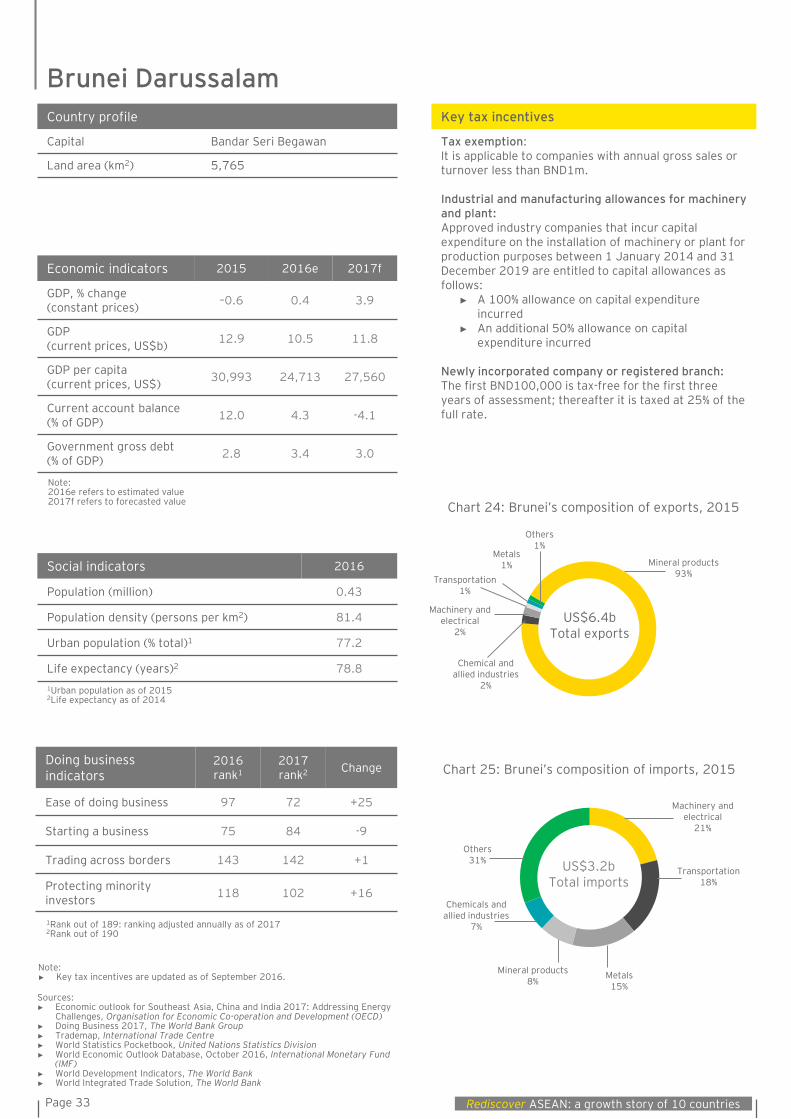
Economic indicators 2015 2016e 2017f
GDP, % change(constant prices) –0.6 0.4 3.9
GDP(current prices, US$b) 12.9 10.5 11.8
GDP per capita(current prices, US$) 30,993 24,713 27,560
Current account balance (% of GDP) 12.0 4.3 -4.1
Government gross debt (% of GDP) 2.8 3.4 3.0
Social indicators 2016
Population (million) 0.43
Population density (persons per km2) 81.4
Urban population (% total)1 77.2
Life expectancy (years)2 78.8
Doing business indicators
2016 rank1
2017rank2 Change
Ease of doing business 97 72 +25
Starting a business 75 84 -9
Trading across borders 143 142 +1
Protecting minorityinvestors 118 102 +16
Key tax incentives
Tax exemption:It is applicable to companies with annual gross sales or turnover less than BND1m.
Industrial and manufacturing allowances for machinery and plant:Approved industry companies that incur capital expenditure on the installation of machinery or plant for production purposes between 1 January 2014 and 31 December 2019 are entitled to capital allowances as follows:
► A 100% allowance on capital expenditure incurred
► An additional 50% allowance on capital expenditure incurred
Newly incorporated company or registered branch:The first BND100,000 is tax-free for the first three years of assessment; thereafter it is taxed at 25% of the full rate.
Country profile
Capital Bandar Seri Begawan
Land area (km2) 5,765
Chart 24: Brunei’s composition of exports, 2015
Chart 25: Brunei’s composition of imports, 2015
1Rank out of 189: ranking adjusted annually as of 20172Rank out of 190
1Urban population as of 20152Life expectancy as of 2014
Note: 2016e refers to estimated value2017f refers to forecasted value
US$6.4bTotal exports
Mineral products93%
Chemical and allied industries
2%
Machinery and electrical
2%
Transportation1%
Metals1%
Others1%
US$3.2bTotal imports
Machinery and electrical
21%
Transportation18%
Metals15%
Mineral products8%
Chemicals and allied industries
7%
Others31%
Note:► Key tax incentives are updated as of September 2016.
Sources: ► Economic outlook for Southeast Asia, China and India 2017: Addressing Energy
Challenges, Organisation for Economic Co-operation and Development (OECD)► Doing Business 2017, The World Bank Group► Trademap, International Trade Centre► World Statistics Pocketbook, United Nations Statistics Division► World Economic Outlook Database, October 2016, International Monetary Fund
(IMF)► World Development Indicators, The World Bank► World Integrated Trade Solution, The World Bank
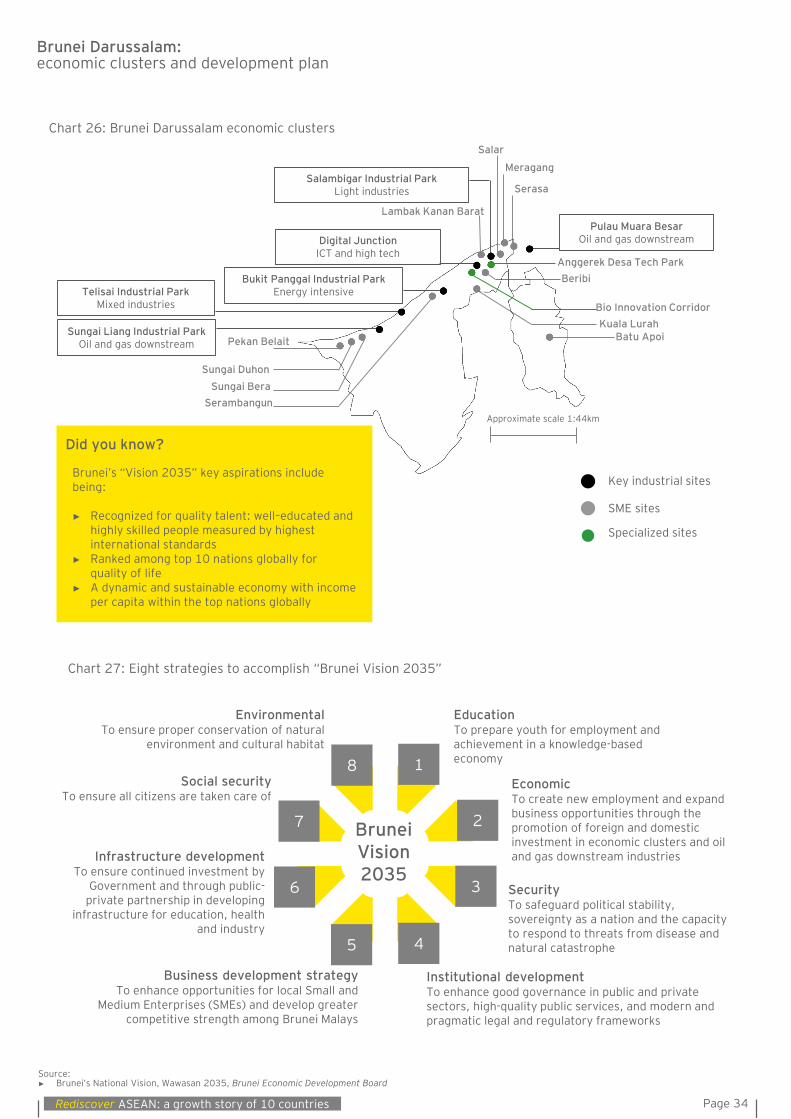
Brunei Darussalam
Page 34Rediscover ASEAN: a growth story of 10 countries
Sungai Liang Industrial ParkOil and gas downstream
Telisai Industrial ParkMixed industries
Bukit Panggal Industrial ParkEnergy intensive
Digital JunctionICT and high tech
Salambigar Industrial ParkLight industries
Pulau Muara BesarOil and gas downstream
Anggerek Desa Tech Park
Bio Innovation Corridor
Beribi
Batu ApoiKuala Lurah
Serasa
Salar
Lambak Kanan Barat
Pekan Belait
Sungai BeraSerambangun
Brunei Darussalam: economic clusters and development plan
Source: ► Brunei’s National Vision, Wawasan 2035, Brunei Economic Development Board
Chart 27: Eight strategies to accomplish “Brunei Vision 2035”
Chart 26: Brunei Darussalam economic clusters
Brunei’s “Vision 2035” key aspirations include being:
► Recognized for quality talent: well–educated and highly skilled people measured by highest international standards
► Ranked among top 10 nations globally for quality of life
► A dynamic and sustainable economy with income per capita within the top nations globally
Did you know?
1
Education To prepare youth for employment and achievement in a knowledge-based economy
2
SecurityTo safeguard political stability, sovereignty as a nation and the capacity to respond to threats from disease and natural catastrophe
3
EconomicTo create new employment and expand business opportunities through the promotion of foreign and domestic investment in economic clusters and oil and gas downstream industries
Institutional developmentTo enhance good governance in public and private sectors, high-quality public services, and modern and pragmatic legal and regulatory frameworks
4
Business development strategyTo enhance opportunities for local Small and
Medium Enterprises (SMEs) and develop greater competitive strength among Brunei Malays
5
Infrastructure developmentTo ensure continued investment by
Government and through public-private partnership in developing
infrastructure for education, health and industry
6
Social securityTo ensure all citizens are taken care of
7
EnvironmentalTo ensure proper conservation of natural
environment and cultural habitat
8
Brunei Vision 2035
Sungai Duhon
Meragang
Approximate scale 1:44km
Specialized sites
Key industrial sites
SME sites
Page 35 Rediscover ASEAN: a growth story of 10 countries
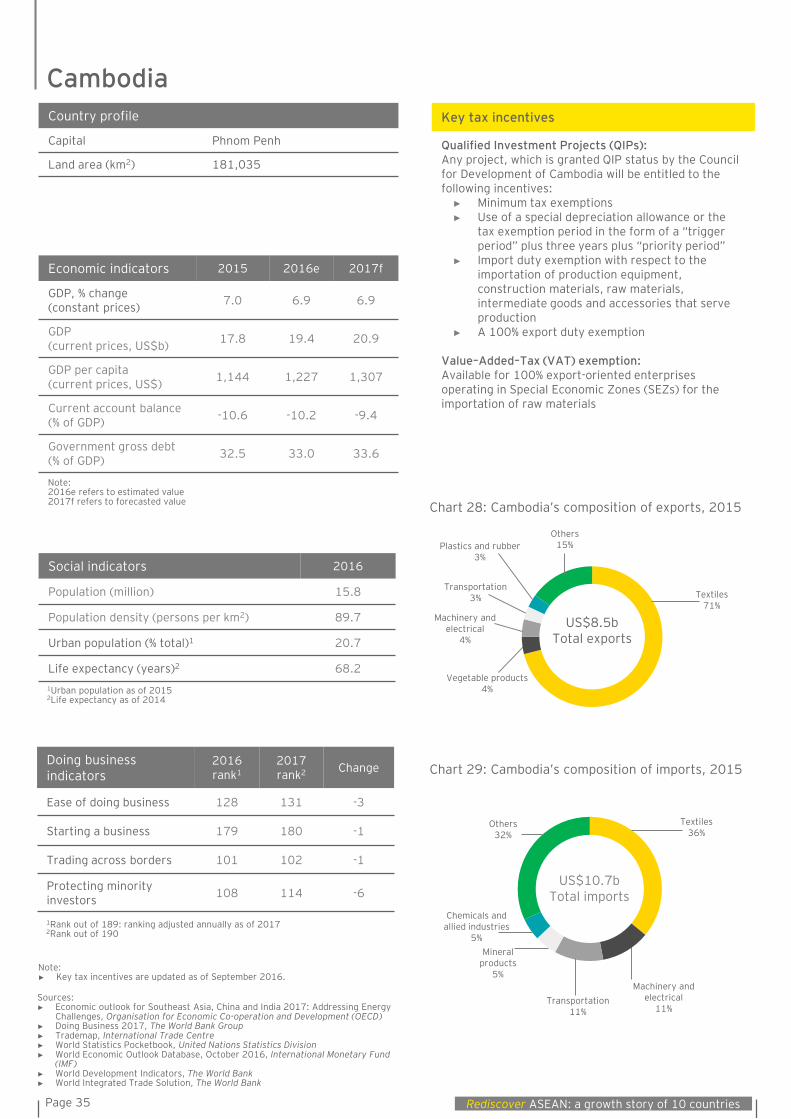
Economic indicators 2015 2016e 2017f
GDP, % change(constant prices) 7.0 6.9 6.9
GDP(current prices, US$b) 17.8 19.4 20.9
GDP per capita(current prices, US$) 1,144 1,227 1,307
Current account balance (% of GDP) -10.6 -10.2 -9.4
Government gross debt (% of GDP) 32.5 33.0 33.6
Social indicators 2016
Population (million) 15.8
Population density (persons per km2) 89.7
Urban population (% total)1 20.7
Life expectancy (years)2 68.2
Doing business indicators
2016 rank1
2017rank2 Change
Ease of doing business 128 131 -3
Starting a business 179 180 -1
Trading across borders 101 102 -1
Protecting minorityinvestors 108 114 -6
Key tax incentives
Qualified Investment Projects (QIPs): Any project, which is granted QIP status by the Council for Development of Cambodia will be entitled to the following incentives:
► Minimum tax exemptions► Use of a special depreciation allowance or the
tax exemption period in the form of a “trigger period” plus three years plus “priority period”
► Import duty exemption with respect to the importation of production equipment, construction materials, raw materials, intermediate goods and accessories that serve production
► A 100% export duty exemption
Value–Added–Tax (VAT) exemption: Available for 100% export-oriented enterprises operating in Special Economic Zones (SEZs) for the importation of raw materials
Country profile
Capital Phnom Penh
Land area (km2) 181,035
Chart 28: Cambodia’s composition of exports, 2015
Chart 29: Cambodia’s composition of imports, 2015
US$8.5bTotal exports
Textiles71%
Vegetable products4%
Machinery and electrical
4%
Transportation3%
Plastics and rubber3%
Others15%
US$10.7bTotal imports
Textiles36%
Machinery and electrical
11%Transportation
11%
Mineral products
5%
Chemicals and allied industries
5%
Others32%
Note:► Key tax incentives are updated as of September 2016.
Sources: ► Economic outlook for Southeast Asia, China and India 2017: Addressing Energy
Challenges, Organisation for Economic Co-operation and Development (OECD)► Doing Business 2017, The World Bank Group► Trademap, International Trade Centre► World Statistics Pocketbook, United Nations Statistics Division► World Economic Outlook Database, October 2016, International Monetary Fund
(IMF)► World Development Indicators, The World Bank► World Integrated Trade Solution, The World Bank
1Rank out of 189: ranking adjusted annually as of 20172Rank out of 190
1Urban population as of 20152Life expectancy as of 2014
Note: 2016e refers to estimated value2017f refers to forecasted value
Cambodia
Page 36Rediscover ASEAN: a growth story of 10 countries
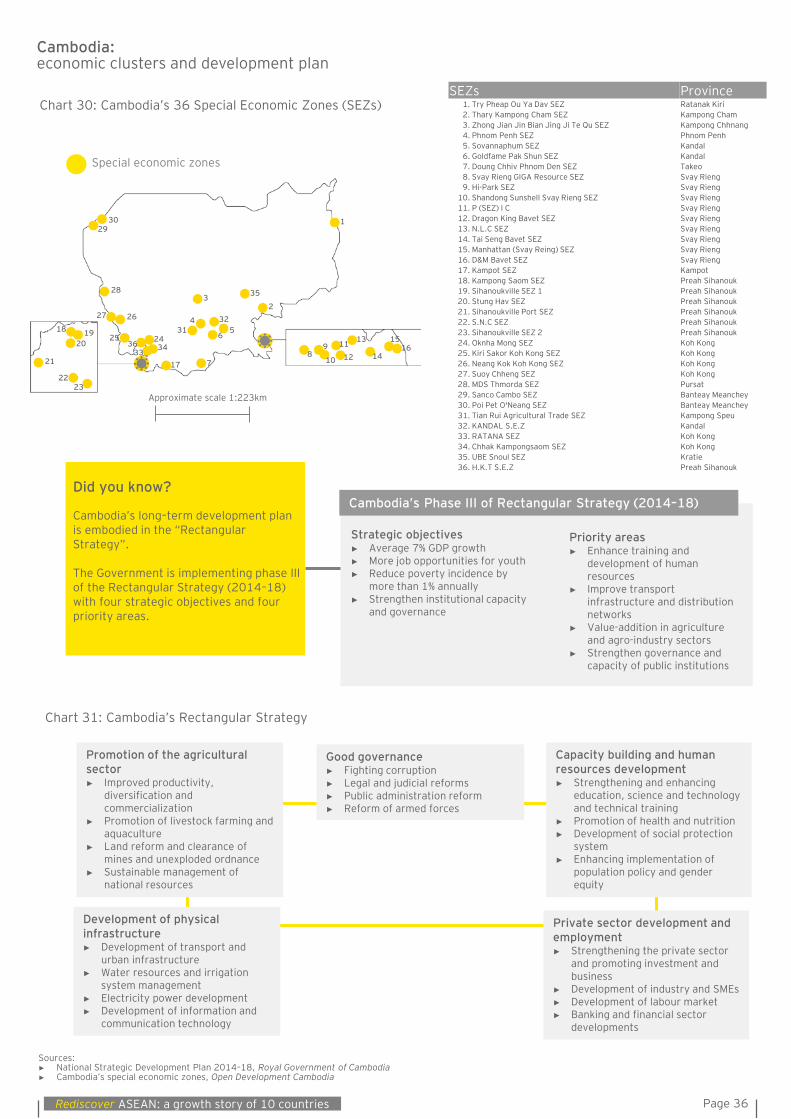
Cambodia: economic clusters and development plan
Sources: ► National Strategic Development Plan 2014–18, Royal Government of Cambodia► Cambodia’s special economic zones, Open Development Cambodia
Cambodia’s long–term development plan is embodied in the “Rectangular Strategy”.
The Government is implementing phase III of the Rectangular Strategy (2014–18) with four strategic objectives and four priority areas.
Did you know?
SEZs Province1. Try Pheap Ou Ya Dav SEZ Ratanak Kiri2. Thary Kampong Cham SEZ Kampong Cham3. Zhong Jian Jin Bian Jing Ji Te Qu SEZ Kampong Chhnang4. Phnom Penh SEZ Phnom Penh5. Sovannaphum SEZ Kandal6. Goldfame Pak Shun SEZ Kandal7. Doung Chhiv Phnom Den SEZ Takeo8. Svay Rieng GIGA Resource SEZ Svay Rieng9. Hi-Park SEZ Svay Rieng
10. Shandong Sunshell Svay Rieng SEZ Svay Rieng11. P (SEZ) I C Svay Rieng12. Dragon King Bavet SEZ Svay Rieng13. N.L.C SEZ Svay Rieng14. Tai Seng Bavet SEZ Svay Rieng15. Manhattan (Svay Reing) SEZ Svay Rieng16. D&M Bavet SEZ Svay Rieng17. Kampot SEZ Kampot18. Kampong Saom SEZ Preah Sihanouk19. Sihanoukville SEZ 1 Preah Sihanouk20. Stung Hav SEZ Preah Sihanouk21. Sihanoukville Port SEZ Preah Sihanouk22. S.N.C SEZ Preah Sihanouk23. Sihanoukville SEZ 2 Preah Sihanouk24. Oknha Mong SEZ Koh Kong25. Kiri Sakor Koh Kong SEZ Koh Kong26. Neang Kok Koh Kong SEZ Koh Kong27. Suoy Chheng SEZ Koh Kong28. MDS Thmorda SEZ Pursat29. Sanco Cambo SEZ Banteay Meanchey30. Poi Pet O'Neang SEZ Banteay Meanchey31. Tian Rui Agricultural Trade SEZ Kampong Speu32. KANDAL S.E.Z Kandal33. RATANA SEZ Koh Kong34. Chhak Kampongsaom SEZ Koh Kong35. UBE Snoul SEZ Kratie36. H.K.T S.E.Z Preah Sihanouk
Chart 31: Cambodia’s Rectangular Strategy
Good governance► Fighting corruption► Legal and judicial reforms► Public administration reform► Reform of armed forces
Promotion of the agricultural sector► Improved productivity,
diversification and commercialization
► Promotion of livestock farming and aquaculture
► Land reform and clearance of mines and unexploded ordnance
► Sustainable management of national resources
Development of physical infrastructure► Development of transport and
urban infrastructure► Water resources and irrigation
system management► Electricity power development► Development of information and
communication technology
Private sector development and employment► Strengthening the private sector
and promoting investment and business
► Development of industry and SMEs► Development of labour market► Banking and financial sector
developments
Capacity building and human resources development► Strengthening and enhancing
education, science and technology and technical training
► Promotion of health and nutrition► Development of social protection
system► Enhancing implementation of
population policy and gender equity
Strategic objectives► Average 7% GDP growth► More job opportunities for youth► Reduce poverty incidence by
more than 1% annually► Strengthen institutional capacity
and governance
Priority areas► Enhance training and
development of human resources
► Improve transport infrastructure and distribution networks
► Value-addition in agriculture and agro-industry sectors
► Strengthen governance and capacity of public institutions
Cambodia’s Phase III of Rectangular Strategy (2014–18)
13029
2
353
325
6
431
717
342436
33
25
27
28
89
10
11
12
13
14
1516
18 1920
21
2223
26
Special economic zones
Chart 30: Cambodia’s 36 Special Economic Zones (SEZs)
Approximate scale 1:223km
Page 37 Rediscover ASEAN: a growth story of 10 countries
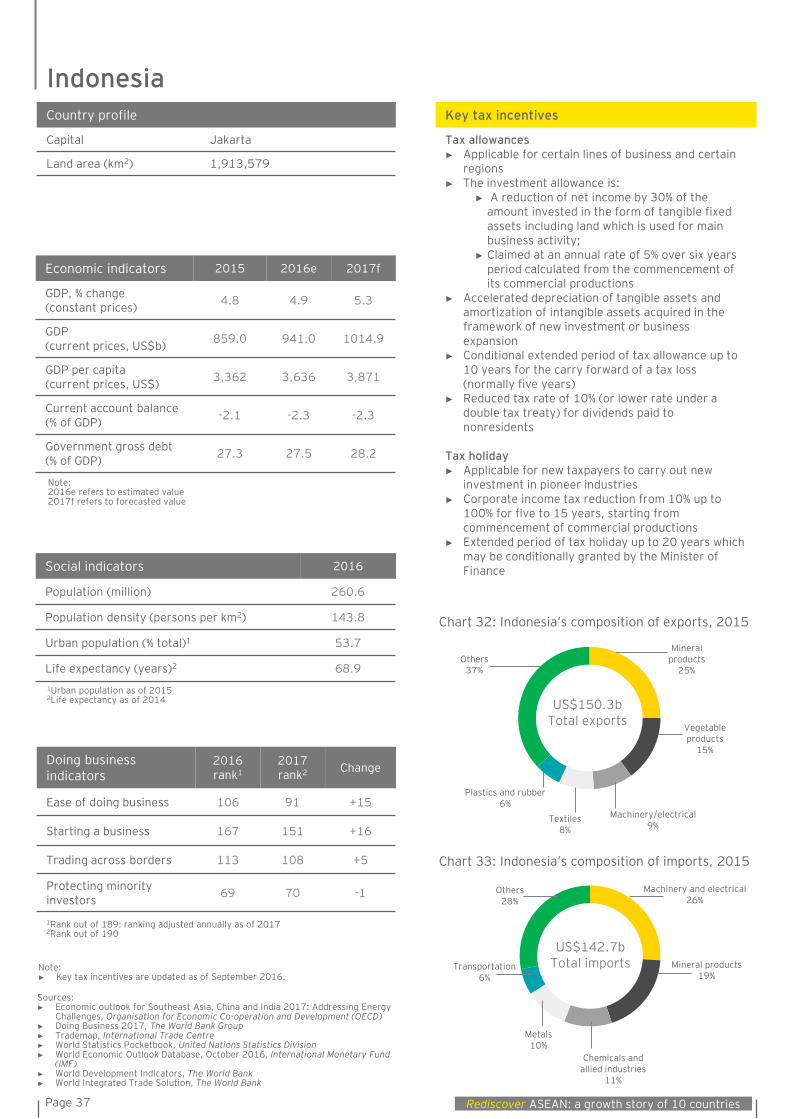
Economic indicators 2015 2016e 2017f
GDP, % change(constant prices) 4.8 4.9 5.3
GDP(current prices, US$b) 859.0 941.0 1014.9
GDP per capita(current prices, US$) 3,362 3,636 3,871
Current account balance (% of GDP) -2.1 -2.3 -2.3
Government gross debt (% of GDP) 27.3 27.5 28.2
Social indicators 2016
Population (million) 260.6
Population density (persons per km2) 143.8
Urban population (% total)1 53.7
Life expectancy (years)2 68.9
Doing business indicators
2016 rank1
2017rank2 Change
Ease of doing business 106 91 +15
Starting a business 167 151 +16
Trading across borders 113 108 +5
Protecting minorityinvestors 69 70 -1
Key tax incentives
Tax allowances► Applicable for certain lines of business and certain
regions► The investment allowance is:
► A reduction of net income by 30% of the amount invested in the form of tangible fixed assets including land which is used for main business activity;
► Claimed at an annual rate of 5% over six years period calculated from the commencement of its commercial productions
► Accelerated depreciation of tangible assets and amortization of intangible assets acquired in the framework of new investment or business expansion
► Conditional extended period of tax allowance up to 10 years for the carry forward of a tax loss (normally five years)
► Reduced tax rate of 10% (or lower rate under a double tax treaty) for dividends paid to nonresidents
Tax holiday► Applicable for new taxpayers to carry out new
investment in pioneer industries► Corporate income tax reduction from 10% up to
100% for five to 15 years, starting from commencement of commercial productions
► Extended period of tax holiday up to 20 years which may be conditionally granted by the Minister of Finance
Country profile
Capital Jakarta
Land area (km2) 1,913,579
Chart 32: Indonesia’s composition of exports, 2015
US$150.3bTotal exports
Mineral products
25%
Vegetable products
15%
Machinery/electrical9%
Textiles8%
Plastics and rubber6%
Others37%
US$142.7bTotal imports
Machinery and electrical26%
Mineral products19%
Metals10%
Transportation6%
Others28%
Chart 33: Indonesia’s composition of imports, 2015
Chemicals and allied industries
11%
Note:► Key tax incentives are updated as of September 2016.
Sources: ► Economic outlook for Southeast Asia, China and India 2017: Addressing Energy
Challenges, Organisation for Economic Co-operation and Development (OECD)► Doing Business 2017, The World Bank Group► Trademap, International Trade Centre► World Statistics Pocketbook, United Nations Statistics Division► World Economic Outlook Database, October 2016, International Monetary Fund
(IMF)► World Development Indicators, The World Bank► World Integrated Trade Solution, The World Bank
1Rank out of 189: ranking adjusted annually as of 20172Rank out of 190
1Urban population as of 20152Life expectancy as of 2014
Note: 2016e refers to estimated value2017f refers to forecasted value
Indonesia
Page 38Rediscover ASEAN: a growth story of 10 countries
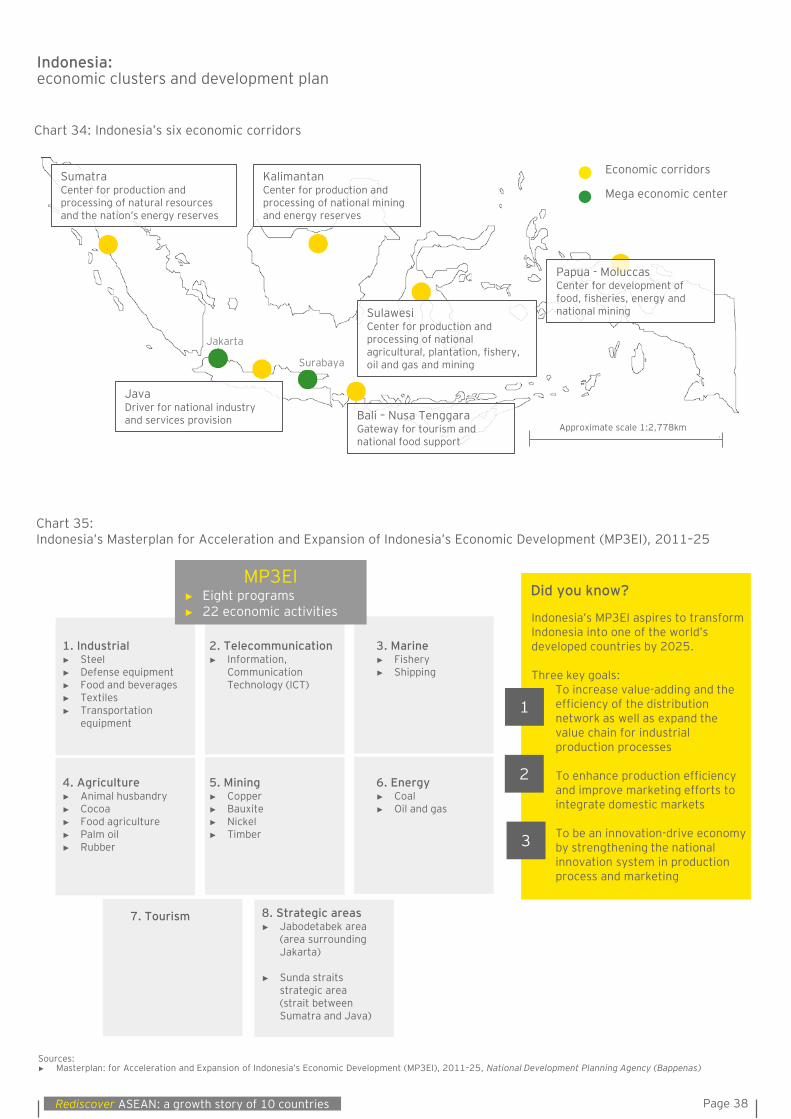
Indonesia: economic clusters and development plan
Sources: ► Masterplan: for Acceleration and Expansion of Indonesia’s Economic Development (MP3EI), 2011–25, National Development Planning Agency (Bappenas)
Chart 34: Indonesia’s six economic corridors
Mega economic center
Economic corridorsSumatraCenter for production and processing of natural resources and the nation’s energy reserves
KalimantanCenter for production and processing of national mining and energy reserves
Jakarta
Surabaya
JavaDriver for national industry and services provision Bali – Nusa Tenggara
Gateway for tourism and national food support
Papua - MoluccasCenter for development of food, fisheries, energy and national miningSulawesi
Center for production and processing of national agricultural, plantation, fishery, oil and gas and mining
Chart 35: Indonesia’s Masterplan for Acceleration and Expansion of Indonesia’s Economic Development (MP3EI), 2011–25
Approximate scale 1:2,778km
Did you know?
Indonesia’s MP3EI aspires to transform Indonesia into one of the world’s developed countries by 2025.
Three key goals:To increase value-adding and the efficiency of the distribution network as well as expand the value chain for industrial production processes
To enhance production efficiency and improve marketing efforts to integrate domestic markets
To be an innovation-drive economy by strengthening the national innovation system in production process and marketing
1
2
3
MP3EI► Eight programs► 22 economic activities
4. Agriculture► Animal husbandry► Cocoa► Food agriculture► Palm oil► Rubber
6. Energy► Coal► Oil and gas
5. Mining► Copper► Bauxite► Nickel► Timber
1. Industrial► Steel► Defense equipment► Food and beverages► Textiles► Transportation
equipment
3. Marine► Fishery► Shipping
7. Tourism
2. Telecommunication► Information,
Communication Technology (ICT)
8. Strategic areas► Jabodetabek area
(area surrounding Jakarta)
► Sunda straits strategic area (strait between Sumatra and Java)
Page 39 Rediscover ASEAN: a growth story of 10 countries
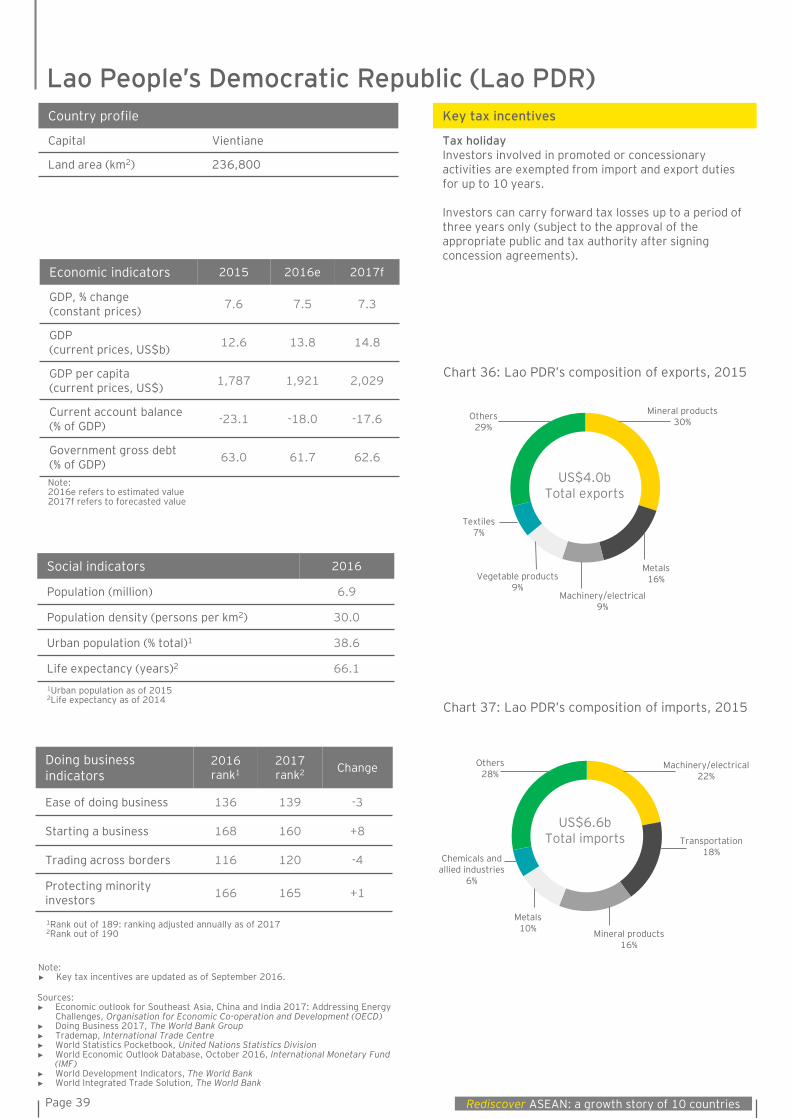
Economic indicators 2015 2016e 2017f
GDP, % change(constant prices) 7.6 7.5 7.3
GDP(current prices, US$b) 12.6 13.8 14.8
GDP per capita(current prices, US$) 1,787 1,921 2,029
Current account balance (% of GDP) -23.1 -18.0 -17.6
Government gross debt (% of GDP) 63.0 61.7 62.6
Social indicators 2016
Population (million) 6.9
Population density (persons per km2) 30.0
Urban population (% total)1 38.6
Life expectancy (years)2 66.1
Doing business indicators
2016 rank1
2017rank2 Change
Ease of doing business 136 139 -3
Starting a business 168 160 +8
Trading across borders 116 120 -4
Protecting minorityinvestors 166 165 +1
Key tax incentives
Tax holidayInvestors involved in promoted or concessionary activities are exempted from import and export duties for up to 10 years.
Investors can carry forward tax losses up to a period of three years only (subject to the approval of the appropriate public and tax authority after signing concession agreements).
Country profile
Capital Vientiane
Land area (km2) 236,800
Chart 36: Lao PDR’s composition of exports, 2015
Chart 37: Lao PDR’s composition of imports, 2015
US$4.0bTotal exports
Mineral products30%
Machinery/electrical9%
Metals16%Vegetable products
9%
Textiles7%
Others29%
US$6.6bTotal imports
Machinery/electrical22%
Transportation18%
Mineral products16%
Metals10%
Chemicals and allied industries
6%
Others28%
Note:► Key tax incentives are updated as of September 2016.
Sources: ► Economic outlook for Southeast Asia, China and India 2017: Addressing Energy
Challenges, Organisation for Economic Co-operation and Development (OECD)► Doing Business 2017, The World Bank Group► Trademap, International Trade Centre► World Statistics Pocketbook, United Nations Statistics Division► World Economic Outlook Database, October 2016, International Monetary Fund
(IMF)► World Development Indicators, The World Bank► World Integrated Trade Solution, The World Bank
1Rank out of 189: ranking adjusted annually as of 20172Rank out of 190
1Urban population as of 20152Life expectancy as of 2014
Note: 2016e refers to estimated value2017f refers to forecasted value
Lao People’s Democratic Republic (Lao PDR)
Page 40Rediscover ASEAN: a growth story of 10 countries
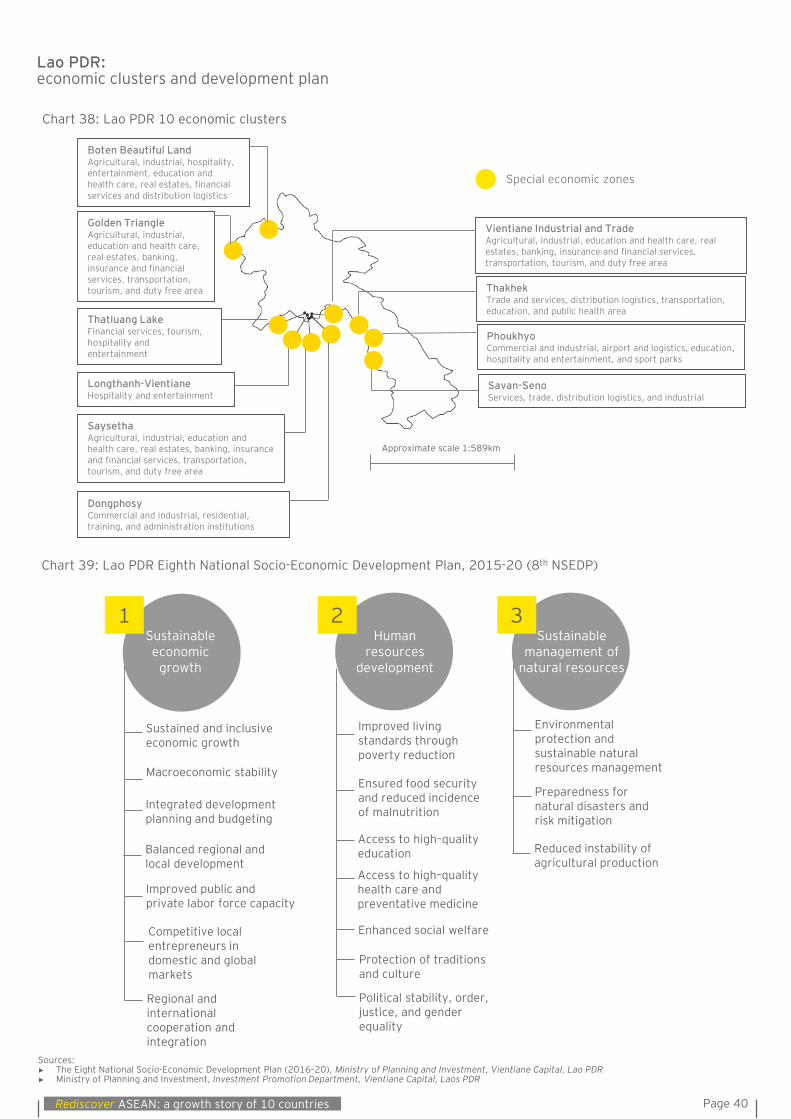
Lao PDR: economic clusters and development plan
Sources: ► The Eight National Socio-Economic Development Plan (2016–20), Ministry of Planning and Investment, Vientiane Capital, Lao PDR► Ministry of Planning and Investment, Investment Promotion Department, Vientiane Capital, Laos PDR
Chart 39: Lao PDR Eighth National Socio-Economic Development Plan, 2015-20 (8th NSEDP)
Sustainable economic
growth
Human resources
development
Sustainable management of
natural resources
Sustained and inclusive economic growth
Macroeconomic stability
Integrated development planning and budgeting
Balanced regional and local development
Improved public and private labor force capacity
Competitive local entrepreneurs in domestic and global markets
Regional and international cooperation and integration
Improved living standards through poverty reduction
Ensured food security and reduced incidence of malnutrition
Access to high–quality education
Access to high–quality health care and preventative medicine
Enhanced social welfare
Protection of traditions and culture
Political stability, order, justice, and gender equality
Environmental protection and sustainable natural resources management
Preparedness for natural disasters and risk mitigation
Reduced instability of agricultural production
1 2 3
Chart 38: Lao PDR 10 economic clusters
Special economic zones
Boten Beautiful LandAgricultural, industrial, hospitality, entertainment, education and health care, real estates, financial services and distribution logistics
Savan-SenoServices, trade, distribution logistics, and industrial
PhoukhyoCommercial and industrial, airport and logistics, education, hospitality and entertainment, and sport parks
ThakhekTrade and services, distribution logistics, transportation, education, and public health area
Vientiane Industrial and TradeAgricultural, industrial, education and health care, real estates, banking, insurance and financial services, transportation, tourism, and duty free area
DongphosyCommercial and industrial, residential, training, and administration institutions
Longthanh-VientianeHospitality and entertainment
SaysethaAgricultural, industrial, education and health care, real estates, banking, insurance and financial services, transportation, tourism, and duty free area
Thatluang LakeFinancial services, tourism, hospitality and entertainment
Golden TriangleAgricultural, industrial, education and health care, real estates, banking, insurance and financial services, transportation, tourism, and duty free area
Approximate scale 1:589km
Page 41 Rediscover ASEAN: a growth story of 10 countries
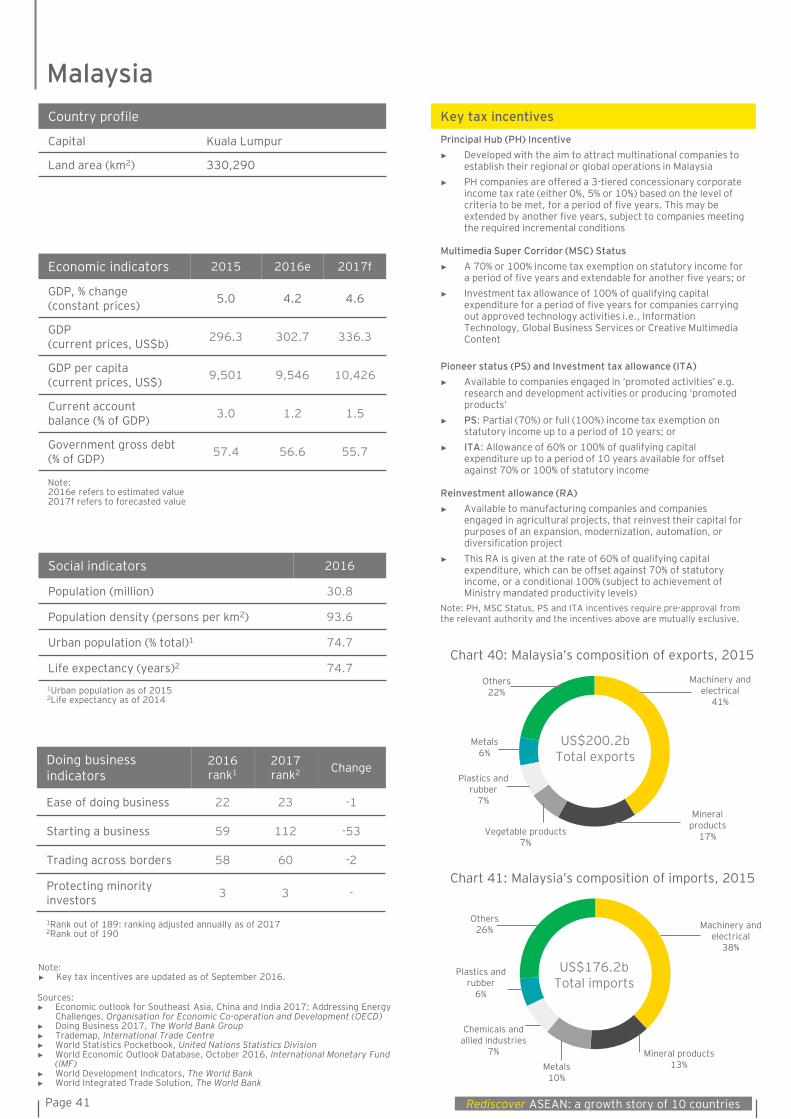
Economic indicators 2015 2016e 2017f
GDP, % change(constant prices) 5.0 4.2 4.6
GDP(current prices, US$b) 296.3 302.7 336.3
GDP per capita(current prices, US$) 9,501 9,546 10,426
Current account balance (% of GDP) 3.0 1.2 1.5
Government gross debt (% of GDP) 57.4 56.6 55.7
Social indicators 2016
Population (million) 30.8
Population density (persons per km2) 93.6
Urban population (% total)1 74.7
Life expectancy (years)2 74.7
Doing business indicators
2016 rank1
2017rank2 Change
Ease of doing business 22 23 -1
Starting a business 59 112 -53
Trading across borders 58 60 -2
Protecting minorityinvestors 3 3 -
Country profile
Capital Kuala Lumpur
Land area (km2) 330,290
Chart 40: Malaysia’s composition of exports, 2015
Chart 41: Malaysia’s composition of imports, 2015
US$200.2bTotal exports
Mineral products
17%
Machinery and electrical
41%
Vegetable products7%
Plastics and rubber
7%
Metals6%
Others22%
Mineral products13%Metals
10%
US$176.2bTotal imports
Machinery and electrical
38%
Chemicals and allied industries
7%
Plastics and rubber
6%
Others26%
Key tax incentives
Principal Hub (PH) Incentive ► Developed with the aim to attract multinational companies to
establish their regional or global operations in Malaysia► PH companies are offered a 3-tiered concessionary corporate
income tax rate (either 0%, 5% or 10%) based on the level of criteria to be met, for a period of five years. This may be extended by another five years, subject to companies meeting the required incremental conditions
Multimedia Super Corridor (MSC) Status► A 70% or 100% income tax exemption on statutory income for
a period of five years and extendable for another five years; or► Investment tax allowance of 100% of qualifying capital
expenditure for a period of five years for companies carrying out approved technology activities i.e., Information Technology, Global Business Services or Creative Multimedia Content
Pioneer status (PS) and Investment tax allowance (ITA)► Available to companies engaged in ‘promoted activities’ e.g.
research and development activities or producing ‘promoted products’
► PS: Partial (70%) or full (100%) income tax exemption on statutory income up to a period of 10 years; or
► ITA: Allowance of 60% or 100% of qualifying capital expenditure up to a period of 10 years available for offset against 70% or 100% of statutory income
Reinvestment allowance (RA)► Available to manufacturing companies and companies
engaged in agricultural projects, that reinvest their capital for purposes of an expansion, modernization, automation, or diversification project
► This RA is given at the rate of 60% of qualifying capital expenditure, which can be offset against 70% of statutory income, or a conditional 100% (subject to achievement of Ministry mandated productivity levels)
Note: PH, MSC Status, PS and ITA incentives require pre-approval from the relevant authority and the incentives above are mutually exclusive.
Note:► Key tax incentives are updated as of September 2016.
Sources: ► Economic outlook for Southeast Asia, China and India 2017: Addressing Energy
Challenges, Organisation for Economic Co-operation and Development (OECD)► Doing Business 2017, The World Bank Group► Trademap, International Trade Centre► World Statistics Pocketbook, United Nations Statistics Division► World Economic Outlook Database, October 2016, International Monetary Fund
(IMF)► World Development Indicators, The World Bank► World Integrated Trade Solution, The World Bank
1Rank out of 189: ranking adjusted annually as of 20172Rank out of 190
1Urban population as of 20152Life expectancy as of 2014
Note: 2016e refers to estimated value2017f refers to forecasted value
Malaysia
Page 42Rediscover ASEAN: a growth story of 10 countries
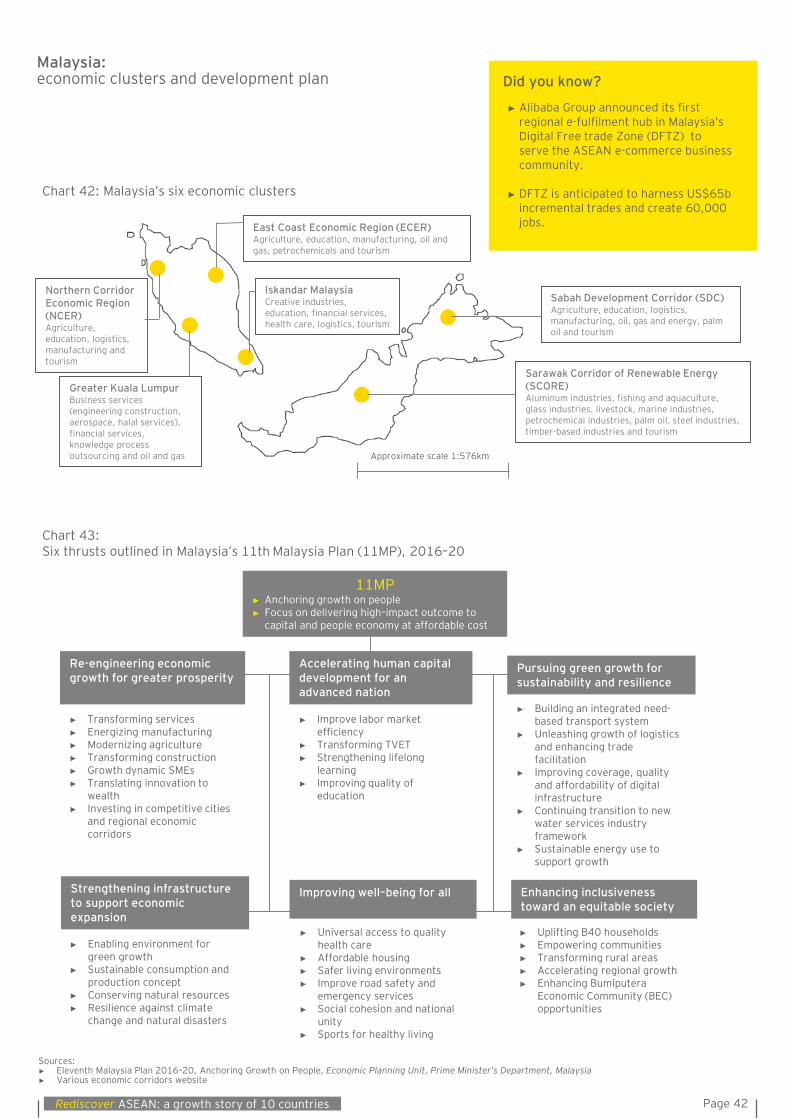
Malaysia: economic clusters and development plan
Sources: ► Eleventh Malaysia Plan 2016–20, Anchoring Growth on People, Economic Planning Unit, Prime Minister’s Department, Malaysia► Various economic corridors website
Chart 42: Malaysia’s six economic clusters
Chart 43: Six thrusts outlined in Malaysia’s 11th Malaysia Plan (11MP), 2016–20
► Universal access to quality health care
► Affordable housing► Safer living environments► Improve road safety and
emergency services► Social cohesion and national
unity► Sports for healthy living
Improving well–being for all
► Improve labor market efficiency
► Transforming TVET► Strengthening lifelong
learning ► Improving quality of
education
Accelerating human capital development for an advanced nation
► Enabling environment for green growth
► Sustainable consumption and production concept
► Conserving natural resources► Resilience against climate
change and natural disasters
Pursuing green growth for sustainability and resilience
Enhancing inclusiveness toward an equitable society
► Uplifting B40 households► Empowering communities► Transforming rural areas► Accelerating regional growth► Enhancing Bumiputera
Economic Community (BEC) opportunities
Strengthening infrastructure to support economic expansion
► Building an integrated need-based transport system
► Unleashing growth of logistics and enhancing trade facilitation
► Improving coverage, quality and affordability of digital infrastructure
► Continuing transition to new water services industry framework
► Sustainable energy use to support growth
11MP► Anchoring growth on people► Focus on delivering high–impact outcome to
capital and people economy at affordable cost
Re-engineering economic growth for greater prosperity
► Transforming services► Energizing manufacturing► Modernizing agriculture► Transforming construction► Growth dynamic SMEs► Translating innovation to
wealth► Investing in competitive cities
and regional economic corridors
Did you know?
► Alibaba Group announced its first regional e-fulfilment hub in Malaysia’s Digital Free trade Zone (DFTZ) to serve the ASEAN e-commerce business community.
► DFTZ is anticipated to harness US$65b incremental trades and create 60,000 jobs.East Coast Economic Region (ECER)
Agriculture, education, manufacturing, oil and gas, petrochemicals and tourism
Sabah Development Corridor (SDC)Agriculture, education, logistics, manufacturing, oil, gas and energy, palm oil and tourism
Sarawak Corridor of Renewable Energy (SCORE)Aluminum industries, fishing and aquaculture, glass industries, livestock, marine industries, petrochemical industries, palm oil, steel industries, timber-based industries and tourism
Iskandar MalaysiaCreative industries, education, financial services, health care, logistics, tourism
Greater Kuala LumpurBusiness services (engineering construction, aerospace, halal services), financial services, knowledge process outsourcing and oil and gas
Northern Corridor Economic Region (NCER)Agriculture, education, logistics, manufacturing and tourism
Approximate scale 1:576km
Page 43 Rediscover ASEAN: a growth story of 10 countries
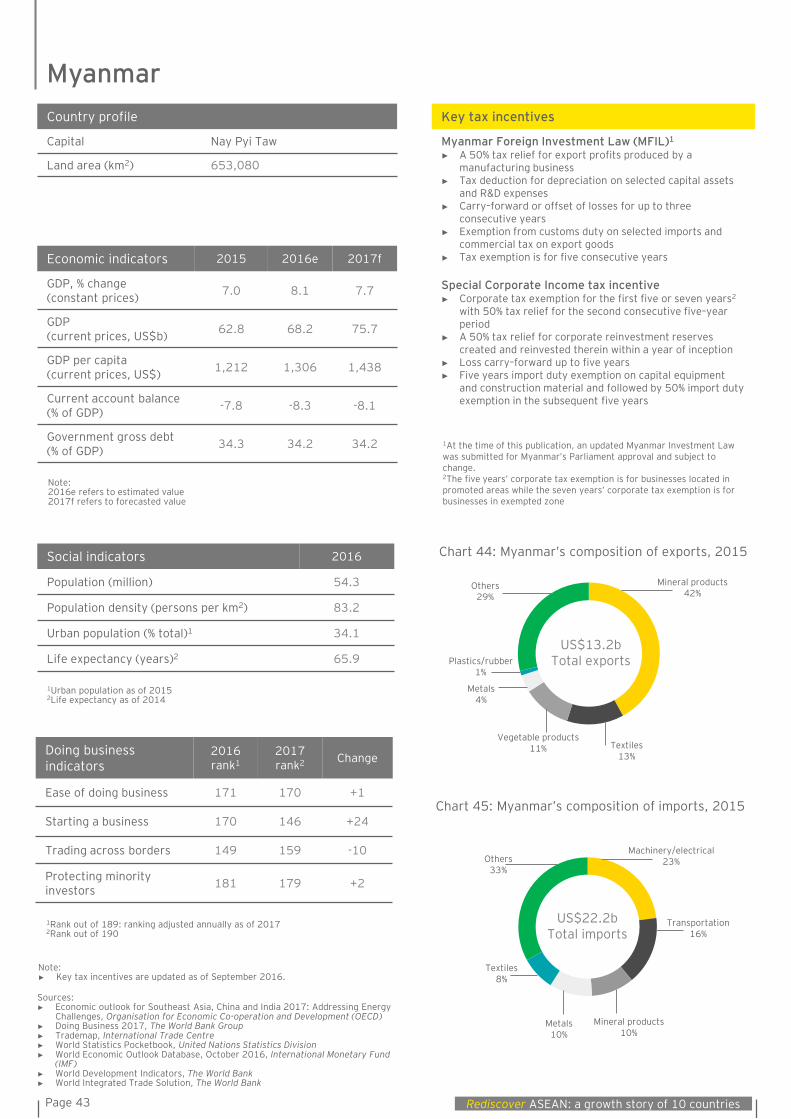
Myanmar
Economic indicators 2015 2016e 2017f
GDP, % change(constant prices) 7.0 8.1 7.7
GDP(current prices, US$b) 62.8 68.2 75.7
GDP per capita(current prices, US$) 1,212 1,306 1,438
Current account balance (% of GDP) -7.8 -8.3 -8.1
Government gross debt (% of GDP) 34.3 34.2 34.2
Social indicators 2016
Population (million) 54.3
Population density (persons per km2) 83.2
Urban population (% total)1 34.1
Life expectancy (years)2 65.9
Doing business indicators
2016 rank1
2017rank2 Change
Ease of doing business 171 170 +1
Starting a business 170 146 +24
Trading across borders 149 159 -10
Protecting minorityinvestors 181 179 +2
Key tax incentives
Myanmar Foreign Investment Law (MFIL)1
► A 50% tax relief for export profits produced by a manufacturing business
► Tax deduction for depreciation on selected capital assets and R&D expenses
► Carry–forward or offset of losses for up to three consecutive years
► Exemption from customs duty on selected imports and commercial tax on export goods
► Tax exemption is for five consecutive years
Special Corporate Income tax incentive ► Corporate tax exemption for the first five or seven years2
with 50% tax relief for the second consecutive five–year period
► A 50% tax relief for corporate reinvestment reserves created and reinvested therein within a year of inception
► Loss carry–forward up to five years► Five years import duty exemption on capital equipment
and construction material and followed by 50% import duty exemption in the subsequent five years
Country profile
Capital Nay Pyi Taw
Land area (km2) 653,080
Chart 44: Myanmar’s composition of exports, 2015
1At the time of this publication, an updated Myanmar Investment Law was submitted for Myanmar’s Parliament approval and subject to change.2The five years’ corporate tax exemption is for businesses located in promoted areas while the seven years’ corporate tax exemption is for businesses in exempted zone
Chart 45: Myanmar’s composition of imports, 2015
US$13.2bTotal exports
Mineral products42%
Textiles13%
Vegetable products11%
Metals4%
Plastics/rubber1%
Others29%
US$22.2bTotal imports
Machinery/electrical23%
Transportation16%
Mineral products10%
Metals10%
Textiles8%
Others33%
Note:► Key tax incentives are updated as of September 2016.
Sources: ► Economic outlook for Southeast Asia, China and India 2017: Addressing Energy
Challenges, Organisation for Economic Co-operation and Development (OECD)► Doing Business 2017, The World Bank Group► Trademap, International Trade Centre► World Statistics Pocketbook, United Nations Statistics Division► World Economic Outlook Database, October 2016, International Monetary Fund
(IMF)► World Development Indicators, The World Bank► World Integrated Trade Solution, The World Bank
1Rank out of 189: ranking adjusted annually as of 20172Rank out of 190
1Urban population as of 20152Life expectancy as of 2014
Note: 2016e refers to estimated value2017f refers to forecasted value
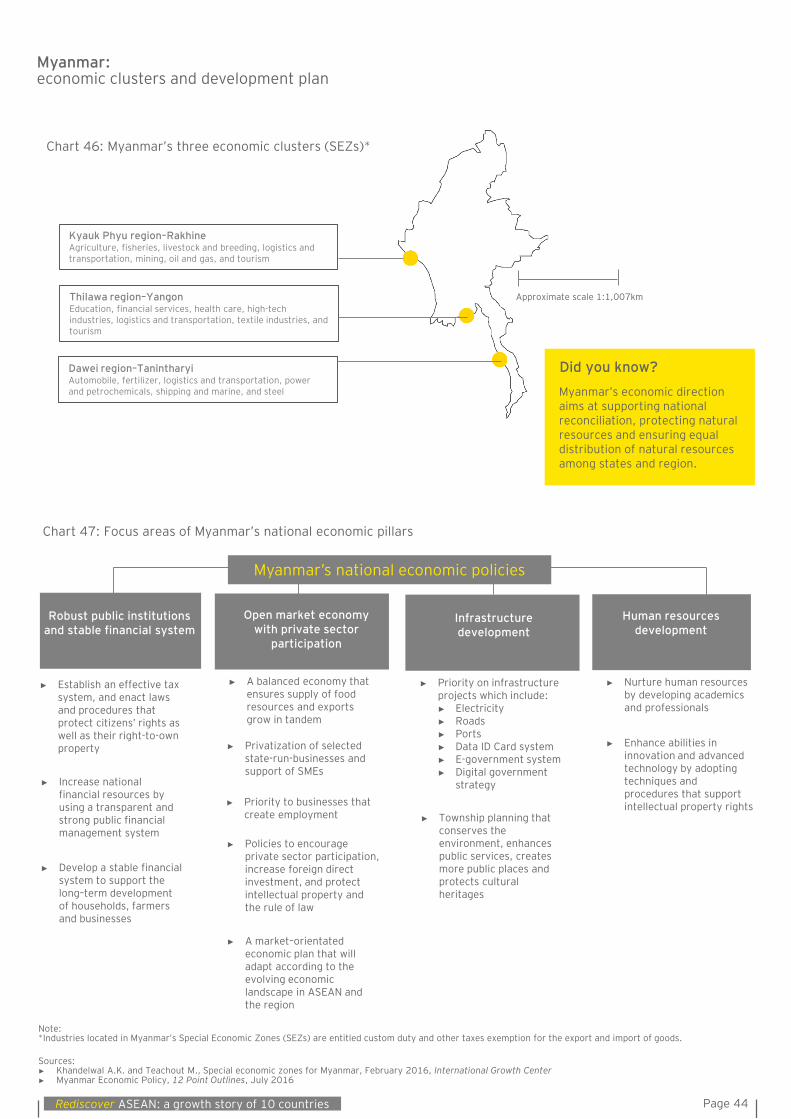
Page 44Rediscover ASEAN: a growth story of 10 countries
Myanmar: economic clusters and development plan
Sources: ► Khandelwal A.K. and Teachout M., Special economic zones for Myanmar, February 2016, International Growth Center► Myanmar Economic Policy, 12 Point Outlines, July 2016
Chart 47: Focus areas of Myanmar’s national economic pillars
► Increase national financial resources by using a transparent and strong public financial management system
► Develop a stable financial system to support the long–term development of households, farmers and businesses
► Establish an effective tax system, and enact laws and procedures that protect citizens’ rights as well as their right-to-own property
Robust public institutions and stable financial system
► Nurture human resources by developing academics and professionals
► Enhance abilities in innovation and advanced technology by adopting techniques and procedures that support intellectual property rights
Human resources development
► Privatization of selected state-run-businesses and support of SMEs
► Priority to businesses that create employment
► A balanced economy that ensures supply of food resources and exports grow in tandem
► Policies to encourage private sector participation, increase foreign direct investment, and protect intellectual property and the rule of law
► A market–orientated economic plan that will adapt according to the evolving economic landscape in ASEAN and the region
Open market economy with private sector
participation
► Priority on infrastructure projects which include:► Electricity► Roads► Ports ► Data ID Card system► E-government system► Digital government
strategy
► Township planning that conserves the environment, enhances public services, creates more public places and protects cultural heritages
Infrastructure development
Myanmar’s national economic policies
Note:*Industries located in Myanmar’s Special Economic Zones (SEZs) are entitled custom duty and other taxes exemption for the export and import of goods.
Chart 46: Myanmar’s three economic clusters (SEZs)*
Did you know?Myanmar’s economic direction aims at supporting national reconciliation, protecting natural resources and ensuring equal distribution of natural resources among states and region.
Kyauk Phyu region–Rakhine Agriculture, fisheries, livestock and breeding, logistics and transportation, mining, oil and gas, and tourism
Dawei region–TanintharyiAutomobile, fertilizer, logistics and transportation, power and petrochemicals, shipping and marine, and steel
Thilawa region–YangonEducation, financial services, health care, high-tech industries, logistics and transportation, textile industries, and tourism
Approximate scale 1:1,007km
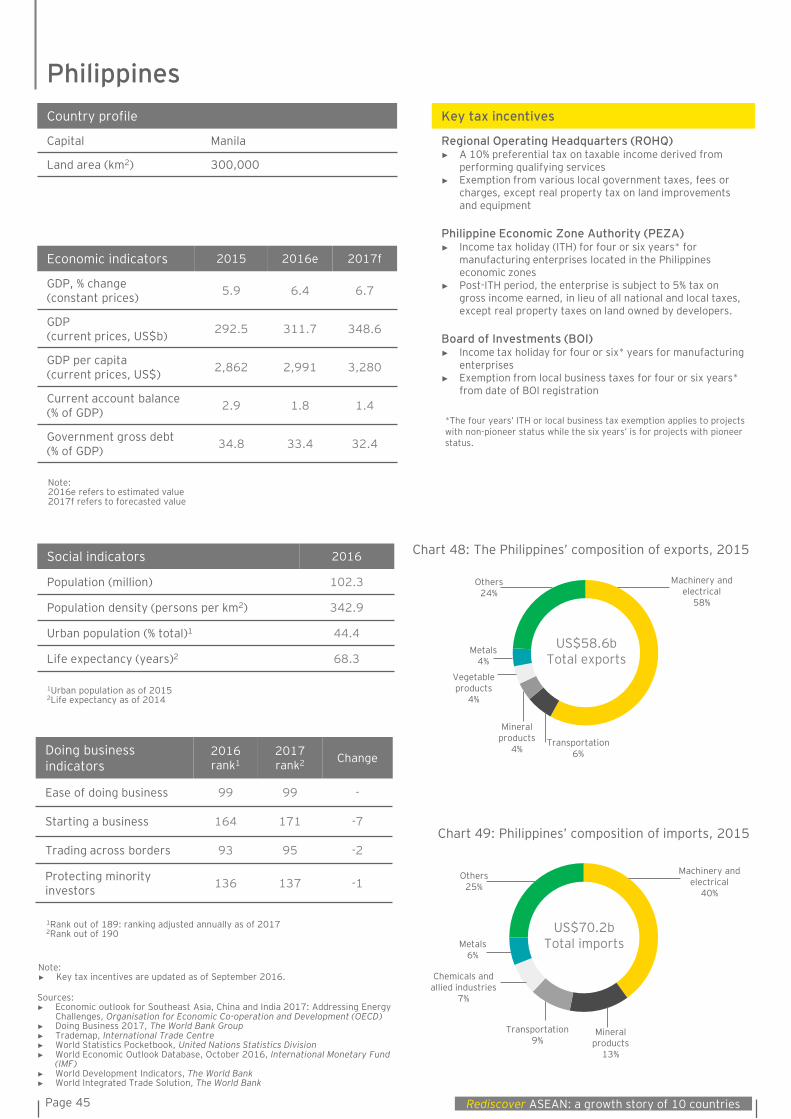
Page 45 Rediscover ASEAN: a growth story of 10 countries
US$58.6bTotal exports
Machinery and electrical
58%
Transportation6%
Vegetable products
4%
Metals4%
Mineral products
4%
Others24%
US$70.2bTotal imports
Machinery and electrical
40%
Transportation9%
Chemicals and allied industries
7%
Metals6%
Mineral products
13%
Others25%
Philippines
Economic indicators 2015 2016e 2017f
GDP, % change(constant prices) 5.9 6.4 6.7
GDP(current prices, US$b) 292.5 311.7 348.6
GDP per capita(current prices, US$) 2,862 2,991 3,280
Current account balance (% of GDP) 2.9 1.8 1.4
Government gross debt (% of GDP) 34.8 33.4 32.4
Social indicators 2016
Population (million) 102.3
Population density (persons per km2) 342.9
Urban population (% total)1 44.4
Life expectancy (years)2 68.3
Doing business indicators
2016 rank1
2017rank2 Change
Ease of doing business 99 99 -
Starting a business 164 171 -7
Trading across borders 93 95 -2
Protecting minorityinvestors 136 137 -1
Key tax incentives
Regional Operating Headquarters (ROHQ)► A 10% preferential tax on taxable income derived from
performing qualifying services► Exemption from various local government taxes, fees or
charges, except real property tax on land improvements and equipment
Philippine Economic Zone Authority (PEZA)► Income tax holiday (ITH) for four or six years* for
manufacturing enterprises located in the Philippines economic zones
► Post-ITH period, the enterprise is subject to 5% tax on gross income earned, in lieu of all national and local taxes, except real property taxes on land owned by developers.
Board of Investments (BOI) ► Income tax holiday for four or six* years for manufacturing
enterprises► Exemption from local business taxes for four or six years*
from date of BOI registration
Country profile
Capital Manila
Land area (km2) 300,000
*The four years’ ITH or local business tax exemption applies to projects with non-pioneer status while the six years’ is for projects with pioneer status.
Chart 49: Philippines’ composition of imports, 2015
Chart 48: The Philippines’ composition of exports, 2015
Note:► Key tax incentives are updated as of September 2016.
Sources: ► Economic outlook for Southeast Asia, China and India 2017: Addressing Energy
Challenges, Organisation for Economic Co-operation and Development (OECD)► Doing Business 2017, The World Bank Group► Trademap, International Trade Centre► World Statistics Pocketbook, United Nations Statistics Division► World Economic Outlook Database, October 2016, International Monetary Fund
(IMF)► World Development Indicators, The World Bank► World Integrated Trade Solution, The World Bank
1Rank out of 189: ranking adjusted annually as of 20172Rank out of 190
1Urban population as of 20152Life expectancy as of 2014
Note: 2016e refers to estimated value2017f refers to forecasted value
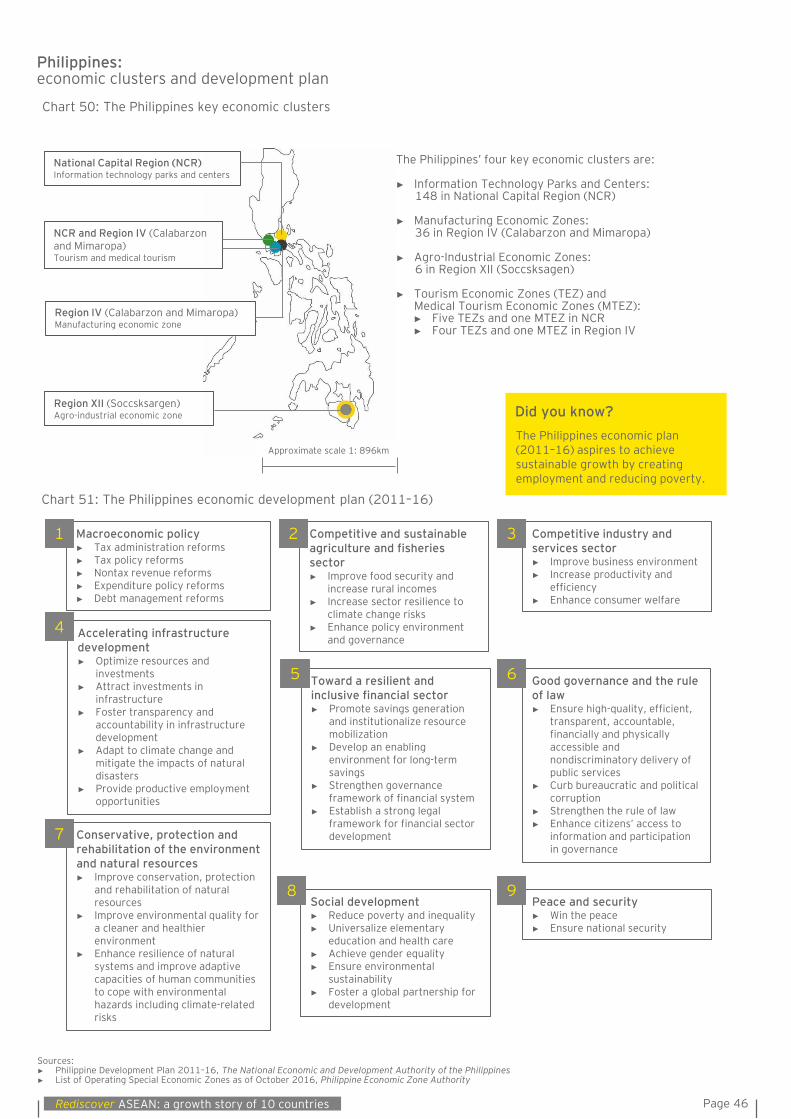
Page 46Rediscover ASEAN: a growth story of 10 countries
Philippines: economic clusters and development plan
Sources: ► Philippine Development Plan 2011–16, The National Economic and Development Authority of the Philippines► List of Operating Special Economic Zones as of October 2016, Philippine Economic Zone Authority
Chart 50: The Philippines key economic clusters
Chart 51: The Philippines economic development plan (2011–16)
Did you know?The Philippines economic plan (2011–16) aspires to achieve sustainable growth by creating employment and reducing poverty.
The Philippines’ four key economic clusters are:
► Information Technology Parks and Centers:148 in National Capital Region (NCR)
► Manufacturing Economic Zones: 36 in Region IV (Calabarzon and Mimaropa)
► Agro-Industrial Economic Zones:6 in Region XII (Soccsksagen)
► Tourism Economic Zones (TEZ) and Medical Tourism Economic Zones (MTEZ): ► Five TEZs and one MTEZ in NCR► Four TEZs and one MTEZ in Region IV
National Capital Region (NCR)Information technology parks and centers
Region IV (Calabarzon and Mimaropa) Manufacturing economic zone
Region XII (Soccsksargen)Agro-industrial economic zone
NCR and Region IV (Calabarzonand Mimaropa) Tourism and medical tourism
Conservative, protection and rehabilitation of the environment and natural resources► Improve conservation, protection
and rehabilitation of natural resources
► Improve environmental quality for a cleaner and healthier environment
► Enhance resilience of natural systems and improve adaptive capacities of human communities to cope with environmental hazards including climate-related risks
Social development► Reduce poverty and inequality► Universalize elementary
education and health care► Achieve gender equality► Ensure environmental
sustainability► Foster a global partnership for
development
8
Macroeconomic policy► Tax administration reforms► Tax policy reforms► Nontax revenue reforms► Expenditure policy reforms► Debt management reforms
Accelerating infrastructure development► Optimize resources and
investments► Attract investments in
infrastructure► Foster transparency and
accountability in infrastructure development
► Adapt to climate change and mitigate the impacts of natural disasters
► Provide productive employment opportunities
1
4
7
Toward a resilient and inclusive financial sector► Promote savings generation
and institutionalize resource mobilization
► Develop an enabling environment for long-term savings
► Strengthen governance framework of financial system
► Establish a strong legal framework for financial sector development
Competitive and sustainable agriculture and fisheries sector► Improve food security and
increase rural incomes► Increase sector resilience to
climate change risks► Enhance policy environment
and governance
2
5
Competitive industry and services sector► Improve business environment► Increase productivity and
efficiency► Enhance consumer welfare
Good governance and the rule of law► Ensure high-quality, efficient,
transparent, accountable, financially and physically accessible and nondiscriminatory delivery of public services
► Curb bureaucratic and political corruption
► Strengthen the rule of law► Enhance citizens’ access to
information and participation in governance
3
6
Peace and security► Win the peace► Ensure national security
9
Approximate scale 1: 896km
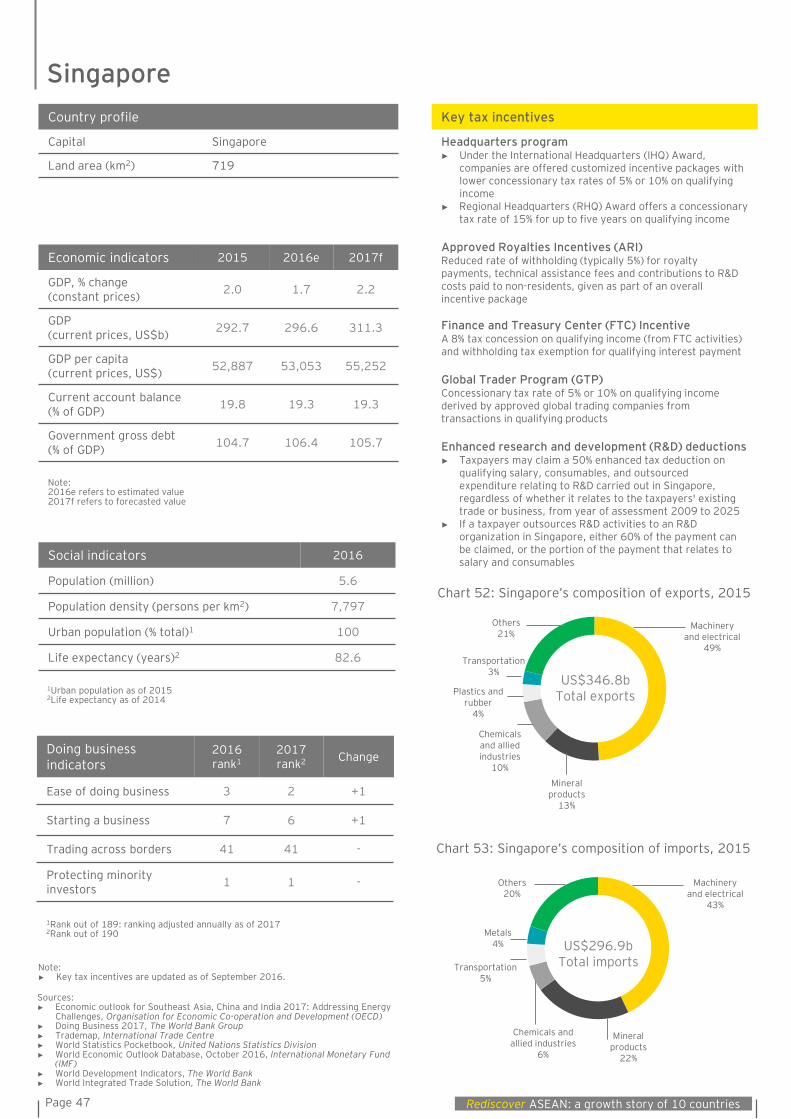
Page 47 Rediscover ASEAN: a growth story of 10 countries
Singapore
Economic indicators 2015 2016e 2017f
GDP, % change(constant prices) 2.0 1.7 2.2
GDP(current prices, US$b) 292.7 296.6 311.3
GDP per capita(current prices, US$) 52,887 53,053 55,252
Current account balance (% of GDP) 19.8 19.3 19.3
Government gross debt (% of GDP) 104.7 106.4 105.7
Social indicators 2016
Population (million) 5.6
Population density (persons per km2) 7,797
Urban population (% total)1 100
Life expectancy (years)2 82.6
Doing business indicators
2016 rank1
2017rank2 Change
Ease of doing business 3 2 +1
Starting a business 7 6 +1
Trading across borders 41 41 -
Protecting minorityinvestors 1 1 -
Key tax incentives
Headquarters program► Under the International Headquarters (IHQ) Award,
companies are offered customized incentive packages with lower concessionary tax rates of 5% or 10% on qualifying income
► Regional Headquarters (RHQ) Award offers a concessionary tax rate of 15% for up to five years on qualifying income
Approved Royalties Incentives (ARI) Reduced rate of withholding (typically 5%) for royalty payments, technical assistance fees and contributions to R&D costs paid to non-residents, given as part of an overall incentive package
Finance and Treasury Center (FTC) IncentiveA 8% tax concession on qualifying income (from FTC activities) and withholding tax exemption for qualifying interest payment
Global Trader Program (GTP) Concessionary tax rate of 5% or 10% on qualifying income derived by approved global trading companies from transactions in qualifying products
Enhanced research and development (R&D) deductions ► Taxpayers may claim a 50% enhanced tax deduction on
qualifying salary, consumables, and outsourced expenditure relating to R&D carried out in Singapore,regardless of whether it relates to the taxpayers' existing trade or business, from year of assessment 2009 to 2025
► If a taxpayer outsources R&D activities to an R&D organization in Singapore, either 60% of the payment can be claimed, or the portion of the payment that relates to salary and consumables
Country profile
Capital Singapore
Land area (km2) 719
Chart 52: Singapore’s composition of exports, 2015
Chart 53: Singapore’s composition of imports, 2015
US$346.8bTotal exports
Machinery and electrical
49%
Chemicals and allied industries
10%
Plastics and rubber
4%
Transportation3%
Mineral products
13%
Others21%
Transportation5%
US$296.9bTotal imports
Machinery and electrical
43%
Mineral products
22%
Chemicals and allied industries
6%
Metals4%
Others20%
Note:► Key tax incentives are updated as of September 2016.
Sources: ► Economic outlook for Southeast Asia, China and India 2017: Addressing Energy
Challenges, Organisation for Economic Co-operation and Development (OECD)► Doing Business 2017, The World Bank Group► Trademap, International Trade Centre► World Statistics Pocketbook, United Nations Statistics Division► World Economic Outlook Database, October 2016, International Monetary Fund
(IMF)► World Development Indicators, The World Bank► World Integrated Trade Solution, The World Bank
1Rank out of 189: ranking adjusted annually as of 20172Rank out of 190
1Urban population as of 20152Life expectancy as of 2014
Note: 2016e refers to estimated value2017f refers to forecasted value
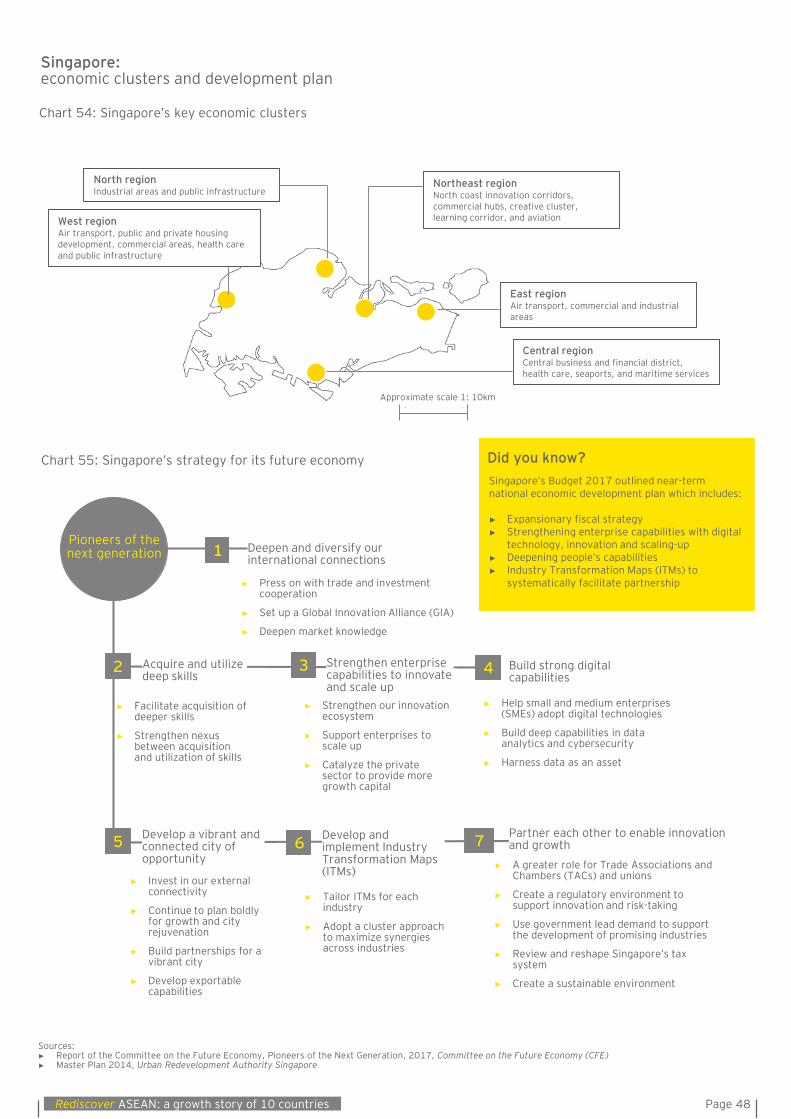
Page 48Rediscover ASEAN: a growth story of 10 countries
Singapore: economic clusters and development plan
Sources: ► Report of the Committee on the Future Economy, Pioneers of the Next Generation, 2017, Committee on the Future Economy (CFE)► Master Plan 2014, Urban Redevelopment Authority Singapore
Chart 55: Singapore’s strategy for its future economy Did you know?Singapore’s Budget 2017 outlined near-term national economic development plan which includes:
► Expansionary fiscal strategy► Strengthening enterprise capabilities with digital
technology, innovation and scaling-up► Deepening people’s capabilities► Industry Transformation Maps (ITMs) to
systematically facilitate partnership
Pioneers of the next generation Deepen and diversify our
international connections
► Press on with trade and investment cooperation
► Set up a Global Innovation Alliance (GIA)
► Deepen market knowledge
1
Acquire and utilize deep skills
► Facilitate acquisition of deeper skills
► Strengthen nexus between acquisition and utilization of skills
2 Strengthen enterprise capabilities to innovate and scale up
► Strengthen our innovation ecosystem
► Support enterprises to scale up
► Catalyze the private sector to provide more growth capital
3 Build strong digital capabilities
► Help small and medium enterprises (SMEs) adopt digital technologies
► Build deep capabilities in data analytics and cybersecurity
► Harness data as an asset
4
Develop a vibrant and connected city of opportunity
► Invest in our external connectivity
► Continue to plan boldly for growth and city rejuvenation
► Build partnerships for a vibrant city
► Develop exportable capabilities
5 Develop and implement Industry Transformation Maps (ITMs)
► Tailor ITMs for each industry
► Adopt a cluster approach to maximize synergies across industries
6Partner each other to enable innovation and growth
► A greater role for Trade Associations and Chambers (TACs) and unions
► Create a regulatory environment to support innovation and risk-taking
► Use government lead demand to support the development of promising industries
► Review and reshape Singapore’s tax system
► Create a sustainable environment
7
North regionIndustrial areas and public infrastructure
Northeast regionNorth coast innovation corridors, commercial hubs, creative cluster, learning corridor, and aviation
East regionAir transport, commercial and industrial areas
West regionAir transport, public and private housing development, commercial areas, health care and public infrastructure
Central regionCentral business and financial district, health care, seaports, and maritime services
Chart 54: Singapore’s key economic clusters
Approximate scale 1: 10km
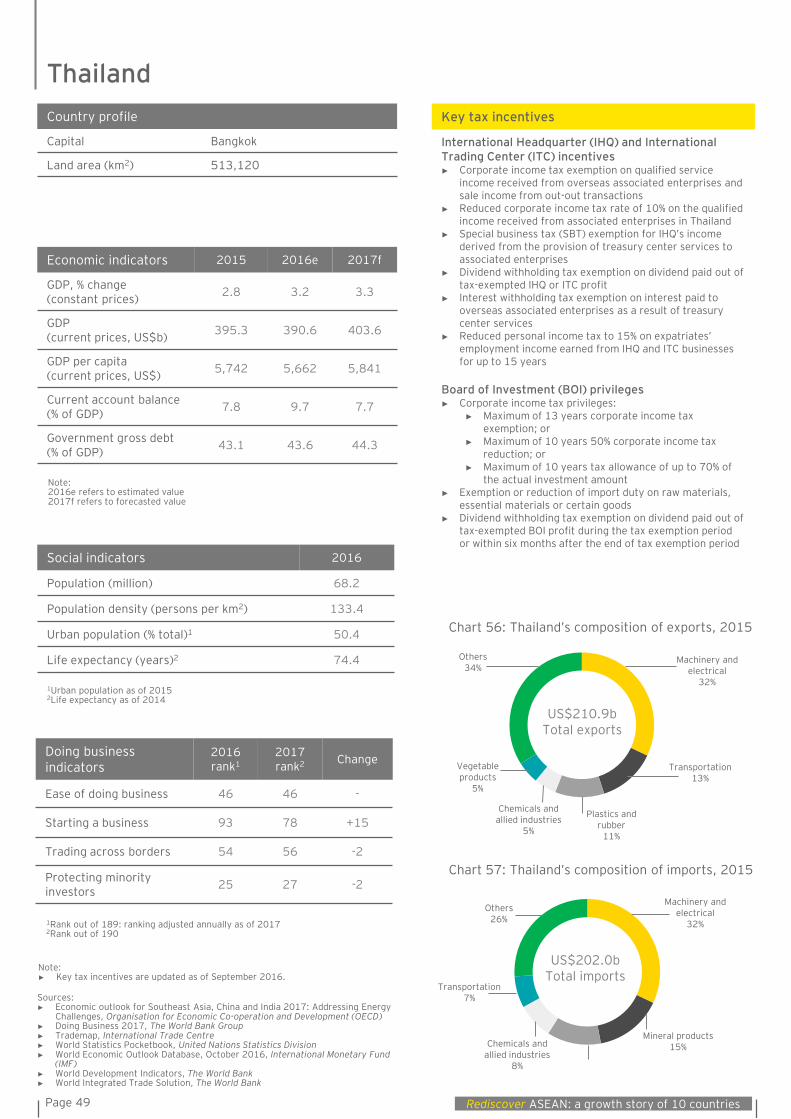
Page 49 Rediscover ASEAN: a growth story of 10 countries
Thailand
Economic indicators 2015 2016e 2017f
GDP, % change(constant prices) 2.8 3.2 3.3
GDP(current prices, US$b) 395.3 390.6 403.6
GDP per capita(current prices, US$) 5,742 5,662 5,841
Current account balance (% of GDP) 7.8 9.7 7.7
Government gross debt (% of GDP) 43.1 43.6 44.3
Social indicators 2016
Population (million) 68.2
Population density (persons per km2) 133.4
Urban population (% total)1 50.4
Life expectancy (years)2 74.4
Doing business indicators
2016rank1
2017rank2 Change
Ease of doing business 46 46 -
Starting a business 93 78 +15
Trading across borders 54 56 -2
Protecting minorityinvestors 25 27 -2
Key tax incentives
International Headquarter (IHQ) and International Trading Center (ITC) incentives ► Corporate income tax exemption on qualified service
income received from overseas associated enterprises and sale income from out-out transactions
► Reduced corporate income tax rate of 10% on the qualified income received from associated enterprises in Thailand
► Special business tax (SBT) exemption for IHQ’s income derived from the provision of treasury center services to associated enterprises
► Dividend withholding tax exemption on dividend paid out of tax-exempted IHQ or ITC profit
► Interest withholding tax exemption on interest paid to overseas associated enterprises as a result of treasury center services
► Reduced personal income tax to 15% on expatriates’ employment income earned from IHQ and ITC businesses for up to 15 years
Board of Investment (BOI) privileges► Corporate income tax privileges:
► Maximum of 13 years corporate income tax exemption; or
► Maximum of 10 years 50% corporate income tax reduction; or
► Maximum of 10 years tax allowance of up to 70% of the actual investment amount
► Exemption or reduction of import duty on raw materials, essential materials or certain goods
► Dividend withholding tax exemption on dividend paid out of tax-exempted BOI profit during the tax exemption period or within six months after the end of tax exemption period
Country profile
Capital Bangkok
Land area (km2) 513,120
Chart 57: Thailand’s composition of imports, 2015
Chart 56: Thailand’s composition of exports, 2015
Plastics and rubber
11%
Chemicals and allied industries
5%
US$210.9bTotal exports
Machinery and electrical
32%
Transportation13%
Vegetable products
5%
Others34%
US$202.0bTotal imports
Machinery and electrical
32%
Mineral products15%
Transportation7%
Chemicals and allied industries
8%
Others26%
Note:► Key tax incentives are updated as of September 2016.
Sources: ► Economic outlook for Southeast Asia, China and India 2017: Addressing Energy
Challenges, Organisation for Economic Co-operation and Development (OECD)► Doing Business 2017, The World Bank Group► Trademap, International Trade Centre► World Statistics Pocketbook, United Nations Statistics Division► World Economic Outlook Database, October 2016, International Monetary Fund
(IMF)► World Development Indicators, The World Bank► World Integrated Trade Solution, The World Bank
1Rank out of 189: ranking adjusted annually as of 20172Rank out of 190
1Urban population as of 20152Life expectancy as of 2014
Note: 2016e refers to estimated value2017f refers to forecasted value
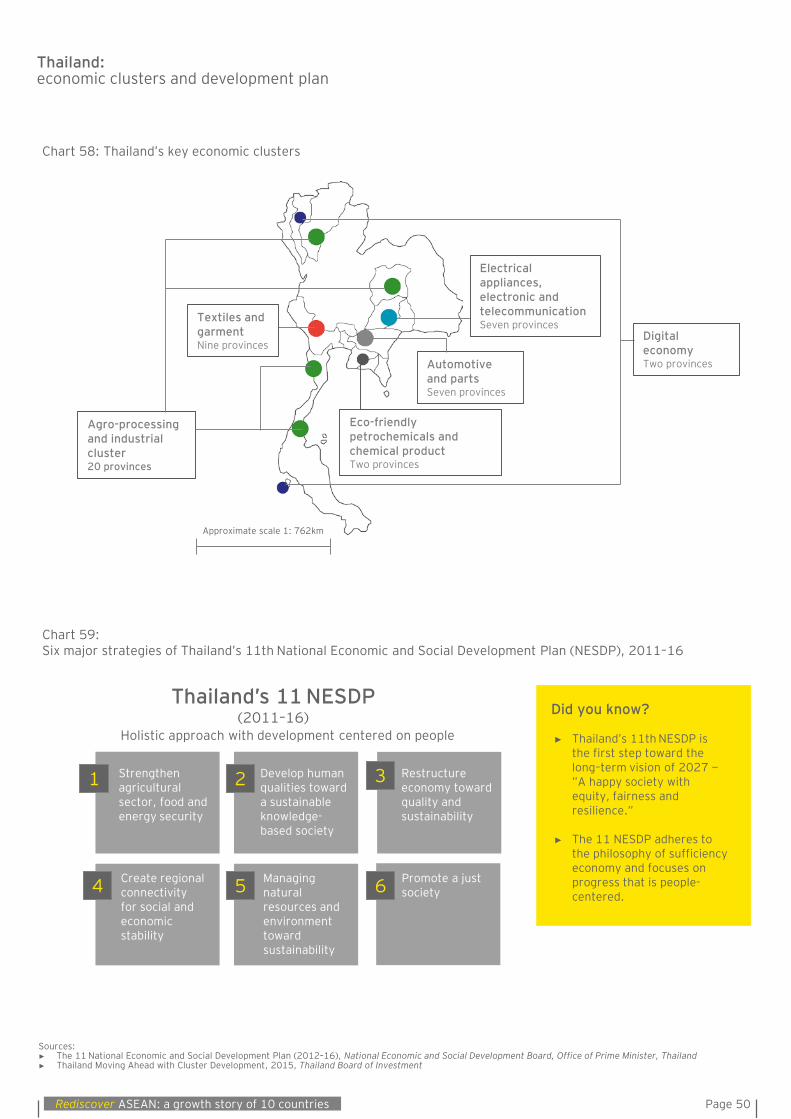
Page 50Rediscover ASEAN: a growth story of 10 countries
Agro-processing and industrial cluster20 provinces
Textiles and garment Nine provinces
Eco-friendly petrochemicals and chemical productTwo provinces
Automotive and partsSeven provinces
Electrical appliances, electronic and telecommunicationSeven provinces
Digital economy Two provinces
Thailand: economic clusters and development plan
Sources: ► The 11 National Economic and Social Development Plan (2012–16), National Economic and Social Development Board, Office of Prime Minister, Thailand► Thailand Moving Ahead with Cluster Development, 2015, Thailand Board of Investment
Chart 58: Thailand’s key economic clusters
Did you know?
► Thailand’s 11th NESDP is the first step toward the long–term vision of 2027 − ”A happy society with equity, fairness and resilience.”
► The 11 NESDP adheres to the philosophy of sufficiency economy and focuses on progress that is people-centered.
Chart 59: Six major strategies of Thailand’s 11th National Economic and Social Development Plan (NESDP), 2011–16
Thailand’s 11 NESDP(2011–16)
Holistic approach with development centered on people
Promote a just society
Develop human qualities toward a sustainable knowledge-based society
Strengthen agricultural sector, food and energy security
Restructure economy toward quality and sustainability
Create regional connectivity for social and economic stability
Managing natural resources and environment toward sustainability
1 2 3
4 5 6
Approximate scale 1: 762km

Page 51 Rediscover ASEAN: a growth story of 10 countries
Vietnam
Economic indicators 2015 2016e 2017f
GDP, % change(constant prices) 6.7 6.1 6.2
GDP(current prices, US$b) 191.5 200.5 215.9
GDP per capita(current prices, US$) 2,088 2,164 2,306
Current account balance (% of GDP) 0.5 0.4 0.1
Government gross debt (% of GDP) 58.3 62.0 64.6
Social indicators 2016
Population (million) 94.4
Population density (persons per km2) 304.6
Urban population (% total)1 33.6
Life expectancy (years)2 75.6
Doing business indicators
2016 rank1
2017rank2 Change
Ease of doing business 91 82 +9
Starting a business 111 121 -10
Trading across borders 108 93 +15
Protecting minorityinvestors 118 87 +31
Key tax incentives
Preferential corporate income tax (CIT) rates ► A 17% tax rate up to 10 years for regulated, encouraged
business sectors at encouraged locations or scale of projects
► A 10% tax rate up to 15 years (applicable to selected social sectors)
Tax holidays and reduction► Tax holidays for two to four years► Commencement from first year with taxable income if no
taxable income within the first three years, the taxincentive period can be triggered from the fourth year
► A 50% tax reduction for four, five or nine years post-tax holiday period
Country profile
Capital Hanoi
Land area (km2) 330,951
Chart 61: Vietnam’s composition of imports, 2015
Chart 60: Vietnam’s composition of exports, 2015
Textiles16%
Vegetable products
5%
US$162.0bTotal exports
Machinery and electrical
42%
Mineral products
3%
Plastics and rubber
3%
Others31%
US$165.8bTotal imports
Machinery and electrical
33%
Metals10%
Textiles13%
Plastics and rubber
5%
Chemical and allied industries
10%
Others33%
Note:► Key tax incentives are updated as of September 2016.
Sources: ► Economic outlook for Southeast Asia, China and India 2017: Addressing Energy
Challenges, Organisation for Economic Co-operation and Development (OECD)► Doing Business 2017, The World Bank Group► Trademap, International Trade Centre► World Statistics Pocketbook, United Nations Statistics Division► World Economic Outlook Database, October 2016, International Monetary Fund
(IMF)► World Development Indicators, The World Bank► World Integrated Trade Solution, The World Bank
1Rank out of 189: ranking adjusted annually as of 20172Rank out of 190
1Urban population as of 20152Life expectancy as of 2014
Note: 2016e refers to estimated value2017f refers to forecasted value
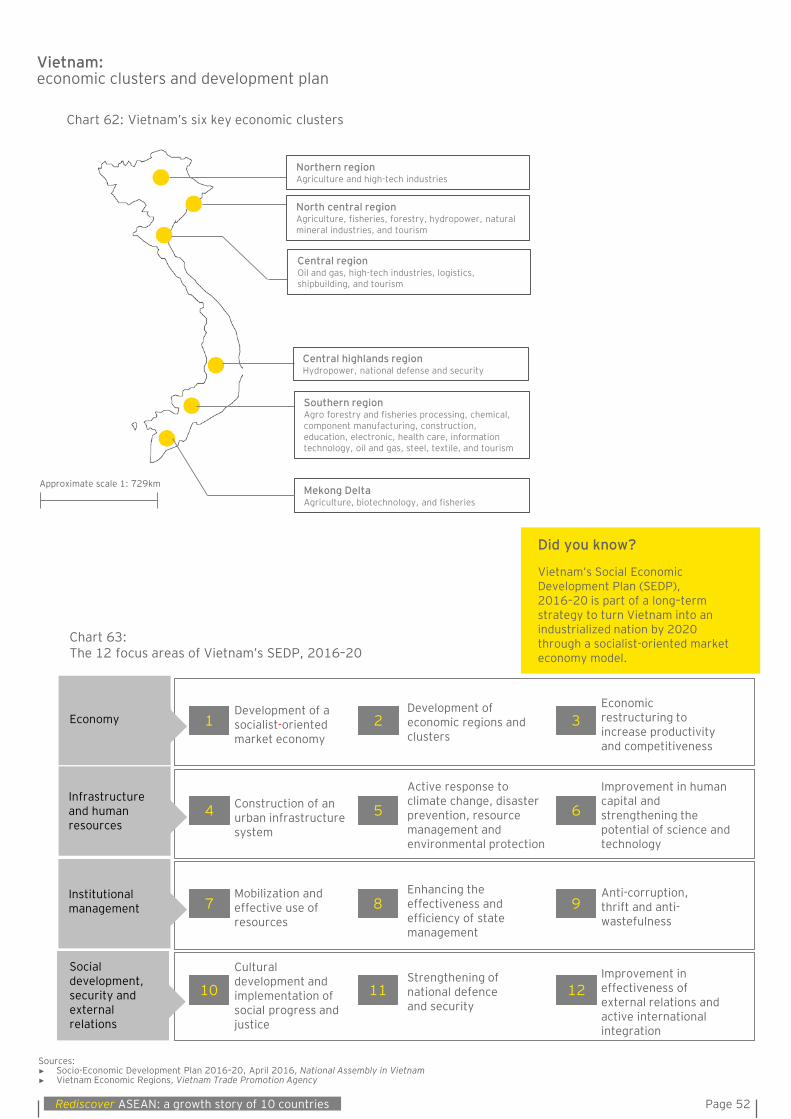
Page 52Rediscover ASEAN: a growth story of 10 countries
Vietnam: economic clusters and development plan
Sources: ► Socio-Economic Development Plan 2016–20, April 2016, National Assembly in Vietnam► Vietnam Economic Regions, Vietnam Trade Promotion Agency
Chart 63: The 12 focus areas of Vietnam’s SEDP, 2016–20
Did you know?
Vietnam’s Social Economic Development Plan (SEDP), 2016–20 is part of a long–term strategy to turn Vietnam into an industrialized nation by 2020 through a socialist-oriented market economy model.
Improvement in human capital and strengthening the potential of science and technology
Economic restructuring to increase productivity and competitiveness
Development of a socialist-oriented market economy
Development of economic regions and clusters
Construction of an urban infrastructure system
Mobilization and effective use of resources
Cultural development and implementation of social progress and justice
Active response to climate change, disaster prevention, resource management and environmental protection
Improvement in effectiveness of external relations and active international integration
Strengthening of national defenceand security
Enhancing the effectiveness and efficiency of state management
8Anti-corruption, thrift and anti-wastefulness
7
12
64 5
321
9
10 11
Chart 62: Vietnam’s six key economic clusters
North central regionAgriculture, fisheries, forestry, hydropower, natural mineral industries, and tourism
Central regionOil and gas, high-tech industries, logistics, shipbuilding, and tourism
Central highlands regionHydropower, national defense and security
Southern regionAgro forestry and fisheries processing, chemical, component manufacturing, construction, education, electronic, health care, information technology, oil and gas, steel, textile, and tourism
Mekong DeltaAgriculture, biotechnology, and fisheries
Northern regionAgriculture and high-tech industries
Approximate scale 1: 729km
Social development, security and external relations
Economy
Infrastructure and human resources
Institutional management

Appendices
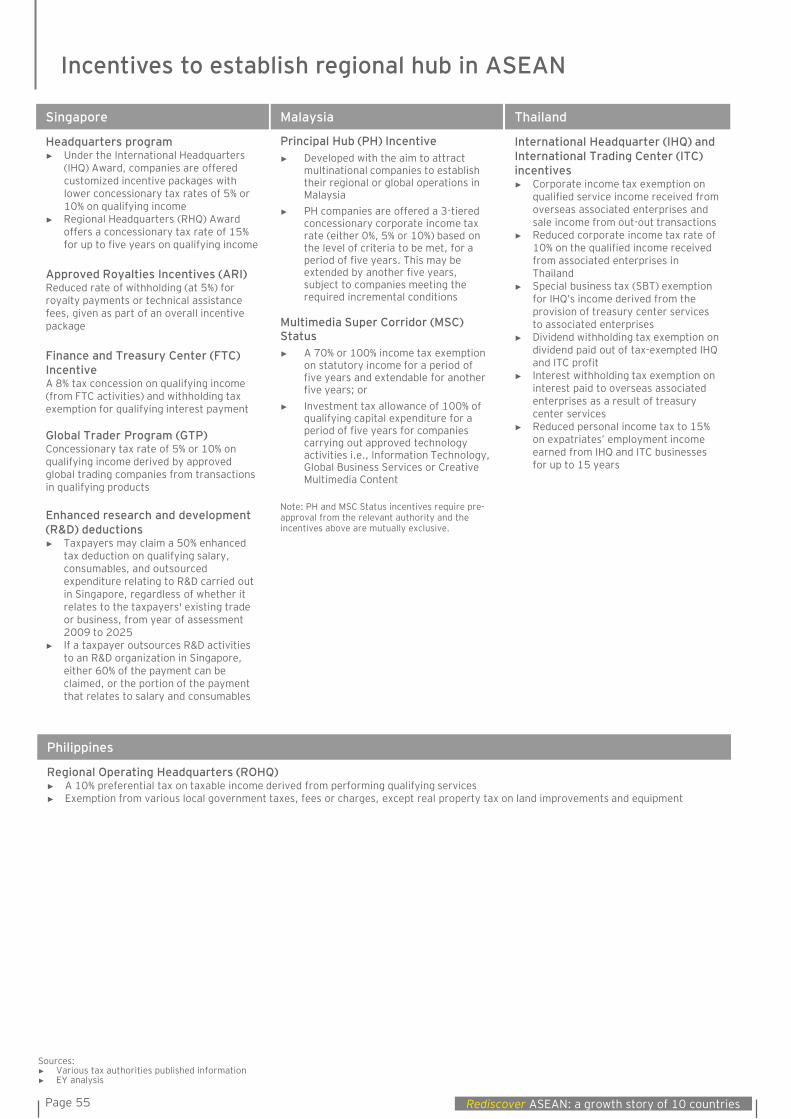
Page 55 Rediscover ASEAN: a growth story of 10 countries
Malaysia
Principal Hub (PH) Incentive ► Developed with the aim to attract
multinational companies to establish their regional or global operations in Malaysia
► PH companies are offered a 3-tiered concessionary corporate income tax rate (either 0%, 5% or 10%) based on the level of criteria to be met, for a period of five years. This may be extended by another five years, subject to companies meeting the required incremental conditions
Multimedia Super Corridor (MSC) Status► A 70% or 100% income tax exemption
on statutory income for a period of five years and extendable for another five years; or
► Investment tax allowance of 100% of qualifying capital expenditure for a period of five years for companies carrying out approved technology activities i.e., Information Technology, Global Business Services or Creative Multimedia Content
Note: PH and MSC Status incentives require pre-approval from the relevant authority and the incentives above are mutually exclusive.
Singapore
Headquarters program► Under the International Headquarters
(IHQ) Award, companies are offered customized incentive packages with lower concessionary tax rates of 5% or 10% on qualifying income
► Regional Headquarters (RHQ) Award offers a concessionary tax rate of 15% for up to five years on qualifying income
Approved Royalties Incentives (ARI) Reduced rate of withholding (at 5%) for royalty payments or technical assistance fees, given as part of an overall incentive package
Finance and Treasury Center (FTC)IncentiveA 8% tax concession on qualifying income (from FTC activities) and withholding tax exemption for qualifying interest payment
Global Trader Program (GTP) Concessionary tax rate of 5% or 10% on qualifying income derived by approved global trading companies from transactions in qualifying products
Enhanced research and development (R&D) deductions ► Taxpayers may claim a 50% enhanced
tax deduction on qualifying salary, consumables, and outsourced expenditure relating to R&D carried out in Singapore, regardless of whether it relates to the taxpayers' existing trade or business, from year of assessment 2009 to 2025
► If a taxpayer outsources R&D activities to an R&D organization in Singapore, either 60% of the payment can be claimed, or the portion of the payment that relates to salary and consumables
Thailand
International Headquarter (IHQ) and International Trading Center (ITC) incentives ► Corporate income tax exemption on
qualified service income received from overseas associated enterprises and sale income from out-out transactions
► Reduced corporate income tax rate of 10% on the qualified income received from associated enterprises in Thailand
► Special business tax (SBT) exemption for IHQ’s income derived from the provision of treasury center services to associated enterprises
► Dividend withholding tax exemption on dividend paid out of tax-exempted IHQand ITC profit
► Interest withholding tax exemption on interest paid to overseas associated enterprises as a result of treasury center services
► Reduced personal income tax to 15% on expatriates’ employment income earned from IHQ and ITC businesses for up to 15 years
Philippines
Regional Operating Headquarters (ROHQ)► A 10% preferential tax on taxable income derived from performing qualifying services► Exemption from various local government taxes, fees or charges, except real property tax on land improvements and equipment
Incentives to establish regional hub in ASEAN
Sources: ► Various tax authorities published information► EY analysis
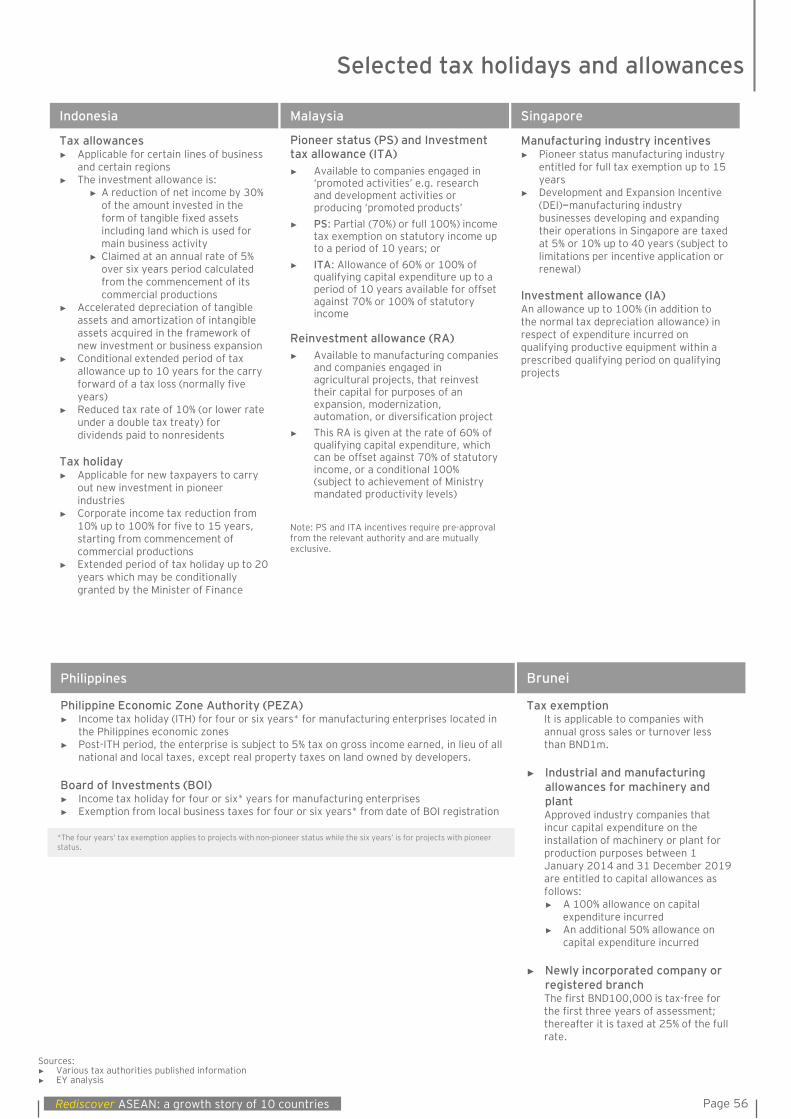
Page 56Rediscover ASEAN: a growth story of 10 countries
Brunei
Tax exemptionIt is applicable to companies with annual gross sales or turnover less than BND1m.
► Industrial and manufacturing allowances for machinery and plantApproved industry companies that incur capital expenditure on the installation of machinery or plant for production purposes between 1 January 2014 and 31 December 2019 are entitled to capital allowances as follows:► A 100% allowance on capital
expenditure incurred► An additional 50% allowance on
capital expenditure incurred
► Newly incorporated company or registered branchThe first BND100,000 is tax-free for the first three years of assessment; thereafter it is taxed at 25% of the full rate.
Indonesia
Tax allowances► Applicable for certain lines of business
and certain regions► The investment allowance is:
► A reduction of net income by 30% of the amount invested in the form of tangible fixed assets including land which is used for main business activity
► Claimed at an annual rate of 5% over six years period calculatedfrom the commencement of its commercial productions
► Accelerated depreciation of tangible assets and amortization of intangible assets acquired in the framework of new investment or business expansion
► Conditional extended period of tax allowance up to 10 years for the carryforward of a tax loss (normally fiveyears)
► Reduced tax rate of 10% (or lower rate under a double tax treaty) for dividends paid to nonresidents
Tax holiday► Applicable for new taxpayers to carry
out new investment in pioneer industries
► Corporate income tax reduction from 10% up to 100% for five to 15 years,starting from commencement of commercial productions
► Extended period of tax holiday up to 20 years which may be conditionally granted by the Minister of Finance
Sources: ► Various tax authorities published information► EY analysis
Selected tax holidays and allowances
Malaysia
Pioneer status (PS) and Investment tax allowance (ITA)► Available to companies engaged in
‘promoted activities’ e.g. researchand development activities or producing ‘promoted products’
► PS: Partial (70%) or full 100%) income tax exemption on statutory income up to a period of 10 years; or
► ITA: Allowance of 60% or 100% of qualifying capital expenditure up to a period of 10 years available for offset against 70% or 100% of statutory income
Reinvestment allowance (RA)► Available to manufacturing companies
and companies engaged in agricultural projects, that reinvest their capital for purposes of an expansion, modernization, automation, or diversification project
► This RA is given at the rate of 60% of qualifying capital expenditure, which can be offset against 70% of statutory income, or a conditional 100% (subject to achievement of Ministry mandated productivity levels)
Note: PS and ITA incentives require pre-approvalfrom the relevant authority and are mutually exclusive.
Singapore
Manufacturing industry incentives► Pioneer status manufacturing industry
entitled for full tax exemption up to 15 years
► Development and Expansion Incentive (DEI)−manufacturing industry businesses developing and expandingtheir operations in Singapore are taxed at 5% or 10% up to 40 years (subject to limitations per incentive application or renewal)
Investment allowance (IA)An allowance up to 100% (in addition to the normal tax depreciation allowance) in respect of expenditure incurred on qualifying productive equipment within a prescribed qualifying period on qualifying projects
Philippines
Philippine Economic Zone Authority (PEZA)► Income tax holiday (ITH) for four or six years* for manufacturing enterprises located in
the Philippines economic zones► Post-ITH period, the enterprise is subject to 5% tax on gross income earned, in lieu of all
national and local taxes, except real property taxes on land owned by developers.
Board of Investments (BOI) ► Income tax holiday for four or six* years for manufacturing enterprises► Exemption from local business taxes for four or six years* from date of BOI registration
*The four years’ tax exemption applies to projects with non-pioneer status while the six years’ is for projects with pioneer status.
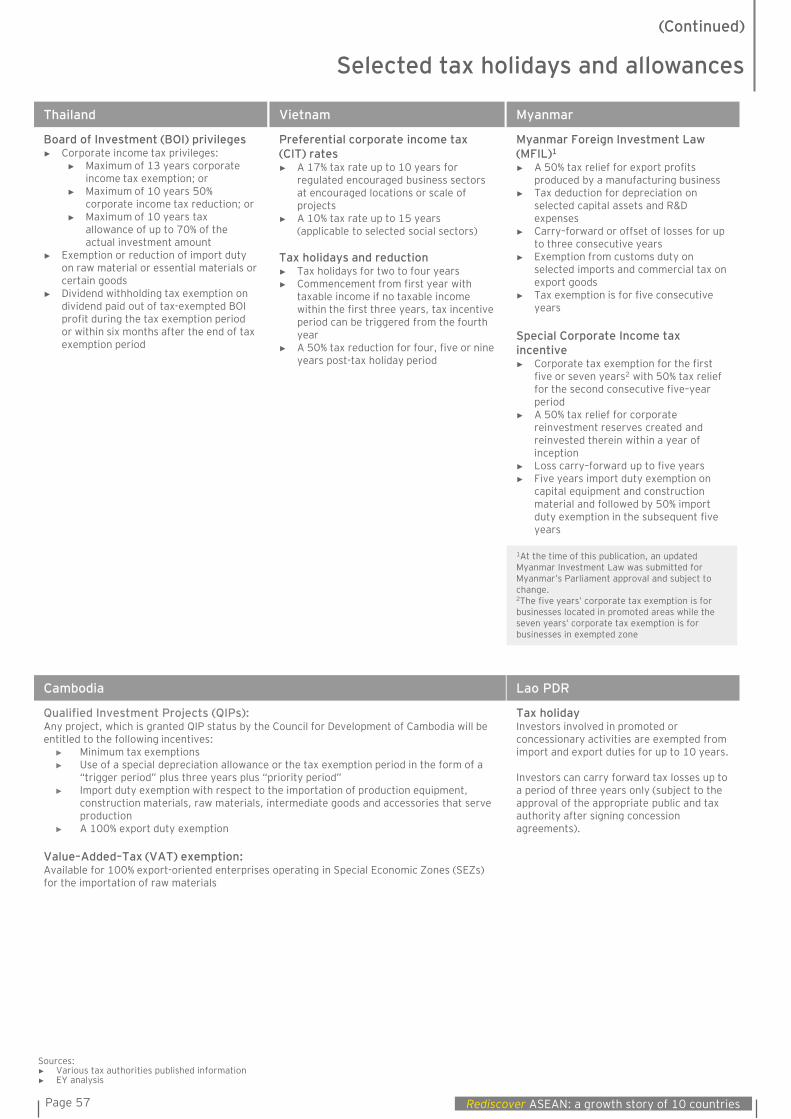
Page 57 Rediscover ASEAN: a growth story of 10 countries
Myanmar
Myanmar Foreign Investment Law (MFIL)1
► A 50% tax relief for export profits produced by a manufacturing business
► Tax deduction for depreciation on selected capital assets and R&D expenses
► Carry–forward or offset of losses for up to three consecutive years
► Exemption from customs duty on selected imports and commercial tax on export goods
► Tax exemption is for five consecutiveyears
Special Corporate Income tax incentive► Corporate tax exemption for the first
five or seven years2 with 50% tax relief for the second consecutive five–year period
► A 50% tax relief for corporate reinvestment reserves created and reinvested therein within a year of inception
► Loss carry–forward up to five years► Five years import duty exemption on
capital equipment and construction material and followed by 50% import duty exemption in the subsequent fiveyears
Cambodia
Qualified Investment Projects (QIPs): Any project, which is granted QIP status by the Council for Development of Cambodia will be entitled to the following incentives:
► Minimum tax exemptions► Use of a special depreciation allowance or the tax exemption period in the form of a
“trigger period” plus three years plus “priority period”► Import duty exemption with respect to the importation of production equipment,
construction materials, raw materials, intermediate goods and accessories that serve production
► A 100% export duty exemption
Value–Added–Tax (VAT) exemption: Available for 100% export-oriented enterprises operating in Special Economic Zones (SEZs)for the importation of raw materials
Lao PDR
Tax holidayInvestors involved in promoted or concessionary activities are exempted from import and export duties for up to 10 years.
Investors can carry forward tax losses up to a period of three years only (subject to the approval of the appropriate public and tax authority after signing concession agreements).
Vietnam
Preferential corporate income tax (CIT) rates► A 17% tax rate up to 10 years for
regulated encouraged business sectors at encouraged locations or scale of projects
► A 10% tax rate up to 15 years(applicable to selected social sectors)
Tax holidays and reduction► Tax holidays for two to four years► Commencement from first year with
taxable income if no taxable income within the first three years, tax incentive period can be triggered from the fourth year
► A 50% tax reduction for four, five or nine years post-tax holiday period
Sources: ► Various tax authorities published information► EY analysis
1At the time of this publication, an updated Myanmar Investment Law was submitted for Myanmar’s Parliament approval and subject to change.2The five years’ corporate tax exemption is for businesses located in promoted areas while the seven years’ corporate tax exemption is for businesses in exempted zone
Selected tax holidays and allowances
Thailand
Board of Investment (BOI) privileges► Corporate income tax privileges:
► Maximum of 13 years corporate income tax exemption; or
► Maximum of 10 years 50% corporate income tax reduction; or
► Maximum of 10 years tax allowance of up to 70% of the actual investment amount
► Exemption or reduction of import duty on raw material or essential materials or certain goods
► Dividend withholding tax exemption on dividend paid out of tax-exempted BOI profit during the tax exemption period or within six months after the end of tax exemption period
(Continued)
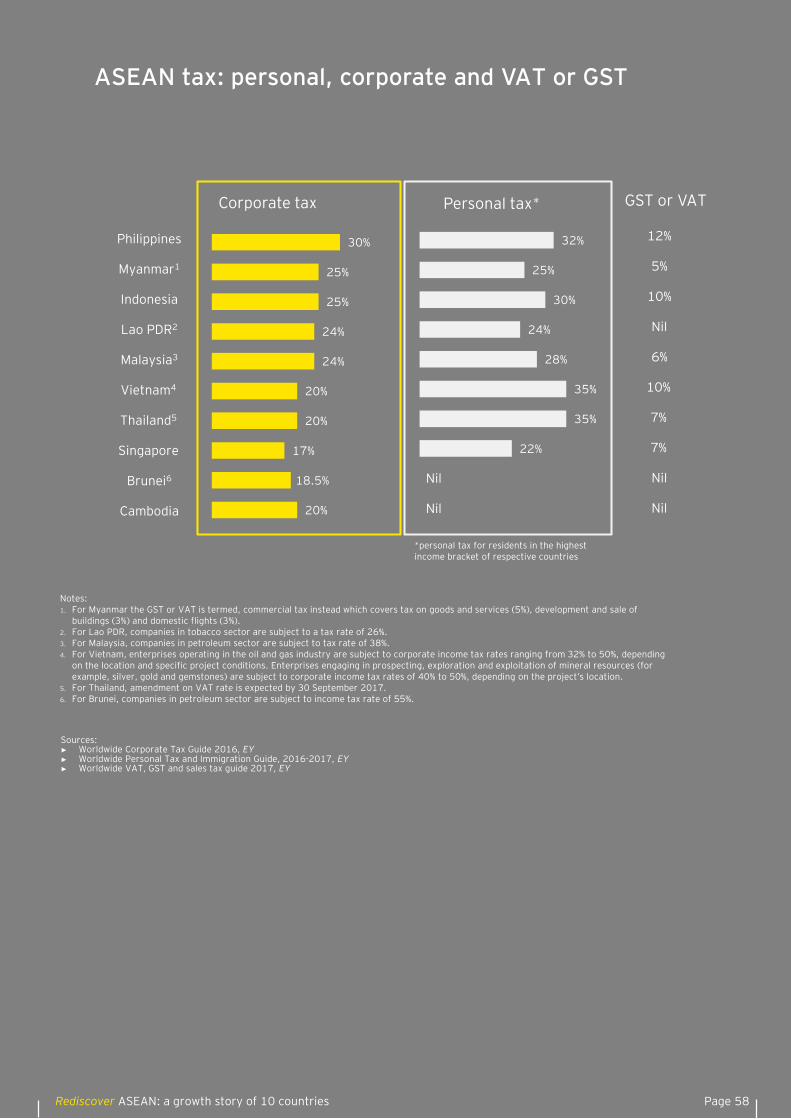
Page 58Rediscover ASEAN: a growth story of 10 countries
22%
35%
35%
28%
24%
30%
25%
32%
Personal tax*
20%
18.5%
17%
20%
20%
24%
24%
25%
25%
30%
Corporate tax
Sources: ► Worldwide Corporate Tax Guide 2016, EY► Worldwide Personal Tax and Immigration Guide, 2016-2017, EY► Worldwide VAT, GST and sales tax guide 2017, EY
ASEAN tax: personal, corporate and VAT or GST
Notes:1. For Myanmar the GST or VAT is termed, commercial tax instead which covers tax on goods and services (5%), development and sale of
buildings (3%) and domestic flights (3%).2. For Lao PDR, companies in tobacco sector are subject to a tax rate of 26%.3. For Malaysia, companies in petroleum sector are subject to tax rate of 38%.4. For Vietnam, enterprises operating in the oil and gas industry are subject to corporate income tax rates ranging from 32% to 50%, depending
on the location and specific project conditions. Enterprises engaging in prospecting, exploration and exploitation of mineral resources (for example, silver, gold and gemstones) are subject to corporate income tax rates of 40% to 50%, depending on the project’s location.
5. For Thailand, amendment on VAT rate is expected by 30 September 2017.6. For Brunei, companies in petroleum sector are subject to income tax rate of 55%.
GST or VAT
12%
5%
10%
Nil
6%
10%
7%
7%
Nil
Nil
Nil
Nil
Philippines
Myanmar1
Indonesia
Lao PDR2
Malaysia3
Vietnam4
Thailand5
Singapore
Brunei6
Cambodia
*personal tax for residents in the highest income bracket of respective countries
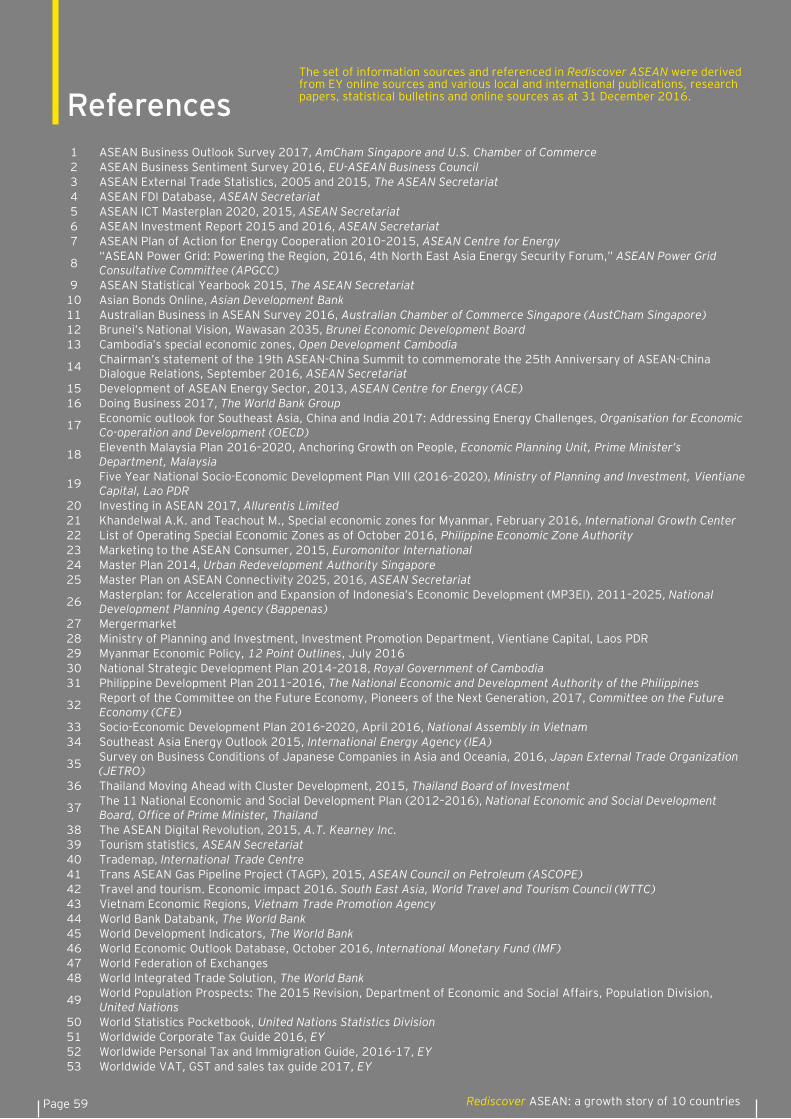
Page 59 Rediscover ASEAN: a growth story of 10 countries
1 ASEAN Business Outlook Survey 2017, AmCham Singapore and U.S. Chamber of Commerce2 ASEAN Business Sentiment Survey 2016, EU-ASEAN Business Council3 ASEAN External Trade Statistics, 2005 and 2015, The ASEAN Secretariat4 ASEAN FDI Database, ASEAN Secretariat5 ASEAN ICT Masterplan 2020, 2015, ASEAN Secretariat6 ASEAN Investment Report 2015 and 2016, ASEAN Secretariat7 ASEAN Plan of Action for Energy Cooperation 2010–2015, ASEAN Centre for Energy
8 “ASEAN Power Grid: Powering the Region, 2016, 4th North East Asia Energy Security Forum,” ASEAN Power Grid Consultative Committee (APGCC)
9 ASEAN Statistical Yearbook 2015, The ASEAN Secretariat10 Asian Bonds Online, Asian Development Bank11 Australian Business in ASEAN Survey 2016, Australian Chamber of Commerce Singapore (AustCham Singapore)12 Brunei’s National Vision, Wawasan 2035, Brunei Economic Development Board13 Cambodia’s special economic zones, Open Development Cambodia
14 Chairman’s statement of the 19th ASEAN-China Summit to commemorate the 25th Anniversary of ASEAN-China Dialogue Relations, September 2016, ASEAN Secretariat
15 Development of ASEAN Energy Sector, 2013, ASEAN Centre for Energy (ACE)16 Doing Business 2017, The World Bank Group
17 Economic outlook for Southeast Asia, China and India 2017: Addressing Energy Challenges, Organisation for Economic Co-operation and Development (OECD)
18 Eleventh Malaysia Plan 2016–2020, Anchoring Growth on People, Economic Planning Unit, Prime Minister’s Department, Malaysia
19 Five Year National Socio-Economic Development Plan VIII (2016–2020), Ministry of Planning and Investment, Vientiane Capital, Lao PDR
20 Investing in ASEAN 2017, Allurentis Limited21 Khandelwal A.K. and Teachout M., Special economic zones for Myanmar, February 2016, International Growth Center22 List of Operating Special Economic Zones as of October 2016, Philippine Economic Zone Authority 23 Marketing to the ASEAN Consumer, 2015, Euromonitor International 24 Master Plan 2014, Urban Redevelopment Authority Singapore25 Master Plan on ASEAN Connectivity 2025, 2016, ASEAN Secretariat
26 Masterplan: for Acceleration and Expansion of Indonesia’s Economic Development (MP3EI), 2011–2025, National Development Planning Agency (Bappenas)
27 Mergermarket28 Ministry of Planning and Investment, Investment Promotion Department, Vientiane Capital, Laos PDR29 Myanmar Economic Policy, 12 Point Outlines, July 201630 National Strategic Development Plan 2014–2018, Royal Government of Cambodia31 Philippine Development Plan 2011–2016, The National Economic and Development Authority of the Philippines
32 Report of the Committee on the Future Economy, Pioneers of the Next Generation, 2017, Committee on the Future Economy (CFE)
33 Socio-Economic Development Plan 2016–2020, April 2016, National Assembly in Vietnam34 Southeast Asia Energy Outlook 2015, International Energy Agency (IEA)
35 Survey on Business Conditions of Japanese Companies in Asia and Oceania, 2016, Japan External Trade Organization (JETRO)
36 Thailand Moving Ahead with Cluster Development, 2015, Thailand Board of Investment
37 The 11 National Economic and Social Development Plan (2012–2016), National Economic and Social Development Board, Office of Prime Minister, Thailand
38 The ASEAN Digital Revolution, 2015, A.T. Kearney Inc.39 Tourism statistics, ASEAN Secretariat40 Trademap, International Trade Centre41 Trans ASEAN Gas Pipeline Project (TAGP), 2015, ASEAN Council on Petroleum (ASCOPE)42 Travel and tourism. Economic impact 2016. South East Asia, World Travel and Tourism Council (WTTC)43 Vietnam Economic Regions, Vietnam Trade Promotion Agency44 World Bank Databank, The World Bank45 World Development Indicators, The World Bank46 World Economic Outlook Database, October 2016, International Monetary Fund (IMF)47 World Federation of Exchanges48 World Integrated Trade Solution, The World Bank
49 World Population Prospects: The 2015 Revision, Department of Economic and Social Affairs, Population Division, United Nations
50 World Statistics Pocketbook, United Nations Statistics Division51 Worldwide Corporate Tax Guide 2016, EY52 Worldwide Personal Tax and Immigration Guide, 2016-17, EY53 Worldwide VAT, GST and sales tax guide 2017, EY
ReferencesThe set of information sources and referenced in Rediscover ASEAN were derived from EY online sources and various local and international publications, research papers, statistical bulletins and online sources as at 31 December 2016.
Page 60Rediscover ASEAN: a growth story of 10 countries
Charts1 Strong and diverse deal transactions flow2 ASEAN focus – international trade and/or investment expectations 3 ASEAN FDI inflow, 2005 to 20154 Source of ASEAN FDI inflow by economy, 2015 5 Source of ASEAN FDI inflow by industry, 2015 6 ASEAN completed deals landscape, 2010-167 ASEAN top 10 completed deals (by sector), 2010-168 ASEAN deal performance, 2011–16 9 ASEAN active acquirers (in Asia), 2010–16
10 ASEAN active acquirers (outside Asia), 2010–1611 Selected ASEAN completed cross border deals12 Selected ASEAN top international acquirers13 ASEAN’s top completed deal by sectors14 ASEAN, China and India economic growth performance15 Projected ASEAN economic and population growth16 ASEAN trade trends17 ASEAN’s key trading partners18 ASEAN-8 banks' assets, 2005 to 201419 ASEAN market capitalization, 2005–1620 ASEAN-6 total outstanding bonds, 2005 to 201621 ASEAN - selected transport infrastructure projects22 ASEAN’s key infrastructure projects23 ASEAN’s multi-modal connectivity24 Brunei’s composition of exports, 201525 Brunei’s composition of imports, 201526 Brunei Darussalam economic clusters27 Eight strategies to accomplish “Brunei Vision 2035”28 Cambodia’s composition of exports, 201529 Cambodia’s composition of imports, 201530 Cambodia’s 36 special economic zones31 Cambodia’s Rectangular Strategy32 Indonesia’s composition of exports, 201533 Indonesia’s composition of imports, 201534 Indonesia’s six economic corridors35 Indonesia’s Masterplan for Acceleration and Expansion of Indonesia’s Economic Development (MP3EI), 2011–202536 Lao PDR’s composition of exports, 201537 Lao PDR’s composition of imports, 201538 Lao PDR 10 economic clusters39 Lao PDR Eighth National Socio-Economic Development Plan, 2015-20 (8th NSEDP) 40 Malaysia’s composition of exports, 201541 Malaysia’s composition of imports, 201542 Malaysia’s six economic clusters43 Six thrusts outlined in Malaysia’s 11 Malaysia Plan (11MP), 2016–2044 Myanmar’s composition of exports, 201545 Myanmar’s composition of imports, 201546 Myanmar’s three economic clusters (Special Economic Zones)47 Focus areas of Myanmar’s national economic pillars48 The Philippines’ composition of exports, 201549 The Philippines’ composition of imports, 201550 The Philippines key economic clusters51 The Philippines economic development plan (2011–16)52 Singapore’s composition of exports, 201553 Singapore’s composition of imports, 201554 Singapore’s key economic clusters55 Singapore’s strategy for its future economy56 Thailand’s composition of exports, 201557 Thailand’s composition of imports, 201558 Thailand’s key economic clusters59 Six major strategies of Thailand’s 11th National Economic and Social Development Plan (2011–16)60 Vietnam’s composition of exports, 201561 Vietnam’s composition of imports, 201562 Vietnam’s six key economic clusters63 The 12 focus areas of Vietnam’s Social Economic Development Plan (SEDP), 2016–20
Page 61 Rediscover ASEAN: a growth story of 10 countries
Trade secretsASEAN economic community. The last mile toward 2015 and beyond
August 2015
ASEAN 2015 and beyondAre German investors missing out?
March 2015
Acknowledgements
Rediscover ASEAN is supported by publicly available research publications, research papers, statistical bulletins and online information from international and local government institutions and organizations which are duly acknowledged in the references section.
Sincere appreciation to the project teams who have put their best efforts in developing a broad investor’s guide on ASEAN.
Worldwide Personal Tax and immigration guide 2016-2017
September 2016
Worldwide Corporate Tax Guide 2016
April 2016
Worldwide VAT, GST and Sales Tax Guide 2017
March 2017
The Power of Three for smarter, more resilient cities
June 2016
Private Equity Capital BriefingPE gets creative
March 2017
EY thought leadership
Pearlene CheongDirector, EY Research and ContentTel: +603 7495 [email protected]
Spotlight on Business, Issue 3, 2016
January 2017
Page 62Rediscover ASEAN: a growth story of 10 countries
Chow Sang HoeEY Asean Advisory Leader+603 7495 [email protected]
Vikram Chakravarty EY AseanTransactions Advisory Services Leader+65 6309 [email protected]
Yeo Eng PingEY Asean Tax Leader+603 7495 [email protected]
Dato’ Abdul Rauf RashidEY Asean Assurance Leader+603 7495 [email protected]
Choo Eng ChuanEY Asean Markets Leader+65 [email protected]
Max LohEY Asean Managing Partner+65 6309 [email protected]
Sam WongEY AseanGovernment and Public Sector Leader+65 6309 [email protected]
EY contacts
Country managing partners
Cuong Dinh Tran+84 4 3831 [email protected]
Cambodia, Lao PDR and VietnamErnst & Young (Cambodia) LtdErnst & Young Lao Co., LtdErnst & Young Vietnam Ltd
Hari Purwantono+62 21 5289 [email protected]
IndonesiaPT Ernst & Young Indonesia
Dato’ Abdul Rauf Rashid+603 7495 [email protected]
MalaysiaErnst & Young Advisory Services Sdn Bhd
U Tin Win+951 [email protected]
MyanmarUTW (Myanmar) Ltd
J. Carlitos G. Cruz+63 2 [email protected]
Philippines SyCip Gorres Velayo & Co
Max Loh+65 6309 [email protected]
Singapore and BruneiErnst & Young LLPErnst & Young
Ruth Chaowanagawi+662 264 [email protected]
ThailandEY Corporate Services Ltd
EY | Assurance | Tax | Transactions | Advisory
About EY
EY is a global leader in assurance, tax, transaction and advisory services. The insights and quality services we deliver help build trust and confidence in the capital markets and in economies the world over. We develop outstanding leaders who team to deliver on our promises to all of our stakeholders. In so doing, we play a critical role in building a better working world for our people, for our clients and for our communities.
EY refers to the global organization, and may refer to one or more, of the member firms of Ernst & Young Global Limited, each of which is a separate legal entity. Ernst & Young Global Limited, a UK company limited by guarantee, does not provide services to clients. For more information about our organization, please visit ey.com.
© 2017 EYGM Limited.All Rights Reserved.EYG no. 01733-175Gbl
This material has been prepared for general informational purposes only and is not intended to be relied upon as accounting, tax or other professional advice. Please refer to your advisors for specific advice.
ey.com
The research information collated in this publication are non-exhaustive. It should neither be considered an all-inclusive compilation of information on the relevant subject matter nor exclusive of other information that can reasonably be linked to the publication.