reconstructing prehistoric african population structure...reconstructing prehistoric african...
TRANSCRIPT

Article
Reconstructing Prehistoric African Population
StructureGraphical Abstract
Highlights
d Genome-wide analysis of 16 African individuals who lived up
to 8,100 years ago
d Forager populations related to southern African San were
once widespread in eastern Africa
d Comparison of ancient and modern Africans reveal recent
genomic adaptations
d Evidence for a divergent human lineage contributing to
western Africans
Skoglund et al., 2017, Cell 171, 59–71September 21, 2017 ª 2017 Elsevier Inc.http://dx.doi.org/10.1016/j.cell.2017.08.049
Authors
Pontus Skoglund, Jessica C. Thompson,
Mary E. Prendergast, ..., Ron Pinhasi,
Johannes Krause, David Reich
[email protected](P.S.),[email protected] (D.R.)
In Brief
The prehistory of African populations is
explored by genome-wide analysis of 16
human remains providing insight into
ancestral lineages, admixture, and
genomic adaptations.
Article
Reconstructing PrehistoricAfrican Population StructurePontus Skoglund,1,* Jessica C. Thompson,2 Mary E. Prendergast,3 Alissa Mittnik,4,5,33 Kendra Sirak,2,6,33
Mateja Hajdinjak,7,33 Tasneem Salie,8,33 Nadin Rohland,1 Swapan Mallick,1,9 Alexander Peltzer,4,10 Anja Heinze,7
Inigo Olalde,1 Matthew Ferry,1,11 Eadaoin Harney,1,11,12 Megan Michel,1,11 Kristin Stewardson,1,11
Jessica I. Cerezo-Roman,13 Chrissy Chiumia,14 Alison Crowther,4,15 Elizabeth Gomani-Chindebvu,14 Agness O. Gidna,16
Katherine M. Grillo,17 I. Taneli Helenius,18 Garrett Hellenthal,18 Richard Helm,19 Mark Horton,20 Saioa Lopez,18
Audax Z.P. Mabulla,16 John Parkington,21 Ceri Shipton,22,23 Mark G. Thomas,18 Ruth Tibesasa,24 Menno Welling,25,26
Vanessa M. Hayes,27,28,29 Douglas J. Kennett,30 Raj Ramesar,8 Matthias Meyer,7 Svante Paabo,7 Nick Patterson,3,9
Alan G. Morris,21 Nicole Boivin,4 Ron Pinhasi,6,31,32 Johannes Krause,4,5,32 and David Reich1,9,11,32,34,*
1Department of Genetics, Harvard Medical School, Boston, MA 02115, USA2Department of Anthropology, Emory University, Atlanta, GA 30322, USA3Radcliffe Institute for Advanced Study, Harvard University, Cambridge, MA 02138, USA4Max Planck Institute for the Science of Human History, Jena 07745, Germany5Institute for Archeological Sciences, Eberhard-Karls-University, Tuebingen 72070, Germany6School of Archaeology and Earth Institute, University College Dublin, Dublin 4, Ireland7Max Planck Institute for Evolutionary Anthropology, Leipzig 04103, Germany8Division of HumanGenetics, Institute of Infectious Disease andMolecularMedicine, University of Cape Town, Cape Town 7925, South Africa9Broad Institute of Harvard and MIT, Cambridge, MA 02142, USA10Integrative Transcriptomics, Centre for Bioinformatics, University of Tuebingen, Tuebingen 72076, Germany11Howard Hughes Medical Institute, Harvard Medical School, Boston, MA 02115, USA12Department of Organismic and Evolutionary Biology, Harvard University, Cambridge, MA 02138, USA13Department of Geography and Anthropology, California State Polytechnic University, Pomona, Pomona, CA 91768, USA14Malawi Department of Museums and Monuments, Lilongwe 3, Malawi15School of Social Science, The University of Queensland, Brisbane, Queensland 4072, Australia16National Museums of Tanzania, Dar es Salaam, Tanzania17Department of Archaeology and Anthropology, University of Wisconsin - La Crosse, La Crosse, WI 54601, USA18Department of Genetics, Evolution and Environment, University College London, London WC1E 6BT, UK19Canterbury Archaeological Trust, Canterbury CT1 2LU, UK20Department Archaeology and Anthropology, University of Bristol, Bristol BS8 1UU, UK21Department of Archaeology, University of Cape Town, Cape Town 7700, South Africa(Affiliations continued on next page)
SUMMARY
We assembled genome-wide data from 16 prehis-toric Africans. We show that the anciently divergentlineage that comprises the primary ancestry of thesouthern African San had a wider distribution inthe past, contributing approximately two-thirds ofthe ancestry of Malawi hunter-gatherers �8,100–2,500 years ago and approximately one-third of theancestry of Tanzanian hunter-gatherers �1,400years ago. We document how the spread of farmersfrom western Africa involved complete replacementof local hunter-gatherers in some regions, and wetrack the spread of herders by showing that thepopulation of a �3,100-year-old pastoralist fromTanzania contributed ancestry to people from north-eastern to southern Africa, including a �1,200-year-old southern African pastoralist. The deepest diversi-fications of African lineages were complex, involvingeither repeated gene flow among geographically
disparate groups or a lineage more deeply divergingthan that of the San contributing more to some west-ern African populations than to others. We finallyleverage ancient genomes to document episodes ofnatural selection in southern African populations.
INTRODUCTION
Africa harbors more genetic diversity than any other part of the
world (Cann et al., 1987; Tishkoff et al., 2009). This is reflected
both in a higher average number of differences among sub-
Saharan African genomes than among non-African genomes
(Cann et al., 1987; Ramachandran et al., 2005) and in the fact
that the ancestry found outside of Africa is largely a subset of
that within it (Tishkoff et al., 2009). Today, some of the earliest-
branching African lineages are present only in populations with
relatively small census sizes, including the southern African
Khoe-San (see STAR Methods for terminology), central African
rainforest hunter-gatherers, and Hadza of Tanzania (Gronau
et al., 2011; Schlebusch et al., 2012; Veeramah et al., 2012).
However, the population structure of Africa prior to the
Cell 171, 59–71, September 21, 2017 ª 2017 Elsevier Inc. 59
22McDonald Institute for Archaeological Research, Cambridge CB2 3ER, UK23British Institute in Eastern Africa, Nairobi 30710, Kenya24Department of Anthropology and Archaeology, University of Pretoria, Pretoria 0083, South Africa25African Studies Centre Leiden, Leiden University, Leiden 2300 RB, Netherlands26African Heritage Ltd, Zomba, Malawi27Genomics and Epigenetics Division, Garvan Institute of Medical Research, Darlinghurst, NSW 2010, Australia28Central Clinical School, University of Sydney, Camperdown, NSW 2050, Australia29School of Health Systems and Public Health, University of Pretoria, Gezina 0031, South Africa30Department of Anthropology and Institutes for Energy and the Environment, Pennsylvania State University, University Park, PA 16802, USA31Department of Anthropology, University of Vienna, Althanstrasse 14, 1090 Vienna, Austria32Senior authors33These authors contributed equally34Lead Contact
*Correspondence: [email protected] (P.S.), [email protected] (D.R.)
http://dx.doi.org/10.1016/j.cell.2017.08.049
expansion of food producers (pastoralists and agriculturalists)
remains unknown (Busby et al., 2016; Gurdasani et al., 2015;
Patin et al., 2017). Bantu-speaking agriculturalists originating in
western Africa are thought to have brought farming to eastern Af-
rica by �2,000 years BP (years before present, defined by
convention as years before 1950 CE) and to southern Africa by
�1,500 BP, thereby spreading the largest single ancestry
component to African genomes today (Russell et al., 2014;
Tishkoff et al., 2009). Earlier migration(s), which brought ancestry
related to the ancient Near East (Lazaridis et al., 2016; Pagani
et al., 2012; Pickrell et al., 2014), brought herding to eastern
Africa by�4,000 BP (Marshall et al., 1984) and to southern Africa
by �2,000 BP (Sadr, 2015).
RESULTS
To reconstruct African population structure prior to the spread of
food production, we generated new genome-wide data from 15
ancient sub-Saharan Africans (Table 1; Tables S1 and S2; STAR
Methods). For three individuals from the western Cape of South
Africa (�2,300–1,300 BP), we carried out direct shotgun
sequencing to 0.7- to 2.0-fold coverage. For 12 individuals
from eastern and south-central Africa, we used in-solution
enrichment of �1.2 million single nucleotide polymorphisms
(SNPs). These included four individuals from the coastal region
of Kenya and Tanzania (�1,400–400 BP), one from interior
Tanzania (�3,100 BP), and seven from Malawi (ranging over
�8,100–2,500 BP) (Figure S1). All individuals had postmortem
degradation characteristic of ancient DNA (Table 1), and we
confirmed that key results are unlikely to be artifacts of contam-
ination by restricting analysis to sequences with postmortem
degradation (Skoglund et al., 2012; Skoglund et al., 2014a) (Fig-
ure S2). We merged the new ancient DNA data with previously
reported shotgun sequence data from a �4,500 BP Ethiopian
highland individual (Llorente et al., 2015) and with SNP geno-
types from 584 present-day African individuals from 59 diverse
populations (including new data from 34 Malawi individuals;
STAR Methods) (Lazaridis et al., 2014; Patterson et al., 2012),
as well as 300 high-coverage genomes from 142worldwide pop-
ulations (Mallick et al., 2016). We also determined mitochondrial
DNA and Y chromosome haplogroups for all newly reported
samples (Tables S3 and S4).
60 Cell 171, 59–71, September 21, 2017
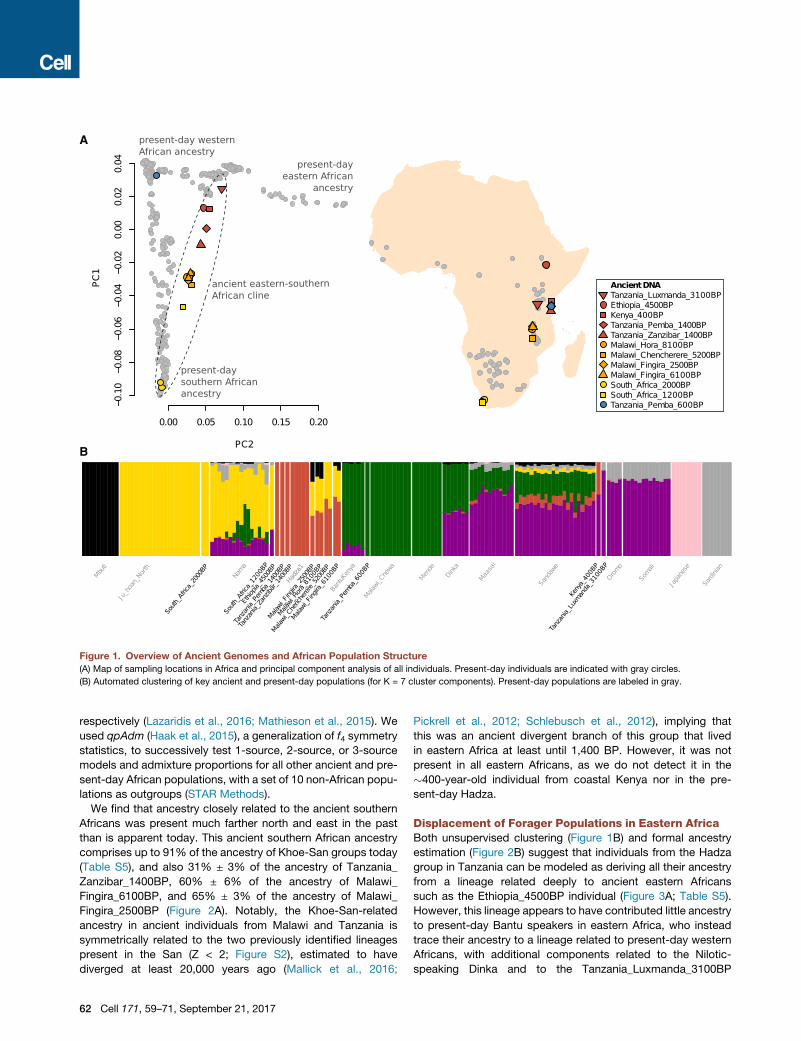
An Ancient Cline of Southern and Eastern AfricanHunter-GatherersWe used principal component analysis (PCA) (Patterson et al.,
2006) and automated clustering (Alexander et al., 2009) to relate
the 16 ancient individuals to present-day sub-Saharan Africans
(Figures 1 and S3). Whereas the two individuals buried in
�2,000 BP hunter-gatherer contexts in South Africa share
ancestry with southern African Khoe-San populations in the
PCA, 11 of the 12 ancient individuals who lived in eastern and
south-central Africa between �8,100 and �400 BP form a
gradient of relatedness to the eastern African Hadza on the
one hand and southern African Khoe-San on the other (Fig-
ure 1A). The genetic cline correlates to geography, running
along a north-south axis with ancient individuals from Ethiopia
(�4,500 BP), Kenya (�400 BP), Tanzania (both �1,400 BP),
and Malawi (�8,100–2,500 BP), showing increasing affinity to
southern Africans (both ancient individuals and present-day
Khoe-San). The seven individuals from Malawi show no clear
heterogeneity, indicating a long-standing and distinctive popula-
tion in ancientMalawi that persisted for at least�5,000 years (the
minimum span of our radiocarbon dates) but which no longer
exists today.
We constructed a model where ancient and present-day
African populations trace their ancestry to a putative set of
nine ancestral populations. As proxies for these populations,
three different ancient Near Eastern populations and six African
populations were used that, according to our analyses, harbor
substantial ancestry related to major lineages present in Africa
today. The Mende from Sierra Leone are used in this model to
represent a component of ancestry that exists in high propor-
tions in western African populations, the ancient southern
African genomes (South_Africa_2000BP) are used to represent
the ancestry of southern Africa before agriculture, the Ethiopian
individual (Ethiopia_4500BP) is used to represent northeastern
African ancestry before agriculture, the Mbuti are used to repre-
sent central African rainforest hunter-gatherer ancestry, the indi-
vidual from an eastern African pastoralist context (Tanzania_
Luxmanda_3100BP) is used to represent an early pastoralist
lineage from eastern Africa (see below; Figure 2), and the Dinka
(from Sudan) are used to represent distinctive ancestry found in
Nilotic speakers today. The ancient Near Eastern populations
were representative of Anatolia, the Levant, and Iran,
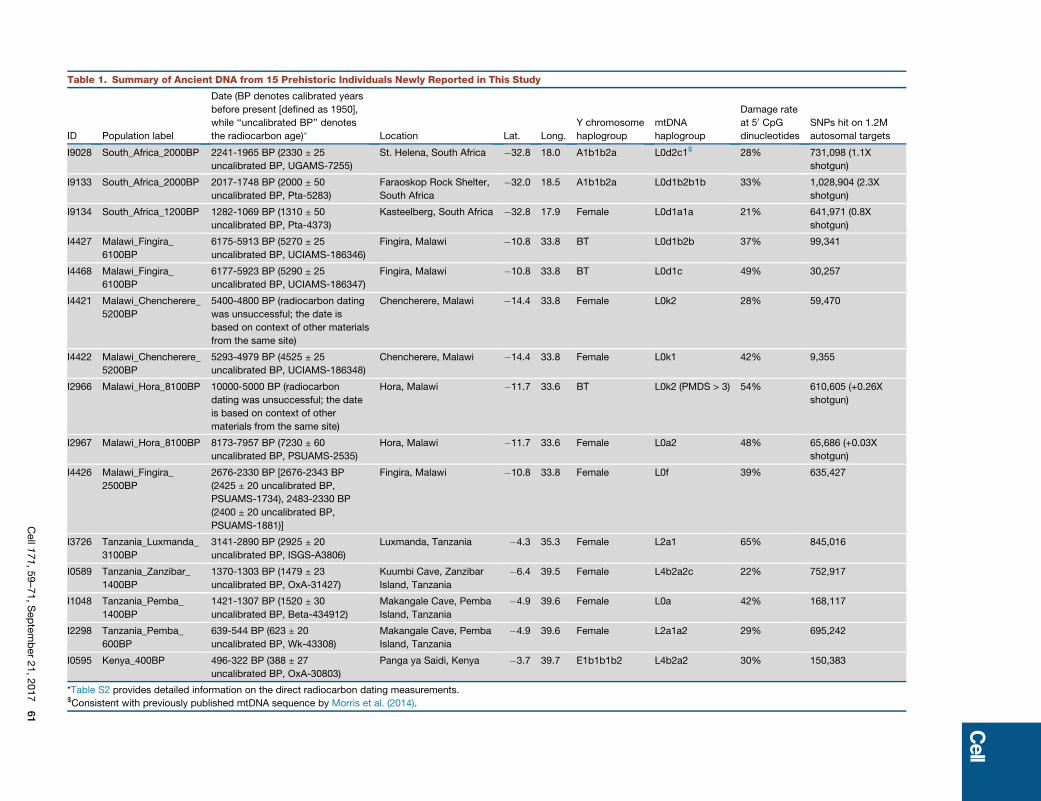
Table 1. Summary of Ancient DNA from 15 Prehistoric Individuals Newly Reported in This Study
ID Population label
Date (BP denotes calibrated years
before present [defined as 1950],
while ‘‘uncalibrated BP’’ denotes
the radiocarbon age)* Location Lat. Long.
Y chromosome
haplogroup
mtDNA
haplogroup
Damage rate
at 50 CpGdinucleotides
SNPs hit on 1.2M
autosomal targets
I9028 South_Africa_2000BP 2241-1965 BP (2330 ± 25
uncalibrated BP, UGAMS-7255)
St. Helena, South Africa �32.8 18.0 A1b1b2a L0d2c1$ 28% 731,098 (1.1X
shotgun)
I9133 South_Africa_2000BP 2017-1748 BP (2000 ± 50
uncalibrated BP, Pta-5283)
Faraoskop Rock Shelter,
South Africa
�32.0 18.5 A1b1b2a L0d1b2b1b 33% 1,028,904 (2.3X
shotgun)
I9134 South_Africa_1200BP 1282-1069 BP (1310 ± 50
uncalibrated BP, Pta-4373)
Kasteelberg, South Africa �32.8 17.9 Female L0d1a1a 21% 641,971 (0.8X
shotgun)
I4427 Malawi_Fingira_
6100BP
6175-5913 BP (5270 ± 25
uncalibrated BP, UCIAMS-186346)
Fingira, Malawi �10.8 33.8 BT L0d1b2b 37% 99,341
I4468 Malawi_Fingira_
6100BP
6177-5923 BP (5290 ± 25
uncalibrated BP, UCIAMS-186347)
Fingira, Malawi �10.8 33.8 BT L0d1c 49% 30,257
I4421 Malawi_Chencherere_
5200BP
5400-4800 BP (radiocarbon dating
was unsuccessful; the date is
based on context of other materials
from the same site)
Chencherere, Malawi �14.4 33.8 Female L0k2 28% 59,470
I4422 Malawi_Chencherere_
5200BP
5293-4979 BP (4525 ± 25
uncalibrated BP, UCIAMS-186348)
Chencherere, Malawi �14.4 33.8 Female L0k1 42% 9,355
I2966 Malawi_Hora_8100BP 10000-5000 BP (radiocarbon
dating was unsuccessful; the date
is based on context of other
materials from the same site)
Hora, Malawi �11.7 33.6 BT L0k2 (PMDS > 3) 54% 610,605 (+0.26X
shotgun)
I2967 Malawi_Hora_8100BP 8173-7957 BP (7230 ± 60
uncalibrated BP, PSUAMS-2535)
Hora, Malawi �11.7 33.6 Female L0a2 48% 65,686 (+0.03X
shotgun)
I4426 Malawi_Fingira_
2500BP
2676-2330 BP [2676-2343 BP
(2425 ± 20 uncalibrated BP,
PSUAMS-1734), 2483-2330 BP
(2400 ± 20 uncalibrated BP,
PSUAMS-1881)]
Fingira, Malawi �10.8 33.8 Female L0f 39% 635,427
I3726 Tanzania_Luxmanda_
3100BP
3141-2890 BP (2925 ± 20
uncalibrated BP, ISGS-A3806)
Luxmanda, Tanzania �4.3 35.3 Female L2a1 65% 845,016
I0589 Tanzania_Zanzibar_
1400BP
1370-1303 BP (1479 ± 23
uncalibrated BP, OxA-31427)
Kuumbi Cave, Zanzibar
Island, Tanzania
�6.4 39.5 Female L4b2a2c 22% 752,917
I1048 Tanzania_Pemba_
1400BP
1421-1307 BP (1520 ± 30
uncalibrated BP, Beta-434912)
Makangale Cave, Pemba
Island, Tanzania
�4.9 39.6 Female L0a 42% 168,117
I2298 Tanzania_Pemba_
600BP
639-544 BP (623 ± 20
uncalibrated BP, Wk-43308)
Makangale Cave, Pemba
Island, Tanzania
�4.9 39.6 Female L2a1a2 29% 695,242
I0595 Kenya_400BP 496-322 BP (388 ± 27
uncalibrated BP, OxA-30803)
Panga ya Saidi, Kenya �3.7 39.7 E1b1b1b2 L4b2a2 30% 150,383
*Table S2 provides detailed information on the direct radiocarbon dating measurements.$Consistent with previously published mtDNA sequence by Morris et al. (2014).
Cell171,59–71,September21,2017
61
A
B
Figure 1. Overview of Ancient Genomes and African Population Structure
(A) Map of sampling locations in Africa and principal component analysis of all individuals. Present-day individuals are indicated with gray circles.
(B) Automated clustering of key ancient and present-day populations (for K = 7 cluster components). Present-day populations are labeled in gray.
respectively (Lazaridis et al., 2016; Mathieson et al., 2015). We
used qpAdm (Haak et al., 2015), a generalization of f4 symmetry
statistics, to successively test 1-source, 2-source, or 3-source
models and admixture proportions for all other ancient and pre-
sent-day African populations, with a set of 10 non-African popu-
lations as outgroups (STAR Methods).
We find that ancestry closely related to the ancient southern
Africans was present much farther north and east in the past
than is apparent today. This ancient southern African ancestry
comprises up to 91% of the ancestry of Khoe-San groups today
(Table S5), and also 31% ± 3% of the ancestry of Tanzania_
Zanzibar_1400BP, 60% ± 6% of the ancestry of Malawi_
Fingira_6100BP, and 65% ± 3% of the ancestry of Malawi_
Fingira_2500BP (Figure 2A). Notably, the Khoe-San-related
ancestry in ancient individuals from Malawi and Tanzania is
symmetrically related to the two previously identified lineages
present in the San (Z < 2; Figure S2), estimated to have
diverged at least 20,000 years ago (Mallick et al., 2016;
62 Cell 171, 59–71, September 21, 2017
Pickrell et al., 2012; Schlebusch et al., 2012), implying that
this was an ancient divergent branch of this group that lived
in eastern Africa at least until 1,400 BP. However, it was not
present in all eastern Africans, as we do not detect it in the
�400-year-old individual from coastal Kenya nor in the pre-
sent-day Hadza.
Displacement of Forager Populations in Eastern AfricaBoth unsupervised clustering (Figure 1B) and formal ancestry
estimation (Figure 2B) suggest that individuals from the Hadza
group in Tanzania can be modeled as deriving all their ancestry
from a lineage related deeply to ancient eastern Africans
such as the Ethiopia_4500BP individual (Figure 3A; Table S5).
However, this lineage appears to have contributed little ancestry
to present-day Bantu speakers in eastern Africa, who instead
trace their ancestry to a lineage related to present-day western
Africans, with additional components related to the Nilotic-
speaking Dinka and to the Tanzania_Luxmanda_3100BP
A B C
D E F
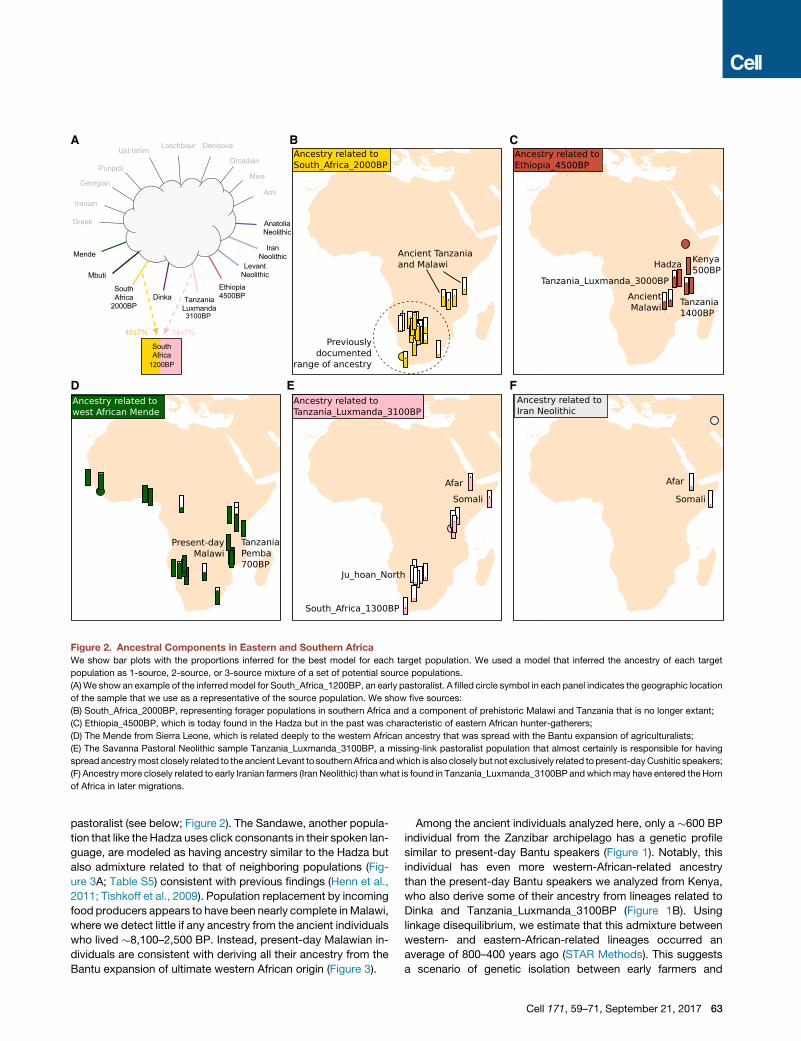
Figure 2. Ancestral Components in Eastern and Southern Africa
We show bar plots with the proportions inferred for the best model for each target population. We used a model that inferred the ancestry of each target
population as 1-source, 2-source, or 3-source mixture of a set of potential source populations.
(A)We show an example of the inferredmodel for South_Africa_1200BP, an early pastoralist. A filled circle symbol in each panel indicates the geographic location
of the sample that we use as a representative of the source population. We show five sources:
(B) South_Africa_2000BP, representing forager populations in southern Africa and a component of prehistoric Malawi and Tanzania that is no longer extant;
(C) Ethiopia_4500BP, which is today found in the Hadza but in the past was characteristic of eastern African hunter-gatherers;
(D) The Mende from Sierra Leone, which is related deeply to the western African ancestry that was spread with the Bantu expansion of agriculturalists;
(E) The Savanna Pastoral Neolithic sample Tanzania_Luxmanda_3100BP, a missing-link pastoralist population that almost certainly is responsible for having
spread ancestrymost closely related to the ancient Levant to southernAfrica andwhich is also closely but not exclusively related topresent-dayCushitic speakers;
(F) Ancestry more closely related to early Iranian farmers (Iran Neolithic) thanwhat is found in Tanzania_Luxmanda_3100BP andwhichmay have entered the Horn
of Africa in later migrations.
pastoralist (see below; Figure 2). The Sandawe, another popula-
tion that like theHadza uses click consonants in their spoken lan-
guage, are modeled as having ancestry similar to the Hadza but
also admixture related to that of neighboring populations (Fig-
ure 3A; Table S5) consistent with previous findings (Henn et al.,
2011; Tishkoff et al., 2009). Population replacement by incoming
food producers appears to have been nearly complete inMalawi,
where we detect little if any ancestry from the ancient individuals
who lived �8,100–2,500 BP. Instead, present-day Malawian in-
dividuals are consistent with deriving all their ancestry from the
Bantu expansion of ultimate western African origin (Figure 3).
Among the ancient individuals analyzed here, only a �600 BP
individual from the Zanzibar archipelago has a genetic profile
similar to present-day Bantu speakers (Figure 1). Notably, this
individual has even more western-African-related ancestry
than the present-day Bantu speakers we analyzed from Kenya,
who also derive some of their ancestry from lineages related to
Dinka and Tanzania_Luxmanda_3100BP (Figure 1B). Using
linkage disequilibrium, we estimate that this admixture between
western- and eastern-African-related lineages occurred an
average of 800–400 years ago (STAR Methods). This suggests
a scenario of genetic isolation between early farmers and
Cell 171, 59–71, September 21, 2017 63
A B C
D E
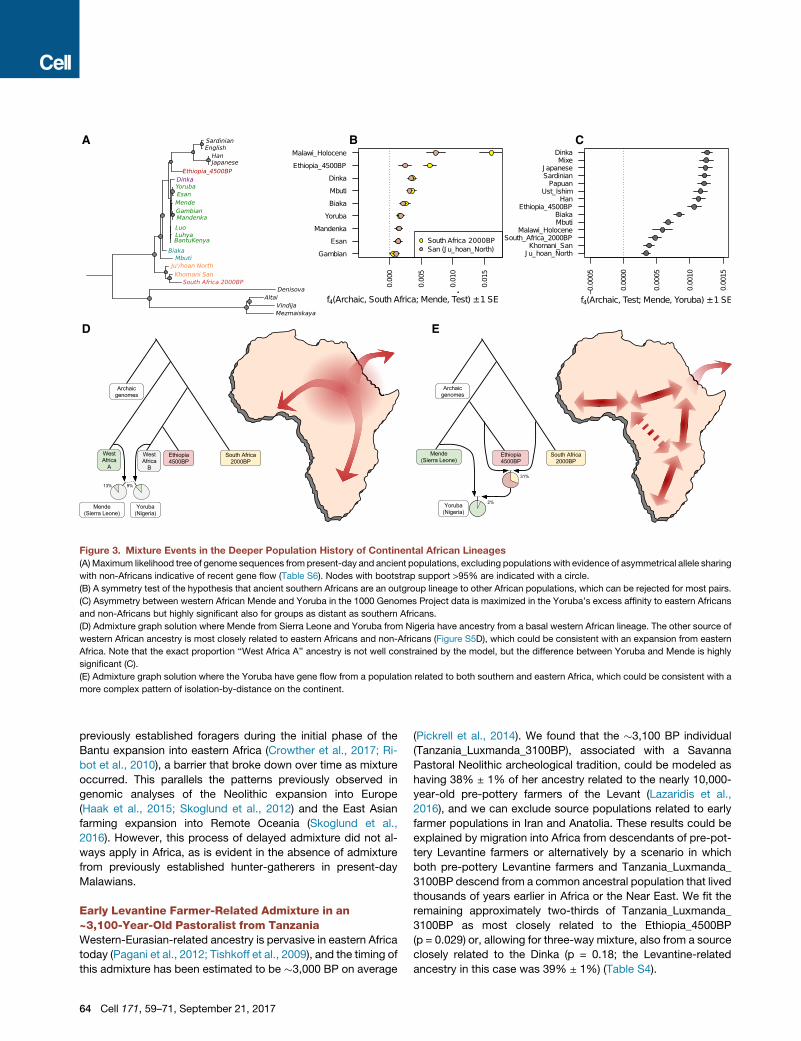
Figure 3. Mixture Events in the Deeper Population History of Continental African Lineages
(A) Maximum likelihood tree of genome sequences from present-day and ancient populations, excluding populations with evidence of asymmetrical allele sharing
with non-Africans indicative of recent gene flow (Table S6). Nodes with bootstrap support >95% are indicated with a circle.
(B) A symmetry test of the hypothesis that ancient southern Africans are an outgroup lineage to other African populations, which can be rejected for most pairs.
(C) Asymmetry between western African Mende and Yoruba in the 1000 Genomes Project data is maximized in the Yoruba’s excess affinity to eastern Africans
and non-Africans but highly significant also for groups as distant as southern Africans.
(D) Admixture graph solution where Mende from Sierra Leone and Yoruba from Nigeria have ancestry from a basal western African lineage. The other source of
western African ancestry is most closely related to eastern Africans and non-Africans (Figure S5D), which could be consistent with an expansion from eastern
Africa. Note that the exact proportion ‘‘West Africa A’’ ancestry is not well constrained by the model, but the difference between Yoruba and Mende is highly
significant (C).
(E) Admixture graph solution where the Yoruba have gene flow from a population related to both southern and eastern Africa, which could be consistent with a
more complex pattern of isolation-by-distance on the continent.
previously established foragers during the initial phase of the
Bantu expansion into eastern Africa (Crowther et al., 2017; Ri-
bot et al., 2010), a barrier that broke down over time as mixture
occurred. This parallels the patterns previously observed in
genomic analyses of the Neolithic expansion into Europe
(Haak et al., 2015; Skoglund et al., 2012) and the East Asian
farming expansion into Remote Oceania (Skoglund et al.,
2016). However, this process of delayed admixture did not al-
ways apply in Africa, as is evident in the absence of admixture
from previously established hunter-gatherers in present-day
Malawians.
Early Levantine Farmer-Related Admixture in an~3,100-Year-Old Pastoralist from TanzaniaWestern-Eurasian-related ancestry is pervasive in eastern Africa
today (Pagani et al., 2012; Tishkoff et al., 2009), and the timing of
this admixture has been estimated to be �3,000 BP on average
64 Cell 171, 59–71, September 21, 2017
(Pickrell et al., 2014). We found that the �3,100 BP individual
(Tanzania_Luxmanda_3100BP), associated with a Savanna
Pastoral Neolithic archeological tradition, could be modeled as
having 38% ± 1% of her ancestry related to the nearly 10,000-
year-old pre-pottery farmers of the Levant (Lazaridis et al.,
2016), and we can exclude source populations related to early
farmer populations in Iran and Anatolia. These results could be
explained by migration into Africa from descendants of pre-pot-
tery Levantine farmers or alternatively by a scenario in which
both pre-pottery Levantine farmers and Tanzania_Luxmanda_
3100BP descend from a common ancestral population that lived
thousands of years earlier in Africa or the Near East. We fit the
remaining approximately two-thirds of Tanzania_Luxmanda_
3100BP as most closely related to the Ethiopia_4500BP
(p = 0.029) or, allowing for three-way mixture, also from a source
closely related to the Dinka (p = 0.18; the Levantine-related
ancestry in this case was 39% ± 1%) (Table S4).

While these findings show that a Levant-Neolithic-related pop-
ulation made a critical contribution to the ancestry of present-
day eastern Africans (Lazaridis et al., 2016), present-day Cushitic
speakers such as the Somali cannot be fit simply as having
Tanzania_Luxmanda_3100BP ancestry. The best fitting model
for the Somali includes Tanzania_Luxmanda_3100BP ancestry,
Dinka-related ancestry, and 16% ± 3% Iranian-Neolithic-related
ancestry (p = 0.015). This suggests that ancestry related to the
Iranian Neolithic appeared in eastern Africa after earlier gene
flow related to Levant Neolithic populations, a scenario that is
made more plausible by the genetic evidence of admixture of
Iranian-Neolithic-related ancestry throughout the Levant by the
time of the Bronze Age (Lazaridis et al., 2016) and in ancient
Egypt by the Iron Age (Schuenemann et al., 2017).
Direct Evidence of Migration Bringing Pastoralism toEastern and Southern AfricaIn contrast to the Malawi and Zanzibar individuals, all three
ancient southern Africans show affinities to the ancestry pre-
dominant in present-day Tuu speakers in the southern Kalahari
more than to present-day Juj’hoan speakers in the northern
Kalahari (Figures S2B and S2C). However, the �1,200 BP sam-
ple from the western Cape that is found in a pastoralist context
has a specific similarity in clustering analyses to present-day
Khoe-Khoe-speaking pastoralist populations such as the
Nama (Figure 1B), and like them it has affinity to three groups:
Khoe-San, western Eurasians, and eastern Africans. This sup-
ports the hypothesis that a non-Bantu-related population carried
eastern African and Levantine ancestry to southern Africa by at
least around 1,200 BP, providing direct evidence for claims pre-
viously made based on analysis of present-day populations
(Pickrell et al., 2014).
We used our modeling framework to show that the South_
Africa_1200BP pastoralist individual from the western Cape is
consistent with being a mixture of just two streams of ancestry
relative to non-southern African populations, with 40.3% ± 2.3%
ancestry related to the Tanzania_Luxmanda_3100BP individual
(54% ± 7%when restricting analysis to sequences with postmor-
tem damage) and the remainder being related to the South_
Africa_2000BP hunter-gatherers (Table S5). This supports the
hypothesis that the Savanna Pastoral Neolithic archaeological
tradition in eastern Africa is a plausible source for the spread of
herding to southern Africa. Even the Juj’hoan San group with
the least genetic affinity to eastern Africans (Ju_hoan_North),
have 9% ± 1%of their ancestrymost closely related to Tanzania_
Luxmanda_3100BP, consistentwithpreviousfindings that thean-
cestries of all present-day San and Khoe were affected by agro-
pastoralistmigrations in the last twomillennia (Pickrell et al., 2014).
The Earliest Divergences among Modern HumanPopulationsPrevious studies have suggested that the primary ancestry in
the San is from a lineage that separated from all other lineages
represented in modern humans today, before the latter sepa-
rated from each other (Gronau et al., 2011; Veeramah et al.,
2012). Such a model emerges when we automatically fit a tree
without admixture to the data (Figure 3A), but we also find
that a tree-like representation is a poor fit (Figure S4A), in the
sense that ancient southern Africans who lived �2,000 BP
were not strictly an outgroup to extant lineages in other parts
of sub-Saharan Africa. In particular, we find that ancient south-
ern Africans, who have none of the eastern African admixture
that is ubiquitous today, share significantly more alleles with
present-day and ancient eastern Africans (including Dinka,
Hadza, and Ethiopia_4500BP) than they do with present-day
western Africans (Figure 3B; Table S6). Even within present-
day western Africans, the genetic differences between Yoruba
from Nigeria and the Mende from Sierra Leone are inconsistent
with descent from a homogeneous ancestral population iso-
lated from ancient southern Africans. The asymmetry between
Yoruba and Mende is also observed with non-Africans but is
no stronger than in eastern Africans (the most closely related Af-
ricans to the ancestral out-of-Africa population), and thus these
signals are not driven by admixture from outside Africa and
instead likely reflect demographic events entirely within Africa
(Figure 3C; Table S6).
We carried out admixture graph modeling of the allele fre-
quency correlations and found two parsimonious models that fit
thedata. Thefirst posits that present-daywesternAfricansharbor
ancestry froma basal African lineage that contributedmore to the
Mende than it did to the Yoruba, with the other source of western
African ancestry being related to eastern Africans and non-
Africans (Figures 3D, S4, and S5; Table S7). The second model
posits that long-range and long-standing gene flow has con-
nected southern and eastern Africa to some groups in western
Africa (e.g., the ancestors of the Yoruba) to a greater extent
than to other groups in western Africa (e.g., the ancestors of the
Mende) (Figure 3E) (Pleurdeau et al., 2012). The possible basal
western African population lineage would represent the earliest
known divergence of a modern human lineage that contributed
a major proportion of ancestry to present-day humans. Such a
lineage must have separated before the divergence of San
ancestors, which is estimated to have begun on the order of
200–300 thousand years ago (Scally and Durbin, 2012). Such a
model of basal western African ancestry might support the hy-
pothesis that there has been ancient structure in the ancestry of
present-day Africans, using a line of evidence independent from
previous findings based on long haplotypes with deep diver-
gences from other human haplotypes (Hammer et al., 2011; La-
chanceet al., 2012;Plagnol andWall, 2006).Onescenario consis-
tent with this result could involve ancestry related to eastern
Africans (and the out-of-Africa population) expanding into west-
ern Africa andmixing there withmore basal lineages. Our genetic
data do not support the theory that this putative basal lineage
diverged prior to the ancestors of Neanderthals, since the
African populations we analyze here are approximately symmet-
rically related to Neanderthals (Mallick et al., 2016; Prufer
et al., 2014).
A Selective Sweep Targeting a Taste Receptor Locus inSouthern AfricaThe availability of ancient African genomes provides an oppor-
tunity to search for genomic footprints of natural selection, man-
ifested as regions of greater allele frequency differentiation be-
tween ancient and present-day populations than predicted by
the genome-wide background. We compared the two ancient
Cell 171, 59–71, September 21, 2017 65
A
B C
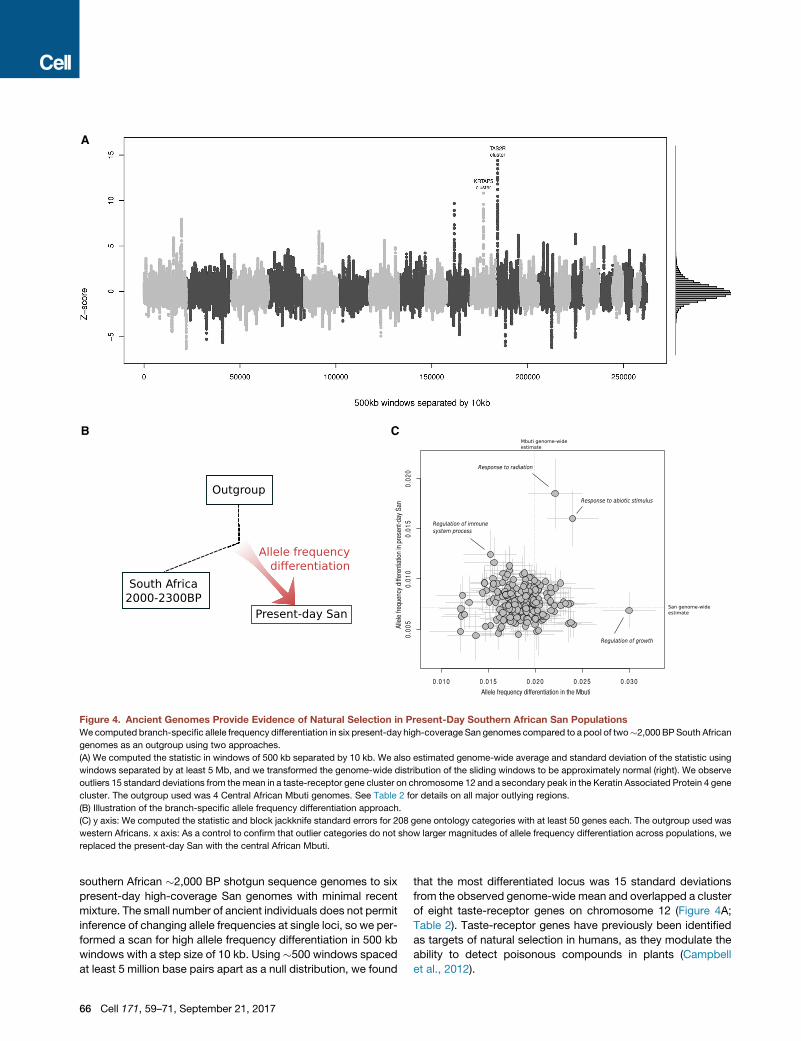
Figure 4. Ancient Genomes Provide Evidence of Natural Selection in Present-Day Southern African San Populations
Wecomputed branch-specific allele frequency differentiation in six present-day high-coverage San genomes compared to a pool of two�2,000 BPSouth African
genomes as an outgroup using two approaches.
(A) We computed the statistic in windows of 500 kb separated by 10 kb. We also estimated genome-wide average and standard deviation of the statistic using
windows separated by at least 5 Mb, and we transformed the genome-wide distribution of the sliding windows to be approximately normal (right). We observe
outliers 15 standard deviations from themean in a taste-receptor gene cluster on chromosome 12 and a secondary peak in the Keratin Associated Protein 4 gene
cluster. The outgroup used was 4 Central African Mbuti genomes. See Table 2 for details on all major outlying regions.
(B) Illustration of the branch-specific allele frequency differentiation approach.
(C) y axis: We computed the statistic and block jackknife standard errors for 208 gene ontology categories with at least 50 genes each. The outgroup used was
western Africans. x axis: As a control to confirm that outlier categories do not show larger magnitudes of allele frequency differentiation across populations, we
replaced the present-day San with the central African Mbuti.
southern African �2,000 BP shotgun sequence genomes to six
present-day high-coverage San genomes with minimal recent
mixture. The small number of ancient individuals does not permit
inference of changing allele frequencies at single loci, so we per-
formed a scan for high allele frequency differentiation in 500 kb
windows with a step size of 10 kb. Using �500 windows spaced
at least 5 million base pairs apart as a null distribution, we found
66 Cell 171, 59–71, September 21, 2017
that the most differentiated locus was 15 standard deviations
from the observed genome-wide mean and overlapped a cluster
of eight taste-receptor genes on chromosome 12 (Figure 4A;
Table 2). Taste-receptor genes have previously been identified
as targets of natural selection in humans, as they modulate the
ability to detect poisonous compounds in plants (Campbell
et al., 2012).
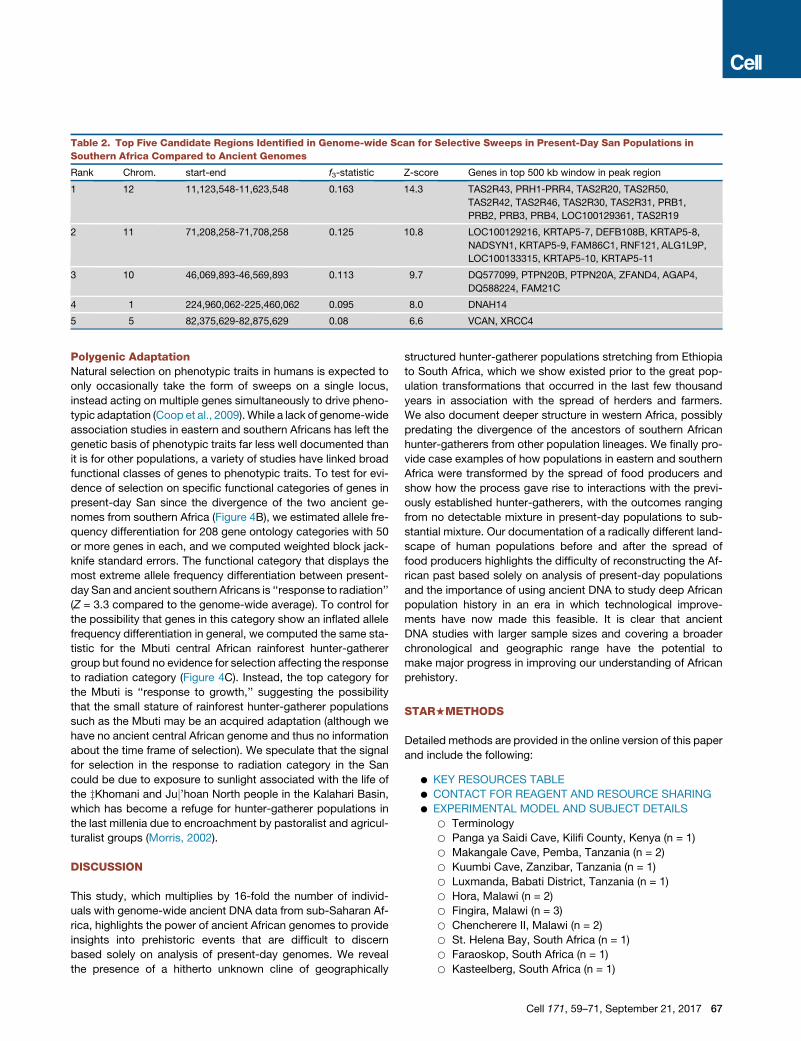
Table 2. Top Five Candidate Regions Identified in Genome-wide Scan for Selective Sweeps in Present-Day San Populations in
Southern Africa Compared to Ancient Genomes
Rank Chrom. start-end f3-statistic Z-score Genes in top 500 kb window in peak region
1 12 11,123,548-11,623,548 0.163 14.3 TAS2R43, PRH1-PRR4, TAS2R20, TAS2R50,
TAS2R42, TAS2R46, TAS2R30, TAS2R31, PRB1,
PRB2, PRB3, PRB4, LOC100129361, TAS2R19
2 11 71,208,258-71,708,258 0.125 10.8 LOC100129216, KRTAP5-7, DEFB108B, KRTAP5-8,
NADSYN1, KRTAP5-9, FAM86C1, RNF121, ALG1L9P,
LOC100133315, KRTAP5-10, KRTAP5-11
3 10 46,069,893-46,569,893 0.113 9.7 DQ577099, PTPN20B, PTPN20A, ZFAND4, AGAP4,
DQ588224, FAM21C
4 1 224,960,062-225,460,062 0.095 8.0 DNAH14
5 5 82,375,629-82,875,629 0.08 6.6 VCAN, XRCC4
Polygenic AdaptationNatural selection on phenotypic traits in humans is expected to
only occasionally take the form of sweeps on a single locus,
instead acting on multiple genes simultaneously to drive pheno-
typic adaptation (Coop et al., 2009).While a lack of genome-wide
association studies in eastern and southern Africans has left the
genetic basis of phenotypic traits far less well documented than
it is for other populations, a variety of studies have linked broad
functional classes of genes to phenotypic traits. To test for evi-
dence of selection on specific functional categories of genes in
present-day San since the divergence of the two ancient ge-
nomes from southern Africa (Figure 4B), we estimated allele fre-
quency differentiation for 208 gene ontology categories with 50
or more genes in each, and we computed weighted block jack-
knife standard errors. The functional category that displays the
most extreme allele frequency differentiation between present-
day San and ancient southern Africans is ‘‘response to radiation’’
(Z = 3.3 compared to the genome-wide average). To control for
the possibility that genes in this category show an inflated allele
frequency differentiation in general, we computed the same sta-
tistic for the Mbuti central African rainforest hunter-gatherer
group but found no evidence for selection affecting the response
to radiation category (Figure 4C). Instead, the top category for
the Mbuti is ‘‘response to growth,’’ suggesting the possibility
that the small stature of rainforest hunter-gatherer populations
such as the Mbuti may be an acquired adaptation (although we
have no ancient central African genome and thus no information
about the time frame of selection). We speculate that the signal
for selection in the response to radiation category in the San
could be due to exposure to sunlight associated with the life of
the zKhomani and Juj’hoan North people in the Kalahari Basin,
which has become a refuge for hunter-gatherer populations in
the last millenia due to encroachment by pastoralist and agricul-
turalist groups (Morris, 2002).
DISCUSSION
This study, which multiplies by 16-fold the number of individ-
uals with genome-wide ancient DNA data from sub-Saharan Af-
rica, highlights the power of ancient African genomes to provide
insights into prehistoric events that are difficult to discern
based solely on analysis of present-day genomes. We reveal
the presence of a hitherto unknown cline of geographically
structured hunter-gatherer populations stretching from Ethiopia
to South Africa, which we show existed prior to the great pop-
ulation transformations that occurred in the last few thousand
years in association with the spread of herders and farmers.
We also document deeper structure in western Africa, possibly
predating the divergence of the ancestors of southern African
hunter-gatherers from other population lineages. We finally pro-
vide case examples of how populations in eastern and southern
Africa were transformed by the spread of food producers and
show how the process gave rise to interactions with the previ-
ously established hunter-gatherers, with the outcomes ranging
from no detectable mixture in present-day populations to sub-
stantial mixture. Our documentation of a radically different land-
scape of human populations before and after the spread of
food producers highlights the difficulty of reconstructing the Af-
rican past based solely on analysis of present-day populations
and the importance of using ancient DNA to study deep African
population history in an era in which technological improve-
ments have now made this feasible. It is clear that ancient
DNA studies with larger sample sizes and covering a broader
chronological and geographic range have the potential to
make major progress in improving our understanding of African
prehistory.
STAR+METHODS
Detailed methods are provided in the online version of this paper
and include the following:
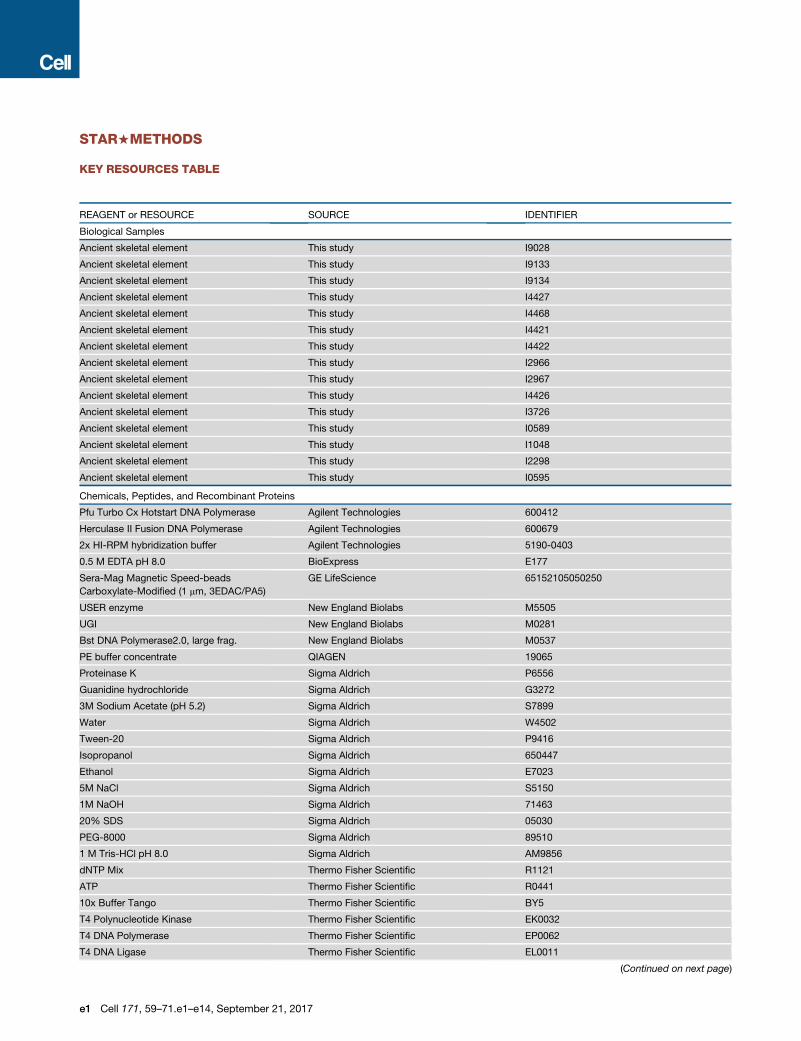
d KEY RESOURCES TABLE
d CONTACT FOR REAGENT AND RESOURCE SHARING
d EXPERIMENTAL MODEL AND SUBJECT DETAILS
B Terminology
B Panga ya Saidi Cave, Kilifi County, Kenya (n = 1)
B Makangale Cave, Pemba, Tanzania (n = 2)
B Kuumbi Cave, Zanzibar, Tanzania (n = 1)
B Luxmanda, Babati District, Tanzania (n = 1)
B Hora, Malawi (n = 2)
B Fingira, Malawi (n = 3)
B Chencherere II, Malawi (n = 2)
B St. Helena Bay, South Africa (n = 1)
B Faraoskop, South Africa (n = 1)
B Kasteelberg, South Africa (n = 1)
Cell 171, 59–71, September 21, 2017 67

d METHOD DETAILS
B Direct AMS 14C Bone Dates
B Ancient DNA sample processing in Leipzig: St. Helena
Bay sample
B Ancient DNA sample processing in Tubingen: Faraos-
kop and Kasteelberg samples
B Ancient DNA sample processing in Dublin: Malawi
samples
B Ancient DNA sample processing in Boston: Tanzania
samples, Kenya samples, and Malawi sample powder
B Shotgun genome sequencing
B In-solution nuclear target enrichment
B Genotyping and initial processing of 34 present-day in-
dividuals from Malawi
B Data processing and preparation
d QUANTIFICATION AND STATISTICAL ANALYSIS
B Principal component analysis and ADMIXTURE clus-
tering analyses
B Symmetry statistics and admixture tests
B Y chromosome and mitochondrial haplogroups
B Ancestry model and estimates with qpAdm
B Maximum likelihood tree model
B Testing a tree-like model of African population history
B Testing admixture graph models of African population
history
B Automated grafting of populations onto a skeleton
admixture graph
B Support for a single out-of-Africa founding population
B Date of admixture between expanding agriculturalists
and previously established foragers
B Evidence for selective sweeps in the ancestry of pre-
sent-day San
B Evidence for polygenic selection
d DATA AVAILABILITY
SUPPLEMENTAL INFORMATION
Supplemental Information includes five figures and seven tables and can be
found with this article online at http://dx.doi.org/10.1016/j.cell.2017.08.049.
An audio PaperClip is available at http://dx.doi.org/10.1016/j.cell.2017.08.
049#mmc8.
AUTHOR CONTRIBUTIONS
Conceptualization, P.S., J.C.T., M.E.P., V.M.H., R.R., A.G.M., N.B., R.P., J.K.,
and D.R.; Formal Analysis, P.S., S.M., A.P., and I.O.; Investigation, P.S., A.M.,
K.Si., M.Ha., T.S., N.R., A.H., M.F., E.H., M.Mi., K.St., and J.I.C.-R.; Re-
sources, J.C.T., M.E.P., C.C., A.C., E.G.-C., A.O.G., K.M.G., I.T.H., G.H.,
R.H., M.Ho., S.L., A.Z.P.M., J.P., C.S., M.G.T., R.T., M.W., V.M.H., A.G.M.,
N.B., and N.P.; Data Curation, P.S., M.Ha., N.R., S.M., A.P., I.O., M.F., E.H.,
M.Me., K.St., D.J.K., N.P., and D.R.; Writing, P.S. and D.R.; Supervision,
V.M.H., M.Me., S.P., N.P., N.N., N.B., R.P., J.K., and D.R.
ACKNOWLEDGMENTS
Permission to analyze the remains from Kenya and Tanzania was granted by
the National Museums of Kenya; the Antiquities Division of the Ministry of Nat-
ural Resources and Tourism, Tanzania; and the Zanzibar Department of Mu-
seums and Antiquities. Permission to analyze the remains from Malawi was
granted by the Malawi Department of Museums and Monuments and the Uni-
versity of Cape Town. We thank I. Lazaridis, M. Lipson, I. Mathieson, and
68 Cell 171, 59–71, September 21, 2017
S. Tishkoff for discussions and I. Kucukkalipci and K. Majander for laboratory
support. P.S. was supported by the Wenner-Gren Foundation and the Swed-
ish Research Council (VR grant 2014-453). J.C.T was supported by a grant
from the Program for the Enhancement of Research at Emory University.
J.K. and A.M. were supported by the DFG grant KR 4015/1-1 and the Max
Planck Society. K.Si. was supported by NSF grant BCS-1613577. M.Ha.,
A.H., M.Me., and S.P. were supported by the Max Planck Society. A.G.M.
and J.P. were supported by the National Research Foundation of South Africa.
R.R. was supported by the South African Medical Research Council. N.B. was
supported by ERC starting grant SEALINKS (206148), and R.P. was supported
by ERC starting grant ADNABIOARC (263441). M.G.T. was supported byWell-
come Trust Senior Investigator Award (grant number 100719/Z/12/Z). D.R.
was supported by NIH grant GM100233 and by NSF HOMINID BCS-
1032255 and is a Howard Hughes Medical Institute investigator. The labora-
tory at Penn State was supported by the NSF Archaeometry program (BCS-
1460369, D.J.K.).
Received: December 12, 2016
Revised: July 1, 2017
Accepted: August 29, 2017
Published: September 21, 2017
REFERENCES
Alexander, D.H., Novembre, J., and Lange, K. (2009). Fast model-based
estimation of ancestry in unrelated individuals. Genome Res. 19, 1655–
1664.
Behar, D.M., van Oven, M., Rosset, S., Metspalu, M., Loogvali, E.-L., Silva,
N.M., Kivisild, T., Torroni, A., and Villems, R. (2012). A ‘‘Copernican’’ reassess-
ment of the human mitochondrial DNA tree from its root. Am. J. Hum. Genet.
90, 675–684.
Briggs, A.W., and Heyn, P. (2012). Preparation of next-generation sequencing
libraries from damaged DNA. Methods Mol Biol. 840, 143–154.
Briggs, A.W., Stenzel, U., Meyer, M., Krause, J., Kircher, M., and Paabo, S.
(2010). Removal of deaminated cytosines and detection of in vivo methylation
in ancient DNA. Nucleic Acids Res. 38, e87.
Bronk Ramsey, C. (2009). Bayesian analysis of radiocarbon dates. Radio-
carbon 51, 337–360.
Brown, T.A., Nelson, D.E., Vogel, J.S., and Southon, J.R. (1988). Improved
collagen extraction by modified Longin method. Radiocarbon 30, 171–177.
Busby, G.B.J., Band, G., Si Le, Q., Jallow, M., Bougama, E., Mangano, V.D.,
Amenga-Etego, L.N., Enimil, A., Apinjoh, T., Ndila, C.M., et al.; Malaria
Genomic Epidemiology Network (2016). Admixture into and within sub-
Saharan Africa. eLife 5, e15266.
Campbell, M.C., Ranciaro, A., Froment, A., Hirbo, J., Omar, S., Bodo, J.-M.,
Nyambo, T., Lema, G., Zinshteyn, D., and Drayna, D. (2012). Evolution of func-
tionally diverse alleles associated with PTC bitter taste sensitivity in Africa.
Mol. Biol. Evol. 29, 1141–1153.
Cann, R.L., Stoneking,M., andWilson, A.C. (1987). Mitochondrial DNA and hu-
man evolution. Nature 325, 31–36.
Chami, F. (2009). Zanzibar and the Swahili coast from c. 30,000 years ago (E&D
Vision Pub.).
Chami, F., Khator, J., and Hamis Ali, A. (2009). The excavation of Mapangani
cave, Pemba island, Zanzibar. In Studies in the African Past, F.A. Chami and
C. Radimilahy, eds. (University of Dar es Salaam Press), pp. 74–79.
Clark, J. (1972). Prehistoric origins (London: The Early History of Malawi Long-
man), pp. 17–27.
Clark, J.D. (1956). Prehistory in Nyasaland. The Nyasaland Journal 9, 92–119.
Clark, J.D. (1959). The prehistory of southern Africa (Penguin Books).
Clark, J.D. (1973). Archaeological investigation of a painted rock shelter at
Mwana wa Chencherere, north of Dedza, Central Malawi, In July to
September, 1972. Soc. Malawi J. 26, 28–46.
Cole-King, P. (1973). Kukumba Mbiri Mu Malawi: A Summary of Archaeolog-
ical Research to March, 1973 (Government Press).
Coop, G., Pickrell, J.K., Novembre, J., Kudaravalli, S., Li, J., Absher, D., Myers,
R.M., Cavalli-Sforza, L.L., Feldman, M.W., and Pritchard, J.K. (2009). The role
of geography in human adaptation. PLoS Genet. 5, e1000500.
Crader, D.C. (1984a). Faunal remains fromChencherere II rock shelter, Malawi.
S. Afr. Archaeol. Bull. 39, 37–52.
Crader, D.C. (1984b). Hunters in Iron Age Malawi: The Zooarchaeology of
Chencherere Rockshelter (Lilongwe: Malawi Government Ministry of Educa-
tion and Culture).
Crowther, A., Prendergast, M.E., Fuller, D.Q., and Boivin, N. (2017). Subsis-
tence mosaics, forager-farmer interactions and the transition to food produc-
tion in eastern Africa. Quat. Int. http://dx.doi.org/10.1016/j.quaint.2017.
01.014.
Crowther, A., Veall, M.-A., Boivin, N., Horton, M., Kotarba-Morley, A., Fuller,
D.Q., Fenn, T., Haji, O., and Matheson, C.D. (2015). Use of Zanzibar copal
(Hymenaea verrucosa Gaertn.) as incense at Unguja Ukuu, Tanzania in the
7–8th century CE: chemical insights into trade and Indian Ocean interactions.
J. Archaeol. Sci. 53, 374–390.
Dabney, J., Knapp, M., Glocke, I., Gansauge, M.-T., Weihmann, A., Nickel, B.,
Valdiosera, C., Garcıa, N., Paabo, S., Arsuaga, J.-L., and Meyer, M. (2013).
Complete mitochondrial genome sequence of a Middle Pleistocene cave
bear reconstructed from ultrashort DNA fragments. Proc. Natl. Acad. Sci.
USA 110, 15758–15763.
Dabney, J., and Meyer, M. (2012). Length and GC-biases during sequencing
library amplification: a comparison of various polymerase-buffer systems
with ancient and modern DNA sequencing libraries. Biotechniques 52, 87–94.
DeBusk, G.H. (1997). The distribution of pollen in the surface sediments of
Lake Malawi, Africa, and the transport of pollen in large lakes. Rev. Palaeobot.
Palynol. 97, 123–153.
Fleisher, J., and LaViolette, A. (2013). The early Swahili trade village of Tumbe,
Pemba Island, Tanzania, AD 600–950. Antiquity 87, 1151–1168.
Fu, Q., Hajdinjak, M., Moldovan, O.T., Constantin, S., Mallick, S., Skoglund, P.,
Patterson, N., Rohland, N., Lazaridis, I., Nickel, B., et al. (2015). An early mod-
ern human from Romania with a recent Neanderthal ancestor. Nature 524,
216–219.
Fu, Q., Li, H., Moorjani, P., Jay, F., Slepchenko, S.M., Bondarev, A.A., John-
son, P.L.F., Aximu-Petri, A., Prufer, K., de Filippo, C., et al. (2014). Genome
sequence of a 45,000-year-old modern human from western Siberia. Nature
514, 445–449.
Gansauge, M.-T., and Meyer, M. (2013). Single-stranded DNA library prepara-
tion for the sequencing of ancient or damaged DNA. Nat. Protoc. 8, 737–748.
Green, R.E., Krause, J., Briggs, A.W., Maricic, T., Stenzel, U., Kircher, M., Pat-
terson, N., Li, H., Zhai, W., Fritz, M.H.Y., et al. (2010). A draft sequence of the
Neandertal genome. Science 328, 710–722.
Gronau, I., Hubisz, M.J., Gulko, B., Danko, C.G., and Siepel, A. (2011).
Bayesian inference of ancient human demography from individual genome se-
quences. Nat. Genet. 43, 1031–1034.
Gurdasani, D., Carstensen, T., Tekola-Ayele, F., Pagani, L., Tachmazidou, I.,
Hatzikotoulas, K., Karthikeyan, S., Iles, L., Pollard, M.O., Choudhury, A.,
et al. (2015). The African Genome Variation Project shapes medical genetics
in Africa. Nature 517, 327–332.
Haak, W., Lazaridis, I., Patterson, N., Rohland, N., Mallick, S., Llamas, B.,
Brandt, G., Nordenfelt, S., Harney, E., and Stewardson, K. (2015). Massive
migration from the steppe is a source for Indo-European languages in Europe.
arXiv preprint arXiv:150202783.
Hammer, M.F., Woerner, A.E., Mendez, F.L., Watkins, J.C., and Wall, J.D.
(2011). Genetic evidence for archaic admixture in Africa. Proc. Natl. Acad.
Sci. USA 108, 15123–15128.
Helm, R., Crowther, A., Shipton, C., Tengeza, A., Fuller, D., and Boivin, N.
(2012). Exploring agriculture, interaction and trade on the eastern African
littoral: preliminary results from Kenya. Azania 47, 39–63.
Helm, R.M. (2000). Conflicting histories: the archaeology of the iron-working,
farming communities in the central and southern coast region of Kenya (Uni-
versity of Bristol).
Henn, B.M., Gignoux, C.R., Jobin, M., Granka, J.M., Macpherson, J.M., Kidd,
J.M., Rodrıguez-Botigue, L., Ramachandran, S., Hon, L., Brisbin, A., et al.
(2011). Hunter-gatherer genomic diversity suggests a southern African origin
for modern humans. Proc. Natl. Acad. Sci. USA 108, 5154–5162.
Hogg, A.G., Hua, Q., Blackwell, P.G., Niu, M., Buck, C.E., Guilderson, T.P.,
Heaton, T.J., Palmer, J.G., Reimer, P.J., and Reimer, R.W. (2013). SHCal13
Southern Hemisphere calibration, 0–50,000 years cal BP. Radiocarbon 55,
1889–1903.
Jostins, L., Xu, Y., McCarthy, S., Ayub, Q., Durbin, R., Barrett, J., and Tyler-
Smith, C. (2014). YFitter: Maximum likelihood assignment of Y chromosome
haplogroups from low-coverage sequence data. arXiv preprint arXiv:14077988.
Juma, A. (2004). Unguja Ukuu on Zanzibar: An archaeological study of early ur-
banism (Uppsala University).
Kennett, D.J., Plog, S., George, R.J., Culleton, B.J., Watson, A.S., Skoglund,
P., Rohland, N., Mallick, S., Stewardson, K., Kistler, L., et al. (2017). Archaeo-
genomic evidence reveals prehistoric matrilineal dynasty. Nat Commun.
8, 14115.
Kircher, M. (2012). Analysis of high-throughput ancient DNA sequencing data.
In Ancient DNA, B. Shapiro and M. Hofreiter, eds. (Springer), pp. 197–228.
Kircher, M., Sawyer, S., and Meyer, M. (2011). Double indexing overcomes in-
accuracies in multiplex sequencing on the Illumina platform. Nucleic Acids
Res. 40, e3.
Korlevi�c, P., Gerber, T., Gansauge, M.-T., Hajdinjak, M., Nagel, S., Aximu-
Petri, A., and Meyer, M. (2015). Reducing microbial and human contamination
in DNA extractions from ancient bones and teeth. Biotechniques 59, 87–93.
Lachance, J., Vernot, B., Elbers, C.C., Ferwerda, B., Froment, A., Bodo, J.M.,
Lema, G., Fu, W., Nyambo, T.B., Rebbeck, T.R., et al. (2012). Evolutionary his-
tory and adaptation from high-coverage whole-genome sequences of diverse
African hunter-gatherers. Cell 150, 457–469.
Lazaridis, I., Nadel, D., Rollefson, G., Merrett, D.C., Rohland, N., Mallick, S.,
Fernandes, D., Novak, M., Gamarra, B., Sirak, K., et al. (2016). Genomic in-
sights into the origin of farming in the ancient Near East. Nature 536, 419–424.
Lazaridis, I., Patterson, N., Mittnik, A., Renaud, G., Mallick, S., Kirsanow, K.,
Sudmant, P.H., Schraiber, J.G., Castellano, S., Lipson, M., et al. (2014).
Ancient human genomes suggest three ancestral populations for present-
day Europeans. Nature 513, 409–413.
Li, H., and Durbin, R. (2009). Fast and accurate short read alignment with Bur-
rows-Wheeler transform. Bioinformatics 25, 1754–1760.
Li, H., Handsaker, B., Wysoker, A., Fennell, T., Ruan, J., Homer, N., Marth, G.,
Abecasis, G., and Durbin, R.; 1000 Genome Project Data Processing Sub-
group (2009). The Sequence alignment/map (SAM) format and SAMtools. Bio-
informatics 25, 2078–2079.
Llorente, M.G., Jones, E.R., Eriksson, A., Siska, V., Arthur, K.W., Arthur, J.W.,
Curtis, M.C., Stock, J.T., Coltorti, M., Pieruccini, P., et al. (2015). Ancient Ethi-
opian genome reveals extensive Eurasian admixture in Eastern Africa. Science
350, 820–822.
Loh, P.-R., Lipson, M., Patterson, N., Moorjani, P., Pickrell, J.K., Reich, D., and
Berger, B. (2013). Inference of admixture parameters in human populations us-
ing weighted linkage disequilibrium. Genetics 193, 1233–1254.
Lohse, J.C., Madsen, D.B., Culleton, B.J., and Kennett, D.J. (2014). Isotope
paleoecology of episodic mid-to-late Holocene bison population expansions
in the Southern Plains, USA. Quat. Sci. Rev. 102, 14–26.
Longin, R. (1971). New method of collagen extraction for radiocarbon dating.
Nature 230, 241–242.
Mallick, S., Li, H., Lipson, M., Mathieson, I., Gymrek, M., Racimo, F., Zhao, M.,
Chennagiri, N., Nordenfelt, S., Tandon, A., et al. (2016). The Simons Genome
Diversity Project: 300 genomes from 142 diverse populations. Nature 538,
201–206.
Manhire, A. (1993). A report on the excavations at Faraoskop Rock Shelter in
the Graafwater district of the south-western Cape. Southern African Field
Archaeology 2, 3–23.
Maricic, T., Whitten, M., and Paabo, S. (2010). Multiplexed DNA sequence
capture of mitochondrial genomes using PCR products. PLoS ONE 5, e14004.
Cell 171, 59–71, September 21, 2017 69

Marshall, F., Stewart, K., and Barthelme, J. (1984). Early domestic stock at
Dongodien in northern Kenya. Azania 19, 120–127.
Mathieson, I., Lazaridis, I., Rohland, N., Mallick, S., Patterson, N., Rooden-
berg, S.A., Harney, E., Stewardson, K., Fernandes, D., Novak, M., et al.
(2015). Genome-wide patterns of selection in 230 ancient Eurasians. Nature
528, 499–503.
Meyer, M., Fu, Q., Aximu-Petri, A., Glocke, I., Nickel, B., Arsuaga, J.-L., Martı-
nez, I., Gracia, A., de Castro, J.M.B., Carbonell, E., and Paabo, S. (2014).
A mitochondrial genome sequence of a hominin from Sima de los Huesos.
Nature 505, 403–406.
Meyer, M., and Kircher, M. (2010). Illumina sequencing library preparation for
highly multiplexed target capture and sequencing. Cold Spring Harb Protoc
2010, pdb.prot5448.
Meyer, M., Kircher, M., Gansauge, M.-T., Li, H., Racimo, F., Mallick, S.,
Schraiber, J.G., Jay, F., Prufer, K., de Filippo, C., et al. (2012). A high-coverage
genome sequence from an archaic Denisovan individual. Science 338,
222–226.
Miller, S.F. (1971). The age of Nachikufan industries in Zambia. S. Afr.
Archaeol. Bull. 26, 143–146.
Moorjani, P., Patterson, N., Hirschhorn, J.N., Keinan, A., Hao, L., Atzmon, G.,
Burns, E., Ostrer, H., Price, A.L., and Reich, D. (2011). The history of African
gene flow into Southern Europeans, Levantines, and Jews. PLoS Genet. 7,
e1001373.
Morris, A.G. (2002). Isolation and the origin of the Khoisan: Late Pleistocene
and Early Holocene human evolution at the southern end of Africa. Hum.
Evol. 17, 231–240.
Morris, A.G., Heinze, A., Chan, E.K., Smith, A.B., and Hayes, V.M. (2014). First
ancient mitochondrial human genome from a prepastoralist southern African.
Genome Biol. Evol. 6, 2647–2653.
Morris, A.G., and Ribot, I. (2006). Morphometric cranial identity of prehistoric
Malawians in the light of sub-Saharan African diversity. Am. J. Phys. Anthropol.
130, 10–25.
Odner, K. (1972). Excavations at Narosura, a Stone Bowl Site in the Southern
Kenya Highlands. Azania 7, 25–92.
Pagani, L., Kivisild, T., Tarekegn, A., Ekong, R., Plaster, C., Gallego Romero, I.,
Ayub, Q., Mehdi, S.Q., Thomas, M.G., Luiselli, D., et al. (2012). Ethiopian ge-
netic diversity reveals linguistic stratification and complex influences on the
Ethiopian gene pool. Am. J. Hum. Genet. 91, 83–96.
Parkington, J., and Dlamini, N. (2015). First People: Ancestors of the San
(Creda Communications).
Patin, E., Lopez, M., Grollemund, R., Verdu, P., Harmant, C., Quach, H., Laval,
G., Perry, G.H., Barreiro, L.B., Froment, A., et al. (2017). Dispersals and genetic
adaptation of Bantu-speaking populations in Africa and North America. Sci-
ence 356, 543–546.
Patterson, N., Moorjani, P., Luo, Y., Mallick, S., Rohland, N., Zhan, Y., Gen-
schoreck, T., Webster, T., and Reich, D. (2012). Ancient admixture in human
history. Genetics 192, 1065–1093.
Patterson, N., Price, A.L., and Reich, D. (2006). Population structure and eige-
nanalysis. PLoS Genet. 2, e190.
Peltzer, A., Jager, G., Herbig, A., Seitz, A., Kniep, C., Krause, J., and Nieselt, K.
(2016). EAGER: efficient ancient genome reconstruction. Genome Biol. 17, 60.
Phillipson, D.W. (1976). The Early Iron Age in eastern and southern Africa: a
critical re-appraisal. Azania 11, 1–23.
Pickrell, J.K., Patterson, N., Barbieri, C., Berthold, F., Gerlach, L., Guldemann,
T., Kure, B., Mpoloka, S.W., Nakagawa, H., Naumann, C., et al. (2012). The ge-
netic prehistory of southern Africa. Nat. Commun. 3, 1143.
Pickrell, J.K., Patterson, N., Loh, P.-R., Lipson, M., Berger, B., Stoneking, M.,
Pakendorf, B., and Reich, D. (2014). Ancient west Eurasian ancestry in south-
ern and eastern Africa. Proc. Natl. Acad. Sci. USA 111, 2632–2637.
Pickrell, J.K., and Pritchard, J.K. (2012). Inference of population splits andmix-
tures from genome-wide allele frequency data. PLoS Genet. 8, e1002967.
70 Cell 171, 59–71, September 21, 2017
Plagnol, V., and Wall, J.D. (2006). Possible ancestral structure in human pop-
ulations. PLoS Genet. 2, e105.
Pleurdeau, D., Imalwa, E., Detroit, F., Lesur, J., Veldman, A., Bahain, J.-J., and
Marais, E. (2012). ‘‘Of sheep and men’’: earliest direct evidence of caprine
domestication in southern Africa at Leopard Cave (Erongo, Namibia). PLoS
ONE 7, e40340.
Prendergast, M.E., Mabulla, A.Z.P., Grillo, K.M., Broderick, L.G., Seitsonen,
O., Gidna, A.O., and Gifford-Gonzalez, D. (2013). Pastoral Neolithic sites on
the southern Mbulu Plateau, Tanzania. Azania 48, 498–520.
Prendergast, M.E., Rouby, H., Punnwong, P., Marchant, R., Crowther, A.,
Kourampas, N., Shipton, C., Walsh, M., Lambeck, K., and Boivin, N.L.
(2016). Continental island formation and the archaeology of defaunation on
Zanzibar, eastern Africa. PLoS ONE 11, e0149565.
Prufer, K., Racimo, F., Patterson, N., Jay, F., Sankararaman, S., Sawyer, S.,
Heinze, A., Renaud, G., Sudmant, P.H., de Filippo, C., et al. (2014). The com-
plete genome sequence of a Neanderthal from the Altai Mountains. Nature
505, 43–49.
Ramachandran, S., Deshpande, O., Roseman, C.C., Rosenberg, N.A., Feld-
man, M.W., and Cavalli-Sforza, L.L. (2005). Support from the relationship of
genetic and geographic distance in human populations for a serial founder ef-
fect originating in Africa. Proc. Natl. Acad. Sci. USA 102, 15942–15947.
Reich, D., Green, R.E., Kircher, M., Krause, J., Patterson, N., Durand, E.Y.,
Viola, B., Briggs, A.W., Stenzel, U., Johnson, P.L.F., et al. (2010). Genetic his-
tory of an archaic hominin group from Denisova Cave in Siberia. Nature 468,
1053–1060.
Reich, D., Patterson, N., Campbell, D., Tandon, A., Mazieres, S., Ray, N.,
Parra, M.V., Rojas, W., Duque, C., Mesa, N., et al. (2012). Reconstructing
Native American population history. Nature 488, 370–374.
Reich, D., Thangaraj, K., Patterson, N., Price, A.L., and Singh, L. (2009). Re-
constructing Indian population history. Nature 461, 489–494.
Reimer, P.J., Bard, E., Bayliss, A., Beck, J.W., Blackwell, P.G., Bronk Ramsey,
C., Buck, C.E., Cheng, H., Edwards, R.L., Friedrich, M., et al. (2013). IntCal13
and Marine13 Radiocarbon Age Calibration Curves 0–50,000 Years cal BP.
Radiocarbon 55, 1869–1887.
Renaud, G., Kircher, M., Stenzel, U., and Kelso, J. (2013). freeIbis: an efficient
basecaller with calibrated quality scores for Illumina sequencers. Bioinformat-
ics 29, 1208–1209.
Renaud, G., Slon, V., Duggan, A.T., and Kelso, J. (2015). Schmutzi: estimation
of contamination and endogenousmitochondrial consensus calling for ancient
DNA. Genome Biol. 16, 224.
Ribot, I., Morris, A.G., Sealy, J., and Maggs, T. (2010). Population history and
economic change in the last 2000 years in KwaZulu-Natal, RSA. Southern
African Humanities 22, 89–112.
Robinson, K., and Sandelowsky, B. (1968). The Iron Age of northern Malawi:
recent work. AZANIA. Journal of the British Institute in Eastern Africa 3,
107–146.
Robinson, K.S.R. (1982). Iron Age of northern Malawi: an archaeological
reconnaissance (Malawi Govt. Ministry of Education and Culture).
Rohland, N., Harney, E., Mallick, S., Nordenfelt, S., and Reich, D. (2015). Partial
uracil-DNA-glycosylase treatment for screening of ancient DNA. Philos. Trans.
R. Soc. Lond. B Biol. Sci. 370, 20130624.
Rohland, N., and Hofreiter, M. (2007). Comparison and optimization of ancient
DNA extraction. Biotechniques 42, 343–352.
Russell, T., Silva, F., and Steele, J. (2014). Modelling the spread of farming in
the Bantu-speaking regions of Africa: an archaeology-based phylogeography.
PLoS ONE 9, e87854.
Sadr, K. (2015). Livestock First Reached Southern Africa in Two Separate
Events. PLoS ONE 10, e0134215.
Sadr, K., Smith, A., Plug, I., Orton, J., and Mutti, B. (2003). Herders and for-
agers on Kasteelberg: interim report of excavations 1999-2002. S. Afr.
Archaeol. Bull. 58, 27–32.
Sandelowsky, B. (1972). Later Stone Age assemblages from Malawi and their
technologies. PhD thesis (University of California, Berkeley).
Scally, A., and Durbin, R. (2012). Revising the human mutation rate: implica-
tions for understanding human evolution. Nat. Rev. Genet. 13, 745–753.
Schlebusch, C. (2010). Issues raised by use of ethnic-group names in genome
study. Nature 464, 487.
Schlebusch, C.M., Skoglund, P., Sjodin, P., Gattepaille, L.M., Hernandez, D.,
Jay, F., Li, S., De Jongh, M., Singleton, A., Blum,M.G.B., et al. (2012). Genomic
variation in seven Khoe-San groups reveals adaptation and complex African
history. Science 338, 374–379.
Schuenemann, V.J., Peltzer, A., Welte, B., van Pelt, W.P., Molak, M., Wang,
C.-C., Furtwangler, A., Urban, C., Reiter, E., Nieselt, K., et al. (2017). Ancient
Egyptian mummy genomes suggest an increase of Sub-Saharan African
ancestry in post-Roman periods. Nat Commun 8, 15694.
Sealy, J.C., Patrick, M.K., Morris, A.G., and Alder, D. (1992). Diet and dental
caries among later stone age inhabitants of the Cape Province, South Africa.
Am. J. Phys. Anthropol. 88, 123–134.
Shipton, C., Crowther, A., Kourampas, N., Prendergast, M.E., Horton, M.,
Douka, K., Schwenninger, J.-L., Faulkner, P., Quintana Morales, E.M., Lang-
ley,M.C., et al. (2016). Reinvestigation of Kuumbi Cave, Zanzibar, reveals Later
Stone Age coastal habitation, early Holocene abandonment and Iron Age re-
occupation. Azania 51, 197–233.
Shriver, M.D., Kennedy, G.C., Parra, E.J., Lawson, H.A., Sonpar, V., Huang, J.,
Akey, J.M., and Jones, K.W. (2004). The genomic distribution of population
substructure in four populations using 8,525 autosomal SNPs. Hum. Geno-
mics 1, 274–286.
Sinclair, P., Juma, A., and Chami, F. (2006). Excavations at Kuumbi Cave on
Zanzibar 2005. In The African Archaeology Network: Research in Progress,
J. Kinahan and J.H.A. Kinahan, eds. (Dar es Salaam University Press),
pp. 95–106.
Skoglund, P., Mallick, S., Bortolini, M.C., Chennagiri, N., Hunemeier, T., Petzl-
Erler, M.L., Salzano, F.M., Patterson, N., and Reich, D. (2015). Genetic evi-
dence for two founding populations of the Americas. Nature 525, 104–108.
Skoglund, P., Malmstrom, H., Raghavan, M., Stora, J., Hall, P., Willerslev, E.,
Gilbert, M.T.P., Gotherstrom, A., and Jakobsson, M. (2012). Origins and ge-
netic legacy of Neolithic farmers and hunter-gatherers in Europe. Science
336, 466–469.
Skoglund, P., Northoff, B.H., Shunkov, M.V., Derevianko, A.P., Paabo, S.,
Krause, J., and Jakobsson, M. (2014a). In Separating endogenous ancient
DNA from modern day contamination in a Siberian Neandertal, R.G. Klein,
ed. (Proceedings of the National Academy of Sciences), pp. 2229–2234.
Skoglund, P., Posth, C., Sirak, K., Spriggs, M., Valentin, F., Bedford, S., Clark,
G.R., Reepmeyer, C., Petchey, F., Fernandes, D., et al. (2016). Genomic in-
sights into the peopling of the Southwest Pacific. Nature 538, 510–513.
Skoglund, P., Sjodin, P., Skoglund, T., Lascoux, M., and Jakobsson, M.
(2014b). Investigating population history using temporal genetic differentia-
tion. Mol. Biol. Evol. 31, 2516–2527.
Smith, A.B. (1992a). Kasteelberg. In Guide to Archaeological Sites in the
South-western Cape, A.B. Smith and B. Mutti, eds. (Cape Town: South African
Association of Archaeologists Conference), pp. 28–30.
Smith, A.B. (1992b). Pastoralism in Africa (Johannesburg: Witwatersrand Uni-
versity Press).
Smith, B.W. (1995). Rock art in south-central Africa: a study based on the pic-
tographs of Dedza District, Malawi and Kasam District (Zambia: University of
Cambridge).
Stafford, T.W., Hare, P.E., Currie, L., Jull, A.J.T., and Donahue, D.J. (1991).
Accelerator radiocarbon dating at the molecular level. J. Archaeol. Sci.
18, 35–72.
Stuiver, M., and Polach, H.A. (1977). Discussion: reporting of 14 C data. Radio-
carbon 19, 355–363.
Tishkoff, S.A., Reed, F.A., Friedlaender, F.R., Ehret, C., Ranciaro, A., Froment,
A., Hirbo, J.B., Awomoyi, A.A., Bodo, J.-M., Doumbo, O., et al. (2009). The ge-
netic structure and history of Africans and African Americans. Science 324,
1035–1044.
Van Klinken, G.J. (1999). Bone collagen quality indicators for palaeodietary
and radiocarbon measurements. J. Archaeol. Sci. 26, 687–695.
van Oven, M., and Kayser, M. (2009). Updated comprehensive phylogenetic
tree of global human mitochondrial DNA variation. Hum. Mutat. 30,
E386–E394.
Veeramah, K.R., Wegmann, D., Woerner, A., Mendez, F.L., Watkins, J.C., Des-
tro-Bisol, G., Soodyall, H., Louie, L., and Hammer, M.F. (2012). An early diver-
gence of KhoeSan ancestors from those of othermodern humans is supported
by an ABC-based analysis of autosomal resequencing data. Mol. Biol. Evol.
29, 617–630.
Wang, Y., and Nielsen, R. (2012). Estimating population divergence time and
phylogeny from single-nucleotide polymorphisms data with outgroup ascer-
tainment bias. Mol. Ecol. 21, 974–986.
Weissensteiner,H.,Pacher,D.,Kloss-Brandstatter,A.,Forer, L.,Specht,G.,Ban-
delt, H.-J., Kronenberg, F., Salas, A., and Schonherr, S. (2016). HaploGrep 2:
mitochondrial haplogroup classification in the era of high-throughput
sequencing. Nucleic Acids Res. 44, W58–63.
Yi, X., Liang, Y., Huerta-Sanchez, E., Jin, X., Cuo, Z.X.P., Pool, J.E., Xu, X.,
Jiang, H., Vinckenbosch, N., Korneliussen, T.S., et al. (2010). Sequencing of
50 human exomes reveals adaptation to high altitude. Science 329, 75–78.
Zubieta, L.F. (2016). Learning through practise: Chewa women’s roles and the
use of rock art in passing on cultural knowledge. J. Anthropol. Archaeol.
43, 13–28.
Cell 171, 59–71, September 21, 2017 71
STAR+METHODS
KEY RESOURCES TABLE
REAGENT or RESOURCE SOURCE IDENTIFIER
Biological Samples
Ancient skeletal element This study I9028
Ancient skeletal element This study I9133
Ancient skeletal element This study I9134
Ancient skeletal element This study I4427
Ancient skeletal element This study I4468
Ancient skeletal element This study I4421
Ancient skeletal element This study I4422
Ancient skeletal element This study I2966
Ancient skeletal element This study I2967
Ancient skeletal element This study I4426
Ancient skeletal element This study I3726
Ancient skeletal element This study I0589
Ancient skeletal element This study I1048
Ancient skeletal element This study I2298
Ancient skeletal element This study I0595
Chemicals, Peptides, and Recombinant Proteins
Pfu Turbo Cx Hotstart DNA Polymerase Agilent Technologies 600412
Herculase II Fusion DNA Polymerase Agilent Technologies 600679
2x HI-RPM hybridization buffer Agilent Technologies 5190-0403
0.5 M EDTA pH 8.0 BioExpress E177
Sera-Mag Magnetic Speed-beads
Carboxylate-Modified (1 mm, 3EDAC/PA5)
GE LifeScience 65152105050250
USER enzyme New England Biolabs M5505
UGI New England Biolabs M0281
Bst DNA Polymerase2.0, large frag. New England Biolabs M0537
PE buffer concentrate QIAGEN 19065
Proteinase K Sigma Aldrich P6556
Guanidine hydrochloride Sigma Aldrich G3272
3M Sodium Acetate (pH 5.2) Sigma Aldrich S7899
Water Sigma Aldrich W4502
Tween-20 Sigma Aldrich P9416
Isopropanol Sigma Aldrich 650447
Ethanol Sigma Aldrich E7023
5M NaCl Sigma Aldrich S5150
1M NaOH Sigma Aldrich 71463
20% SDS Sigma Aldrich 05030
PEG-8000 Sigma Aldrich 89510
1 M Tris-HCl pH 8.0 Sigma Aldrich AM9856
dNTP Mix Thermo Fisher Scientific R1121
ATP Thermo Fisher Scientific R0441
10x Buffer Tango Thermo Fisher Scientific BY5
T4 Polynucleotide Kinase Thermo Fisher Scientific EK0032
T4 DNA Polymerase Thermo Fisher Scientific EP0062
T4 DNA Ligase Thermo Fisher Scientific EL0011
(Continued on next page)
e1 Cell 171, 59–71.e1–e14, September 21, 2017
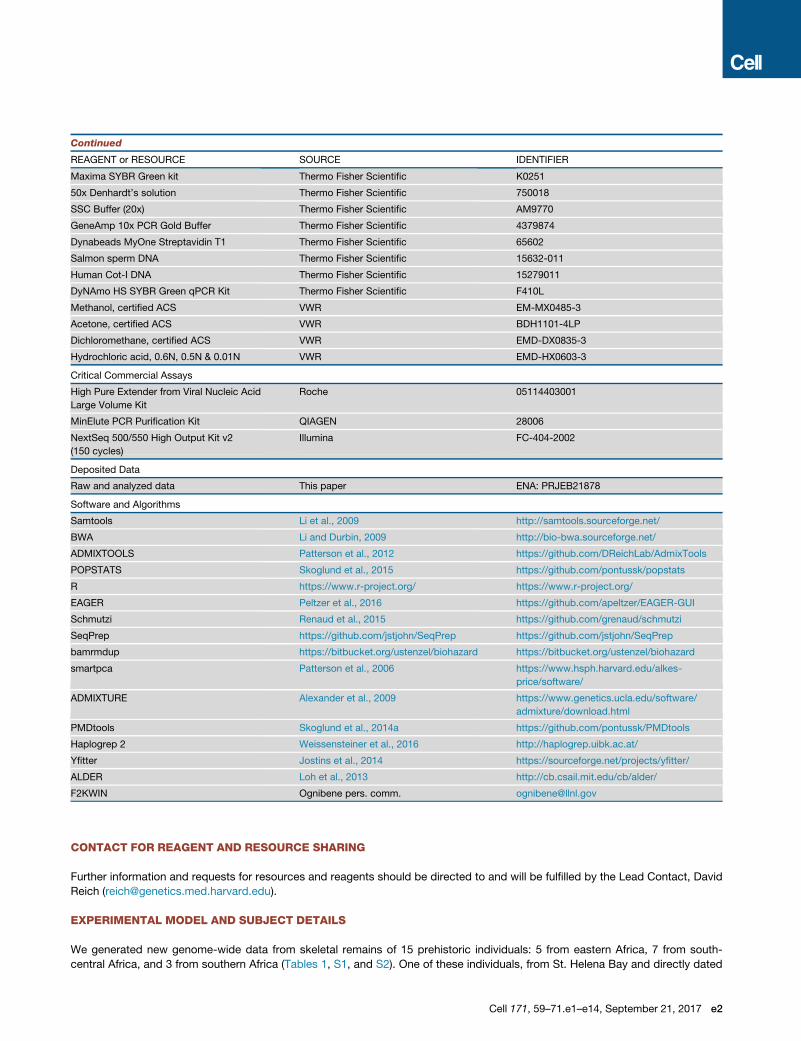
Continued
REAGENT or RESOURCE SOURCE IDENTIFIER
Maxima SYBR Green kit Thermo Fisher Scientific K0251
50x Denhardt’s solution Thermo Fisher Scientific 750018
SSC Buffer (20x) Thermo Fisher Scientific AM9770
GeneAmp 10x PCR Gold Buffer Thermo Fisher Scientific 4379874
Dynabeads MyOne Streptavidin T1 Thermo Fisher Scientific 65602
Salmon sperm DNA Thermo Fisher Scientific 15632-011
Human Cot-I DNA Thermo Fisher Scientific 15279011
DyNAmo HS SYBR Green qPCR Kit Thermo Fisher Scientific F410L
Methanol, certified ACS VWR EM-MX0485-3
Acetone, certified ACS VWR BDH1101-4LP
Dichloromethane, certified ACS VWR EMD-DX0835-3
Hydrochloric acid, 0.6N, 0.5N & 0.01N VWR EMD-HX0603-3
Critical Commercial Assays
High Pure Extender from Viral Nucleic Acid
Large Volume Kit
Roche 05114403001
MinElute PCR Purification Kit QIAGEN 28006
NextSeq 500/550 High Output Kit v2
(150 cycles)
Illumina FC-404-2002
Deposited Data
Raw and analyzed data This paper ENA: PRJEB21878
Software and Algorithms
Samtools Li et al., 2009 http://samtools.sourceforge.net/
BWA Li and Durbin, 2009 http://bio-bwa.sourceforge.net/
ADMIXTOOLS Patterson et al., 2012 https://github.com/DReichLab/AdmixTools
POPSTATS Skoglund et al., 2015 https://github.com/pontussk/popstats
R https://www.r-project.org/ https://www.r-project.org/
EAGER Peltzer et al., 2016 https://github.com/apeltzer/EAGER-GUI
Schmutzi Renaud et al., 2015 https://github.com/grenaud/schmutzi
SeqPrep https://github.com/jstjohn/SeqPrep https://github.com/jstjohn/SeqPrep
bamrmdup https://bitbucket.org/ustenzel/biohazard https://bitbucket.org/ustenzel/biohazard
smartpca Patterson et al., 2006 https://www.hsph.harvard.edu/alkes-
price/software/
ADMIXTURE Alexander et al., 2009 https://www.genetics.ucla.edu/software/
admixture/download.html
PMDtools Skoglund et al., 2014a https://github.com/pontussk/PMDtools
Haplogrep 2 Weissensteiner et al., 2016 http://haplogrep.uibk.ac.at/
Yfitter Jostins et al., 2014 https://sourceforge.net/projects/yfitter/
ALDER Loh et al., 2013 http://cb.csail.mit.edu/cb/alder/
F2KWIN Ognibene pers. comm. [email protected]
CONTACT FOR REAGENT AND RESOURCE SHARING
Further information and requests for resources and reagents should be directed to and will be fulfilled by the Lead Contact, David
Reich ([email protected]).
EXPERIMENTAL MODEL AND SUBJECT DETAILS
We generated new genome-wide data from skeletal remains of 15 prehistoric individuals: 5 from eastern Africa, 7 from south-
central Africa, and 3 from southern Africa (Tables 1, S1, and S2). One of these individuals, from St. Helena Bay and directly dated
Cell 171, 59–71.e1–e14, September 21, 2017 e2
to �2100 BP, previously yielded a complete mitochondrial genome (Morris et al., 2014). We directly dated a second South African
individual buried in a hunter-gatherer context from Faraoskop to�2000 BP, and a third individual buried in a pastoralist context from
Kasteelberg to�1,200 BP.We also directly dated and used in-solution enrichment to obtain genome-wide DNA from four individuals
from coastal eastern Africa: From the cave site of Panga ya Saidi in the coastal region of southeastern Kenya (�400BP), Kuumbi Cave
in the southeast of Zanzibar Island (Tanzania; �1,400 BP), and Makangale Cave in the northwest of Pemba Island (Tanzania;
�1,400BP and�600BP).We also obtained genome-wide data from a�3100 BP individual from a pastoralist context in north-central
Tanzania, and �8100-2500 year old individuals from Malawi.
TerminologyThere is no widely accepted term with neutral connotations for indigenous communities in southern Africa (Schlebusch, 2010). In this
manuscript, we follow San council recommendations in using population-specific terms whenever possible, and alternatively the
terms San for Tuu and K’xaa speaking hunter-gatherer groups and Khoe for Khoe-khoe speakers. When necessary we collectively
refer to groups with southern Africa-specific ancestry as Khoe-San, or as having San-related ancestry.
Panga ya Saidi Cave, Kilifi County, Kenya (n = 1)Panga ya Saidi is a large limestone cave complex formed within an escarpment c. 15 km from the Indian Ocean coast in southern
Kenya. Excavated in multiple Sealinks Project campaigns, the cave’s long and complex depositional sequence spans, discontinu-
ously, more than 76,000 years, and contains mainly Later Stone Age (LSA) deposits, overlain by Middle Iron Age (MIA) and Later Iron
Age (LIA) deposits dating to the last two thousand years (Helm et al., 2012). The sampled specimen (I0595, Kenya_400BP) is a pha-
lanx recovered from an in situ burial (context 403) and directly AMS radiocarbon dated to 496-322 BP (388 ± 27 uncalibrated BP,
OxA-30803). The individual was a tall, robust young adult male. He was buried in a shallow grave in a crouched position with two
hands and one foot in the small of the back and the skull disarticulated and placed by the knees. The individual was buried by sedi-
ment containing marine shell beads, small knapped stone tools, and Tana Tradition potsherds. The associated faunal remains are
exclusively wild, with the exception of a single possible caprine bone. Large numbers of remains of birds, rodents, and other micro-
fauna suggest that the cave may have only been sporadically occupied when the human remains were deposited. We infer from the
material culture and fauna that the cave was occupied by foragers during the time the individual was buried, although food producers
were present at nearby settlements such as Mtsengo and Mbuyuni (Helm, 2000). Crop remains of African sorghum, pearl millet and
finger millet found at the site suggest these foragers had access to agricultural resources.
Makangale Cave, Pemba, Tanzania (n = 2)This limestone cave at the northern end of Pemba Island in the Zanzibar archipelago has been excavated in multiple campaigns, the
most recent two seasons conducted by the ERC-funded Sealinks Project at Oxford University in 2012 and then theMax Planck Insti-
tute for the Science of Human History in 2016 (unpublished; see also (Chami et al., 2009)). The sequence shows clear evidence of
human occupation beginning around 1400 BP with an escargotiere layer of giant African land snail shells, pottery, and disarticulated
human remains. Above this layer, the sequence shows regular human use of the cave into the last thousand years. The first sampled
specimen (I0589, Tanzania_Pemba_1400BP) is a sacral vertebra from context 204 (Sealinks Project faunal catalog no. 15336),
directly dated to 1421-1307 BP (1520 ± 30 uncalibrated BP, Beta-434912). The second specimen (I2298, Tanzania_Pemba_600BP)
is a lower molar from context 301 (Sealinks Project faunal catalog no. 15624), which lies just below the surface and was dated to
639-544 BP (623 ± 20 uncalibrated BP, Wk-43308). Both specimens are associated with a highly unusual faunal assemblage, domi-
nated by fragmented crocodile (Crocodylus cf. niloticus) remains and diverse microfauna, including Rattus rattus (Asian black rat), a
nonnative rodent that must have arrived to the area via maritime exchange routes. There are no taphonomic indicators in the faunal
assemblage of hunting by humans, nor of crocodile predation on humans. During both of the occupational phases targeted in this
study, there were nearby settlements occupied by farmers whose ancestors likely came from the mainland, for example at the sites
of Tumbe (c. 1400-1000 BP) and Chwaka (1000-400 BP) (Fleisher and LaViolette, 2013).
Kuumbi Cave, Zanzibar, Tanzania (n = 1)Kuumbi Cave is a limestone solutional cave excavated in multiple campaigns (Chami, 2009; Sinclair et al., 2006). Sealinks Project
excavations in 2012 documented a complex depositional sequence stretching discontinuously over 20,000 years, containing
evidence of LSA and MIA occupations in five discernible phases (Shipton et al., 2016). The analyzed specimen (I0589, Tanzania_
Zanzibar_1400BP) is a complete second phalanx of an adult (Sealinks Project faunal catalog no. 4353). It was recovered from context
1011, in association with local Tana Tradition ceramics typical of theMIA, moderately-sized limestone lithic artifacts, and diverse wild
game animals, but no additional human remains (Prendergast et al., 2016). The specimen is directly dated to 1370-1303 BP (1479 ±
23 uncalibrated BP, OxA-31427), thus placing it at the beginning of theMIA phase.While Kuumbi Cave is interpreted as a forager site,
elsewhere on the island at this time, large settlements such as Unguja Ukuu emerge, occupied by farmers whose origins are likely on
the mainland (Crowther et al., 2015; Juma, 2004).
e3 Cell 171, 59–71.e1–e14, September 21, 2017

Luxmanda, Babati District, Tanzania (n = 1)Luxmanda is an open-air settlement sitting atop the Rift Valley escarpment (1878 m above sea level) at the southern edge of the
Mbulu Plateau, just north of Lake Balangida andMount Hanang. Excavations in 2012, 2013, and 2015 by the RAPT project (Research
on the Archaeology of Pastoralism in Tanzania) have shown Luxmanda to be the largest and southernmost known settlement site of
the Pastoral Neolithic (PN), the era corresponding to the spread of mobile livestock herding in eastern Africa (Prendergast et al., 2013)
(K.M.G. and M.E.P., unpublished data). Despite its isolated location, Luxmanda shows strong material culture affinities to sites of
southern Kenya classified as Savanna Pastoral Neolithic (SPN), in particular the Narosura type-site (Odner, 1972); Luxmanda’s
ties to SPN sites are further supported by sourcing of obsidian stone tools to the Naivasha Basin in the Central Rift Valley of Kenya.
Faunal remains from Luxmanda indicate a diet almost exclusively focused on sheep, goat, and cattle; botanical remains are currently
under study. A suite of eleven radiocarbon dates provides a tightly constrained window of occupation c. 3000-2900 BP, which is at
the early end of the range for SPN sites. The analyzed specimen (Tanzania_Luxmanda_3100BP) is a petrous bone from a perinatal
infant. The infant was found complete and buried just to thewest of, and c. 35 cmbelow, a burnt earth feature, interpreted as a hearth.
The burnt earth feature was then overlain by domestic refuse. Collagen from the same petrous bone was AMS radiocarbon dated to
3141-2890 BP (2925 ± 20 uncalibrated BP, ISGS-A3806), a date nearly identical to those of charcoal samples taken from the over-
lying burned earth feature and domestic refuse.
Hora, Malawi (n = 2)The Hora 1 and Hora 2 skeletons from Malawi were excavated from the Hora 1 site in the Mzimba District of Malawi, located on the
northeastern side of Mount Hora. Mount Hora lies south of the Nyika Plateau andwest of the ViphyaMountains, wheremiombo vege-
tation grades southwest into edaphic grasslands (DeBusk, 1997). The region divides the Luangwa River Basin in Zambia from Lake
Malawi�130km to the east, which receives all water from the district via the South Rukuru River (Figure S1). The South Rukuru flows
south-to-north along the Zambian border before turning east to intersect the Kasitu, a major interior waterway that flows past Mount
Hora and divides themountains to the east from plains to the west. It is notable that in the Hora region, rock art, stone tools, and burial
practices all have substantial differences from those even in the nearby Luangwa Valley of Zambia, suggesting cultural subdivisions
across relatively small areas (Clark, 1959; Phillipson, 1976; Sandelowsky, 1972).
Hora is a distinctive granite-gneiss inselberg that rises 110 m from superficial floodplain deposits. Hora 1 is a large overhang at the
base (1,420 m AMSL) that covers �80 m2. Although the shelter has no surviving rock art, at least four other shelters on the inselberg
contain paintings that include white stars and abstract red ‘‘gridirons’’ or ‘‘nets,’’ both of which are motifs replicated at other sites on
Mount Hora and nearby localities (Clark, 1956; Cole-King, 1973). Hora 1 was excavated by Clark in 1950, and produced a 2.2 m cul-
tural sequence containing pottery and iron slag at the top, faunal remains and LSA lithic assemblages with mollusk shell beads below
this, and two human burials approximately 70cmbelow the surface (Clark, 1956). The first burial to be revealedwasHora 1 (UCT-242),
a short-staturedmale in his thirties or forties at death, whomay have been buriedwith a flaked stone axe (Morris andRibot, 2006). The
skeleton was left partially in situ during the original excavation and later exhumed by Rangeley (Clark, 1956). About 3 m to the south,
the skeleton of a female was recovered (Hora 2, UCT-243); she was of similar stature to themale and died in her early twenties (Morris
and Ribot, 2006). The female was found in a flexed position on her left side, andmost of the bones of the hands and feet weremissing
or had been displaced – suggesting a degree of exposure prior to burial (Clark, 1956).
A previous study (Clark, 1956) reports three major stratigraphic units at Hora 1, and places the burials in the upper part of the sec-
ond unit in association with the ‘‘Nachikufan II’’ – an industry with a type site �300 km to the east in Zambia. Clark does not consider
the burials intrusive, noting that they are overlain exclusively by hunter-gatherer material culture. The earliest occupation layer at the
site is ‘‘reddish brown earth’’ that begins at about 1.7 m depth, and contains a lithic assemblage assigned by Clark to the Nachikufu I.
On the basis of typology, the earliest deposits at the site were inferred to date to between 16000-11000 BP, the burials to between
10000-5000 BP, andmaterials in the uppermost unit are likely as recent as the last few hundred years (Miller, 1971). This is supported
by a direct AMS age on the Hora 2 skeleton of 8173-7957 BP (7230±60 uncalibrated BP, PSUAMS-2535). Although insufficient
collagen was present in the Hora 1 skeleton for a direct age, its archaeological context and genetic similarity to the directly-dated
Hora 2 skeleton place it most probably in the early Holocene. New excavations at the Hora 1 site were conducted in 2016 and
2017 within 2-5m of the original burial locations (based on archival photographs), achieving a maximum depth of 1m. A sample of
6842 plotted objects recovered from 3m3 confirmed that below �30cm depth there is no Iron Age or historical material culture
(e.g. slag, pottery, or glass), further establishing that the two skeletons are from a resident hunter-gatherer population.
Fingira, Malawi (n = 3)The three Fingira samples derived from ex situ human remains (2 adult femora and one subadult femur) recovered in 2016 from Fingira
Rock, a large shelter locatedwithin the boundaries of Nyika National Park in northernMalawi. The climate is cool andmoist compared
to the surrounding regions (�1,600 mm annual rainfall, and average daily highs 10 – 20�C). Fingira Rock is an isolated inselberg at
�2100 m above sea level, near the upper limit of the miombo woodland. Within this inselberg is set a single deep rock shelter
with 160m2 of deposit (Figure S1). First excavated in 1966, Fingira yielded fragmentary remains of at least 15 human individuals (sub-
adults and adults), plus one more complete burial near the front, in association with rich lithic, archaeofaunal, and archaeobotanical
assemblages. All human remains previously recovered from Fingira were studied by Brothwell, and reported in in a previous study
(Sandelowsky, 1972). They are curated at the Natural History Museum in London.
Cell 171, 59–71.e1–e14, September 21, 2017 e4
In addition to human remains, the Fingira deposits contained bone tools, pigments, and ornaments (Robinson and Sandelowsky,
1968; Sandelowsky, 1972). Two conventional 14C ages obtained near the base of the ca. 50cm-deep excavation were returned in
stratigraphic sequence as 3,260 ± 80 BP and 3,430 ± 80 BP (Sandelowsky 1972). Geometric rock paintings at the site exhibit white
overpainting on red, which has been interpreted elsewhere in Malawi as re-use by food producers (Smith, 1995; Zubieta, 2016).
Ceramics are rare but present at the site, where the large deposit exhibits predominately Later Stone Age material culture. This
was confirmed during 2016 pilot excavations, permitted by the Departments of Antiquities and National Parks and Wildlife.
The deposits at Fingira had not been backfilled after the 1966 excavation, and had undergone extensive erosion and slumping. As
the site is accessible to the public, piles of materials had been pulled from the section and placed on fallen rocks. Two of those spec-
imens comprised the two adult femoral specimens reported here. Using original site plans, we identified the extent of the 1966 ex-
cavations prior to slumping, including the relative positions of originally-recovered human remains. A large part of this area had been
covered with a central termite mound, and it was within this that the partial skeleton of a neonate was recovered. This comprised the
subadult sample from Fingira. Direct 14C AMS ages on these three specimens are reported in Table S2, and show that LSA people
were using the site as a cemetery for at least 3,700 years, from 6177-5923 BP (5290±25 uncalibrated BP, UCIAMS-186347) to 2676-
2330 BP [2676-2343BP (2425±20 uncalibrated BP, PSUAMS-1734), 2483-2330 BP (2400±20 uncalibrated BP, PSUAMS-1881)]. The
two adult specimens therefore significantly pre-date the earliest known age inMalawi for the Bantu expansion, which derives from the
Kasitu Valley (containing Hora Mountain) at 1,750 ± 60 BP (Robinson, 1982). If the Bantu expansion into Malawi began more than
�700 years before what is currently known, then the neonate from Fingira could potentially overlap in timewith it. However, the overall
antiquity of these specimens makes admixture attributable to the Bantu expansion highly unlikely in light of current knowledge.
Chencherere II, Malawi (n = 2)Mwana wa Chencherere II is a painted rock shelter set in a granitic inselberg at ca. 1,700 m above sea level in the Chongoni Rock Art
Region (Smith, 1995). Its relatively high altitude results in cool, moist year-round conditions between 10 – 20�C. It was excavated by
Clark in 1972 (Clark, 1972, 1973), and the faunal assemblage published in detail by Crader (Crader, 1984a), who also reports one adult
male burial and the fragmentary remains of seven other individuals (adult and subadult). The site contained large lithic and faunal
assemblages, bone and shell tools and ornaments, and increasing abundances of pottery and other evidence of interaction with
food-producers over time. The youngest reported date from the site is a conventional 14C age on charcoal from the top of Level
3, at 800 ± 50 BP. The oldest date is from near the base of Level 4, and is 2,480 ± 200 BP.
All human remains are reported from Levels 2, 3, and 4 – with most in Level 3. The original description of human remains was by
Brothwell, and Crader (1984b:Appendix 2) later listed several more individuals that had been discovered within the faunal material. All
human remains recovered from Chencherere II were thought to be held at the Natural History Museum in London, but during a 2016
visit to the Malawi National Repository in Nguludi (near Blantyre), six additional specimens were identified. Five of these derived from
a cluster in square A3 (Figure S1): right ilium, left femur (sampled), and 3 partial ribs. These were inferred to belong to the same in-
dividual, a subadult aged 3-5. An upper right incisor (sampled) was labeled as deriving from square E2, and therefore although of
similar ontogenetic age it was deemed likely to be from a different individual.
Although the genetic analysis confirms that these are two different individuals, insufficient material remained from the incisor root of
the second individual for a direct age. The first individual returned a direct 14C AMS age of 5293-4979 BP (4525 ± 25 uncalibrated BP,
UCIAMS-186348). As with Fingira, the direct AMS ages on the human remains are substantially older than the conventional charcoal
ages suggested, indicating either intrusive charcoal or problems with the original dates.
St. Helena Bay, South Africa (n = 1)In June 2010, an intact skeleton was excavated by Andrew B Smith along the southwest coastal region of South Africa at St. Helena
Bay. The skeleton is stored in the Department of Human Biology at the University of Cape Town under the accession number UCT-
606. The body had been placed on an impermeable consolidated dune surface, on its right side in a fully flexed position. The bones
originate from a single male who stood no more than 1.5 m in height. Dental wear and significant areas of osteoarthritis suggest that
he was at least 50 years of age at time of death. Lack of any evidence of tooth decay and excessive occlusal wear suggests a diet
typical of hunter-gatherer subsistence. The presence of abnormal bone growths in the right auditory meatus (ear canal opening)
caused a condition known as ‘‘surfer’s ear’’ (auditory exostosis) and provides evidence that this individual most likely spent consider-
able time in the cold coastal waters sourcing food No obvious cause of death was evident. The results of carbon-14 to stable carbon-
13 isotope ratio analysis of a rib provided a date of 2241-1965 BP (2330 ± 25 uncalibrated BP, UGAMS-7255) years before present
(UGAMS-7255) with a d13C value of �14.6%. Although the minimum date falls right on the edge of the arrival of pastoralism in the
Western Cape, anatomical and archaeological analysis of this skeleton and the associated burial site clearly defines this individual as
an indigenous Southern African, predating pastoral arrival into the region. This individual has previously been sampled for mtDNA
analysis (Morris et al., 2014).
Faraoskop, South Africa (n = 1)The site of Faraoskop is a rock shelter about 30 km inland from Elands Bay on the west coast of the Western Cape Province of South
Africa. The shelter is on the highest ridge of a small hill at an altitude of 300 m about the surrounding plain. Seven skeletons were
collected by a local farmer in 1984, but the site was subsequently excavated under controlled conditions in 1987 and 1988 (Manhire,
e5 Cell 171, 59–71.e1–e14, September 21, 2017
1993) and five more skeletons were collected including the one referred to here as UCT-386. The shelter has no rock paintings but
there is a rich assemblage of Later Stone Age artifacts including stone tools, ostrich eggshell beads, workedmarine shell, leather and
twine (Manhire, 1993). No pottery is associated with the site. Six skeletons have been C14 dated with resulting dates ranging from
2300 years BP to 1900 years BP (Manhire, 1993; Sealy et al., 1992) but all the dates overlap at the 2nd standard deviation. UCT-386 is
the skeleton of a female about 40-50 years at death. A bone sample provided a date of 2017-1748 BP (2000 ± 50 uncalibrated BP,
Pta-5283) with a d13C value of �16.8% (Manhire, 1993). A recent re-evaluation of the site indicates the possibility that all of the in-
dividuals died in one event. Not only do all of the dates overlap, but the excavation data suggest no separate grave shafts and at least
two of individuals show signs of perimortem injury and violent death (Parkington and Dlamini, 2015). The Faraoskop human skeletons
are stored in the Department of Human Biology at the University of Cape Town.
Kasteelberg, South Africa (n = 1)The site of Kasteelberg is on a granite hill on the Vredenberg Peninsula about 4 km from the coastal village of Paternoster, approx-
imately 150 km north of Cape Town (Smith, 1992a). There are several sites on the hill including a small rockshelter, but the human
skeleton was excavated from square 22 extension at KBB on the eastern side of the base of the hill. UCT-437 is the nearly complete
skeleton of a child of about 4 years of age excavated by LitaWebley in 1986. The body was in a shallow pit about 1.5 m deep and with
no stone cover. The specimen has a date of 1282-1069 BP (1310 ± 50 uncalibrated BP, Pta-4373). There were no grave goods in
association with the skeleton. The earliest sites on top of the hill provide evidence of domestic sheep at around 2100 years ago.
The KBB site at the base of the hill is dated to the latter part of the occupation but present the first appearance of cattle in the region
(Smith, 1992b). Overall, the Later Stone Age occupation of the Kasteelberg indicates the presence of herder-foragers who practiced
seasonal economic systems, sometimes relying on domestic stock while at other times hunting seals (Sadr et al., 2003). The human
skeleton from Kasteelberg is stored in the Department of Human Biology at the University of Cape Town.
METHOD DETAILS
Direct AMS 14C Bone DatesWe report new direct AMS 14C bone dates in this study from multiple laboratories. In general, bone samples were manually cleaned
and demineralized in weak HCl and, in most cases (PSU, UCIAMS, OxA, ISGS), soaked in an alkali bath (NaOH) at room temperature
to remove contaminating soil humates. Samples were then rinsed to neutrality in Nanopure H2O and gelatinized in HCL (Longin,
1971). The resulting gelatin was lyophilized and weighed to determine percent yield as a measure of collagen preservation (% crude
gelatin yield).
Collagen was then directly AMS 14C dated (ISGS, Pta) or further purified using ultrafiltration (PSUAMS, UCIAMS, OxA, Wk, Beta)
(Brown et al., 1988; Kennett et al., 2017) or a modified XAD method (Lohse et al., 2014; Stafford et al., 1991). It is standard in some
laboratories (PSUAMS, UCIAMS, Wk, OxA) to use stable carbon and nitrogen isotopes as an additional quality control measure. For
these samples, the %C, %N and C:N ratios were evaluated before AMS 14C dating. C/N ratios for well-preserved samples fall
between 2.9 and 3.6, indicating good collagen preservation (Van Klinken, 1999). Additional quality control work was carried out
on the samples from Malawi using FTIR spectra (Figure 1E).
All 14C ages were d13C-corrected for mass dependent fractionation with measured 13C/12C values (Stuiver and Polach, 1977) and
calibrated with OxCal version 4.3 using the southern hemisphere calibration curve (SHCal13). Given their proximity to the equator,
AMS 14C dates for sites in coastal Kenya and Tanzania were calibrated using OxCal v. 4.3 (Bronk Ramsey, 2009) at 95.4% probability
employing a mixed curve that combines the SHCal13 (Hogg et al., 2013) and IntCal13 (Reimer et al., 2013) curves at ratios of 70:30 to
account for the differential effects of the intertropical convergence zone.
Ancient DNA sample processing in Leipzig: St. Helena Bay sampleDNA extraction and library preparation
30.4mg of bone powder was removed from the internal root canal of the tooth (SP2809) using a sterile dentistry drill in the clean room
facilities of the Max Planck Institute for Evolutionary Anthropology in Leipzig, Germany. A DNA extract (E649) was prepared with a
silica-based method, described in detail previously (Rohland and Hofreiter, 2007). 15 mL (15% of the total volume) of the extract
was converted into a single-stranded DNA library (A5354) using a modified version of the single-stranded DNA library preparation
protocol (Gansauge andMeyer, 2013; Korlevi�c et al., 2015). Library positive and negative controls were carried throughout the library
preparation process. Library A5354 was pre-treated with the USER enzyme, a mixture of uracil-DNA glycosylase (UDG) and endo-
nuclease VIII, in order to remove uracils from the internal parts of ancient DNAmolecules (Briggs et al., 2010; Meyer et al., 2012). The
number of DNAmolecules in the library (Table S1) was determined by digital droplet PCR (Bio-Rad QX200), using 1 mL of a 5,000-fold
dilution of the library in EBT buffer (10 mM Tris-HCl pH 8.0, 0.05% Tween 20) as template in an Eva Green assay (Bio-Rad) with
primers IS7 and IS8 (Meyer and Kircher, 2010). The library was amplified into the PCR plateau in a 100 mL reaction with AccuPrime
Pfx DNA polymerase (Dabney and Meyer, 2012) using a pair of primers with two unique index sequences according to a double
indexing scheme described in detail elsewhere (Kircher et al., 2011). 50 mL of amplification products were purified using the MinElute
PCR Purification Kit (QIAGEN) and eluted in 30 mL TE buffer (10 mM Tris-HCl pH 8.0, 1 mM EDTA). The DNA concentration of the
indexed library (A5369) was determined using a NanoDrop 1000 Spectrophotometer.
Cell 171, 59–71.e1–e14, September 21, 2017 e6
Size fractionation for shotgun sequencing
From the amplified library A5369, 1 mL was taken as template for a second round of amplification in a 100 mL PCR reaction using
primers IS5 and IS6 (Meyer and Kircher, 2010) with Herculase II Fusion DNA polymerase (Agilent Technologies) under the conditions
described in detail previously (Dabney andMeyer, 2012). The concentration of the final library was determined on a Bioanalyzer 2100
instrument (Agilent Technologies) using a DNA-1000 chip. Library A5369 was pooled and sequenced with libraries from another
experiment, occupying 33%of one lane of a flow cell on the Illumina HiSeq 2500 platform in rapid mode, using a double index config-
uration (2 3 76 + 2 3 76) (Kircher et al., 2011).
For a more effective use of sequencing capacity, 10 mL of the library A5369 was additionally separated on a Criterion Precast poly-
acrylamide gel (10% TBE, BioRad), and the fraction of library molecules with insert sizes larger than 40 bp was gel-excised as
described in detail previously (Meyer et al., 2012). Gel-excised library molecules were subjected to a second round of amplification
and the concentration of the final library (A5386) was determined using a DNA 1000 chip on the Bioanalyzer 2100.
Ancient DNA sample processing in Tubingen: Faraoskop and Kasteelberg samplesSampling and extraction
Sampling took place in the clean room facilities of the Institute for Archaeological Sciences at the University of Tubingen. Both sam-
ples were irradiated with UV light for 10 min from all sides to remove surface contamination. The tooth from the South African forager
from Faraoskop (UCT386) was sawed apart transversally at the border of crown and root, and dentine from inside the crown was
sampled using a sterile dentistry drill, resulting in 56 mg dentine powder. For the femur fragment from the South African pastoralist
fromKasteelberg (UCT437), the surface layer from the sampling area was removedwith a dentistry drill prior to obtaining four aliquots
between 51 and 80 mg of bone powder from the inside of the bone by drilling.
Extraction was performed following a protocol optimized for the recovery of small ancient DNA molecules (Dabney et al., 2013),
resulting in 100 mL of DNA extract per sample. Three of the bone powder aliquots from UCT437 underwent a 10 min pre-digestion
step after which the extraction buffer was removed (pre-digest) and replaced by fresh extraction buffer followed by over-night diges-
tion (ON-digest), the powder from UCT386 and one aliquot of UCT437 were extracted without the pre-digestion step (full-digest). All
eight resulting extracts were taken along for further library preparation. Negative controls were included in the extraction and taken
along for all further processing steps.
Screening
Two double-indexed libraries were produced from an aliquot of 20 mL of the full-digest extractions of UCT386 and UCT437 (Kircher
et al., 2011; Meyer and Kircher, 2010). Positive and negative controls were included in library preparation and taken along into
sequencing. Libraries were enriched for human mitochondrial DNA (Maricic et al., 2010) and both enriched and shotgun libraries
were sequenced on aHiSeq2500 with 2x101+8 cycles. Processing by the EAGER pipeline (Peltzer et al., 2016) and schmutzi (Renaud
et al., 2015) resulted in an endogenous DNA content of 39% and 8% and an estimated mitochondrial contamination of 0%–2% and
1%–3% for UCT386 and UCT437, respectively.
Library preparation for shotgun sequencing
For UCT386 four more libraries were produced from an aliquot of 20ul of full-digest extract each, including a DNA repair step with
UDG and endonuclease VIII to remove deaminated bases (Briggs and Heyn, 2012). For UCT437, six additional UDG-treated libraries
were produced from 20ul each of extract from the three pre-digest and the three ON-digest extracts. After indexing PCR (Kircher
et al., 2011), aliquots of the UDG-treated libraries were size selected on a PAGE gel to remove fragments of sizes below 35 and above
80 bp (Meyer et al., 2012).
Ancient DNA sample processing in Dublin: Malawi samplesSampling took place in ancient DNA-dedicated clean room facilities at University College Dublin. The petrous part of the temporal
bonewas selected for analysis from each individual fromHora, and other skeletal parts for the two other sites. Each complete petrous
wasUV irradiated for 10min on each side prior to processing to reduce surface contamination. Any remaining sediment was removed
using a Renfert Basic Classic Sandblaster (Renfert GmbH) at low power. Bone powder was retrieved from the petrous of UCT242
(Hora 1) by drilling a small hole on the superior surface of the petrous with a 4.8mm High Speed Cutter (Dremel) until the cochlea
was accessible. Bone powder was then collected directly from the cochlea using a 3.2mm Tungsten Carbide Cutter (Dremel). The
petrous from UCT243 (Hora 2) was cut from anterior to posterior using a Dremel drill at a location that transected the cochlea.
The powder was collected directly from the cochlea using a 3.2mm Tungsten Carbide Cutter (Dremel). Powder aliquots from both
samples were then UV irradiated for 5 min and placed in 2.0mL Eppendorf tubes.
Ancient DNA sample processing in Boston: Tanzania samples, Kenya samples, and Malawi sample powderSampling and DNA extraction
In a dedicated ancient DNA facility at Harvard Medical School, samples were UV-irradiated for 10 min in a UVP crosslinker. At the
chosen part of each sample (root for teeth and compact part for bones) the surface was removed with a sanding disk. About
75 mg (±10 mg) of fine powder was obtained by drilling into the physically cleaned part with a sterile dentist drill bit and collected
for DNA extraction (Table S1). In the case of KC-10-1011(4353) (I0589), additional bone powder was collected for a second DNA
extraction attempt. The seven Malawi_Holocene samples arrived in the Boston laboratory as powders prepared in Dublin, Ireland.
e7 Cell 171, 59–71.e1–e14, September 21, 2017

Starting from the sample powder, we followed the Dabney et al., 2013 extraction protocol for all samples, but replaced the funnel/
MinElute assemblage with the pre-assembled Roche columns (Korlevi�c et al., 2015) and eluted two times in 45 mL for a total of 90 mL
DNA extract.
Initial library preparation
One initial barcoded library (L1) was prepared from 30 mL DNA extracts for all but two samples (Hora1 and Hora2), which were dis-
colored and we reduced the volume to 3 mL (reducing the volume seems to mitigate library preparation inhibition, which we often find
to be associated with discolored DNA extracts) following protocols published previously (Rohland et al., 2015) (Table S1). For three
samples (I0589, I0595, I1048) the initial library wasUDG-treated (Briggs et al., 2010) following amodification fromRohland et al., 2015
(partial UDG treatment) that is tailored to inefficiently remove terminal Uracils therefore leaving the aDNA authenticity signal in the
terminal bases while efficiently removing miscoding damage within the molecules. The initial libraries for the other samples
(I2298, I2966, I2967) were not UDG-treated. The last step of the library preparation, the amplification with universal primers, was
set up in the cleanroom, but the thermal cycling happened in another laboratory physically separated from the cleanroom. The final
products of our barcoded libraries cannot be sequenced right away; an additional PCR step is needed to finalize the adaptor sites.
This is advantageous in that we can incorporate a second set of barcodes through dual indexing to differentiate two or more exper-
iments done with the same barcoded library within the same sequencing run (see below).
Screening
Each initial library underwent screening that consisted, first, of shallow shotgun sequencing after an indexing PCR (that adds dual
indices to each library, (Kircher et al., 2011), and second, target capture enrichment for mitochondrial DNA and a varying number
of nuclear loci to assess mitochondrial haplogroup, mitochondrial contamination, aDNA authenticity and nuclear complexity (Meyer
et al., 2014; Rohland et al., 2015). This experiment is finished by adding unique index combinations to each captured library, which is
then subsequently pooled with the shotgun indexing PCR product for sequencing. Sequencing was done on an Illumina NextSeq500
with 2x76cycles + 2x7cycles.
We demultiplexed reads to be sample-specific requiring that that the 7bp P5 and P7 indices matched (allowing one mismatch).
Sample identification was further ensured by requiring that additional 7bp internal barcodes matched, again allowing one mismatch.
We merged with a modified form of SeqPrep (https://github.com/jstjohn/SeqPrep) (the modification ensures that the highest quality
base is retained in the overlap region), requiring at least 15bp overlap between forward and reverse reads, allowing one mismatch,
retaining only reads of length greater than or equal to 30 base pairs, generating single ended reads.
Reads were then aligned using the samse algorithm of BWA (version 0.6.1) (Li and Durbin, 2009) using ancient parameters to allow
an increased mismatch rate, and to disable seeding (‘‘-n 0.01 �0 2 -l 16500’’). Multiple sequencing runs were run to increase
coverage, and merged together. Duplicates were then removed by identifying clusters of reads which have the same start and
stop position, and the samemapped orientation. The highest base quality representative of each set is used to represent the cluster.
The mix of mitochondrial and nuclear loci necessitates two different references for the alignment process: for mitochondrial analysis,
we use the RSRS (Behar et al., 2012) mitochondrial genome; for nuclear analysis we use the hg19/GRCh37, 1000 Genomes release
reference genome.
Additional libraries and processing
To collect more nuclear data for a subset of the samples, we prepared additional barcoded libraries (I0589, I0595, I1048, I3726)
without UDG-treatment from existing DNA extracts (L2-L5). For sample I0589 we collected more bone powder than necessary for
one extraction, and therefore prepared three additional libraries from a newly prepared DNA extract (E2). Four additional libraries
for one sample (I3726) were prepared on an Agilent Bravo Workstation using an automated protocol based on the partial UDG pro-
tocol that replaced the MinElute cleanups with magnetic bead cleanups.
All libraries underwent the same procedure as outlined, screening (see above) and nuclear target enrichment (see below), with the
exception that up to 4 libraries from the same sample were pooled in equimolar concentrations before screening and nuclear target
capture (Table S1). Preprocessing and alignment for nuclear data used the same procedure as performed in screening, without
requiring the mitochondrial alignments.
Shotgun genome sequencingShotgun sequencing of the ancient South African fromSt. Helena Baywas performed at theMax Planck Institute in Leipzig, Germany,
on four lanes of the Illumina HiSeq 2500 platform in rapid mode, using a double index configuration (2 3 76 + 2 3 76) (Kircher et al.,
2011). An indexed FX174 control library was spiked in prior to sequencing. Base calling was done with the machine-learning algo-
rithm freeIBIS (Renaud et al., 2013). Overlapping pair-end reads were merged (Kircher, 2012) and mapped to the human reference
genome (hg19/GRCh37, 1000 Genomes release) using the Burrows-Wheeler Aligner (BWA) (Li and Durbin, 2009). BWA parameters
were adjusted for ancient DNA sequences (‘‘-n 0.01 –o 2 –l 16500’’), to allow for moremismatches and indels and to turn off the seed-
ing (Meyer et al., 2012). A total of 64,128,220 raw sequences were obtained from the first shotgun sequencing of the library A5369.
Another 800,205,849 raw sequences were generated from the size-selected library using four lanes of the Illumina HiSeq 2500. Only
mapped sequences longer than 35 bp were retained and duplicates removed (bam-rmdup; https://bitbucket.org/ustenzel/
biohazard), leaving 9,880,908 sequences from the first shotgun run and 52,551,348 sequences from sequencing the size-fraction-
ated library. Duplication rates were 1.02 and 1.06, respectively, indicating that both libraries were not sequenced to exhaustion.
The proportion of sequences R 35bp that mapped to the human reference genome was �28%.
Cell 171, 59–71.e1–e14, September 21, 2017 e8

Shotgun sequencing of the ancient South African from St. Helena Bay (UCT386) and the ancient South African from Kasteelberg
(UCT437) was performed at the University of Tuebingen using two lanes of an Illumina HiSeq2500 instrument for 2x101+8 cycles
(UCT386 non-UDG-treated library), on 50% of two lanes of an Illumina NextSeq500 instrument for 2x151+8 cycles (UCT437 non-
UDG-treated library), on a complete run of an Illumina HiSeq2500 instrument for 2x125+8 cycles (four UCT386 UDG-treated and
size-selected libraries and six UCT437 UDG-treated and size-selected libraries), and on 5.5 lanes of an Illumina HiSeq2500 instru-
ment for 2x125+8 cycles (four UCT386 UDG-treated libraries without size-selection and three UCT437 UDG-treated full-digest
libraries without size-selection). The samples were processed using the EAGER pipeline (Peltzer et al., 2016), clipping adapters
and merging reads subsequently with an overlap of 10bp. Resulting reads were then mapped within the pipeline against the human
reference genome GrCh37 and using BWA 0.7.5 (Li and Durbin, 2009) for further downstream analysis.
Shotgun sequencing of the Malawi_Hora_8100BP samples was performed at Harvard Medical School using an Illumina
NextSeq500 instrument. Preprocessing and alignment used the same procedure as performed in screening.
In-solution nuclear target enrichmentAfter libraries passed screening QC (that is, there was evidence of authentic ancient DNA), we performed nuclear target enrichment of
the short (but barcoded) libraries following (Fu et al., 2015) aiming to enrich for about 1.24M SNPs in total (Fu et al., 2015; Haak et al.,
2015; Mathieson et al., 2015) using a semi-automated approach on a Perkin Elmer Evolution P3 liquid handler. For two libraries
(S0589.E1.L1 and S2595.E1.L1) the desired 1.24M targeted SNPs were captured in two independent reactions by enriching, first, for
about 0.39MSNPs, andsecond, for 0.84MSNPs. Theother first libraries (L1)were enriched inone single reaction (1240k). After indexing
PCRs with dual indices and equimolar pooling sequencing was performed on an Illumina NextSeq500 with 2x76cycles + 2x7cycles.
Preprocessing and alignment used the same procedure as performed in screening, without requiring the mitochondrial alignments.
Genotyping and initial processing of 34 present-day individuals from MalawiGenome-wide data was collected from 34 present-day individuals from Malawi using the Affymetrix Human Origins SNP array (Pat-
terson et al., 2012), under a protocol for analysis of de-identified DNA samples approved by the Harvard Human Research Protection
Program (Protocol 11681, most recently reviewed on 12 July 2016). Quality control of the data prior to merging involved screening for
outlier individuals, excess missingness, as well as deviations from Hardy-Weinberg equilibrium, and was performed in a manner
similar to what has previously been described (Lazaridis et al., 2014).
Data processing and preparationWe extracted genotypes from the ancient genomes by drawing a random sequence read at each position, ignoring the first and last
3 bp of every read and any read containing insertions or deletions in their alignment to the human reference genome. If the randomly
drawn haploid genotype of an ancient individual did not match either of the alleles of the biallelic SNP in the reference panel, we set
the genotype of the ancient individual as missing.
We added these pseudohaploid genotypes to 17 million dinucleotide transversion SNPs identified between present-day genomes
from the Simons Genome Diversity Panel (which includes human-fixed differences to chimpanzee). We also added the ancient
genotypes to 550 individuals from 56 African populations genotyped on the Affymetrix Human Origins array (Lazaridis et al., 2014;
Patterson et al., 2012; Pickrell et al., 2012; Pickrell et al., 2014; Skoglund et al., 2015). To all these datasets we added diploid geno-
types from two archaic human genomes – a Neanderthal and a Denisovan (Meyer et al., 2012; Prufer et al., 2014). The populations
shown in Figure S2 are individuals from the Affymetrix Human Origins array, when we in the text refer to Khomani_San, they are the
individuals from the Simons Genome Diversity panel and so are not shown in the legend in Figure S2.
QUANTIFICATION AND STATISTICAL ANALYSIS
Population genetic approaches that quantify shared genetic drift, such as f-statistics and admixture graph fitting, are maximally
robust when ascertainment of SNPs are performed in an outgroup (Patterson et al., 2012; Wang and Nielsen, 2012), such that there
is no bias in allele frequencies between the analyzed populations and the polymorphism that appeared by mutation in the ancestral
population of all analyzed populations. Whereas the Human Origins Array that we use for most analyses comprises 13 different
panels ascertained in modern humans (Patterson et al., 2012), none of these can be regarded as outgroup-ascertained for the pur-
pose of African populations. To obtain an outgroup-ascertained set of SNPs for African populations for our modeling of deep phylo-
genetic relationships, we identified 814,242 transversion SNPs polymorphic between the archaic Denisovan (Meyer et al., 2012) and
Neanderthal (Prufer et al., 2014) genomes (together labeled as ‘Archaic’ here). Since the ancestors of Denisovans and Neanderthals
are consistent with having diverged from sub-Saharan lineages before those lineages separated from each other (Green et al., 2010;
Mallick et al., 2016; Meyer et al., 2012; Prufer et al., 2014; Reich et al., 2010), the ascertained SNPs that were also present as poly-
morphisms in sub-Saharan Africa were highly likely to have been polymorphic before the African populations diversified. We ex-
tracted these positions from the 1000 genomes project MSL (Mende from Sierra Leone; 81 unrelated individuals), and YRI (Yoruba
from Ibadan, Nigeria; 107 unrelated individuals), to increase power. These 1000 genomes project sequences were processed by
sampling a random sequence at each position as for the ancient data, setting the genotype as missing if it did not match either of
the two alleles in the ascertained SNP set.
e9 Cell 171, 59–71.e1–e14, September 21, 2017
Principal component analysis and ADMIXTURE clustering analysesWe used smartpca (Patterson et al., 2006) to compute principal components using all transversion and transitions SNPs, and the
present-day populations shown in Figure 1 and Figure S2. We projected the ancient individuals the option lsqproject: YES, on
eigenvectors computed using the present-day populations on the Affymetrix HumanOrigins array. To deal with the confounder factor
of recent admixture with western Eurasian-related populations on the PCA, we removed all northern Africans, eastern African
Cushitic speakers, Nama, and 8 Khomani individuals that had 5% or more cluster membership in the shared with Europeans in
an ADMIXTURE analysis.
For ourmain ADMIXTURE clustering analysis (Alexander et al., 2009) (Figure 1B; Figure S3) we excluded 166,439 SNPs that were in
a CpG context and thus retain postmortem damage, and used 431,134 SNPs and 208 selected ancient- and present-day individuals
genotyped on the Human Origins Array. In Figure 1B, we show only eight representative individuals for the non-African Japanese
(originally n = 29), and Sardinian (n = 27) populations. For the authentication analysis investigating evidence of contamination, we
used PMDtools (Skoglund et al., 2014a) to isolate sequences from each sample that had clear evidence of contamination according
the postmortem damage score (PMD score > 3, using only based with phred-scaled quality of at least 30 to compute the score), and
performed clustering analysis only on 111,208 transversion SNPs (Figure S3). The exclusion of transition SNPs is due to the PMD
score approach enriching for C>T and G>A substitutions indicative of ancient DNA.
Symmetry statistics and admixture testsD-statistics, f4-statistics, and f3-statistics (Patterson et al., 2012; Reich et al., 2009) were computed with POPSTATS (Skoglund et al.,
2015). f4-statistics test whether two pairs of populations are symmetric with respect to one another, and quantify any asymmetry
arising from admixture. More specifically, if p1, p2, p3, and p4 are the derived allele frequencies at a biallelic SNP locus in population 1,
population 2, population 3, and population 4, we can estimate f4 as a sum over all SNP loci f4 =Pðp1 � p2Þðp3 � p4Þ (Reich et al.,
2009).D-statistics (Green et al., 2010), which are also used in this study, are a version of f4-statistics with a denominator to normalize
for heterozygosity, but in practice both statistics have similar power to detect deviations from the null model, and f4-statistics have
the additional advantage of being directly informative about admixture proportions and shared genetic drift (Patterson et al., 2012).
For the statistics in Figure 3B and Figure 3C, we used 814,242 transversion SNPs polymorphic between the archaic Denisovan
(Meyer et al., 2012) and Neanderthal (Prufer et al., 2014) genomes (together labeled as ‘Archaic’ here). We extracted these loci
from the 1000 genomes project MSL (Mende from Sierra Leone; 81 unrelated individuals), and YRI (Yoruba from Ibadan, Nigeria;
107 unrelated individuals). The statistics in Figure S2C used either complete genome sequences from the Simons Genome Diversity
Panel (Mallick et al., 2016), or panel 5 of the Human Origins Array, which comprises 119,413 SNPs that were originally ascertained as
polymorphic positions in a single Yoruba individual. We used this set to test whether the ancient individuals were closer to one of two
San groups because some of the SNPs on the Human Origins array were ascertained in one of the San groups, potentially affecting
the statistic. In Table S6 we report multiple D-statistics for different configurations of populations using transversion SNPs in com-
plete genomes from the Simons Genome Diversity Project and ancient shotgun sequences.
Y chromosome and mitochondrial haplogroupsFor Y chromosome haplogroup calling, we filtered reads with mapping quality < 30 and bases with base quality < 30, and determined
the most derived mutation for each sample using the tree of the International Society of Genetic Genealogy (http://www.isogg.org)
version 11.110 (21 April 2016). We also used Yfitter (Jostins et al., 2014) to confirm the haplogroups of the male Faraoskop and
St. Helena Bay individuals using the entire shotgun sequence data, with identical haplogroup calls as the other approach.
For mitochondrial DNA haplogroups, we used Haplogrep2 (Weissensteiner et al., 2016) with Phylotree 17 (van Oven and Kayser,
2009), restricting analysis to sites with base quality 10, and depth 1. These relatively permissive thresholds were used to maximize
coverage on the mitogenome. For sample I2966, which was found to have mitochondrial contamination, we first restricted to
damaged reads using a PMD score threshold of 3 (Skoglund et al., 2014a).
Ancestry model and estimates with qpAdm
Clustering analyses and PCA are sensitive to genetic drift, such as the genetic drift that occurs in a population after the time ancient
individuals lived (Skoglund et al., 2014b), and may thus not provide an accurate view of shared ancestry between ancient and pre-
sent-day individuals. We employed a framework for estimating ancestry proportions that is based on f4-symmetry statistics, taking
advantage of the fact that f4-statistics are proportional to admixture proportions and genetic drift. In the well-documented case of
Neanderthal admixture into non-African populations, for example, the statistic f4(chimpanzee, Neanderthal; African, non-African)
is proportional to ax, where a is the proportion of Neanderthal-related ancestry (approximately 2%) and x is proportional to the
amount of genetic drift that occurred from the divergence of Neanderthal ancestors and African ancestors, to the divergence of
the sampled Neanderthal genome and the Neanderthal population that admixed with non-Africans. By analyzing many such f4-sta-
tistics, (Lazaridis et al., 2014) and (Haak et al., 2015) showed that it is possible to estimate admixture proportions for a target pop-
ulation without detailed assumptions about population phylogeny, and also to perform hypothesis tests for whether a particular
mixture model fits the data (Reich et al., 2012) and to estimate standard errors for admixture proportions with a weighted block jack-
knife procedure over large segments over the genome (in this study 5 cM). This has been implemented as the qpAdm algorithm in the
ADMIXTOOLS package and requires the proposal of a set of source populations aswell as a set of outgroups that are proposed to not
Cell 171, 59–71.e1–e14, September 21, 2017 e10
share drift with the target population more recently than the source populations. In other words, appropriate source populations do
not need to be the true source populations but instead, need only bemore closely related to the true source populations than they are
to any of the outgroups. Violations of these assumptions can be detected as an increase in rank in thematrix of f4-statistics computed
(Reich et al., 2012). We also analyze a statistic using fitted allele frequencies predicted using the estimated mixture proportions, f4(Target population, Fitted Target population; Mbuti, Test). Deviations of this statistic from 0 are informative about whether some out-
groups have an excess, or deficiency, of shared drift with the Target population under the fitted mixture proportions.
Here, we used amodel with 19 populations (Mbuti, Dinka, Mende, South_Africa_2000BP, Tanzania_Luxmanda_3100BP, Ethiopia_
4500BP, Levant_Neolithic (PPNB), Anatolia_Neolithic, Iran_Neolithic, Denisova, Loschbour, Ust_Ishim, Georgian, Iranian, Greek,
Punjabi, Orcadian, Ami, and Mixe), using previously published complete genomes (Fu et al., 2014; Lazaridis et al., 2014; Mallick
et al., 2016; Meyer et al., 2012) and ancient DNA data enriched using the 1240k SNP set (Lazaridis et al., 2016; Mathieson et al.,
2015) to maximize the power to infer admixture proportions for the ancient African populations. These populations, and in particular
the ones from Africa, were chosen to capture major strands of ancestry and extremes in population differentiation found in sub-
Saharan Africa (Figure 1)
We then successively moved a set of candidate source populations (Mende, Dinka, Mbuti, South_Africa_2000BP, Tanzania_
Luxmanda_3100BP, Ethiopia_4500BP, PPNB Anatolia_Neolithic, Iran_Neolithic) from the outgroup set to test if they fit as sources
in admixture models. Using these 9 candidate sources populations, for each target population we thus tested 9 one-source ancestry
models,
�92
�= 36 two-source admixture models, and
�93
�= 84 three source admixture models, for a total of 9+36+84 = 129
models. In Figure S2 and Table S5, we show admixture proportions for the model with the lowest chi-square score (or highest
p value), if that model had a p value > 0.01. If a one-source model did not fulfill this criterion, we considered two-source models,
and then subsequently three-source models if no two-source model fulfilled the criteria.
We successfully obtained mixture models for 55 Target populations, comprising both ancient populations (we excluded Malawi_
Chencherere_5200BP due to low SNP coverage) and populations genotyped on the Affymetrix Human Origins array, all shown in
Table S5. In one analysis, Tanzania_Luxmanda_3100BP was also used as a target population, and in these analyses it was dropped
from the outgroup set. We highlight some notable mixture models inferred here:
d Kenya_400BP, Tanzania_Pemba_1400BP and Hadza1 are all fitted as having �100% Ethiopia_4500BP-related ancestry. The
other group of Hadza samples are fitted as having 19% ± 8% Dinka-related ancestry (the remainder being Ethiopia_4500BP-
related).
d Tanzania_Pemba_600BP, Malawi_Chewa, Malawi_Ngoni, Malawi_Tumbuka, Malawi_Yao, Yoruba, Esan, Gambian, Luo,
BantuKenya, BantuSA_Ovambo, Himba, Wambo, BantuSA_Herero are all fitted as consistent with having �100% Mende-
related western African-related ancestry. The Mandenka, from the western African coast, are fitted as having 2.8% ± 0.6%
Levant Neolithic-related ancestry (PPNB).
d The Luhya, an eastern Bantu-speaking group, are fitted as having 40% ± 6%Dinka-related ancestry, with the remainder being
western African Mende-related ancestry.
d The Biaka, a western rainforest hunter-gatherer group in Cameroon, is fitted as having 72% ± 2% Mbuti-related ancestry (the
Mbuti are an eastern rainforest hunter-gatherer group), with the remainder being western African Mende-related ancestry.
d Theminimum indigenous southern African ancestry observed in Khoe-groups and Bantu-speakers in southern Africa is�8% ±
2% in the Damara, and the remainder is western African-related.
d The maximum indigenous southern African ancestry observed in the present-day populations is the 91% ± 1% inferred for the
Ju_hoan_North, with the remainder being related to Tanzania_Luxmanda_3100BP.
d Some populations in northern and eastern Africa are fitted as having large proportions of Tanzania_Luxmanda_3100BP-related
ancestry. This includes the Maasai (49% ± 2%) and Datog (66% ± 3%) who have ancestry also related to the Dinka; the Kikuyu
(63% ± 2%) who also have ancestry related to the Mende; and finally, the Afar (79% ± 3%) and Somali (62% ± 6%) who have
large amounts of inferred Tanzania_Luxmanda_3100BP-related ancestry in addition to ancestry related to the Iran Neolithic.
Maximum likelihood tree modelWeused the four ancient African shotgun genomes together with complete genomes fromAfrican populations in the SimonsGenome
Diversity project (Mallick et al., 2016), excluding populations with evidence of asymmetrical allele sharing with non-Africans indicative
of gene flow (Table S6), to reconstruct a maximum likelihood tree using Treemix v1.12 (Pickrell and Pritchard, 2012). We performed
100 bootstrap replicates to assess the uncertainty of the fitted model. While this tree is not an adequate representation of human
population history in Africa, we found 100% bootstrap support for the Ethiopian_4500BP Mota being most closely related to the
ancestral population of all non-Africans (Figure 3A).
Testing a tree-like model of African population historyThe maximum-likelihood tree based on allele frequency covariance between the ancient African genomes and complete genomes
from the SGDP panel (Figure 3A) recapitulates many aspects of previous analyses of African populations (Pickrell et al., 2012;
e11 Cell 171, 59–71.e1–e14, September 21, 2017
Schlebusch et al., 2012). When African populations are forced into a tree (not allowing for mixture), southern African ancestors
diverge first, followed by Central African rainforest hunter-gatherers (e.g., Mbuti), western Africans, ancient and present-day eastern
Africans (Dinka, Hadza), then non-Africans.
To scrutinize this tree-like model in more detail, we computed all 35 D-statistics that include the outgroup and have an expected
value of 0 if a tree-like model (chimpanzee, (South_Africa_2000BP, (Mbuti, (Mende, (Dinka, Ethiopia_4500BP))))) is true. We find that
most statistics computed are inconsistent with the null model (Figure S4A). Notably, we reject the hypothesis that the ancient South
Africans are an outgroup to other African populations for several pairs of present-day populations (Table S6; Figure S4A). For
instance, with genome sequence data we find that the Ethiopian_4500BPMota genome shares more derived alleles with the ancient
South Africans thanwith present-day western Africans (D[chimpanzee, South_Africa_2000BP; Yoruba, Ethiopia_4500BP] > 0). This is
also true when West Africans are compared to Mbuti (D[chimpanzee, South_Africa_2000BP; Yoruba, Mbuti] > 0). Similar excess of
shared derived alleles is observed for the eastern Pygmies (Mbuti) compared to western Pygmies, and even when contrasting west-
ern African populations such as the Yoruba and Mende (Figure 3B; Figure 3C; Table S6; Figure S4). This could be explained in two
ways: 1) there has been gene flow between ancient southern Africans and a broad set of other populations that has resulted in a
gradient of southern African relatedness, or 2) there is a gradient of ancestry in western Africans that is basal to southern Africans,
causing an attraction to the outgroup (chimpanzee in this case) (see below).
Testing admixture graph models of African population historyTo reconstruct admixture graph models relating the histories of African populations, we used South_Africa_2000BP (South Africa),
Mende (MSL; West Africa), and Ethiopia_4500BP (East Africa) to represent major lineages contributing to present-day Africans. In
addition, we sought to explain one of the most surprising observations in our data, that the Mende and Yoruba West African popu-
lations are not symmetrically related to South_Africa_2000BP, and so we also included the Yoruba (YRI) in these analyses. For all
admixture graph analyses, we used 814,242 transversion SNPs polymorphic between the archaic Denisovan (Meyer et al., 2012)
and Neanderthal (Prufer et al., 2014) genomes (together labeled as ‘Archaic’ here).
A tree-like model does not fit the data
We first tested a strict tree-like model with no admixture edges, hypothesizing that the topology obtained from basic tree reconstruc-
tions where southern Africans are the earliest diverging lineage, and Yoruba and Mende are a clade to the exclusion of the
Ethiopia_4500BP, is true (Figure S4B). We found that this model is strongly rejected by the data with 19 predicted f4-statistics devi-
ating from the empirically observed data by jZj > 3. The most deviating f4-statistic was f4 (Archaic, Ethiopia_4500BP; MSL, YRI),
which is predicted to be 0 in the tree-like model but is empirically observed to be f4 = 0.000427, Z = 9.157. Insight into the imperfect
fit can be obtained by inspecting all four significant f4-statistics that are predicted to be zero in the model:
d f4(Archaic, Ethiopia_4500BP; MSL, YRI) = 0.000427, Z = 9.157
d f4(Archaic, South_Africa_2000BP; MSL, YRI) = 0.000193, Z = 4.742
d f4(South_Africa_2000BP, Ethiopia_4500BP; MSL, YRI) = 0.000235, Z = 4.583
d f4(Archaic, South_Africa_2000BP; Ethiopia_4500BP, MSL) = �0.000728, Z = �3.068
The three most significant deviations all test the (MSL,YRI) clade. The deviations thus indicate shared history either between MSL
and the outgroup Archaics, or between YRI and South_Africa_2000BP/Ethiopia_4500BP. These observations could be parsimoni-
ously explained by any of the following gene flow events
d Gene flow from a basal human lineage (separating from the ancestors of all sub-Saharan Africans before their separation from
each other) into the ancestors of MSL to a greater extent than YRI (there is no evidence of specifically Neanderthal/Denisovan
gene flow since f4(chimpanzee, Archaics; MSL,YRI) = �1.6 in this data)
d Gene flow related to YRI into the ancestors of Ethiopia_4500BP and South_Africa_2000BP
d Gene flow related to Ethiopia_4500BP into the ancestors of YRI more than MSL
d Gene flow most closely related to MSL into the common ancestors of the archaic Neanderthals and Denisovans (we exclude
this as implausible)
The fourth deviating statistic f4(Archaic, South_Africa_2000BP; Ethiopia_4500BP,MSL) (Z = 3.068) suggests that Ethiopia_4500BP
andMSL are not a clade with respect to South_Africa_2000BP. This weakens the case for gene flow into Yoruba alone as a sufficient
explanation, since the Yoruba do not enter into this statistic. Instead, either excess basal ancestry in the Mende and gene flow be-
tween South_Africa_2000BP and Ethiopia_4500BP could explain this particular statistic.
Admixture models with gene flow events
We proceeded by testing models with one gene flow event positing that YRI have mixture related to either South_Africa_2000BP or
Ethiopia_4500BP, or that MSL have ancestry from a basal lineage (Figure S4C; Figure S4D; Figure S4E). We found that neither of
these fit the data, with between 4 and 13 f4-statistic outliers with jZj>3.Testing admixture graphs with two admixture events, we found that a model where both YRI and MSL have ancestry from a basal
African lineage had its single outlier in an f4 statistic f4(Archaic, Ethiopia_4500BP; Ethiopia_4500BP, YRI) that is more negative in the
Cell 171, 59–71.e1–e14, September 21, 2017 e12
data than the model (Figure S4F). This f4-statistic has Ethiopia_4500BP appearing twice, and can thus be rearranged to be an f3statistic f3(Archaic, YRI; Ethiopia_4500BP) that is not positive enough (Z = 3.157), and can thus be interpreted as the model under-
representing the external drift in the Ethiopia_4500BP genome. We do not consider this outlier to compromise the model, as the pro-
cessing of the Ethiopia_4500BP (Mota) genome that we use is pseudo-haploid (single random sequence read), and thus there is no
real information about the external drift of the Mota lineage. This outlier may thus reflect a difficulty in modeling external drift for
pseudo-haploid samples.
In addition, we found that an admixture graph where both Ethiopia_4500BP and YRI are mixed between MSL- and South_Africa_
2000BP lineages does not fit the data (Figure S4G), with 3 outliers, and the worst being Z =�4.835. However, a model where the YRI
has �2% ancestry from a population that is mixed between South_Africa_2000BP and Ethiopia_4500BP fits the data with 2 outliers
that are not too surprising after correcting for multiple hypothesis testing (Figure S4H). These outliers are f4(Archaic, South_Africa_
2000BP; Ethiopia_4500BP, MSL) (Z = 3.068) which was also significant for the tree model without admixture, and f4(Archaic, South_
Africa_2000BP; Ethiopia_4500BP, YRI) (Z = 3.018). Both these outliers could be consistent with the presence of basal African
ancestry in YRI and MSL, or unmodeled gene flow between the ancestors of South_Africa_2000BP and Ethiopia_4500BP.
We thereby conclude that themost parsimonious admixture graphmodels identified here posit either the presence of basal African
ancestry inMende and Yoruba (Figure 3D; Figure S4F), or alternatively admixture from a source related to both South_Africa_2000BP
and Ethiopia_4500BP in the Yoruba but not theMende (with evidence also for gene flow between South_Africa_2000BP and Ethiopia)
(Figure 3F; Figure S4G).
Automated grafting of populations onto a skeleton admixture graphUsing the admixture graph model in which the Yoruba and Mende both carry ancestry from a basal western African population, we
automatically added additional populations to each possible node in the graph. We evaluated the fit in terms of the number and de-
viation of outlying f4-statistics, as well as whether the added branches had zero drift length. We show the results of this procedure in
Table S7, with the key to the node labels used shown in Figure S5A. We highlight topologies that we consider optimal fits in Fig-
ure S5B-5G.
We find that the Malawi_Hora_8100BP shotgun sequence data can be best fitted as mixed between the lineage leading to South_
Africa_2000BP, and the lineage related to Ethiopia_4500BP that also is fitted as forming part of the ancestry of YRI and MSL (Fig-
ure S5B). Similarly, theMbuti can be best fitted asmixed between the lineage related to Ethiopia_4500BP that also is fitted as forming
part of the ancestry of YRI and MSL, and second a lineage that diverged prior to South_Africa_2000BPbut after the basal western
African lineage (Figure S5C). Non-Africans (Japanese) are fitted as having part Archaic ancestry (Green et al., 2010), with the
remainder of their ancestry again being derived from the lineage related to Ethiopia_4500BP that also is fitted as forming part of
the ancestry of YRI and MSL (Figure S5D). This analysis is consistent with the possibility that the same human lineage contributed
ancestry both to the source of non-Africans and many African populations today.
Support for a single out-of-Africa founding populationSimple tree models suggest that non-African variation represented by Sardinian, English, Han Chinese and Japanese falls within the
variation of African populations. To test whether non-Africans are indeed consistent with being descended from a homogeneous
population that separated earlier from the ancestors of a subset of African populations – beyond the known effects of archaic admix-
ture in non-Africans –we used African populations with little or no knownWest Eurasianmixture (South_Africa_2000BP,Mbuti, Biaka,
Mende, Ethiopia_4500BP, Dinka) and testedwhether they are consistent with being an unrooted clade with respect to a diverse set of
non-Africans (Orcadian, Onge, Mixe, Motala_Mesolithic, Japanese, Anatolia_Neolithic) using qpWave (Patterson et al., 2012; Reich
et al., 2012). We found that this model was consistent with the data (p = 0.53) (transition SNPs excluded to a final set of 110,507 trans-
version SNPs). Even when we add New Guinean highlanders to the set of non-Africans, the single-source model for the out-of-Africa
founders is not rejected (p = 0.11).
Date of admixture between expanding agriculturalists and previously established foragersWeestimated thedate of admixture betweenexpanding agriculturalists related towestern Africans (probablyBantu-speakers) and the
previously established foragers using the ALDER software (Loh et al., 2013), which uses the rate of decay per generation of the linkage
disequilibrium that is created in admixed populations and that can be detected using signed linkage disequilibriumweighted by allele
frequency differences between populations taken as proxies for the ancestral populations (Moorjani et al., 2011). To maximize statis-
tical power, we used the full 1240k data merged with 1000 genomes phase 3 genotype data. We then estimated weighted linkage
disequilibrium in 99 unrelated LWK individuals (Luhya fromWebuye, Kenya) a Bantu-speaking group, using 85 unrelatedWest African
MSL individuals (Mende from Sierra Leone) and 4 ancient eastern African hunter-gatherer individuals (Ethiopia_4500BP, Tanzania_
Pemba_1400BP, Tanzania_Zanzibar_1400BP, Kenya_400BP). The analysis used a total of 1,070,197 SNPs. We obtained significant
evidence for one-reference weighted LD decay for both putative source populations (Z�6), as well as for the two-reference weighted
LD decay (Z = 4.89, p = 10�5). The estimated date of mixture was 16.8 generations ago, with a standard error of 3.4. Assuming a gen-
eration timeof 30years, this suggests that admixtureoccurredonaverage380 to760yearsago (95%confidence interval).Wenote that
a previous study (Pickrell et al., 2014) did not obtain high-confidence support for West African related admixture in the Luhya, and we
e13 Cell 171, 59–71.e1–e14, September 21, 2017
hypothesize that our clear demonstration of this is due to both the availability of amore accurate ancestral population in the formof the
ancient eastern Africans, as well as to the increased leverage from the large samples size 1000 Genomes data.
Evidence for selective sweeps in the ancestry of present-day SanWe performed a genome-wide scan for large genomic regions with excessive allele frequency between present-day San (Khomani
and Ju_hoan_North) and the two ancient South_Africa_2000BP, with the Mbuti as a second outgroup. Previous statistics such as the
Locus-Specific Branch length (LSBL) (Shriver et al., 2004) and the derivative Population Branch Statistic (PBS) (Yi et al., 2010) also
estimate a branch length in a three-population phylogeny, but use FST as their base, which can be undefined when used for loci with
fixed differences. Thus, we computed the statistic f3 = (pSan-pSouth_Africa_2000BP)(pSan-pMbuti) for windows of 500kb, separated by
10kb. We only retained windows with at least 50 SNPs, resulting in a total of l = 262,047 autosomal loci. We approximated the neutral
genome-wide average mf and its standard deviation sf by subsampling 546 of the windows, requiring that these were separated by at
least 5 million base pairs (Mb) and thus approximately independent. We then standardized the distribution of the test statistic fw in
each window as Z(fw) = (fw - mf )/sf. We show the most deviating windows in Table 2.
Evidence for polygenic selectionInvestigating evidence for polygenic selection in African populations is complicated by the fact that most information on the genomic
basis of human phenotypic variation has been based on analysis of highly differentiated populations from Africans such as Euro-
peans. In the absence of rich phenotypic information about sub-Saharan African populations, we used gene ontology (GO) informa-
tion, which draws on information from a wide array of studies on humans and non-human model organisms. We focused on 208 GO
categories that contained at least 50 genes each, which allows us to compute genome-wide block jackknife standard errors using the
entire genic regions. We focus on f3-statistics that measure the length of one of the branches in a hypothetical three-way tree-like
population history (assuming no admixture). The three populations we focused on were the ancient South_Africa_2000BP (n = 2
pseudohaploid draft genomes), the present-day San (n = 6 complete genomes), and the Mbuti (n = 4 complete genomes). The avail-
ability of the two ancient South_Africa_2000BP genomes can in principle inform us about selection in the last �2000 years since
these individuals lived, or starting further back in time in case they are not from a direct ancestral population of the present-day
San (our data suggest that they are more closely related to the Khomani San than to the Juj’hoan). We thus computed the statistic
f3(Mbuti, South_Africa_2000BP; San) which is proportional to allele frequency differentiation in the present-day San compared to the
other two populations.
We find that the ‘‘RESPONSE_TO_RADIATION’’ GO category is an outlier that shows the greatest degree of differentiation in this
analysis. However, this could also be due to genes in this category constantly being under rapid evolution or having other differences
compared to other categories. To test this, we computed the statistic f3(San, South_Africa_2000BP; Mbuti), and found no strong
signal in the response to radiation category. Instead, the category with the strongest evidence of differentiation in the Mbuti lineage
since the divergence from the San groups is ‘‘REGULATION_OF_GROWTH,’’ suggesting the possibility of relatively recent evolution
of the shorter stature of present-day rainforest hunter-gatherer populations.
DATA AVAILABILITY
Raw sequence data (bam files) from the 15 newly reported ancient individuals is available from the European Nucleotide Archive. The
accession number for the sequence data reported in this paper is ENA: PRJEB21878. The newly reported SNP genotyping data is
available to researchers who send a signed letter to D.R. containing the following text: ‘‘(a) I will not distribute the data outside my
collaboration; (b) I will not post the data publicly; (c) I will make no attempt to connect the genetic data to personal identifiers for
the samples; (d) I will use the data only for studies of population history; (e) I will not use the data for any selection studies; (f) I will
not use the data for medical or disease-related analyses; (g) I will not use the data for commercial purposes.’’
Cell 171, 59–71.e1–e14, September 21, 2017 e14
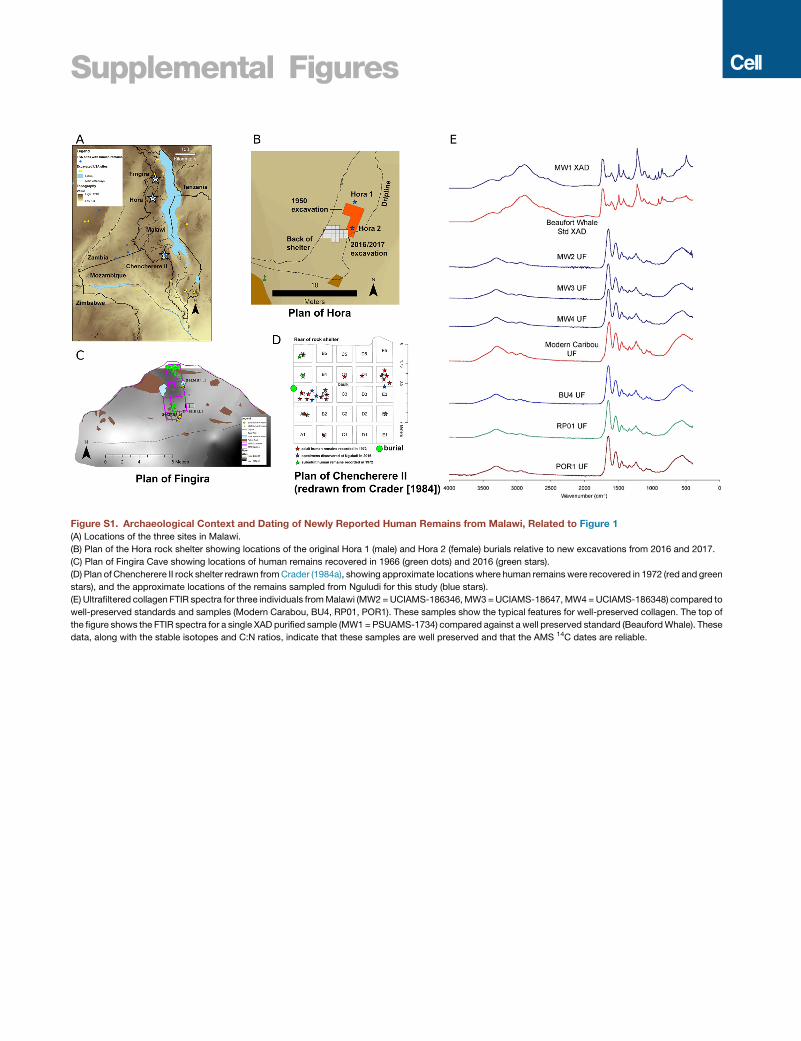
Supplemental Figures
Figure S1. Archaeological Context and Dating of Newly Reported Human Remains from Malawi, Related to Figure 1
(A) Locations of the three sites in Malawi.
(B) Plan of the Hora rock shelter showing locations of the original Hora 1 (male) and Hora 2 (female) burials relative to new excavations from 2016 and 2017.
(C) Plan of Fingira Cave showing locations of human remains recovered in 1966 (green dots) and 2016 (green stars).
(D) Plan of Chencherere II rock shelter redrawn fromCrader (1984a), showing approximate locations where human remains were recovered in 1972 (red and green
stars), and the approximate locations of the remains sampled from Nguludi for this study (blue stars).
(E) Ultrafiltered collagen FTIR spectra for three individuals fromMalawi (MW2 =UCIAMS-186346,MW3=UCIAMS-18647,MW4=UCIAMS-186348) compared to
well-preserved standards and samples (Modern Carabou, BU4, RP01, POR1). These samples show the typical features for well-preserved collagen. The top of
the figure shows the FTIR spectra for a single XAD purified sample (MW1 =PSUAMS-1734) compared against a well preserved standard (BeaufordWhale). These
data, along with the stable isotopes and C:N ratios, indicate that these samples are well preserved and that the AMS 14C dates are reliable.
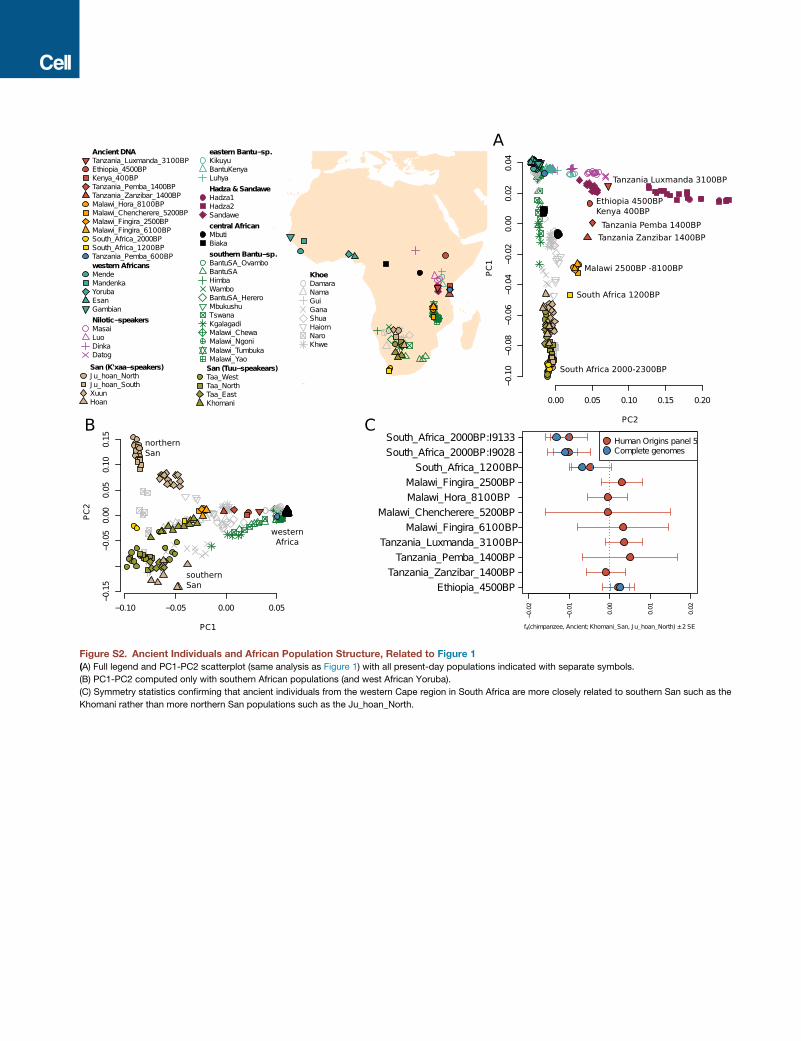
Figure S2. Ancient Individuals and African Population Structure, Related to Figure 1
(A) Full legend and PC1-PC2 scatterplot (same analysis as Figure 1) with all present-day populations indicated with separate symbols.
(B) PC1-PC2 computed only with southern African populations (and west African Yoruba).
(C) Symmetry statistics confirming that ancient individuals from the western Cape region in South Africa are more closely related to southern San such as the
Khomani rather than more northern San populations such as the Ju_hoan_North.
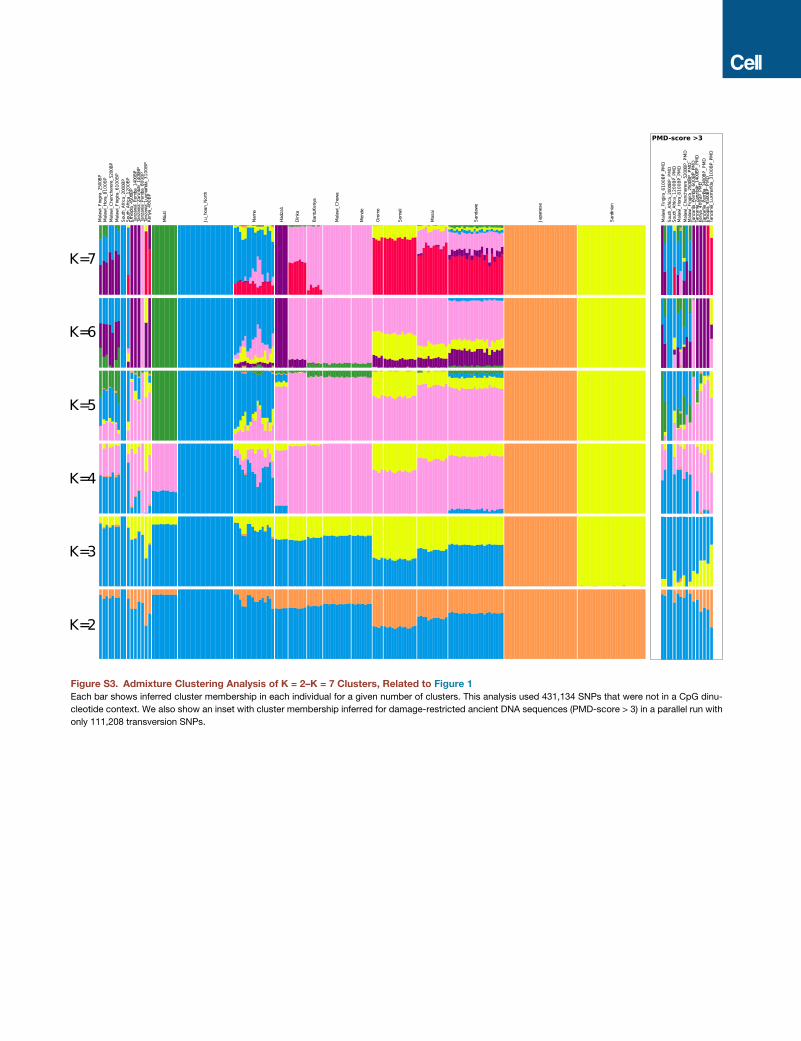
Figure S3. Admixture Clustering Analysis of K = 2–K = 7 Clusters, Related to Figure 1
Each bar shows inferred cluster membership in each individual for a given number of clusters. This analysis used 431,134 SNPs that were not in a CpG dinu-
cleotide context. We also show an inset with cluster membership inferred for damage-restricted ancient DNA sequences (PMD-score > 3) in a parallel run with
only 111,208 transversion SNPs.
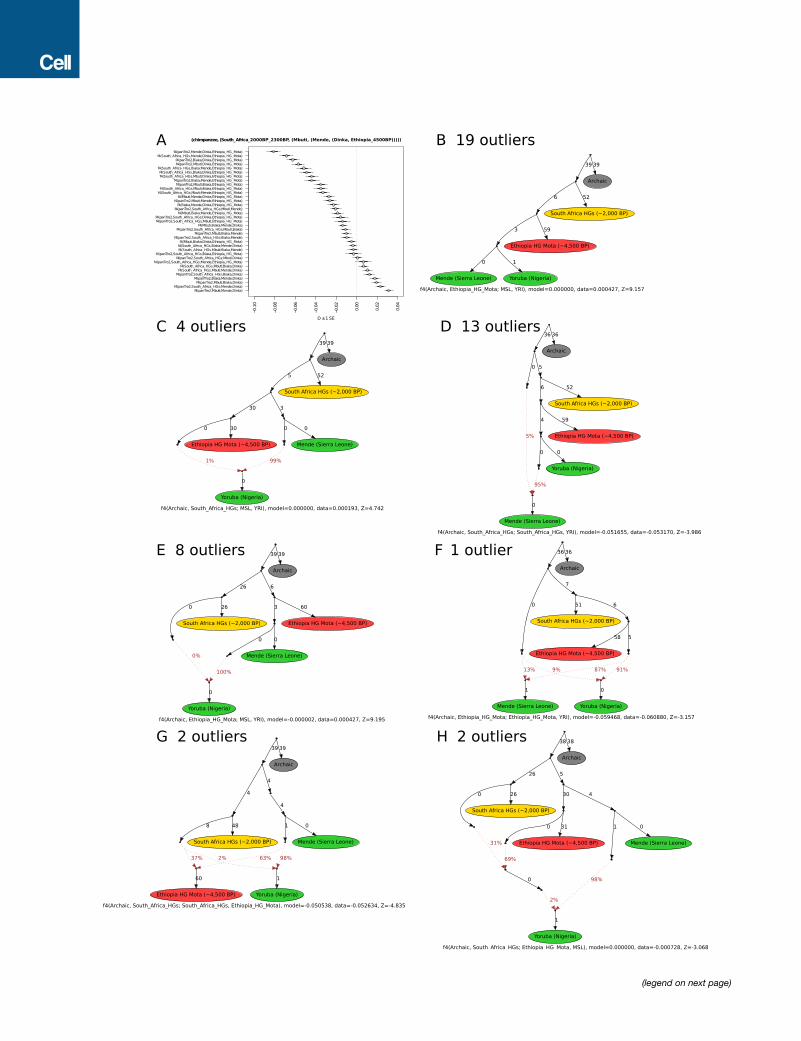
(legend on next page)

Figure S4. Admixture Models of African Population History, Related to Figure 3
(A) A tree-like model. Tests of all possible triplet topologies predicted to be symmetric by the tree obtained for major African population lineages in the maximum
likelihood model in Figure 3A.
(B–H) Under each graph we show the outlier f4 statistic with the greatest Z-score betweenmodel and empirical values. When the same group appears twice in an
f4 statistic (e.g., f4(Archaic, South_Africa_HGs; South_Africa_HGs,YRI), this corresponds to an f3 statistic. Graphs F andH are themost parsimonious fits with only
two admixture events.
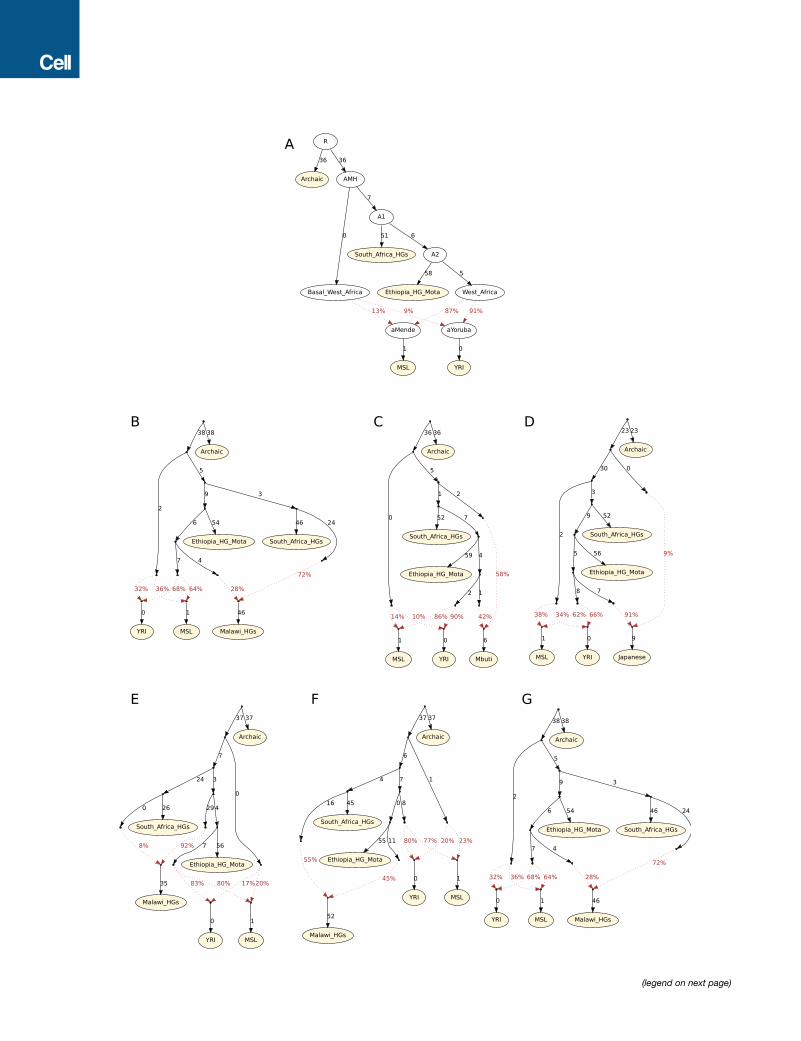
(legend on next page)

Figure S5. Automatically Adding Additional Populations to a Skeleton Graph, Related to Figure 3
(A) Skeleton graph invoking widespread admixture from a hypothesized ancestral northeast African population.
(B–D) Best fitting insertion points for Malawi_Hora_8100BP shotgun sequence data (B), Mbuti (C), and Japanese non-Africans (D), in the skeleton graph displayed
in (A). For details see Table S7.
(E–G) Best three graph solutions, all without outliers, for grafting Malawi_Hora_8100BP (Malawi_HGs) onto the skeleton graph in (A). For details see Table S6.