reconciling capital structure theories:
TRANSCRIPT

Reconciling capital structure theories:
How pecking order and tradeoff theories can be equated
Author: Vasilis Dedes
Supervisor: Barbara Cornelius
Student
Umeå School of Business
Spring semester 2010
Bachelor thesis, 15 hp

I
Acknowledgements First, I would like to express my appreciation and gratitude to my supervisor, Professor Barbara Cornelius, for her patience and guidance. I am indebted to her for the helpful suggestions and comments on my study, and the great knowledge and experience I gained from our collaboration. Also, I would especially like to thank Jenny Andrée, for her sincere friendship and the wonderful time we had together at Umeå. Finally and most importantly, I would like to express my thanks to my parents John and Margaret, and my brother George, for their unassuming love, and continual encouragement and support. They have always been my inspiration and I owe them the greatest debt. This thesis is dedicated to them.

II
Abstract In this paper we study the pecking order and tradeoff theories of capital structure on a sample of 121 Swedish, non-financial, listed firms over the period between 2000 - 2009. We find that the Swedish firms’ financing behavior appears to have features consistent with the predictions of both theories. The evidence shows a preference for a financing behavior consistent with the tradeoff theory for the whole sample and for a sample of small firms, whereas large firms appear to follow a pecking order on their financing decisions. We show that under sufficient conditions both theories might be seen as “reconciled” and not mutually exclusive, and we find evidence for the large firms of our sample consistent with this notion. Keywords: Capital structure, Pecking order theory, Tradeoff theory, Reconciliation, Mean reversion, Sweden
III
Table of Contents 1. Introduction 2. Literature Review 3. Methodology 3.1 Pre-conceptions 3.2 Relationship between theory and research 3.3 Research strategy 3.4 Epistemology 3.5 Ontology 3.6 Secondary sources 4. Theory 4.1 The controversy of capital structure 4.2 First part: testing pecking order and tradeoff theories 4.2.1 Testing the pecking order theory 4.2.2 Testing the tradeoff theory 4.3 Second part: reconciling pecking order and tradeoff theories 5. Data 6. Empirical Analysis and Results 6.1 Pecking order and target adjustment models 6.2 The changes in leverage as determined by different firm characteristics 6.3 The mean reverting behavior of the financing deficit 7. Conclusions and Further Research 8. List of References
1 3 8 8 8 8 9 9
9 11 11 14 14 16 18 20 25 25 27 30 32 33

IV
Appendices Appendix 1 - Reconciling pecking order and tradeoff theories: first approach Appendix 2 - Reconciling pecking order and tradeoff theories: second approach Appendix 3 - Pair-wise correlations Appendix 4 - Sample of firms List of Tables Table 1 Descriptive statistics Table 2 Definitions of variables Table 3 Regression results for pecking order and target adjustment models Table 4 Results of estimating the change in debt ratio using a proxy based regression Table 5 Results of estimating the financing deficit mean reversion model
21 24 26 29 31
List of Figures Figure 1 Reconciliation of pecking order and tradeoff theories Figure 2 Total book value of assets Figure 3 Return on assets Figure 4 Debt ratio Figure 5 Financing deficit
18 22 22 23 23
1
1. Introduction Capital structure remains one of the most researched issues in corporate finance since 1958, when Modigliani and Miller started to investigate a rather unexplored field. However, capital structure is not only interesting from the point of view of research. It is also interesting for its practical implementation on the corporate level, since the financing decisions of a firm are of vital importance for its operating and investing activities. Among a number of capital structure theories which have been suggested in order to examine the financing behavior of the firms, the tradeoff and the pecking order theories are those which dominate. The consensus is that these theories differ significantly on their predictions, consequently they are considered to be at odds. A great amount of research has focused on developing models which incorporate their predictions, in order to make them applicable for empirical studies. Subsequently, another part of the research undertaken to date has concentrated on empirically testing, either separately or jointly, both theories’ predictions on a variety of firms and occasions, in order to infer which theory applies better to them. Recent research has suggested that both theories share some of their predictions, and under specific circumstances both can be used to explain certain financing behaviors (Bagley, Ghosh, Yaari, 1998; Hovakimian, Opler, Titman, 2001, 2002; Fama, French, 2002; López-Gracia, Sogorb-Mira, 2008). Thus, an emerging field of research in capital structure investigates under which conditions both theories can be seen as complementary and not necessarily mutually exclusive. In this study we investigate an approach to “reconciling” both theories and we postulate under which conditions they can be seen as complementary. As Sweden has a corporate governance regime, which reflects both the shareholder and the stakeholder point of view (Thorsell, Cornelius, 2009, p. 109), we deemed it to be a suitable choice for conducting a study on a sample of firms in order to examine which capital structure theory fits better. In this study we provide an insight into how a large proportion of Swedish firms with a relatively long time horizon make their financing decisions. The first part of the study has been focused on the pecking order model and two models which reflect the predictions of the tradeoff theory. All are tested on a sample of 121 non-financial, listed firms over the period 2000 - 2009. Subsequently we examine whether these sufficient conditions are satisfied among Swedish firms in our sample. Hence, in the second part of the study, a model is introduced to test for one of the pecking order theory’s predictions, which is the starting point on the methodological approach for a “reconciliation” between the theories. Two research questions are to be answered in this research. The first is which capital structure theory applies better to the firms in Sweden. The second is under which assumptions tradeoff and pecking order theories of capital structure can be seen as “reconciled”. The reasoning for their derivation is explained in the “Literature review”. Both research questions are approached in a rigorous manner, as explained in “Theory” in order to ensure that the criteria of reliability, validity, and generalizability are met. The analysis, presented in “Empirical analysis and results”, clarifies how Swedish firms make

2
their financing decisions and whether the different theories which explain these financing behaviors can be seen as complementary. In conclusion, we claim two contributions as a result of this study on both the research and the actual corporate level. The first is on the research level and is the methodological approach that shows under which conditions both theories can be “reconciled”. The second is on the actual corporate level, since the presented conclusions regarding the determining variables of the financing behavior of the Swedish firms, are considered to provide their management with a useful tool in order to enhance their knowledge with respect to their decisions on capital structure.
3
2. Literature Review The tradeoff theory is built on models which suggest there is an optimal level of leverage. This optimal level reflects a number of benefits and costs related to debt financing. The majority of such models have as a main objective to contrast and expand the Modigliani and Miller models which are considered as a starting point for the development of all tradeoff models. In the early work these models included a limited number of costs and benefits, yet the most important ones remain the tax advantage of debt and the costs of bankruptcy and financial distress. Such models are suggested by Robichek, Myers (1966), Kraus, Litzenberger (1973), Scott (1976). However, other studies (DeAngelo, Masulis, 1980; Bradley, Jarrell, Kim, 1984) suggest that along with the tradeoff of this set of costs and benefits, there are also other costs which have to be incorporated into the models. These are agency costs of debt, costs related to loss of non-debt tax shields, and costs related to differential personal tax rates between income from stocks and bonds. However, the main interest of the research (Taggart, 1977; Masulis, 1980; Marsh, 1982; Auerbach, 1985; Choice, Titman, Wessels, 1988) is focused on testing the predictions of the tradeoff theory regarding the determinants of the financing decisions. These determinants reflect a number of firm and industry characteristics, and are included as dependent variables in models developed to explain the financing behavior of the firm. Thus, if firms have a financing behavior consistent with the tradeoff theory, it is expected that certain variables, which determine their financing decisions, will follow certain patterns reflected in their financial statements and their market values, as measured in stock and bond markets. Hence, researchers in their attempt to discover such financing behavior have developed models, such as regression models and deterministic models, which they test for patterns among several variables as predicted by their hypotheses based on the tradeoff theory. In the case of hypothesis rejection the evidence is against the tradeoff theory and other theories for explaining the financing behavior of a firm should be tested. The existence of an optimal level of debt implies that firms should appear to have a fairly stable level of debt which reflects an optimal target level. Nevertheless, when the debt levels deviate from this target, the management of a given firm should take actions in order to adjust leverage to the optimal level. When the debt level moves towards its target, it is said that it “reverts to the mean”. This feature of leverage, i.e. the mean reversion, is the most important prediction of the tradeoff theory, and is pivotal for its validity. Thus, the majority of the studies which test the tradeoff theory, attempt to determine the firm’s target debt level, which is always unknown, and subsequently to examine whether leverage is adjusted accordingly. Although the empirical findings of the research vary, a partial adjustment to a target debt level appears to be a valid finding among the studies. Thus, some studies (Taggart, 1977; Hovakimian, Opler, Titman, 2001; Fama, French, 2002; Kayhan, Titman, 2007) find evidence for a rather slow adjustment of the debt ratio to its target, and others (Auerbach, 1985; Flannery, Rangan, 2006) find that there is a relatively faster adjustment. Farhat, Cotei, Abygri (2009) find that the rate of adjustment to a target varies due to the

4
institutional environment of the countries wherein the company operates. For example López-Gracia, Sogorb-Mira (2008) find, from a sample of Spanish companies, that small-and medium-sized companies adjust very slowly to their target. Other studies distinguish between long term and short term debt ratios and study separately their adjustment to a target level. Taggart (1977) finds that the speed of adjustment is relatively slow for long term debt. Marsh (1982) finds that firms behave as if they had a target adjustment for both long term and short term debt ratios. Jalilvand, Harris (1984) suggest that large firms appear to adjust faster to the target level of long term debt than do small firms, and Auerbach (1985) suggests a faster speed of adjustment, particularly for the short term debt. Another determinant of the financing decision which has been tested is the market timing consideration. Taggart (1977) reports rather questionable findings regarding the timing consideration, and Marsh (1982) finds evidence that the timing and the market conditions play significant roles in the decision when choosing between equity and debt. He thus gives support for Taggart’s (1977) questionable evidence for the stock market timing consideration. Jalilvand, Harris (1984) find evidence that firms tend to time long-term debt and equity issues driven by interest rates and market conditions. Flannery, Rangan (2006), and Kayhan, Titman (2007) also find evidence that the timing consideration is an important determinant for firms’ financing decisions. Masulis (1980,1983) finds evidence that capital structure changes have a positive effect on stock prices and firm values, which is consistent with the importance of the market timing and the tax based models on capital structure theory. Finally, from another point of view, Baker, Wurgler (2002) suggest that market timing is the only determinant of the financing decisions and that there is no optimal capital structure. However, the empirical findings from several studies stress some phenomena which are often inconsistent with, or question the validity of the predictions of the tradeoff theory. These anomalies are due to the static approach used by the majority of the studies to study a rather dynamic financing behavior. Hence, in an attempt to explain the actual financing behavior of firms, researchers (Krouse, 1972; Fischer, Heinkel, Zechner, 1989; Hennessy, Whited, 2005) developed dynamic models based on the traditional tradeoff models which they say explain these inconsistencies and expand the concepts of a static tradeoff theory into a more realistic framework without rejecting it. An alternative explanation for the inconsistencies of the tradeoff theory came from the pecking order theory (Myers, 1984; Myers, Majluf, 1984) of capital structure. An early approach to test the predictions of the pecking order theory was by Auerbach (1985) who included the cash flow deficit as a variable in his model in order to investigate if there is any relation between the cash flow needs and the leverage of the firm. This is an interesting variable that could be added to a model intended to explain debt ratios, since it is one of the main determinants of pecking order theory where it is expected that the cash flow needs of a firm drive its debt ratios. However, as Auerbach (1985, p.313) concluded this variable in his model is unexpectedly insignificant.

5
Also Baskin (1989) found evidence in favor of the pecking order behavior of firms. He tested the pecking order theory by applying a regression of the debt ratio against growth and profitability. He shows that the debt ratio varies positively with past growth and inversely with past profits and he asserts that since borrowing behavior does not seem to be serially correlated, there is little indication of any adjustment towards optimal debt target levels. The most important methodology for testing the pecking order theory comes from Shyam-Sander, Myers (1999) who studied the relationship of the changes of debt and the financing deficit of the firm. Moreover, they are the first who conducted a comparative analysis between the tradeoff and the pecking order model on a sample of mature, listed corporations. They found evidence that the pecking order model explains corporate financing behavior. Also the tradeoff model, when tested independently, seems to explain the same financing behavior. However, when both models are tested jointly, there is a strong favor for the pecking order model. Moreover, they conducted a simulation of both models to test their relative explanatory power, and they concluded that the target-adjustment models are not rejected even when they are false. The pecking order theory, by contrast, can be easily rejected when it is false. This fact provided evidence for the pecking order model. However, Chirinko, Singha (2000) questioned the validity of the inferences made by Shyam-Sander, Myers (1999) regarding the evidence found in favor of the pecking order theory. Frank, Goyal (2003) tested the pecking order theory for a sample of firms and over a rather long period. They suggested that internal financing is on average insufficient to cover the investment needs of a firm, consequently external financing is commonly used, and debt financing does not dominate equity financing. Both suggestions are at odds with the pecking order theory. Also they found evidence that the pecking order theory explains better the financing behavior of larger firms in the earlier years of their sample. Finally they concluded that although the financing deficit, which is a key variable in the pecking order model, explains to some extent the financing behavior of firms, the pecking order theory seems to have serious problems. However, the majority of the research which has been conducted for testing the predictions of the pecking order theory is in comparison with the tradeoff theory. Thus, many studies (Shyam-Sander, Myers, 1999; Fama, French, 2002; Flannery, Rangan, 2006; López-Gracia, Sogorb-Mira, 2008; Farhat, Cotei, Abygri, 2009) test jointly the predictions of both theories and find evidence for both theories. Thus, the first purpose in conducting this study proceeds from the desire to test both theories empirically. Moreover, the corporate governance regime in Sweden, which appears to have features from both the shareholder and stakeholder point of view (Thorsell, Cornelius, 2009), gives some grounds for conducting a study on a sample of Swedish listed firms in order to investigate which capital structure theory applies better to them. Since there do not appear to be any previous comparable studies conducted for testing these two theories within Sweden despite the convergence of governance models around the world toward the Swedish one, the first research question examining capital structure in Swedish
6
firms was developed. We suggest that the contribution of this study, given these circumstances, may be considerable. Another very important notion suggested by a few researchers is that both theories appear to share predictions and to explain certain financing behaviors. For instance, a pecking order model applies better to large and mature firms, however they appear to have a target debt ratio without making the predicted adjustments towards it. This example points out that both theories can be observed under certain circumstances without being at odds. Consistent with the fact that both theories explain certain financing behavior under specific circumstances, is the study by Bagley, Ghosh, Yaari (1998). They developed a class of dynamic models into a stochastic dynamic framework. They asserted that the pecking order theory was consistent with the static tradeoff theory, and the two complement one another rather than compete. Hovakimian, Opler, Titman (2001, 2002) stated that a dynamic tradeoff theory seems to explain better firms’ behavior regarding capital structure decisions. That is, pecking order theory holds in the short run, and explains why the firms appear to drift away from target debt ratios, yet a static tradeoff theory holds in the long run and determines why firms tend to move toward a target debt ratio. With respect to choosing between the two theories Myers (1984, p. 589) states:
At this point we face a tactical choice between two research strategies. First, we could try to expand the static tradeoff story by introducing adjustment costs, possibly including those stemming from asymmetric information and agency problems. Second, we could start with a story based on asymmetric information, and expand it by adding only those elements of the static tradeoff,
which implies that an integrated model combining all the alternative capital structure theories would be possible. Furthermore, Myers (2001, p. 94) regarding the findings of a simulation conducted on an earlier paper with Shyam-Sander, see Shyam-Sander, Myers (1999), in order to test the relative power of both theories against each other states:
Why was the target-adjustment model not rejected even for simulated financing policies generated by pecking order? Evidently the pecking order generated mean-reverting debt ratios. Why? The answer is simple: the capital investments of firms are “lumpy” and positively serially correlated, and internally generated cash varies over the business cycle. Therefore firms will tend to have strings of years with financial deficits, followed by strings of surpluses, or vice versa. If the firms finance by pecking order, debt will “tend up” in deficit years and fall in surplus years. The pecking-order debt ratios will mean-revert, and the target-adjustment model will explain financing strategy,
which also implies that both theories could complete each other. Nevertheless, according to Myers (2001, p.99), there is not a general theory of capital structure. Instead, they are
7
conditional theories which emphasize different aspects of alternative financing strategies, which seems more plausible than a fully integrated theory of corporate financing decisions. Finally, Shyam-Sander, Myers (1999) regarding the mean reverting behavior of debt ratios (which is a proxy for the tradeoff theory) state (p. 240):
Mean reversion in debt ratios can generate spuriously good fits, and significant coefficients for target-adjustment models, even when the mean reversion has nothing to do with optimal debt ratios, but simply reflects pecking-order financing coupled with cycles or mean-reversion in financial deficits or surpluses.
This statement leads to the second research question. That is, under which assumptions can tradeoff and pecking order theories of capital structure be seen as “reconciled”. Our incentive is to test whether the financing deficits are mean reverting and if such mean reverting financing deficits exist, to show that explaining the mean reverting debt ratios, which will be a “reconciliation” between the two models. Thus, the second purpose in conducting this study is to provide an insight on Shyam-Sander and Myers’ suggestion. This might also be a considerable contribution to the existing literature, since it approaches from another perspective the notion of whether both theories complete each other, and subsequently whether both theories can be “reconciled” to some extent.
8
3. Methodology 3.1 Pre-conceptions I do not believe that I have sufficient experience in business research to affect the results of the research process that I have undertaken. I have insufficient background in business or in business research to have a large number of preconceptions that are likely to affect the outcome of my studies. Additionally, as I am intending to follow the trend in finance research and adopt a quantitative approach based on the scientific method. Any cultural artifacts or personal idiosyncrasies are, by definition, excluded from consideration. The only aspects of my history that I believe may affect my research remains in my attitude toward it. That is, I have a strong desire to fill gaps in knowledge, both my own and that I find in the literature. This has driven my search for an appropriate topic, an appropriate methodology and an appropriate perspective for undertaking this study. 3.2 Relationship between theory and research Theories are pertinent to research as theoretical perspectives provide guidelines to hypothesis development, i.e. the theories selected may, indeed are likely to, affect the outcomes of the study as they are the basis for any questions asked. Previous studies in a similar field of study also assist in the development of hypotheses, particularly when applying the deductive approach. Thus, knowledge is built upon the groundwork laid by previous researchers. This deductive approach dominates in the existing literature on capital structure, an area where two theoretical perspectives are most commonly adopted. These are the “tradeoff theory” and the “pecking order” theory. Following tradition, the deductive approach will be adopted in this study where the focus will be on these two capital structure theories. The first part of this study will involve testing the hypotheses and predictions of the tradeoff and the pecking order theories on a sample of Swedish companies, in order to identify which theory’s predictions replicate better the observed financing behavior of Swedish firms. The second part of the study will be used to empirically scrutinize a hypothesis deduced from the capital structure literature. This hypothesis states that a firm’s debt ratio will show a mean reversion or adjustment toward a target ratio as a result of the firm’s financing deficit’s mean reversion. As a result of both variables’ tendency toward mean reversion, it can be demonstrated that the two dominating theories related to a firm’s capital structure, can be perceived as complementary and thus can be reconciled to some certain extent. Finally, a model will be developed and tested against the data collected. 3.3 Research strategy The different approaches to conducting research, whether it is to be quantitative or qualitative, are subject to the requirements of that particular study. That is, the problem to be studied and its characteristics influence and eventually might determine the choice of the research strategy. The quantitative approach is used to construct a research strategy which emphasizes the scientific method in the collection and the analysis of the data. On the other hand, the qualitative approach emphasizes descriptions rather than numerical data (Bryman,
9
Bell, 2007, p. 28). However, both research strategies entail different epistemological and ontological perspectives, making their differences more profound. For the purpose of this study a quantitative research strategy is followed. More specifically, in the first part of the study, both theories are applied to a sample of companies in order to identify the determinants of their financing behavior. In the second part the subject the hypothesis that both theories commonly applied to capital structure issues can be viewed as complementary, and thus can be reconciled. Thus, for the purpose of the study a set of statistical models will be developed for testing the hypotheses. The models to be applied and the collection of the panel (time series cross-section) data are discussed in the chapters on “Theory” and “Data” respectively. Finally, the quantitative approach is consistent with the assumptions set previously regarding the relationship between theory and research. 3.4 Epistemology The epistemological perspective of a study addresses the question of what is regarded as acceptable knowledge in the discipline to which the study pertains. Moreover, another question that arises is whether the social world can be perceived under the same principles as natural sciences. Two main positions are often examined to answer these questions, positivism and interpretivism. Positivism applies the methods and practices followed by the natural sciences to the study of social realities. On the other hand, interpretivism asserts that people and the social environment in which they live is fundamentally different from that of social sciences and cannot be examined objectively (Bryman, Bell, 2007, p. 16). This empirical study employs the principles of statistical modeling in order to test hypotheses that were deduced from previous literature that also employed a “postivist” perspective. Since the methodology is driven by the natural sciences a scientific or epistemological orientation, which is not pertinent to hermeneutics or interpretivism, is considered, by me, to be appropriate for this study. This is consistent with the deductive and the quantitative approach used regarding the research process as described earlier. 3.5 Ontology Since ontology is the study of existence and is concerned with the nature of being, the question to be answered is whether the capital structure of a firm, which is the subject of this study, can be viewed as an objective entity or a social construction. While firms could be classified as a “social construction” wherein people come together to order their economic lives, the law classifies the firm as a person, i.e. as a tangible object with objective reality. If the firm has an objective reality, even more so does its capital structure. The capital structure of the firm can be examined and measured. If, by definition, the firm and its capital structure are tangible and have an objective reality. objectivism appears to be the best fitted ontological orientation for the scope of this study. 3.6 Secondary Sources As this is a positivistic, quantitative study based on deductive reasoning, the reliability of secondary sources is important. To insure that I have found the best available material, I have avoided the use of non-refereed and non-academic sources in the literature used. In

10
fact, where-ever possible, I have gone back to the seminal work in the field. As these seminal authors have been examined repeatedly and as their work provides the foundation for so much additional research effort, I believe they can be considered credible.
11
4. Theory 4.1 The controversy of capital structure Capital structure is one of the most important issues for firms, since it appears that their financing decisions affect their operating and investing decisions. Nevertheless, the financing behavior of firms and its determinants remain a controversial issue that has concentrated a great amount of research. The main problem for capital structure is the difficulty of inferring from empirical data a general pattern which describes all different financing decisions for all the states of nature. As Myers (1984, p. 575) points out “How do firms choose their capital structures? We don't know”. However, the existing theories on capital structure, even under the assumption that they are controversial, are adequate approximations of actual financing behaviors. And since these theories do not have the power of a law of nature, they can be relaxed and modified in order to become more realistic. Yet, even if these theories are only approximations, some reflect better the reality and others do not. The argument for the validity and the explanatory power of each theory proceeds from empirical findings. One of the purposes of this study is to investigate two of these theories, the tradeoff theory and the pecking order theory. The first part of this chapter explains the methodology for conducting the empirical study and testing the hypotheses predicted by each theory. The second part of the chapter points out the reasoning for “reconciling” both theories and showing that ultimately they are not mutually exclusive. Prior to this the main theories on capital structure are briefly presented. The two papers of Modigliani and Miller (1958, 1963) are considered pathbreakers for capital structure theory, not because of their empirical validity, but because they formed the foundations of a tremendously extensive research and influenced several researchers to examine capital structure issues. In the 1958 paper, Modigliani and Miller follow a partial-equilibrium approach focusing on the firm and the industry in order to address the cost-of-capital problem. Under assumption of perfect markets, and in the absence of taxes on corporate income, they show that the market value of any firm is independent of its capital structure. In their 1963 paper they consider the real-world impact of taxes on capital structure. As interest payments on debt are deductible they recognized that debt financing entails a tax advantage for a firm which increases its market value. Modigliani and Miller at the conclusions of their paper (1963, p. 442), suggest that other considerations have to be taken into account in a real world in order to identify why firms do not have 100% debt in their capital structures. These considerations included “the need for preserving flexibility” which is the maintenance by the firm of a substantial reserve of borrowing capacity. Ultimately Modigliani and Miller find that what really matters for the firm’s market value is not its capital structure but its ability to generate cash flows. How these cash flows are to be distributed to various claimants is irrelevant. That is, by introducing taxes into the initial model government becomes a claimant on the firm’s cash flows, hence, since the firm pays less taxes due to the use of debt the only thing that changes is the slices of the pie that shareholders, debtholders, and the government take. Thus, by altering the capital structure firms alter how the pie will be cut up among different claimants. It does not make the pie larger. However a caveat put forward by Modigliani and Miller is that when a firm changes
12
its capital structure, it changes its risk class; by using more debt the firm becomes riskier which is not without expense. Building on the work of Modigliani and Miller and incorporating more ‘real world’ factors to revise their original models has been the focus of numerous, researchers. Market imperfections appear to have a quite influential role on the value of the firm and the following theories are established to reflect real conditions. A starting point for almost all these theories is the introduction of taxes which entails benefits and costs. Thus, a tradeoff between benefits and costs leads to a capital structure theory which assumes an optimal level of debt. This theory is known as the “Tradeoff Theory” of capital structure. Miller (1977) argues against the tradeoff theory, denying the existence of a single optimal capital structure based on the tradeoff between tax gains and deadweight costs due to the existence of debt. While accepting that deadweight costs exist, he suggests they are disproportionately small relative to the tax gains which they are said to balance. He shows that under certain conditions there is an equilibrium of aggregate supply and demand for corporate debt, in which the tax advantage of debt financing at the firm level is exactly offset by the tax disadvantage of debt at the personal level. Since this equilibrium refers to aggregates, the debt policy does not affect any single firm’s value. Jensen and Meckling (1976) introduced another set of factors into the capital structure debate. They viewed the firm as a nexus of contracting relationships among individuals, and stressed the inter-relationship between various actors including shareholders, creditors and management. Because management acts as agents for shareholders their capital structure choices can create conflicts between shareholders and creditors when a firm is financed with both equity and debt. Specifically, when a firm has issued risky debt, shareholders gain at the expense of debtholders. Thus, shareholders can gain when the value of existing debt falls. This relationship entails agency costs. Agency costs associated with debt consist of:
1. “the opportunity wealth loss caused by the impact of debt on the investment decisions of the firm,
2. the monitoring and bonding expenditures by the bondholders and the owner-manager (i.e., the firm),
3. the bankruptcy and reorganization costs” (Jensen, Meckling, 1976, p. 342) An additional area of agency exposure possibly affecting capital structure, according to Jensen (1986) and Ross (1977) is outlined in the free cash flow theory. Managers may prefer to reinvest retained earnings in projects with low or even negative net present value increasing the size of the firm and the utility of the managers but not the shareholders’ wealth. Hence, agency costs associated with the conflicts of interest between managers and shareholders also have an impact on capital structure. Thus, because debt can act as a disciplinary device for firms where managers are prone to overinvestment, some managers are pressed to use more debt in their firm’s capital structure. Given information asymmetry between the insiders and outsiders (mangers, shareholders and creditors) an alternative theory has been developed to explain existing capital
13
structures. This is the pecking order theory, an alternative approach to capital structure theory suggested by Myers (1984). For any given firm there is a pecking order on its alternative financing decisions. It is suggested that firms will borrow, rather than issuing equity, when internal cash flow is not sufficient to fund capital expenditures. According to the pecking order theory firms prefer internal to external financing and debt to equity when they issue securities (a preference order observed in 1961 by Donaldson). Thus, the amount of debt will reflect the firm’s cumulative need for external funds. Myers and Majluf (1984) provide an explanation for the pecking order theory based on information asymmetry. As managers have better information about the firm and its projects than do shareholders or external investors. As there is a downward impact on stock price with new share issues that is greater than that accounted for by the existence of additional shareholders in the firm, a new share issue is considered a negative signal to all investors. Debt involves an obligation to cover interest payments to creditors; its issuance signals that management and creditors are comfortable with this cost – that obligations can be met. Issuing debt has less impact on stock price. Due to this fact, managers will prefer to issue debt over equity. Since the pecking order theory emphasizes information asymmetry, rather than taxes as a cause of capital structure, there is an implication that there is not a well-defined target level of debt. Instead the debt ratio reflects the cumulative result of all the firm’s previous financing decisions, and as a result the cumulative requirement for external financing. That is, changes in the level of debt are not driven by the need to adjust it to an optimum, but rather by the need for external financing. This, in turn, is determined by the imbalance between a firm’s investment needs and internally generated funds. This imbalance is known as a financing deficit. If the financing deficit is positive, that is, the firm’s investment needs outrun its internally generated funds, then the firm issues debt. This is also one of the major hypotheses tested in order to postulate whether a firm’s financing behavior is consistent with the pecking order theory (Shyam-Sander, Myers (1999), p. 220-221). Myers’ (1984, p. 589) conclusions regarding the pecking order theory are the following:
1. “Firms have good reasons to avoid having to finance real investment by issuing common stock or other risky securities. They do not want to run the risk of falling into the dilemma of either passing by positive-NPV projects or issuing stock at a price they think is too low.
2. They set target dividend payout ratios so that normal rates of equity investment can be met by internally generated funds.
3. The firm may also plan to cover part of normal investment outlays with new borrowing, but it tries to restrain itself enough to keep the debt safe-that is, reasonably close to default-risk free. It restrains itself for two reasons: first, to avoid any material costs of financial distress; and second, to maintain financial slack in the form of reserve borrowing power. “Reserve borrowing power” means that it can issue safe debt if it needs to.
4. Since target dividend payout ratios are sticky, and investment opportunities fluctuate relative to internal cash flow, the firm will from time to time exhaust its

14
ability to issue safe debt. When this happens, the firm turns to less risky securities first-for example, risky debt or convertibles before common stock.”
4.2 First part: testing pecking order and tradeoff theories 4.2.1 Testing the pecking order theory The proxy for the validity of the pecking order model is the relation between the change on debt and the financial deficit determined by the imbalance between a firm’s investment needs and internally generated funds. Furthermore, it arises that if the financing deficit is positive, that is, the firm’s real investment needs and dividend commitments outrun the internally generated funds, then the firm issues debt. Shyam-Sander, Myers (1999, p. 224) in order to test the pecking order theory, introduced the following model: ∆Dit = a + bPODEFit + eit (1) DEFt = DIVt + Xt + ∆Wt + Rt – Ct (2) where ∆Dit is the amount of debt issued, if DEFt is positive, or the amount of debt retired, if DEFt is negative, by the firm, and they define the following variables: Ct = operating cash flows, after interest and taxes, DIV t = dividend payments, Xt = capital expenditures, ∆Wt = net increase in working capital, Rt = current portion of long-term debt at start of period, Dt = long-term debt outstanding, At = net book assets, including net working capital The pecking order hypothesis to be tested in Eq. (1) is that a = 0 and bPO = 1, where bPO is the pecking order coefficient. These hypotheses proceed from the pecking order theory’s prediction that debt issues or retirements are equal to each firm’s financing deficit or surplus respectively. In another similar study, Frank and Goyal (2003, p. 221) used the same model to test the pecking order theory, however they argued that Shyam-Sander, Myers’ definition of the financing deficit Eq. (2) is not an accounting identity because of Rt, thus, they remove this factor and Eq. (2) becomes: DEFt = DIVt + It + ∆Wt – Ct = ∆Dt + ∆Et (3) where: It = net investment in year t, ∆Dt = net debt issued in year t, ∆Et = net equity issued in year t.
15
Hence, Eq. (3) is the accounting cash flow identity. Frank and Goyal (2003) apply both Eq. (2) and Eq. (3) on their sample and they conclude that the current portion of long-term debt is not a statistically significant determinant of the financing deficit, and is inconsistent with the predictions of the pecking order theory (2003, p. 236). Also in other studies (Kayhan, Titman, 2007; Jinlan Ni, Miaomiao Yu, 2008; Farhat, Cotei, Abygri, 2009) financing deficit is defined as in Eq. (3). Regarding the estimation of Eq. (1) both Shyam-Sander, Myers (1999) and Frank,Goyal (2003) use as a dependent variable the net or gross debt issued scaled by net assets, or the change in debt ratio. The debt ratio is defined as the change in long-term debt to net book assets ratio, where net book assets are equal to total assets minus current liabilities. The long-term debt is used as the numerator, since we are concerned with long-term financing. Regarding the denominator Frank,Goyal (2003, p. 222) also scale by the total book value of assets instead of scaling with the net book assets. They find that their results are not affected. However, due to restrictions on access to the relevant data for estimating the financing deficit either using Eq. (2) or Eq. (3), or using the sum of the net debt issued and the net equity issued we used an alternative definition of the financing deficit given by López-Gracia, Sogorb-Mira (2008). DEFt = ∆ Fixed Assetst + ∆ Working Capitalt + ∆ Long-Term Debtt – CFt (4) where CFt is the cash flow defined as earnings after tax plus depreciation. Moreover, if any of the relevant data estimating Eq. (2) or Eq. (3) were available, there were significant gaps on the reported variables. Hence, using the definition in Eq. (4) ensures that our limited access on the relevant data is sufficient to meet the criteria of data collection described on the chapter “Data”. However, these restrictions allow us to estimate only the long-term debt to total book value of assets ratio and use its change as dependent variable.
16
4.2.2 Testing the tradeoff theory The target adjustment model Since the tradeoff theory suggests that firms have a target debt ratio, and firms tend to adjust their debt ratios to these targets, it arises that the tradeoff theory can be tested by testing for the target adjustment of leverage, i.e., the mean reversion of the debt ratio. A simple target adjustment model is: ∆Dit = a2 + bTA(D*
it - Dit-1) + eit (5) where ∆Dit the change in debt ratio, D*
it is the target debt ratio for firm i at time t, and bTA the target-adjustment coefficient, as denoted by Shyam-Sander, Myers (1999, p.226). The hypothesis to be tested is bTA > 0, in order to have adjustment towards the target. Furthermore, if bTA < 1, the firm adjusts its debt ratio partially to its target, reflecting the existence of positive transactions costs, which is consistent with the tradeoff theory. However, the target debt ratio D*
it is unknown. Two approaches are followed for estimating the change in debt ratio, as was done by Shyam-Sander, Myers (1999). The target adjustment model, with target set at historical average The target debt ratio, D* it, is assumed to be static over the time, and is set equal to the historical average debt ratio of each firm over 2000 - 2009. Similar methodology for estimating the target debt ratios has been used by Taggart (1977), Marsh (1982), Jalilvand, Harris (1984), and Shyam-Sander, Myers (1999). Thus, the change in long-term debt to total book value of assets ratio is determined by the adjustment of the debt ratio to its target, Eq. (5). The target adjustment model, with target determined by firm characteristics The target debt ratio, D* it, is time varying and is estimated with a proxy based regression. Similar tradeoff models estimate a firm’s target debt ratio, by regressing the actual debt ratio on a number of variables which reflect a number of firm characteristics. These characteristics are proxies for the predictions of the tradeoff theory regarding a firm’s optimal debt ratio. The following regression model uses as proxies, the tangibility of assets, the size, the profitability, and growth. D*
it = a3 + b1(Tangit) + b2(Sizeit) + b3(Profit) + b4(Growthit) + eit (6) Independent variables included in Eq. (6) Tangibility of assets The tangibility of assets can be seen from the point of view of both theories. From the perspective of the tradeoff theory, the tangible assets serve as debt collateral. Hence, firms with more tangible assets can issue more debt compared to those with few tangible assets,
17
and a positive coefficient is expected, b1 > 0. However, from the point of view of the pecking order theory, the tangibility of assets entails information asymmetry and subsequently information costs. According to Harris and Raviv (1991), firms with a few tangibles assets will incur more information asymmetry problems, and will accumulate more debt. Thus, a negative coefficient is expected, b1 < 0. The tangibility of assets is defined as the ratio of property, plant, and equipment to total book assets, (Tangt = PPEt / TA t). Size of the firm Larger firms are expected to use more debt, because they are more diversified, have usually better reputations, and consequently better access to the debt markets, and have lower information costs. Thus, it is expected that b2 > 0. The size of the firm is defined as the natural logarithm of the total book assets, (Sizet = ln(TAt)). Profitability The tradeoff theory predicts that the more profitable firms will be more leveraged. Thus, a positive coefficient for this variable is expected, b3 > 0. However, the empirical findings of several studies suggest there is a negative correlation, which is evidence against the tradeoff theory. The profitability is defined as the ratio of operating earnings to total book assets, (Proft = EBITt /TAt), which is also referred to as return on assets. Growth Firms with high growth tend to maintain financial slack by limiting their leverage. Hence, the growth of the firm is expected to be negatively correlated with the leverage, consequently is expected b4 < 0. The growth usually measured as the market-to-book ratio, or with other ratios based on the growth of the sales, the operating income, or the book value of total assets. For this study growth is defined using the market-to-book ratio. Thus, by using a time varying target ratio, Eq. (6), the change in long-term debt to total book value of assets ratio is given by the following expression: ∆Dit = a3 + b1∆(Tangit) + b2∆(Sizeit) + b3∆(Profit) + b4∆(Growthit) + eit (7) By having the same dependent variable in equations (1), (5), and (7) we can test, as Frank, Goyal (2003) did, in a nested model the pecking order and target adjustment models, and the proxy built variables.
18
4.3 Second part: reconciling pecking order and tradeoff theories In the second part of the study an attempt is made to examine whether the mean reversion of the debt ratio reflects the mean reversion of the financing deficit. In order to test the mean reversion of the financing deficit we introduce the following model: ∆DEFit = a4 + bDEF(DEF*
it - DEFit-1) + eit (8) The hypothesis to be tested is bDEF > 0, in order to have a mean reversion of the financing deficit. DEF*
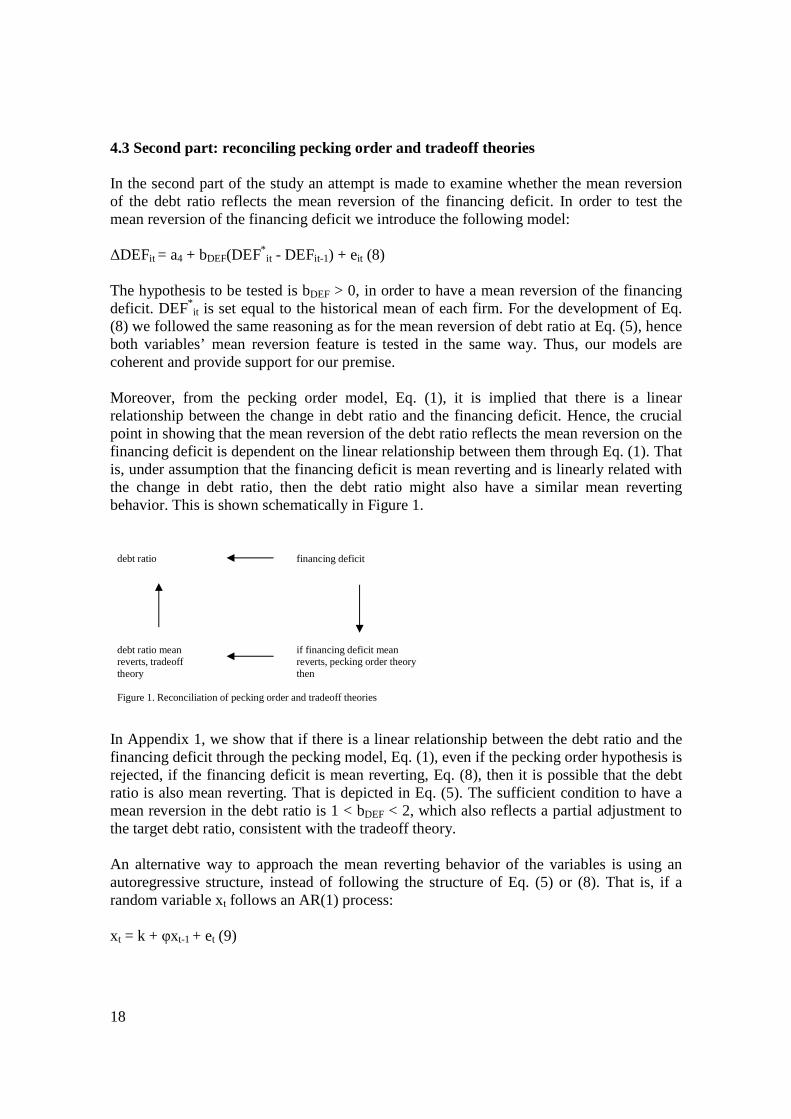
it is set equal to the historical mean of each firm. For the development of Eq. (8) we followed the same reasoning as for the mean reversion of debt ratio at Eq. (5), hence both variables’ mean reversion feature is tested in the same way. Thus, our models are coherent and provide support for our premise. Moreover, from the pecking order model, Eq. (1), it is implied that there is a linear relationship between the change in debt ratio and the financing deficit. Hence, the crucial point in showing that the mean reversion of the debt ratio reflects the mean reversion on the financing deficit is dependent on the linear relationship between them through Eq. (1). That is, under assumption that the financing deficit is mean reverting and is linearly related with the change in debt ratio, then the debt ratio might also have a similar mean reverting behavior. This is shown schematically in Figure 1.
debt ratio
financing deficit
debt ratio mean reverts, tradeoff theory
if financing deficit mean reverts, pecking order theory then
Figure 1. Reconciliation of pecking order and tradeoff theories
In Appendix 1, we show that if there is a linear relationship between the debt ratio and the financing deficit through the pecking model, Eq. (1), even if the pecking order hypothesis is rejected, if the financing deficit is mean reverting, Eq. (8), then it is possible that the debt ratio is also mean reverting. That is depicted in Eq. (5). The sufficient condition to have a mean reversion in the debt ratio is 1 < bDEF < 2, which also reflects a partial adjustment to the target debt ratio, consistent with the tradeoff theory. An alternative way to approach the mean reverting behavior of the variables is using an autoregressive structure, instead of following the structure of Eq. (5) or (8). That is, if a random variable xt follows an AR(1) process: xt = k + φxt-1 + et (9)
19
where φ and k are the parameters of the process and et is white noise with mean 0 and variance σe
2, that is WhiteNoise (0, σe2),
and │φ│ < 1, then xt is a stationary process and its feature is that it reverts to its mean. Hence, if the financing deficit, DEFit, is a stationary AR(1) process, through its linear relationship with the change in debt ratio from the pecking order model: ∆Dit = a + bPODEFit + eit (1) we are in position to postulate that also the debt ratio is an autoregressive process as well. In Appendix 2, we show that the debt ratio is an autoregressive process. In particular, we show that it is an AR(2) process. However, we do not show if it is a stationary process in order to exhibit a mean reverting behavior, since this would be far beyond the scope of this study. Hence, the debt ratio might be mean reverting, under some conditions, and reflect the mean reversion of the financing deficit. In summary, in this part of the study we examine the mean reversion of the financing deficit. Also, we show that it has a linear relationship with the change in debt ratio in the first part of the study, and under these assumptions we show that the debt ratio might also have a mean reverting behavior. The sufficient condition to have mean reversion in the debt ratio is 1 < bDEF < 2, where bDEF is the coefficient of the mean reversion of the financing deficit. Hence, through, this study it arises that we have made a very important step in order to postulate that the debt ratio’s mean reverting behavior reflects the mean reversion of the financing deficit. Thus, a reconciliation between the pecking order theory and the tradeoff theory is plausible, and both models can be seen as complementary.
20
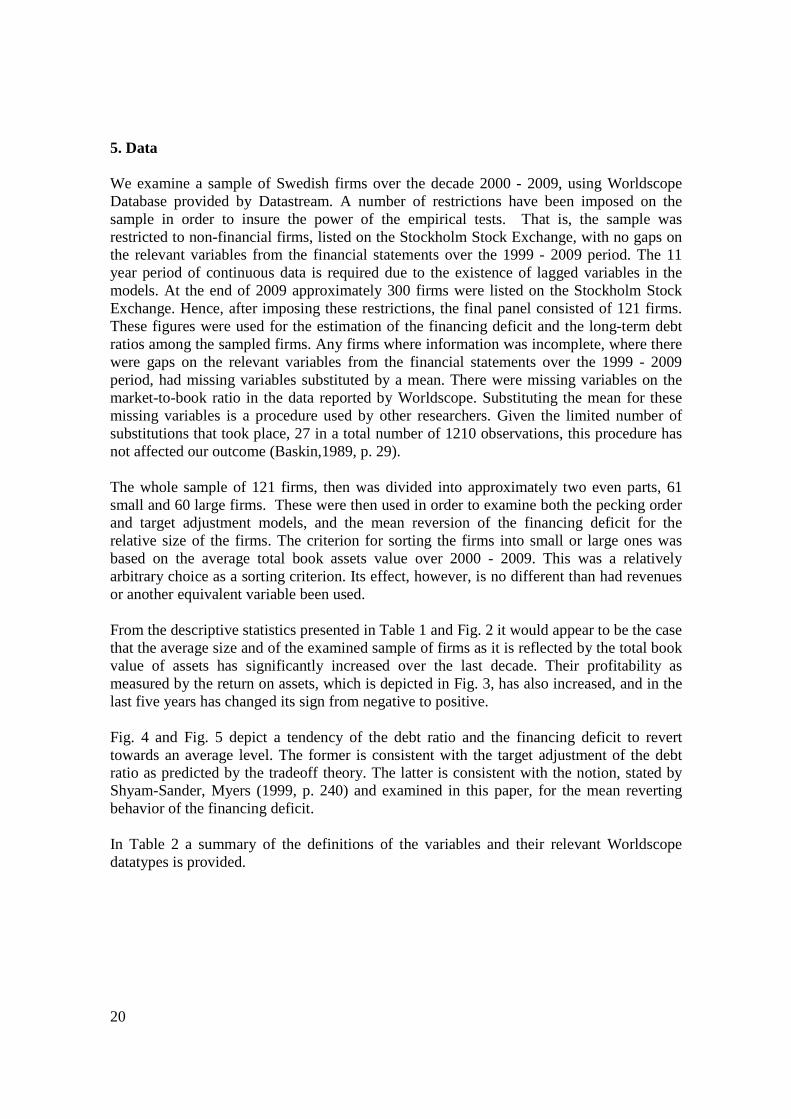
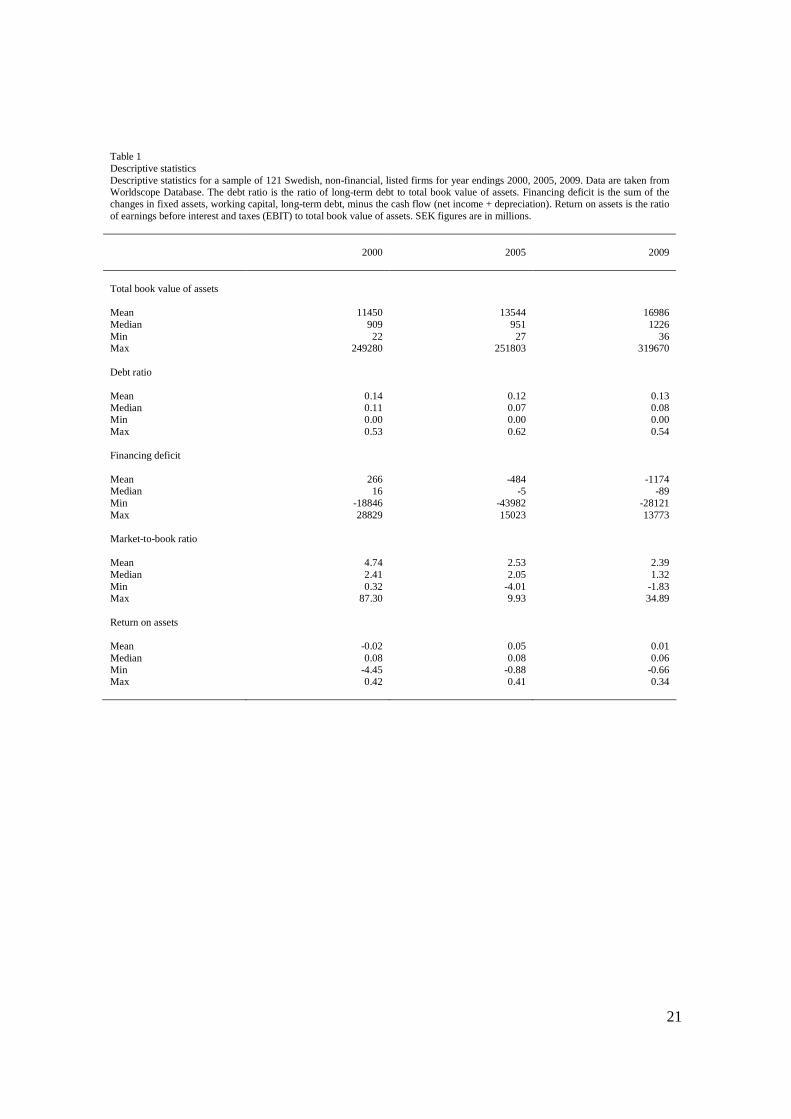
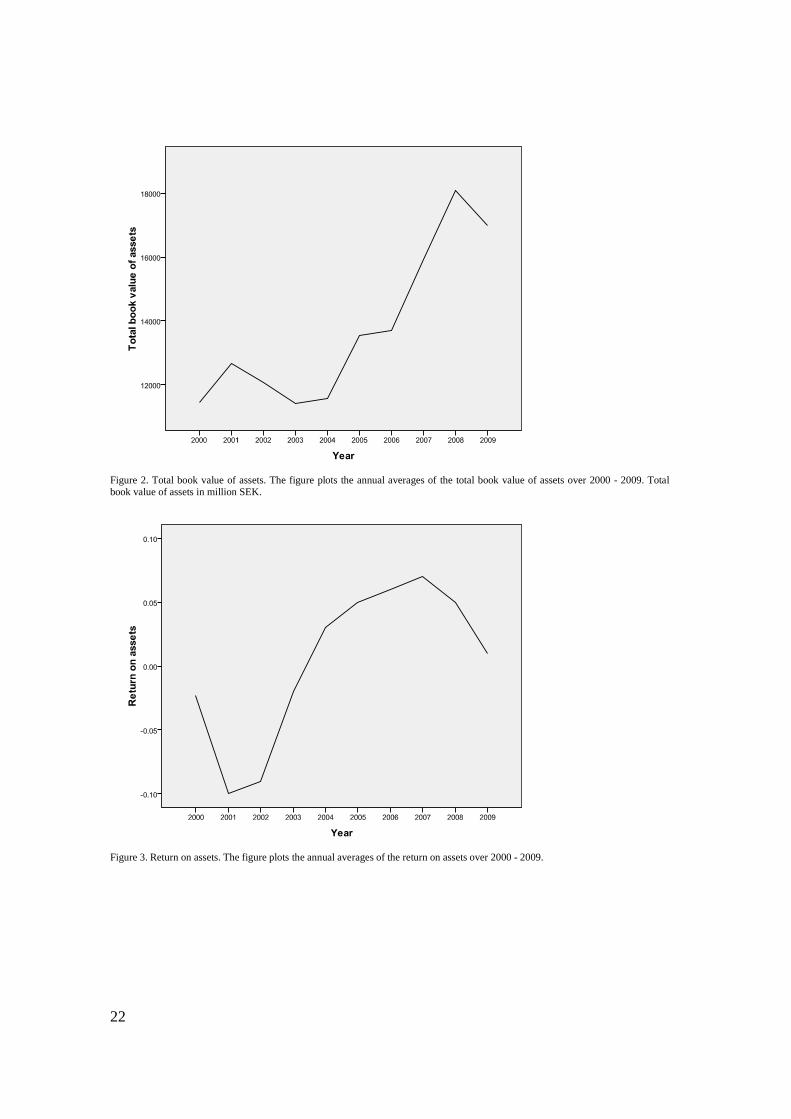
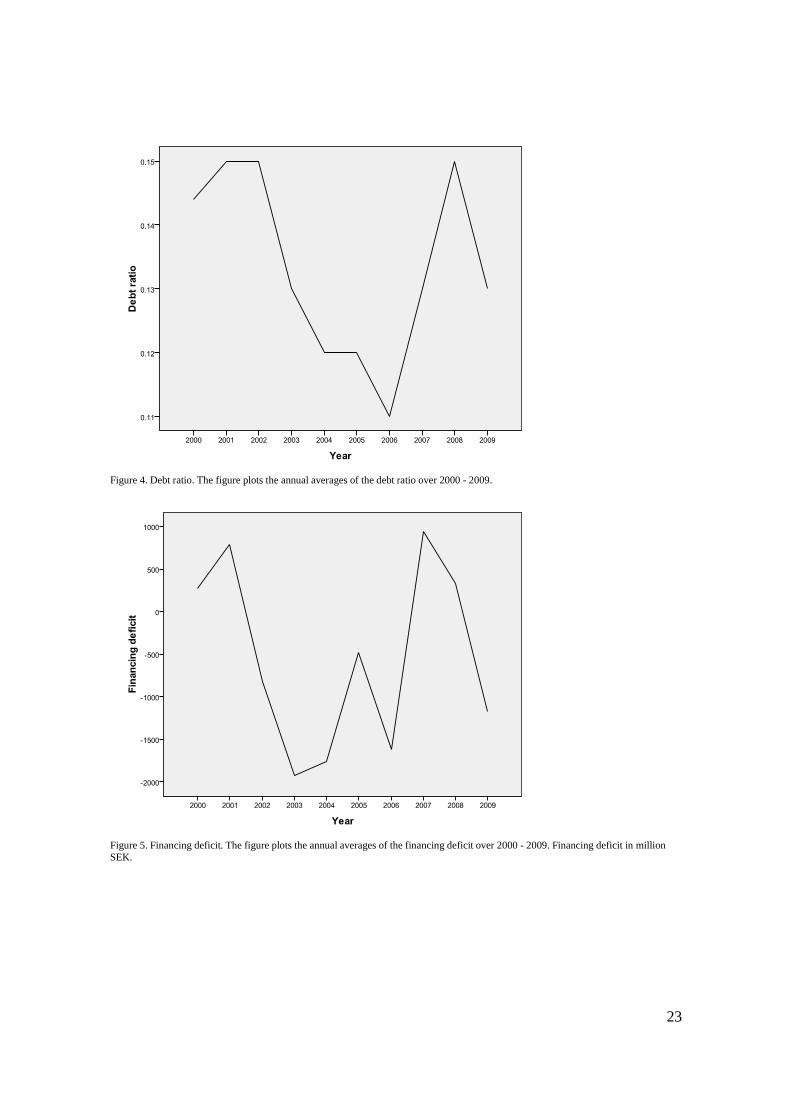
5. Data We examine a sample of Swedish firms over the decade 2000 - 2009, using Worldscope Database provided by Datastream. A number of restrictions have been imposed on the sample in order to insure the power of the empirical tests. That is, the sample was restricted to non-financial firms, listed on the Stockholm Stock Exchange, with no gaps on the relevant variables from the financial statements over the 1999 - 2009 period. The 11 year period of continuous data is required due to the existence of lagged variables in the models. At the end of 2009 approximately 300 firms were listed on the Stockholm Stock Exchange. Hence, after imposing these restrictions, the final panel consisted of 121 firms. These figures were used for the estimation of the financing deficit and the long-term debt ratios among the sampled firms. Any firms where information was incomplete, where there were gaps on the relevant variables from the financial statements over the 1999 - 2009 period, had missing variables substituted by a mean. There were missing variables on the market-to-book ratio in the data reported by Worldscope. Substituting the mean for these missing variables is a procedure used by other researchers. Given the limited number of substitutions that took place, 27 in a total number of 1210 observations, this procedure has not affected our outcome (Baskin,1989, p. 29). The whole sample of 121 firms, then was divided into approximately two even parts, 61 small and 60 large firms. These were then used in order to examine both the pecking order and target adjustment models, and the mean reversion of the financing deficit for the relative size of the firms. The criterion for sorting the firms into small or large ones was based on the average total book assets value over 2000 - 2009. This was a relatively arbitrary choice as a sorting criterion. Its effect, however, is no different than had revenues or another equivalent variable been used. From the descriptive statistics presented in Table 1 and Fig. 2 it would appear to be the case that the average size and of the examined sample of firms as it is reflected by the total book value of assets has significantly increased over the last decade. Their profitability as measured by the return on assets, which is depicted in Fig. 3, has also increased, and in the last five years has changed its sign from negative to positive. Fig. 4 and Fig. 5 depict a tendency of the debt ratio and the financing deficit to revert towards an average level. The former is consistent with the target adjustment of the debt ratio as predicted by the tradeoff theory. The latter is consistent with the notion, stated by Shyam-Sander, Myers (1999, p. 240) and examined in this paper, for the mean reverting behavior of the financing deficit. In Table 2 a summary of the definitions of the variables and their relevant Worldscope datatypes is provided.
21
Table 1 Descriptive statistics Descriptive statistics for a sample of 121 Swedish, non-financial, listed firms for year endings 2000, 2005, 2009. Data are taken from Worldscope Database. The debt ratio is the ratio of long-term debt to total book value of assets. Financing deficit is the sum of the changes in fixed assets, working capital, long-term debt, minus the cash flow (net income + depreciation). Return on assets is the ratio of earnings before interest and taxes (EBIT) to total book value of assets. SEK figures are in millions.
2000
2005
2009
Total book value of assets Mean Median Min Max
11450 909 22
249280
13544 951 27
251803
16986 1226
36 319670
Debt ratio Mean Median Min Max
0.14 0.11 0.00 0.53
0.12 0.07 0.00 0.62
0.13 0.08 0.00 0.54
Financing deficit Mean Median Min Max
266 16
-18846 28829
-484 -5
-43982 15023
-1174 -89
-28121 13773
Market-to-book ratio Mean Median Min Max
4.74 2.41 0.32
87.30
2.53 2.05
-4.01 9.93
2.39 1.32
-1.83 34.89
Return on assets Mean Median Min Max
-0.02 0.08
-4.45 0.42
0.05 0.08
-0.88 0.41
0.01 0.06
-0.66 0.34
22
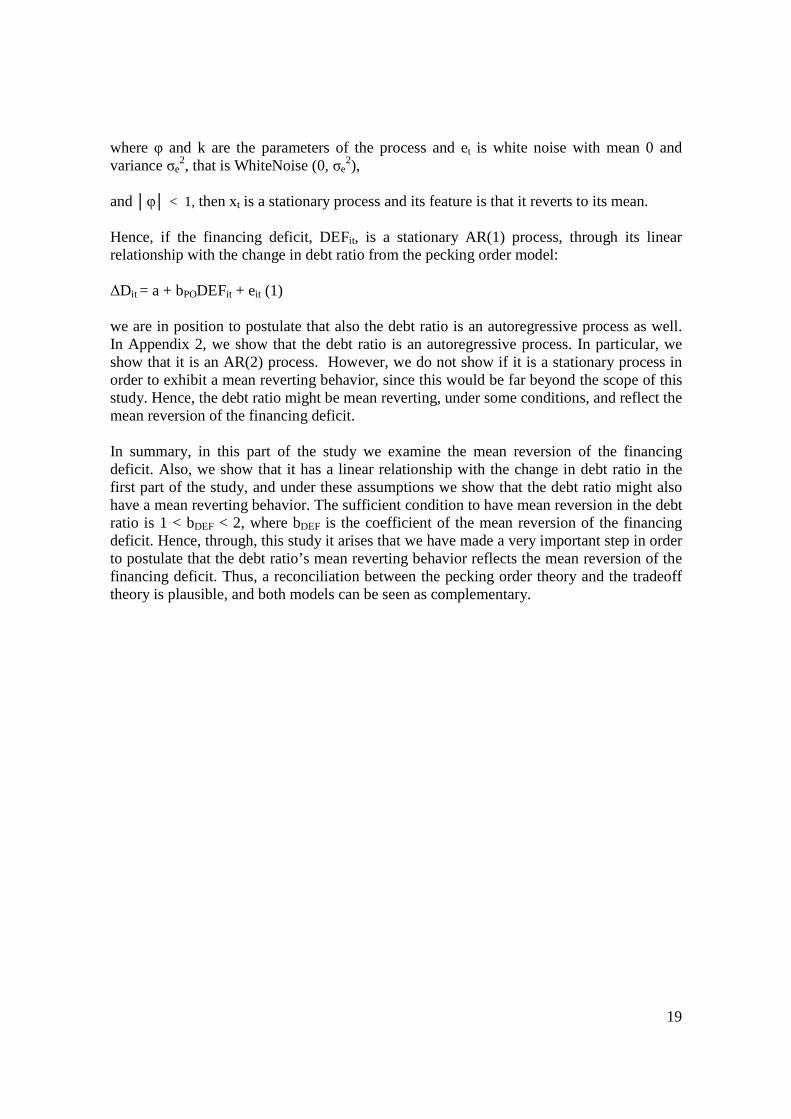
Figure 2. Total book value of assets. The figure plots the annual averages of the total book value of assets over 2000 - 2009. Total book value of assets in million SEK.
Figure 3. Return on assets. The figure plots the annual averages of the return on assets over 2000 - 2009.
23
Figure 4. Debt ratio. The figure plots the annual averages of the debt ratio over 2000 - 2009.
Figure 5. Financing deficit. The figure plots the annual averages of the financing deficit over 2000 - 2009. Financing deficit in million SEK.

24
Table 2 Definitions of variables Variable
Definition
Worldscope datatype
Long-term debt to total book value of assets ratio Fixed assets Working capital Cash flow Financing deficit Tangibility Size Profitability Growth
Long-term debt / Total assets Total assets - Current assets Current assets - Current liabilities Net income + Depreciation ∆ Fixed assets + ∆ Working capital + ∆ Long-term debt - Cash flow Property, plant and equipment / Total assets Natural logarithm of Total assets Return on assets = Earnings before interest and taxes (EBIT) / Total assets Market-to-book ratio
WC03251 / WC02999 WC02999 - WC02201 WC02201 - WC03101 WC01706 + WC01151 WC04601 / WC02999 WC18191 / WC02999 MTBV
25
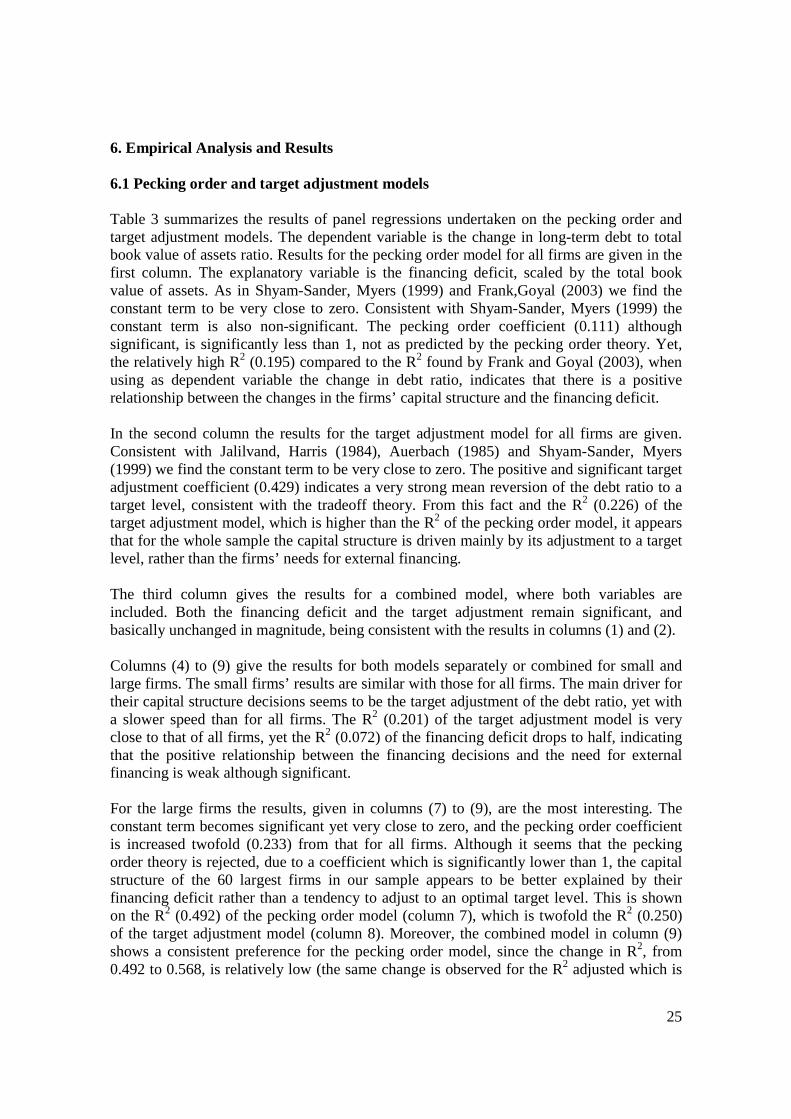
6. Empirical Analysis and Results 6.1 Pecking order and target adjustment models Table 3 summarizes the results of panel regressions undertaken on the pecking order and target adjustment models. The dependent variable is the change in long-term debt to total book value of assets ratio. Results for the pecking order model for all firms are given in the first column. The explanatory variable is the financing deficit, scaled by the total book value of assets. As in Shyam-Sander, Myers (1999) and Frank,Goyal (2003) we find the constant term to be very close to zero. Consistent with Shyam-Sander, Myers (1999) the constant term is also non-significant. The pecking order coefficient (0.111) although significant, is significantly less than 1, not as predicted by the pecking order theory. Yet, the relatively high R2 (0.195) compared to the R2 found by Frank and Goyal (2003), when using as dependent variable the change in debt ratio, indicates that there is a positive relationship between the changes in the firms’ capital structure and the financing deficit. In the second column the results for the target adjustment model for all firms are given. Consistent with Jalilvand, Harris (1984), Auerbach (1985) and Shyam-Sander, Myers (1999) we find the constant term to be very close to zero. The positive and significant target adjustment coefficient (0.429) indicates a very strong mean reversion of the debt ratio to a target level, consistent with the tradeoff theory. From this fact and the R2 (0.226) of the target adjustment model, which is higher than the R2 of the pecking order model, it appears that for the whole sample the capital structure is driven mainly by its adjustment to a target level, rather than the firms’ needs for external financing. The third column gives the results for a combined model, where both variables are included. Both the financing deficit and the target adjustment remain significant, and basically unchanged in magnitude, being consistent with the results in columns (1) and (2). Columns (4) to (9) give the results for both models separately or combined for small and large firms. The small firms’ results are similar with those for all firms. The main driver for their capital structure decisions seems to be the target adjustment of the debt ratio, yet with a slower speed than for all firms. The R2 (0.201) of the target adjustment model is very close to that of all firms, yet the R2 (0.072) of the financing deficit drops to half, indicating that the positive relationship between the financing decisions and the need for external financing is weak although significant. For the large firms the results, given in columns (7) to (9), are the most interesting. The constant term becomes significant yet very close to zero, and the pecking order coefficient is increased twofold (0.233) from that for all firms. Although it seems that the pecking order theory is rejected, due to a coefficient which is significantly lower than 1, the capital structure of the 60 largest firms in our sample appears to be better explained by their financing deficit rather than a tendency to adjust to an optimal target level. This is shown on the R2 (0.492) of the pecking order model (column 7), which is twofold the R2 (0.250) of the target adjustment model (column 8). Moreover, the combined model in column (9) shows a consistent preference for the pecking order model, since the change in R2, from 0.492 to 0.568, is relatively low (the same change is observed for the R2 adjusted which is
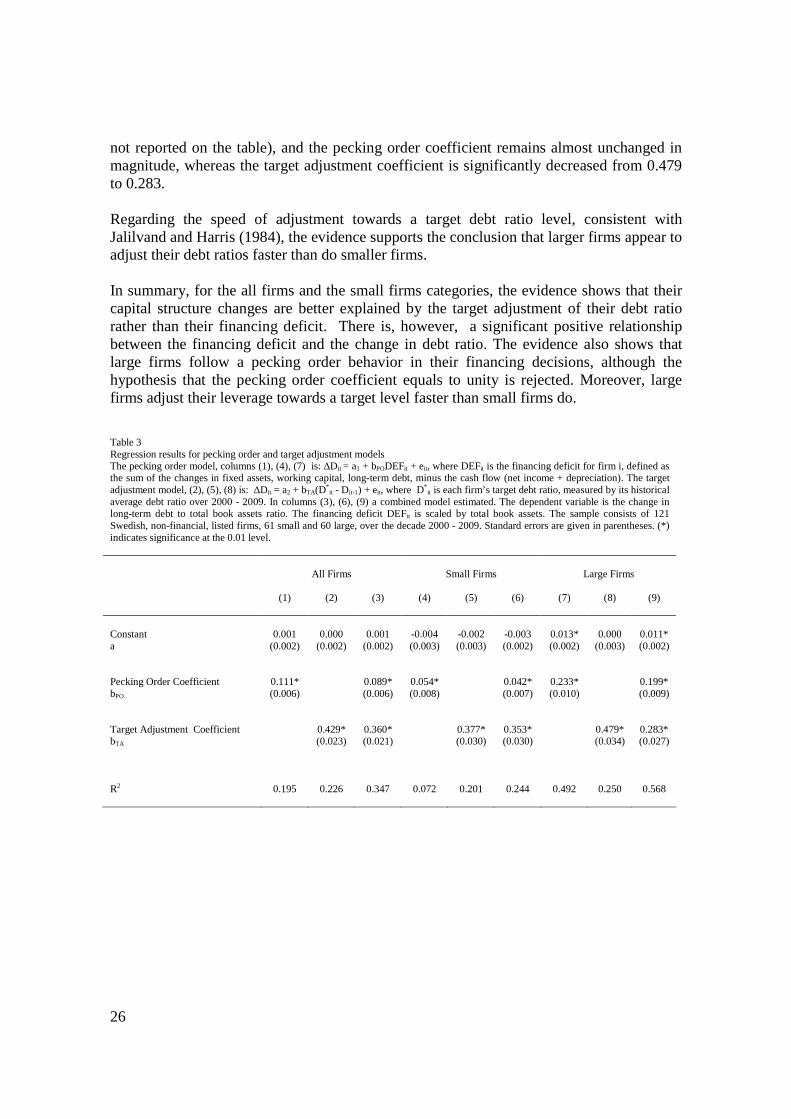
26
not reported on the table), and the pecking order coefficient remains almost unchanged in magnitude, whereas the target adjustment coefficient is significantly decreased from 0.479 to 0.283. Regarding the speed of adjustment towards a target debt ratio level, consistent with Jalilvand and Harris (1984), the evidence supports the conclusion that larger firms appear to adjust their debt ratios faster than do smaller firms. In summary, for the all firms and the small firms categories, the evidence shows that their capital structure changes are better explained by the target adjustment of their debt ratio rather than their financing deficit. There is, however, a significant positive relationship between the financing deficit and the change in debt ratio. The evidence also shows that large firms follow a pecking order behavior in their financing decisions, although the hypothesis that the pecking order coefficient equals to unity is rejected. Moreover, large firms adjust their leverage towards a target level faster than small firms do. Table 3 Regression results for pecking order and target adjustment models The pecking order model, columns (1), (4), (7) is: ∆Dit = a1 + bPODEFit + eit, where DEFit is the financing deficit for firm i, defined as the sum of the changes in fixed assets, working capital, long-term debt, minus the cash flow (net income + depreciation). The target adjustment model, (2), (5), (8) is: ∆Dit = a2 + bTA(D*
it - Dit-1) + eit, where D*it is each firm’s target debt ratio, measured by its historical
average debt ratio over 2000 - 2009. In columns (3), (6), (9) a combined model estimated. The dependent variable is the change in long-term debt to total book assets ratio. The financing deficit DEFit is scaled by total book assets. The sample consists of 121 Swedish, non-financial, listed firms, 61 small and 60 large, over the decade 2000 - 2009. Standard errors are given in parentheses. (*) indicates significance at the 0.01 level.
All Firms
Small Firms
Large Firms
(1)
(2) (3) (4) (5) (6) (7) (8) (9)
Constant a
0.001
(0.002)
0.000
(0.002)
0.001
(0.002)
-0.004 (0.003)
-0.002 (0.003)
-0.003 (0.002)
0.013* (0.002)
0.000
(0.003)
0.011* (0.002)
Pecking Order Coefficient bPO
0.111* (0.006)
0.089* (0.006)
0.054* (0.008)
0.042* (0.007)
0.233* (0.010)
0.199* (0.009)
Target Adjustment Coefficient bTA
0.429* (0.023)
0.360* (0.021)
0.377* (0.030)
0.353* (0.030)
0.479* (0.034)
0.283* (0.027)
R2
0.195
0.226
0.347
0.072
0.201
0.244
0.492
0.250
0.568
27
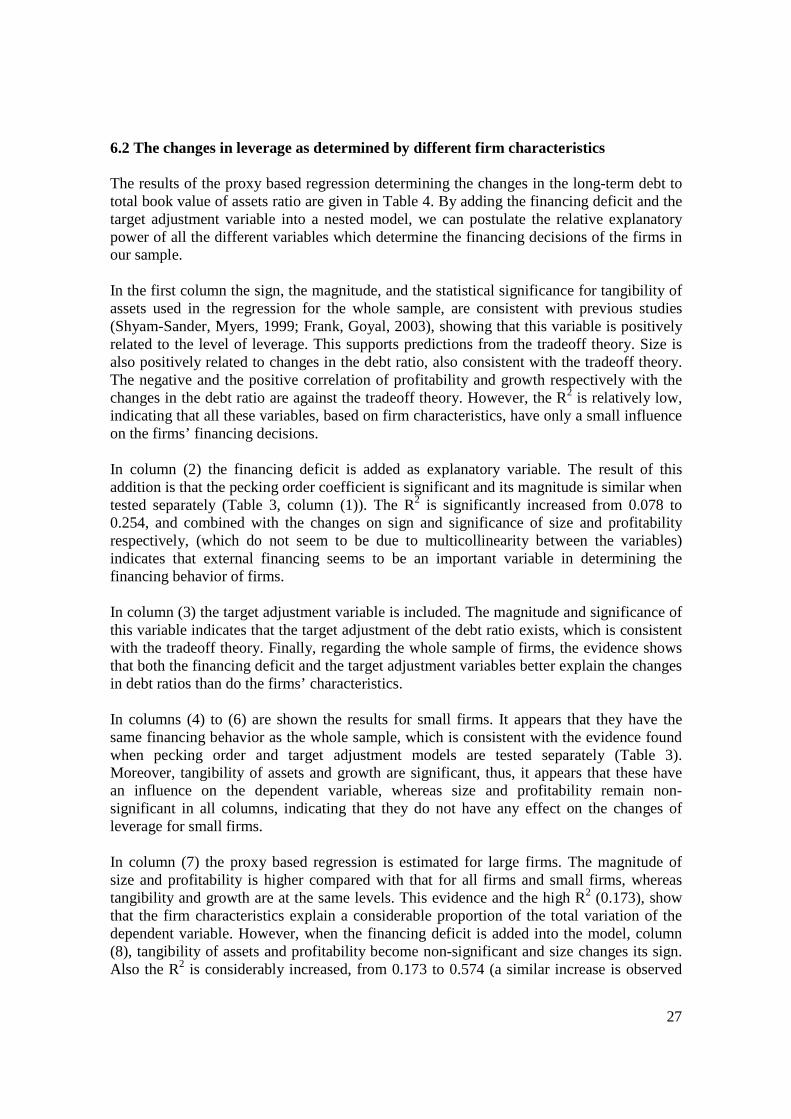
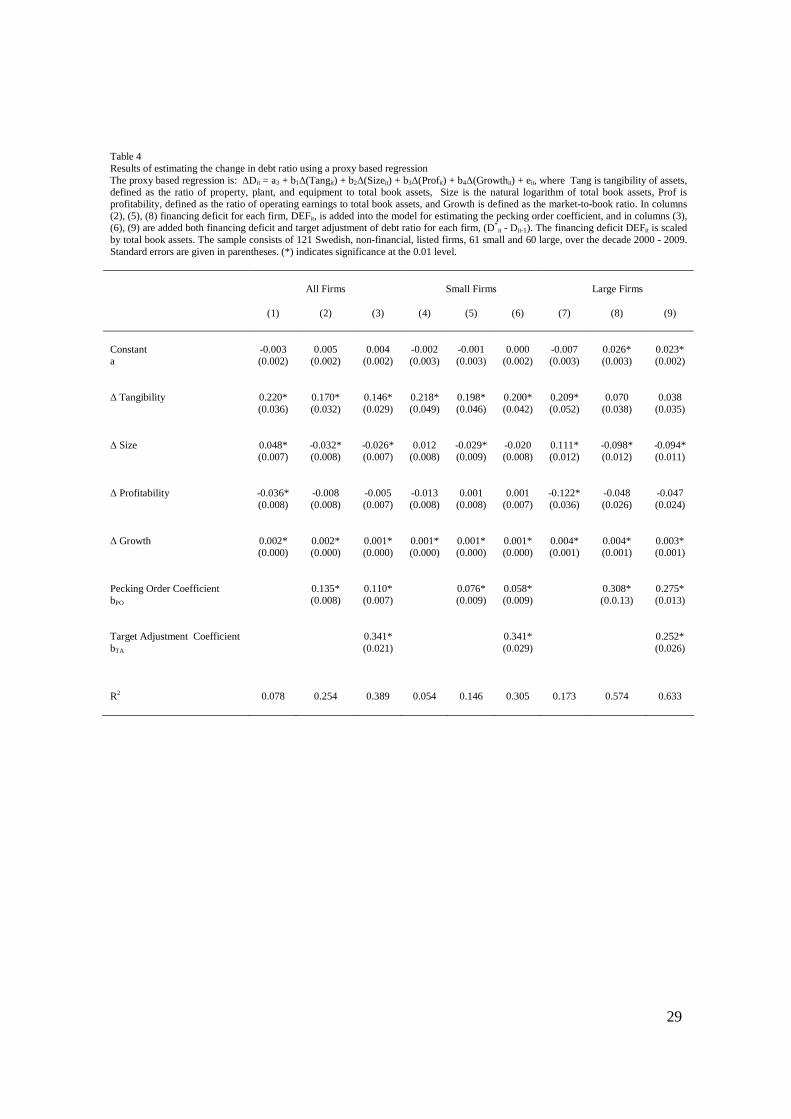
6.2 The changes in leverage as determined by different firm characteristics The results of the proxy based regression determining the changes in the long-term debt to total book value of assets ratio are given in Table 4. By adding the financing deficit and the target adjustment variable into a nested model, we can postulate the relative explanatory power of all the different variables which determine the financing decisions of the firms in our sample. In the first column the sign, the magnitude, and the statistical significance for tangibility of assets used in the regression for the whole sample, are consistent with previous studies (Shyam-Sander, Myers, 1999; Frank, Goyal, 2003), showing that this variable is positively related to the level of leverage. This supports predictions from the tradeoff theory. Size is also positively related to changes in the debt ratio, also consistent with the tradeoff theory. The negative and the positive correlation of profitability and growth respectively with the changes in the debt ratio are against the tradeoff theory. However, the R2 is relatively low, indicating that all these variables, based on firm characteristics, have only a small influence on the firms’ financing decisions. In column (2) the financing deficit is added as explanatory variable. The result of this addition is that the pecking order coefficient is significant and its magnitude is similar when tested separately (Table 3, column (1)). The R2 is significantly increased from 0.078 to 0.254, and combined with the changes on sign and significance of size and profitability respectively, (which do not seem to be due to multicollinearity between the variables) indicates that external financing seems to be an important variable in determining the financing behavior of firms. In column (3) the target adjustment variable is included. The magnitude and significance of this variable indicates that the target adjustment of the debt ratio exists, which is consistent with the tradeoff theory. Finally, regarding the whole sample of firms, the evidence shows that both the financing deficit and the target adjustment variables better explain the changes in debt ratios than do the firms’ characteristics. In columns (4) to (6) are shown the results for small firms. It appears that they have the same financing behavior as the whole sample, which is consistent with the evidence found when pecking order and target adjustment models are tested separately (Table 3). Moreover, tangibility of assets and growth are significant, thus, it appears that these have an influence on the dependent variable, whereas size and profitability remain non-significant in all columns, indicating that they do not have any effect on the changes of leverage for small firms. In column (7) the proxy based regression is estimated for large firms. The magnitude of size and profitability is higher compared with that for all firms and small firms, whereas tangibility and growth are at the same levels. This evidence and the high R2 (0.173), show that the firm characteristics explain a considerable proportion of the total variation of the dependent variable. However, when the financing deficit is added into the model, column (8), tangibility of assets and profitability become non-significant and size changes its sign. Also the R2 is considerably increased, from 0.173 to 0.574 (a similar increase is observed
28
on the adjusted R2 ), and the pecking order coefficient has a relatively high magnitude (0.308) compared to that reported on Table 3, column (7), when the financing deficit was tested separately. Moreover, when the target adjustment coefficient is included, column (9), the magnitude and significance of the financing deficit remain almost unchanged. Here the target adjustment coefficient is 0.252, the smallest in all tests. These are indicators that the financing deficit seems to be the main explanatory variable of changes in leverage for the large firms in our sample, being consistent with the evidence found previously. That is, large firms follow a pecking order in their financing decisions. While the target adjustment of the debt ratio exists its explanatory power is rather low. In summary, the evidence provided, by the proxy based regression and the nested models with all the explanatory variables included, is consistent with the evidence found when pecking order and tradeoff models were tested separately. For all firms and small firms the financing deficit and target adjustment of the debt ratio appear to be the main drivers of the firms financing decisions. Between these two variables, the target adjustment of the debt ratio adds more to an explanation of the variation of the dependent variable, providing evidence in favor of the tradeoff theory. Also tangibility of assets and size, when significant, provide evidence for the tradeoff theory. Profitability and growth, when significant, provide evidence against the tradeoff theory. Unlike for ‘all’ and ‘small firms’ where the firm characteristics rather poorly explain the dependent variable, for large firms these characteristics appear to have a relatively high explanatory power. However, again financing deficit and target adjustment of the debt ratio seem to be the main variables affecting capital structure, and the financing deficit seems to be the stronger influence, providing evidence in favor of the pecking order theory.
29
Table 4 Results of estimating the change in debt ratio using a proxy based regression The proxy based regression is: ∆Dit = a3 + b1∆(Tangit) + b2∆(Sizeit) + b3∆(Profit) + b4∆(Growthit) + eit, where Tang is tangibility of assets, defined as the ratio of property, plant, and equipment to total book assets, Size is the natural logarithm of total book assets, Prof is profitability, defined as the ratio of operating earnings to total book assets, and Growth is defined as the market-to-book ratio. In columns (2), (5), (8) financing deficit for each firm, DEFit, is added into the model for estimating the pecking order coefficient, and in columns (3), (6), (9) are added both financing deficit and target adjustment of debt ratio for each firm, (D*
it - Dit-1). The financing deficit DEFit is scaled by total book assets. The sample consists of 121 Swedish, non-financial, listed firms, 61 small and 60 large, over the decade 2000 - 2009. Standard errors are given in parentheses. (*) indicates significance at the 0.01 level.
All Firms
Small Firms
Large Firms
(1)
(2) (3) (4) (5) (6) (7) (8) (9)
Constant a
-0.003 (0.002)
0.005
(0.002)
0.004
(0.002)
-0.002 (0.003)
-0.001 (0.003)
0.000
(0.002)
-0.007 (0.003)
0.026* (0.003)
0.023* (0.002)
∆ Tangibility
0.220* (0.036)
0.170* (0.032)
0.146* (0.029)
0.218* (0.049)
0.198* (0.046)
0.200* (0.042)
0.209* (0.052)
0.070
(0.038)
0.038
(0.035)
∆ Size
0.048* (0.007)
-0.032* (0.008)
-0.026* (0.007)
0.012
(0.008)
-0.029* (0.009)
-0.020 (0.008)
0.111* (0.012)
-0.098* (0.012)
-0.094* (0.011)
∆ Profitability
-0.036* (0.008)
-0.008 (0.008)
-0.005 (0.007)
-0.013 (0.008)
0.001
(0.008)
0.001
(0.007)
-0.122* (0.036)
-0.048 (0.026)
-0.047 (0.024)
∆ Growth
0.002* (0.000)
0.002* (0.000)
0.001* (0.000)
0.001* (0.000)
0.001* (0.000)
0.001* (0.000)
0.004* (0.001)
0.004* (0.001)
0.003* (0.001)
Pecking Order Coefficient bPO
0.135* (0.008)
0.110* (0.007)
0.076* (0.009)
0.058* (0.009)
0.308* (0.0.13)
0.275* (0.013)
Target Adjustment Coefficient bTA
0.341* (0.021)
0.341* (0.029)
0.252* (0.026)
R2
0.078
0.254
0.389
0.054
0.146
0.305
0.173
0.574
0.633
30
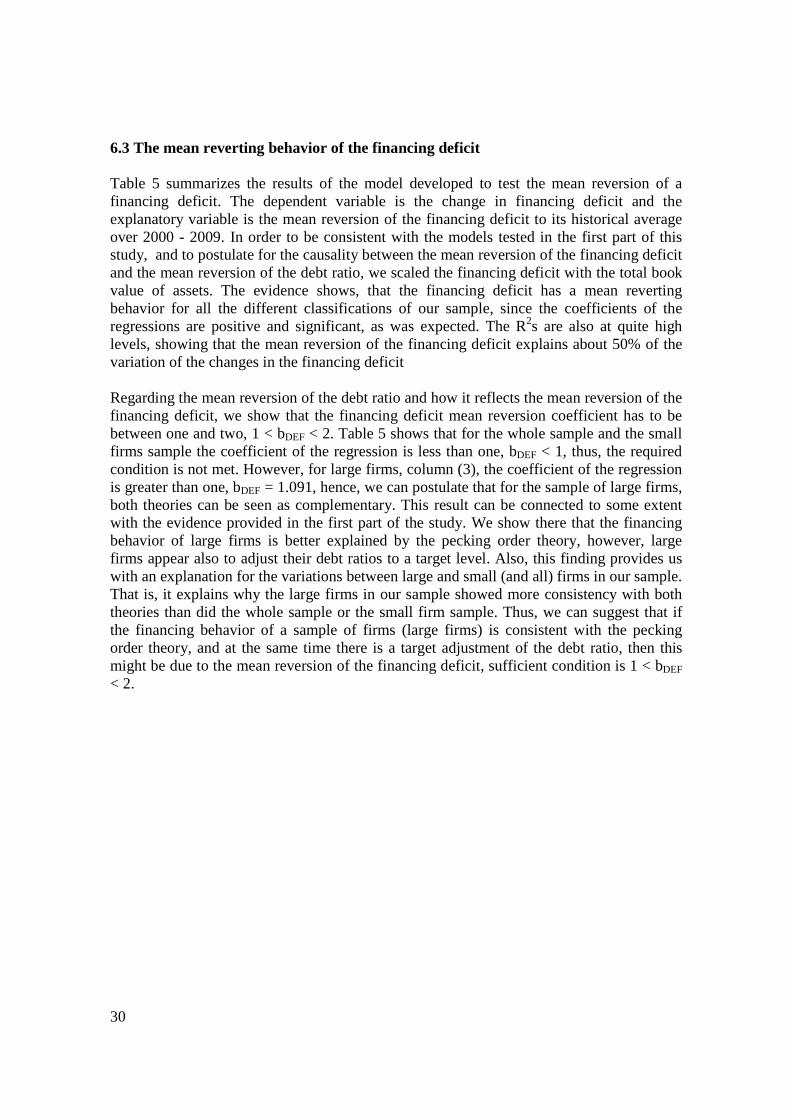
6.3 The mean reverting behavior of the financing deficit Table 5 summarizes the results of the model developed to test the mean reversion of a financing deficit. The dependent variable is the change in financing deficit and the explanatory variable is the mean reversion of the financing deficit to its historical average over 2000 - 2009. In order to be consistent with the models tested in the first part of this study, and to postulate for the causality between the mean reversion of the financing deficit and the mean reversion of the debt ratio, we scaled the financing deficit with the total book value of assets. The evidence shows, that the financing deficit has a mean reverting behavior for all the different classifications of our sample, since the coefficients of the regressions are positive and significant, as was expected. The R2s are also at quite high levels, showing that the mean reversion of the financing deficit explains about 50% of the variation of the changes in the financing deficit Regarding the mean reversion of the debt ratio and how it reflects the mean reversion of the financing deficit, we show that the financing deficit mean reversion coefficient has to be between one and two, 1 < bDEF < 2. Table 5 shows that for the whole sample and the small firms sample the coefficient of the regression is less than one, bDEF < 1, thus, the required condition is not met. However, for large firms, column (3), the coefficient of the regression is greater than one, bDEF = 1.091, hence, we can postulate that for the sample of large firms, both theories can be seen as complementary. This result can be connected to some extent with the evidence provided in the first part of the study. We show there that the financing behavior of large firms is better explained by the pecking order theory, however, large firms appear also to adjust their debt ratios to a target level. Also, this finding provides us with an explanation for the variations between large and small (and all) firms in our sample. That is, it explains why the large firms in our sample showed more consistency with both theories than did the whole sample or the small firm sample. Thus, we can suggest that if the financing behavior of a sample of firms (large firms) is consistent with the pecking order theory, and at the same time there is a target adjustment of the debt ratio, then this might be due to the mean reversion of the financing deficit, sufficient condition is 1 < bDEF < 2.
31
Table 5 Results of estimating the financing deficit mean reversion model The mean reversion of the financing deficit is tested using the model: ∆DEFit = a4 + bDEF(DEF*
it - DEFit-1) + eit, where DEF* it is set equal to each firm’s historical average of financing deficit over 2000 - 2009. The financing deficit for firm i, DEFit, is defined as the sum of the changes in fixed assets, working capital, long-term debt, minus the cash flow (net income + depreciation), and is scaled by total book assets. The sample consists of 121 Swedish, non-financial, listed firms, 61 small and 60 large, over the decade 2000 - 2009. Standard errors are given in parentheses. (*) indicates significance at the 0.01 level.
All Firms
Small Firms
Large Firms
(1)
(2) (3)
Constant a
0.000
(0.008)
-0.002 (0.012)
0.001
(0.009)
Financing deficit mean reversion coefficient bDEF
0.961* (0.028)
0.893* (0.039)
1.091* (0.041)
R2
0.494
0.467
0.547
32
7. Conclusions and Further Research This study examines the capital structure of 121 Swedish non-financial, listed firms over the period 2000 - 2009. It provides empirical evidence related to the predictions of the tradeoff and the pecking order theories, and develops a methodological approach which reveals more insight on an emerging field of the capital structure theory, where the existing theories are not mutually exclusive. In the first part of the study a pecking order model and two tradeoff models are tested either separately or jointly. The evidence shows that both theories can explain the financing decisions of our sample. The financing deficit and target adjustment of the debt ratio appear to be the main determinants for the capital structure, whereas, the tested firm characteristics, which are used as proxies for the predictions of both theories, do not seem to have a high explanatory power. Our empirical results show for the whole sample and the small firms a strong preference for a financing behavior consistent with the tradeoff theory. On the other hand, the large firms appear to follow a pecking order on their financing decisions. However, a target adjustment to a target debt ratio is observed, and appears to be faster than for small firms. In the second part of the study we show that under assumption the financing deficit has a mean reverting behavior, and is linearly related with the changes on the debt ratio, there is a sufficient condition under which the debt ratio might also have a mean reverting behavior. If this condition is satisfied, both theories can be seen as “reconciled”, since both theories’ predictions exist at the same time. Moreover, we empirically test the mean reversion of the financing deficit. The results show that for all the different classifications of our sample, the financing deficit shows a strong mean reversion. The sufficient condition for having a “reconciliation” between both theories is not satisfied for the whole sample and the small firms, however, is satisfied for the large firms, providing an explanation on why the large firms of our sample had financing behavior consistent to a greater extent with both theories than the whole sample and the small firms had. Regarding the Swedish firms, further research would give the ground for a better understanding on their capital structure and its determining variables. With respect to the mean reversion of the financing deficit, further research would explain under what conditions is mean reverting, what causes this mean reversion, and what the strength of this mean reversion depends on, which is ultimately connected with the sufficient conditions on showing that the pecking order and tradeoff theories can be “reconciled”.
33
8. List of References Books Bryman, A., Bell, E. (2007). Business research Methods 2nd edition, Oxford University Press, New York Articles Auerbach, A.J. (1985). Real determinants of corporate leverage. In: Friedman, B.J. (Ed.), Corporate Capital Structures in the United States, University of Chicago Press, Chicago. Bagley, N.C., Ghosh, K.D., Yaari, U. (1998). Pecking order as a dynamic leverage theory, European Journal of Finance, 4: 157-183. Baker, M., Wurgler, J. (2002). Market timing and capital structure, Journal of Finance, 57: 1-32. Baskin, J. (1989). An empirical investigation of the pecking order hypothesis, Journal of Financial Management and Analysis, 18: 26-35. Bradley, M., Jarrell, A.G., Kim, E.H. (1984). On the existence of an optimal capital structure: theory and evidence, Journal of Finance, 39: 857-878. Chirinko, S.R., Singha, R.A. (2000). Testing static tradeoff against pecking order models of capital structure: a critical comment, Journal of Financial Economics, 58: 417-425. DeAngelo, H., Masulis, W.R. (1980). Optimal capital structure under corporate and personal taxation, Journal of Financial Economics, 8: 3-29. Donaldson, G. (1961). Corporate Debt Capacity: A Study of Corporate Debt Policy and the Determination Of Corporate Debt Capacity, Harvard Business School, Division of Research, Harvard University. Fama, E., French, K.R. (2002). Testing tradeoff and pecking order predictions about dividends and debt, Review of Financial Studies, 15: 1-33. Farhat, J., Cotei, C., Abugri, B. (May 14, 2009). The pecking order hypothesis vs. the static tradeoff theory under different institutional environments, Available at SSRN: http://ssrn.com/id1404596.pdf Fischer, O.E., Heinkel, R., Zechner, J. (1989). Dynamic capital structure choice: theory and tests, Journal of Finance, 44: 19-40. Flannery, M. J., Rangan, K. P. (2006). Partial adjustment toward target capital structures, Journal of Financial Economics, 79: 469-506.

34
Frank, M., Goyal, V. (2003). Testing the pecking order theory of capital structure, Journal of Financial Economics, 67: 217-248. Harris, M., Raviv, A. (1991). The theory of capital structure, Journal of Finance, 46: 297-356. Hennessy, C.A., Whited, T. (2005). Debt dynamics, Journal of Finance, 60: 1129-1165. Hovakimian, A., Opler, T., Titman, S. (2001). The debt-equity choice, Journal of financial and Quantitative Analysis, 36, 1: 1-24. Hovakimian, A., Opler, T., Titman, S. (2002). The capital structure choice: new evidence for a dynamic tradeoff model, Journal of Applied Corporate Finance, 15: 24-30. Jalilvand, A., Harris, R.S. (1984). Corporate behavior in adjusting to capital structure and dividend targets: an econometric study, Journal of Finance, 39: 127-145. Jensen, C. M., Meckling, W. (1976). Theory of the firm: managerial behavior, agency costs and capital structure, Journal of Financial Economics, 3: 11-25. Jensen, C. M. (1986). Agency Costs of Free Cash Flow, Corporate Finance, and Takeovers, American Economic Review, 76: 323-329. Kayhan, A., Titman, S. (2007). Firms’ histories and their capital structures, Journal of Financial Economics, 83: 1-32. Kraus, A., Litzenberger, H.R. (1973). A state-preference model of optimal financial leverage, Journal of Finance, 28: 911-922. Krouse, G.C. (1972). Optimal financing and capital structure programs for the firm, Journal of Finance, 27: 1057-1071. Leland, E.H., Pyle, H.D. (1977). Informational Asymmetries, Financial Structure, and Financial Intermediation, Journal of Finance, 32: 371-387. López-Gracia, J., Sogorb-Mira, F. (2008). Testing trade-off and pecking order theories financing SMEs, Small Business Economics, 31: 117-1368. Marsh, P. (1982). The choice between equity and debt: an empirical study, Journal of Finance, 37: 121-144. Masulis, R. (1980). The Effects of capital structure change on security prices: a study of exchange offers, Journal of Financial Economics, 8: 139-177. Masulis, R. (1983). The impact of capital structure change on firm value, Journal of Finance, 38: 107-126.

35
Masulis, R., and A. Korwar. (1986). Seasoned Equity Offerings: An Empirical Investigation, Joumal of Financial Economics, 15: 91-118. Miller, M.H. (1977). Debt and taxes, Journal of Finance, 32: 261-275. Modigliani, F., Miller, M.H. (1958). The cost of capital, corporate finance and the theory of investment, American Economic Review, 48, 3: 261-297. Modigliani, F., Miller, M.H. (1961). Dividend policy, growth, and the valuation of shares, Journal of Business, 34, 4: 411-433. Myers, S.C. (1977). Determinants of corporate borrowing, Journal of Financial Economics, 5: 147-175. Myers, S.C. (1984). The capital structure puzzle, Journal of Finance, 39: 575-592. Myers, S.C., Majluf, N.S. (1984). Corporate financing and investment decisions when firms have information that investors do not have, Journal of Financial Economics, 13: 187-221. Myers, S.C. (2001). Capital structure, Journal of Economic Perspectives, 15: 81-102. Ni, J., Yu, M. (2008) Testing the pecking order theory evidence from chinese listed companies, Chinese Economy, 41: 97-113. Rajan, R.G., Zingales, L. (1995). What do we know about capital structure? Some evidence from international data, Journal of Finance, 50: 1421-1460. Robichek, A.A., Myers, S.C. (1966). Problems In The Theory Of Optimal Capital Structure, Journal of Financial and Quantitative Analysis, 1:1-35. Ross, S. (1977). The determination of financial structure: the incentive signaling approach, Bell Journal of Economics, 8: 23-40. Shyam-Sunder, L., Myers, S.C. (1999). Testing static tradeoff against pecking order models of capital structure, Journal of Financial Economics, 51: 219-244. Scott, H.J. (1976). A theory of optimal capital structure, Bell Journal of Economics, 7: 33-54. Taggart, R.A. (1977). A model of corporate financing decisions, Journal of Finance, 32: 1467-1484. Titman, S., Wessels, R. (1988). The determinants of capital structure choice, Journal of Finance, 43: 1-19. Thorsell, A., Cornelius, B. (2009). Coercion, copy-coats, and colleagues: staffing the board of the IPO company, Corporate ownership and control, 7: 108-119.

36
Appendices Appendix 1 - Reconciling pecking order and tradeoff theories: first approach The pecking order model implies the linear relationship between the change in debt ratio and the financing deficit. ∆Dit = α + βDEFit + eit (1) or ∆Dit-1 = α + βDEFit-1 + eit-1 or DEFit-1 = (∆Dit-1 - α - eit-1) / β (2) From the mean reversion of the financing deficit we have the following equation where we require that δ > 0 in order to have mean reversion. ∆DEFit = γ + δ(DEF*
it - DEFit-1) + zit (3) or DEFit - DEFit-1 = γ + δ(DEF*
it - DEFit-1) + zit or DEFit = γ + δDEF*
it + DEFit-1 - δDEFit-1 + zit or DEFit = γ + δDEF*
it + (1 - δ)DEFit-1 + zit and by substituting DEFit-1 from Eq. (2) we have DEFit = γ + δDEF*
it + (1 - δ)[(∆Dit-1 - α - eit-1) / β] + zit (4) Hence, we substitute DEFit from Eq. (4) into Eq. (1) and we have ∆Dit = α + β{ γ + δDEF*
it + (1 - δ)[(∆Dit-1 - α - eit-1) / β] + zit} + eit or ∆Dit = α + βγ + βδDEF*
it + β(1 - δ)[(∆Dit-1 - α - eit-1) / β] + βzit} + eit or ∆Dit = α + βγ + βδDEF*
it + (1 - δ)∆Dit-1 - (1 - δ)α - (1 - δ)eit-1 + βzit + eit or ∆Dit = α - (1 - δ)α + βγ + βδDEF*
it + (1 - δ)∆Dit-1 + βzit + eit - (1 - δ)eit-1 or ∆Dit = α´ + (1 - δ)∆Dit-1 + e it (5) and from Eq. (5) Dit - Dit-1 = α´ + (1 - δ)(Dit-1 - Dit-2) + e it or Dit = α´ + Dit-1 + (1 - δ)Dit-1 - (1 - δ)Dit-2 + e it or Dit = α´ + (2 - δ)Dit-1 - (1 - δ)Dit-2 + e it (6)
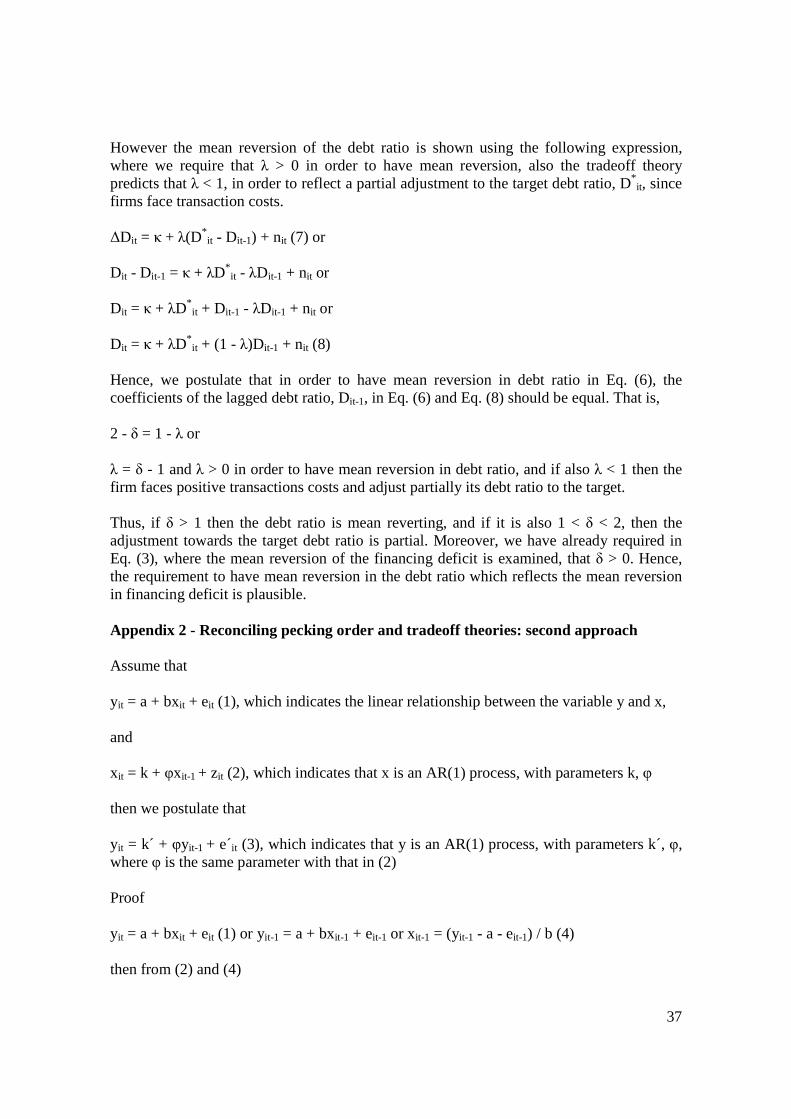
37
However the mean reversion of the debt ratio is shown using the following expression, where we require that λ > 0 in order to have mean reversion, also the tradeoff theory predicts that λ < 1, in order to reflect a partial adjustment to the target debt ratio, D* it, since firms face transaction costs. ∆Dit = κ + λ(D*
it - Dit-1) + nit (7) or Dit - Dit-1 = κ + λD*
it - λDit-1 + nit or Dit = κ + λD*
it + Dit-1 - λDit-1 + nit or Dit = κ + λD*
it + (1 - λ)Dit-1 + nit (8) Hence, we postulate that in order to have mean reversion in debt ratio in Eq. (6), the coefficients of the lagged debt ratio, Dit-1, in Eq. (6) and Eq. (8) should be equal. That is, 2 - δ = 1 - λ or λ = δ - 1 and λ > 0 in order to have mean reversion in debt ratio, and if also λ < 1 then the firm faces positive transactions costs and adjust partially its debt ratio to the target. Thus, if δ > 1 then the debt ratio is mean reverting, and if it is also 1 < δ < 2, then the adjustment towards the target debt ratio is partial. Moreover, we have already required in Eq. (3), where the mean reversion of the financing deficit is examined, that δ > 0. Hence, the requirement to have mean reversion in the debt ratio which reflects the mean reversion in financing deficit is plausible. Appendix 2 - Reconciling pecking order and tradeoff theories: second approach Assume that yit = a + bxit + eit (1), which indicates the linear relationship between the variable y and x, and xit = k + φxit-1 + zit (2), which indicates that x is an AR(1) process, with parameters k, φ then we postulate that yit = k´ + φyit-1 + e it (3), which indicates that y is an AR(1) process, with parameters k´, φ, where φ is the same parameter with that in (2) Proof yit = a + bxit + eit (1) or yit-1 = a + bxit-1 + eit-1 or xit-1 = (yit-1 - a - eit-1) / b (4) then from (2) and (4)

38
xit = k + φ(yit-1 - a - eit-1) / b + zit (5) from (1) and (5) yit = a + b[k + φ(yit-1 - a - eit-1) / b + zit] + eit = a + bk + [bφ(yit-1 - a - eit-1)] / b] + bzit + eit = a + bk + φ(yit-1 - a - eit-1) + bzit + eit = a + bk - φa + φyit-1 + bzit + eit - φeit-1 then if we simplify by substituting: a + bk - φa with k´, and bzit + eit - φeit-1 with e it we have yit = k´ + φyit-1 + e it (3) Then if in (1), (2), and (3) we substitue yit with ∆Dit, and xit with DEFit we have ∆Dit = a + bDEFit + eit (1), which is the pecking order model, and b is the pecking order coefficient DEFit = k + φDEFit-1 + zit (2), which shows that the financing deficit, DEFit, is an AR(1) and ∆Dit = k´ + φ∆Dit-1 + e it (3), which shows that the change in debt ratio is an AR(1) process However, we are interested in the mean reversion of the debt ratio and not in its first difference, hence from (3) we have ∆Dit = k´ + φ∆Dit-1 + e it or Dit - Dit-1 = k´ + φDit-1 - φDit-2 + e it or Dit = k´ + (1 + φ)Dit-1 - φDit-2 + e it (4) which is an AR(2) process, and an AR(2) process can be stationary, thus, it shows a mean reversion for some specific conditions of its parameters.
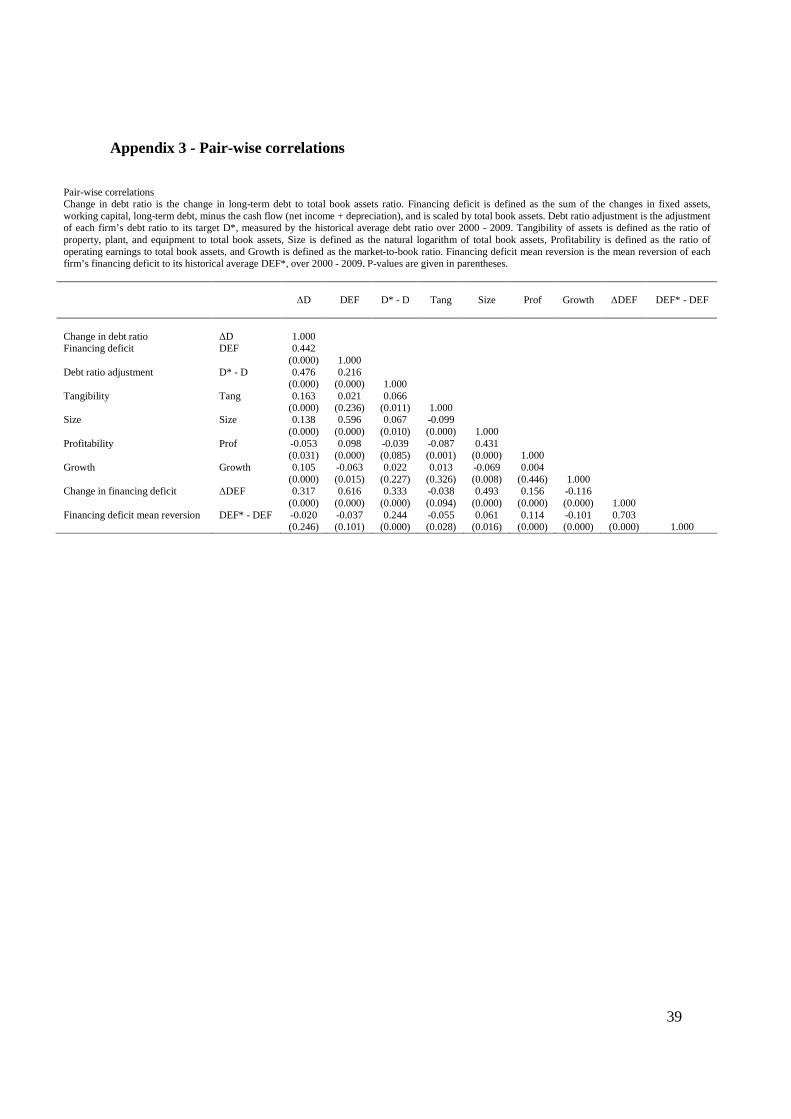
39
Appendix 3 - Pair-wise correlations
Pair-wise correlations Change in debt ratio is the change in long-term debt to total book assets ratio. Financing deficit is defined as the sum of the changes in fixed assets, working capital, long-term debt, minus the cash flow (net income + depreciation), and is scaled by total book assets. Debt ratio adjustment is the adjustment of each firm’s debt ratio to its target D*, measured by the historical average debt ratio over 2000 - 2009. Tangibility of assets is defined as the ratio of property, plant, and equipment to total book assets, Size is defined as the natural logarithm of total book assets, Profitability is defined as the ratio of operating earnings to total book assets, and Growth is defined as the market-to-book ratio. Financing deficit mean reversion is the mean reversion of each firm’s financing deficit to its historical average DEF*, over 2000 - 2009. P-values are given in parentheses.
∆D
DEF
D* - D
Tang
Size
Prof
Growth
∆DEF
DEF* - DEF
Change in debt ratio
∆D
1.000
Financing deficit
DEF 0.442 (0.000)
1.000
Debt ratio adjustment D* - D 0.476 (0.000)
0.216 (0.000)
1.000
Tangibility
Tang 0.163 (0.000)
0.021 (0.236)
0.066 (0.011)
1.000
Size
Size 0.138 (0.000)
0.596 (0.000)
0.067 (0.010)
-0.099 (0.000)
1.000
Profitability
Prof -0.053 (0.031)
0.098 (0.000)
-0.039 (0.085)
-0.087 (0.001)
0.431 (0.000)
1.000
Growth
Growth 0.105 (0.000)
-0.063 (0.015)
0.022 (0.227)
0.013 (0.326)
-0.069 (0.008)
0.004 (0.446)
1.000
Change in financing deficit
∆DEF 0.317 (0.000)
0.616 (0.000)
0.333 (0.000)
-0.038 (0.094)
0.493 (0.000)
0.156 (0.000)
-0.116 (0.000)
1.000
Financing deficit mean reversion
DEF* - DEF -0.020 (0.246)
-0.037 (0.101)
0.244 (0.000)
-0.055 (0.028)
0.061 (0.016)
0.114 (0.000)
-0.101 (0.000)
0.703 (0.000)
1.000

40
Appendix 4 - Sample of firms The sample of firms in alphabetical order A number of restrictions have been imposed on the sample in order to insure the power of the empirical tests. The sample should consist of non-financial firms, listed on the Stockholm Stock Exchange, with no gaps on the relevant variables from the financial statements over the 1999 - 2009 period.
Firm Worldscope code
Firm
Worldscope code
1 AB GEVEKO GEBF 32 ELANDERS AB ELNF 2 AB VOLVO VOBF 33 ELECTROLUX AB SE@G 3 ACANDO AB ACAN 34 ELEKTA AB ELKB 4
ACTIVE BIOTECH AB
ACTI
35
ELEKTRONIKGRUPPEN BK
BKEK
5 ADDNODE AB ANOD 36 ELOS AB ELOS 6 AF AB AFB 37 ENEA AB ENBF 7 ASSA ABLOY AB ASSB 38 FAGERHULT AB FAG 8 ATLAS COPCO AB SR@G 39 FEELGOOD SVENSKA AB FEEL 9 AXFOOD AB AXFO 40 FENIX OUTDOOR AB FJBF 10 B&B TOOLS AB BBTO 41 G & L BEIJER AB SKTF 11 BEIJER ALMA AB ALMI 42 GETINGE AB GIND 12 BEIJER ELECTRONICS BELE 43 GUNNEBO AB GUNN 13 BERGS TIMBER AB BRGB 44 HALDEX AB HAL 14 BETSSON AB BETS 45 HENNES & MAURITZ AB HMBF 15 BILIA AB BILI 46 HEXAGON AB EKBF 16 BIOGAIA AB BIGB 47 HIQ INTERNATIONAL AB HIQ 17 BIOLIN SCIENTIFIC AB BLIN 48 HL DISPLAY AB HL 18 BIOPHAUSIA AB BIOP 49 HOGANAS AB HOGB 19 BIOTAGE AB BIOT 50 HOLMEN AB SM@G 20 BONG LJUNGDAHL AB BGFB 51 IBS AB IB 21 BORAS WAFVERI AB WAFV 52 IGE RESOURCES IGE 22 BRIO AB BRBF 53 IND & FIN SYSTEMS IFSB 23 CARDO AB CARD 54 INTELLECTA AB ICTA 24 CISION AB CNS 55 INTOI AB INTO 25 CONCORDIA MARITIME CNBF 56 JEEVES INFORMATION JEEV 26 CONSILIUM AB CONB 57 JLT MOBILE COMPUTERS JLT 27 CTT SYSTEMS AB CTT 58 JM AB JMBF 28 CYBERCOM GROUP CYBB 59 KABE HUSVAGNAR AB KBHF 29 DIGITAL VISION AB DVSW 60 KARO BIO AB KABB 30 DORO AB DORO 61 KNOW IT AB KNOW 31 DUROC AB DROC 62 LABS2 GROUP AB LABS

41
Firm
Worldscope code
Firm
Worldscope code
63 LAMMHULTS LAMM 94 REDERI AB TRANS RABT 64 LM ERICSSON TELE SL@G 95 RORVIK TIMBER AB JABO 65
MALMBERGS ELEKTRISKA
MEAB
96
ROTTNEROS AB
RNBF
66 MEDA AB MEDA 97 SAAB AB SAAB 67 MEDIVIR AB MDVB 98 SANDVIK AB SAND 68 MICRONIC LASER SYSTE MIC 99 SCANIA AB SCVB 69 MIDELFART SONESSON MSOB 100 SCRIBONA AB SCBF 70 MOBYSON AB MOBY 101 SECO TOOLS AB SOBF 71 MODERN TIMES GRP MTG MOTA 102 SECTRA AB SETB 72 MODUL 1 DATA AB MODU 103 SECURITAS AB SUBF 73 MSC KONSULT AB MSCB 104 SEMCON AB SEMC 74 MUNTERS AB MNTR 105 SINTERCAST AB SINA 75 NET INSIGHT AB NETB 106 SKANSKA AB SKBF 76 NEW WAVE GROUP AB NEWB 107 SKF AB SKFB 77 NIBE INDUSTRIER AB NIBE 108 SKISTAR AB SKIS 78 NOLATO AB NA 109 SOFTRONIC AB SOFB 79 NOVOTEK AB NOV 110 SSAB SVENSKT STAL AB SSAA 80 OEM-INTERNATIONAL AB OEAC 111 SVEDBERGS I DALSTORP SVEB 81 OPCON AB OPCO 112 SVENSKA CELLULOSA AB SW@G 82 ORC SOFTWARE AB ORC 113 SWECO AB SWEB 83 ORTIVUS AB ORTB 114 SWEDISH MATCH AB SWMA 84 PARTNERTECH AB PART 115 TELE2 AB TEL2 85 PEAB AB HLNF 116 TELIASONERA AB TLSN 86 POOLIA AB POOB 117 TRELLEBORG AB TT@G 87 PREVAS AB PREB 118 TRICORONA TRIB 88 PRICER AB PRIB 119 VBG GROUP AB VGBF 89 PROACT IT GROUP AB PRDA 120 VENUE RETAIL GROUP VRG 90 PROFFICE AB PRO 121 XANO INDUSTRI AB XANO 91 PROFILGRUPPEN AB PROB 92 Q-MED AB QMED 93 READSOFT AB RSOB

Umeå School of Business
Umeå University SE-901 87 Umeå, Sweden www.usbe.umu.se