recognition of right ventricular hypertrophy using the ... · diagnose the right ventricular...
TRANSCRIPT
MEASUREMENT SCIENCE REVIEW, Volume 7, Section 2, No. 2, 2007
16
Recognition of right ventricular hypertrophy using the DECARTO images of the cardioelectric characteristics
1L.I. Titomir, 1V.G. Trunov, 1E.A.I. Aidu, 2T.A. Sakhnova, 2E.V. Blinova 1Laboratory of Bioelectric Signal Processing, Institute for Information Transmission Problems, Russian Academy of Sciences, B. Karetny 19, Moscow, 127994, Russia
Email: [email protected] 2Advanced Diagnostic Methods Department, Cardiology Research Complex,
3rd Cherepkovskaja 15a, Moscow, 121552, Russia Email: [email protected]
Abstract. There are presented results of experimental-laboratory testing a new method to diagnose the right ventricular hypertrophy. The method is based upon the dipole electrocardiotopography (DECARTO) technique, proposed formerly by the authors and successfully applied for recognition of the left ventricular hypertrophy. The results obtained on reliably verified groups of normal and diseased persons show that this approach is efficient for diagnosis of the right as well as the left hypertrophy.
Keywords: electrocardiotopography, ventricular hypertrophy, non-invasive diagnosis
1. Introduction
The noninvasive recognition of the right ventricular hypertrophy (RVH) is one of the important problems in cardiological diagnostics, as soon as such pathology is often associated with lung diseases, congenital heart abnormalities, valvular defects, and other diseases. There are known several approaches to solve this problem with the use of quantitative parameters obtained by electrocardiographic measurements, in particular, the amplitudes of waves of scalar electrocardiogram, modules of vectorcardiographic vectors, and so on. It would be reasonable to use as well the parameters, which are more closely associated with spatiotemporal processes of the heart activation, and therefore could be more informative. Such parameters, provided by the DECARTO method [1], are experimentally investigated in this study with attempt to improve the accuracy of diagnosing RVH.
2. Subjects and Methods
The study included 134 males and females 45±15 years old, in particular: 74 healthy persons and 60 persons with initial, moderate, or pronounced RVH. The heart state of the patients was verified by common clinical and instrumental data, including roentgenography and echocardiography.
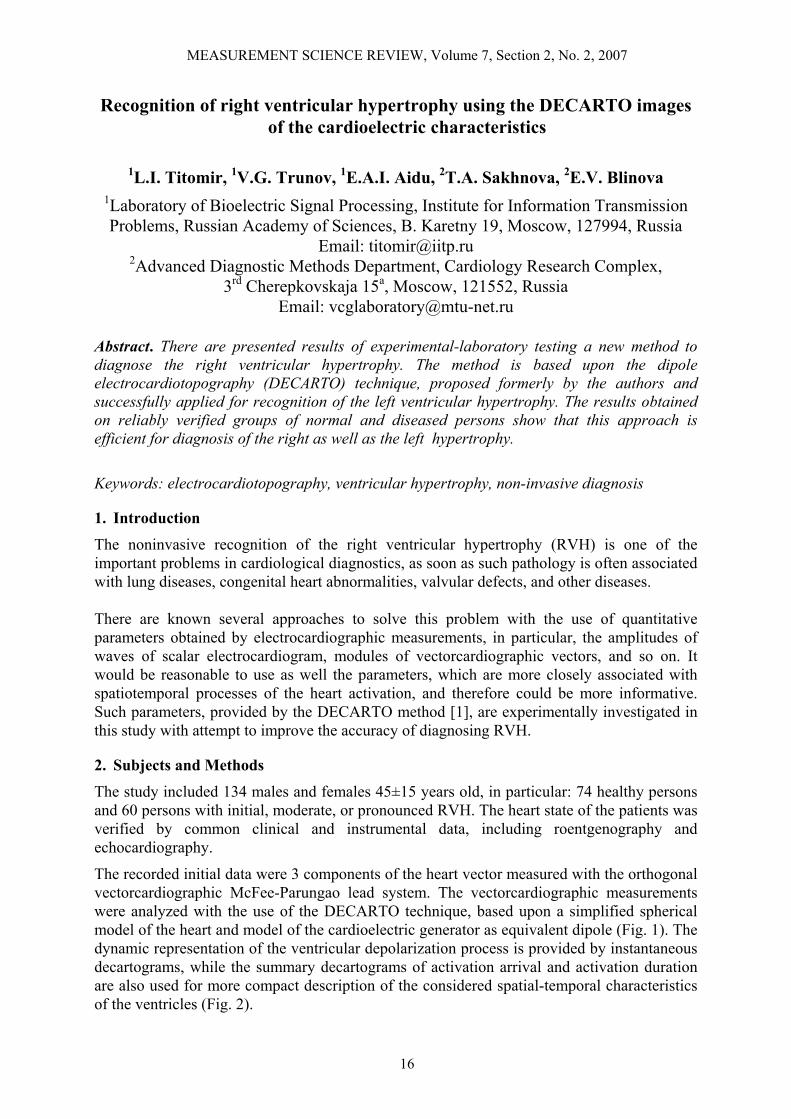
The recorded initial data were 3 components of the heart vector measured with the orthogonal vectorcardiographic McFee-Parungao lead system. The vectorcardiographic measurements were analyzed with the use of the DECARTO technique, based upon a simplified spherical model of the heart and model of the cardioelectric generator as equivalent dipole (Fig. 1). The dynamic representation of the ventricular depolarization process is provided by instantaneous decartograms, while the summary decartograms of activation arrival and activation duration are also used for more compact description of the considered spatial-temporal characteristics of the ventricles (Fig. 2).
MEASUREMENT SCIENCE REVIEW, Volume 7, Section 2, No. 2, 2007
17
Rest Act Dep D
x
y
z
D
0
IS
Anterior hemisphere
Posterior hemisphere
Fig. 1. Simplified spherical model of the heart depolarization (above) and plane surface for constructing decartograms (below). The orthogonal coordinate axes x, y, and z are directed leftward, downward, and forward, respectively. D, equivalent dipole moment of the heart; IS, image sphere. States of the myocardium: Rest, resting state; Act, activation state; Dep, completely depolarized state. The image sphere is cut along the meridian facing the right side of the patient’s chest, unrolled, and projected onto a plane in the isoareal format.
To find the most informative characteristics for recognition of RVH, the decartogram of activation duration is used. This is a map of distribution of the time during which the depolarization wave moves through the ventricular wall, so the increase of the wall thickness is visualized most explicitly, as illustrate the presented examples. To formulate the desired characteristic, we consider the region of this decartogram where the surface of the right ventricle is most completely projected according to the anatomy of the heart. The integral index of activation duration in the right ventricle (IIRV) is calculated as the value of activation duration, integrated over the aforementioned region on the decartogram, related to the integral of the activation duration over the whole image sphere enclosing the heart, and multiplied by the module of the vector with orthogonal components equal to the magnitudes of waves Sx and Rz of the scalar vectorcardiographic curves. The obvious physical dependence of IIRV on the wall thickness and total size of the right ventricle is substantiated by the description of the basic model used (see Figs. 1-3). The investigated person is attributed to the group with RVH, if the value of IIRV index exceeds the threshold chosen in advance on the basis of optimal requirements to the diagnostic classification accuracy, which is defined by the relation between sensitivity and specificity.
MEASUREMENT SCIENCE REVIEW, Volume 7, Section 2, No. 2, 2007
18
Normal case Activation arrival Activation duration
20
30
10
30
10
40 6050 60
70
80
20
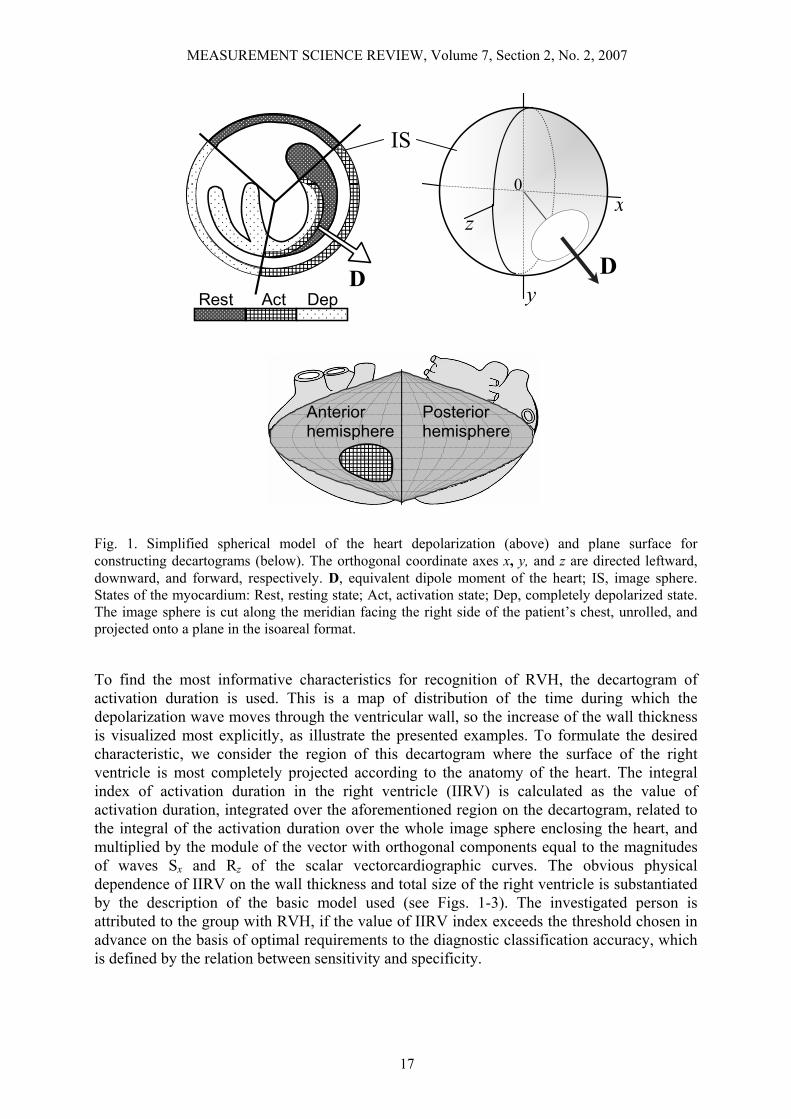
Fig. 2. Decartograms of activation arrival (left) and activation duration (right) for a typical normal case. The boundary between projections of the right and left ventricles is shown by the heavy dotted line. The times of activation arrival (with respect to the beginning of ventricular depolarization) on the left map and the durations of activation on the right map are indicated in ms inside the corresponding regions.
Normal case RVH case 1 RVH case 2
20
30
10
40
50
402030
10
5040
20
30
10
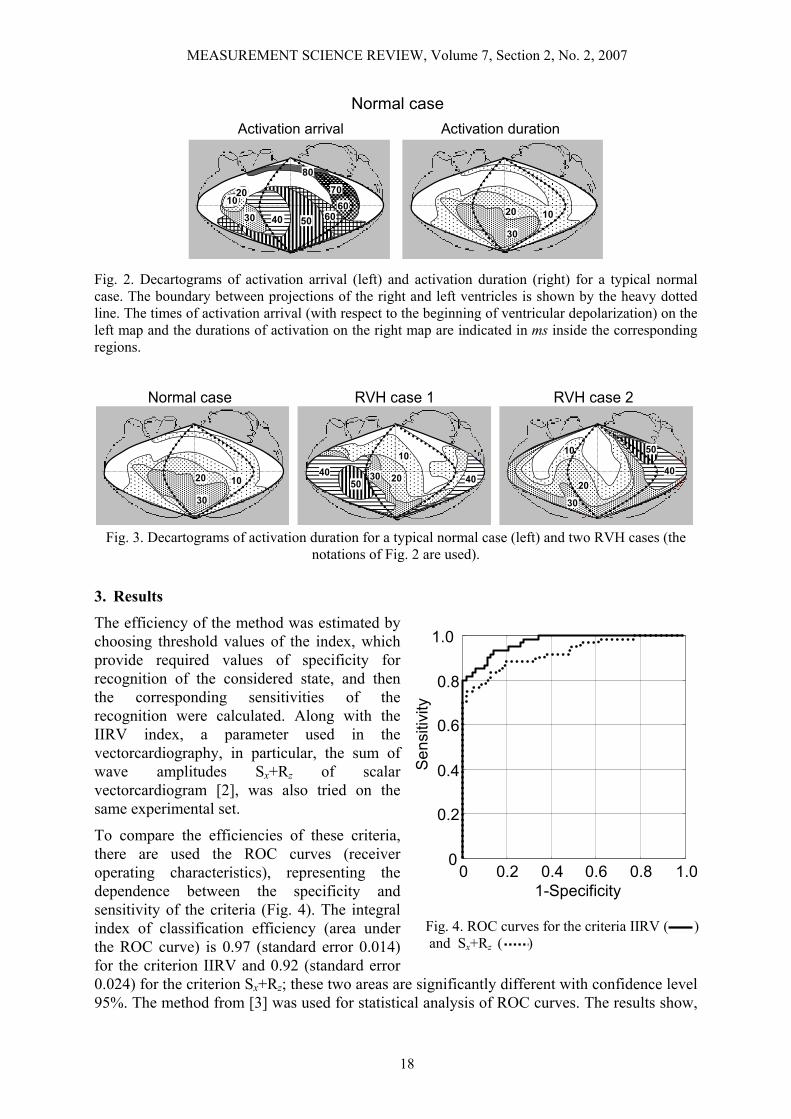
Fig. 3. Decartograms of activation duration for a typical normal case (left) and two RVH cases (the notations of Fig. 2 are used).
3. Results
The efficiency of the method was estimated by choosing threshold values of the index, which provide required values of specificity for recognition of the considered state, and then the corresponding sensitivities of the recognition were calculated. Along with the IIRV index, a parameter used in the vectorcardiography, in particular, the sum of wave amplitudes Sx+Rz of scalar vectorcardiogram [2], was also tried on the same experimental set.
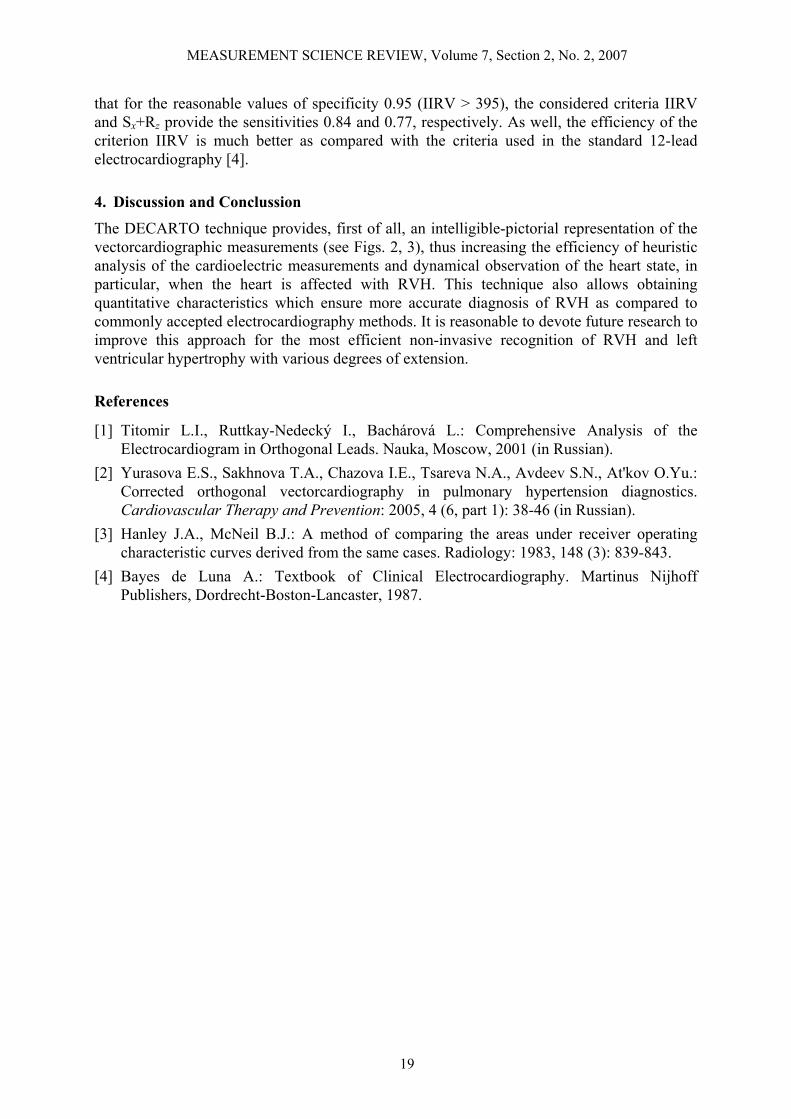
To compare the efficiencies of these criteria, there are used the ROC curves (receiver operating characteristics), representing the dependence between the specificity and sensitivity of the criteria (Fig. 4). The integral index of classification efficiency (area under the ROC curve) is 0.97 (standard error 0.014) for the criterion IIRV and 0.92 (standard error 0.024) for the criterion Sx+Rz; these two areas are significantly different with confidence level 95%. The method from [3] was used for statistical analysis of ROC curves. The results show,
Fig. 4. ROC curves for the criteria IIRV ( ) and Sx+Rz ( )
Sen
sitiv
ity
0 0.2 0.4 0.6 0.8 1.00
0.2
0.4
0.6
0.8
1.0
1-Specificity
MEASUREMENT SCIENCE REVIEW, Volume 7, Section 2, No. 2, 2007
19
that for the reasonable values of specificity 0.95 (IIRV > 395), the considered criteria IIRV and Sx+Rz provide the sensitivities 0.84 and 0.77, respectively. As well, the efficiency of the criterion IIRV is much better as compared with the criteria used in the standard 12-lead electrocardiography [4].
4. Discussion and Conclussion
The DECARTO technique provides, first of all, an intelligible-pictorial representation of the vectorcardiographic measurements (see Figs. 2, 3), thus increasing the efficiency of heuristic analysis of the cardioelectric measurements and dynamical observation of the heart state, in particular, when the heart is affected with RVH. This technique also allows obtaining quantitative characteristics which ensure more accurate diagnosis of RVH as compared to commonly accepted electrocardiography methods. It is reasonable to devote future research to improve this approach for the most efficient non-invasive recognition of RVH and left ventricular hypertrophy with various degrees of extension.
References
[1] Titomir L.I., Ruttkay-Nedecký I., Bachárová L.: Comprehensive Analysis of the Electrocardiogram in Orthogonal Leads. Nauka, Moscow, 2001 (in Russian).
[2] Yurasova E.S., Sakhnova T.A., Chazova I.E., Tsareva N.A., Avdeev S.N., At'kov O.Yu.: Corrected orthogonal vectorcardiography in pulmonary hypertension diagnostics. Cardiovascular Therapy and Prevention: 2005, 4 (6, part 1): 38-46 (in Russian).
[3] Hanley J.A., McNeil B.J.: A method of comparing the areas under receiver operating characteristic curves derived from the same cases. Radiology: 1983, 148 (3): 839-843.
[4] Bayes de Luna A.: Textbook of Clinical Electrocardiography. Martinus Nijhoff Publishers, Dordrecht-Boston-Lancaster, 1987.