recent economic developments in latvia and medium-term outlook
DESCRIPTION
This presentation summarises recent macroeconomic developments in Latvia and outlines a medium-term outlook for real GDP and inflation. Presentation reviews ongoing economic recovery, labour market issues and includes analyses on core factors behind the path of inflation. The main focus of the presentation is on the issue of competitiveness of the Latvian economy pointing to the costs adjustment process and productivity gains, as well as presenting export performance, market shares and current account developments. Presentation also features slides on monetary and financial market developments.TRANSCRIPT
Recent Economic Developments in Latvia and Medium-term
Outlook
January, 2012
Macroeconomic Overview
2
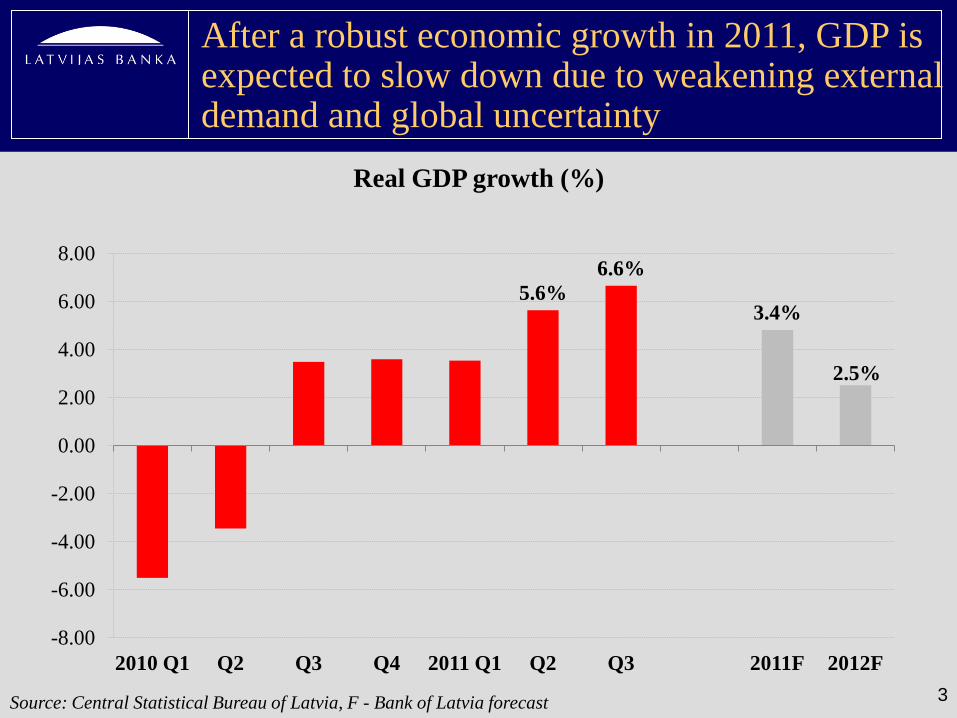
After a robust economic growth in 2011, GDP is expected to slow down due to weakening external demand and global uncertainty
Real GDP growth (%)
5.6% 6.6%
3.4%
2.5%
-8.00
-6.00
-4.00
-2.00
0.00
2.00
4.00
6.00
8.00
2010 Q1 Q2 Q3 Q4 2011 Q1 Q2 Q3 2011F 2012F
Source: Central Statistical Bureau of Latvia, F - Bank of Latvia forecast 3

In 2011, export performance has supported recovery of domestic demand
Real GDP growth (y-o-y, %) and contribution to the growth (percentage points)
Source: Central Statistical Bureau of Latvia
-20
-15
-10
-5
0
5
10
15
20
2010
Q1
Q2
Q3
Q4
2011
Q1
Q2
Q3
Private consumption Public consumption GFCF Changes in inventories Exports Imports GDP, % yoy
4

Rebound in manufacturing has been underpinned by strong export expansion
70
80
90
100
110
120
130
140
150
Q1
2006
Q2
Q3
Q4
Q1
2007
Q2
Q3
Q4
Q1
2008
Q2
Q3
Q4
Q1
2009
Q2
Q3
Q4
Q1
2010
Q2
Q3
Q4
Q1
2011
Q2
Q3
Manufacturing (seasonally adjusted data) Manufacturing (non-adjusted data) Real exports (nsa) Real exports (sa)
Manufacturing output volume index and real export (2005 = 100)
Source: Central Statistical Bureau of Latvia
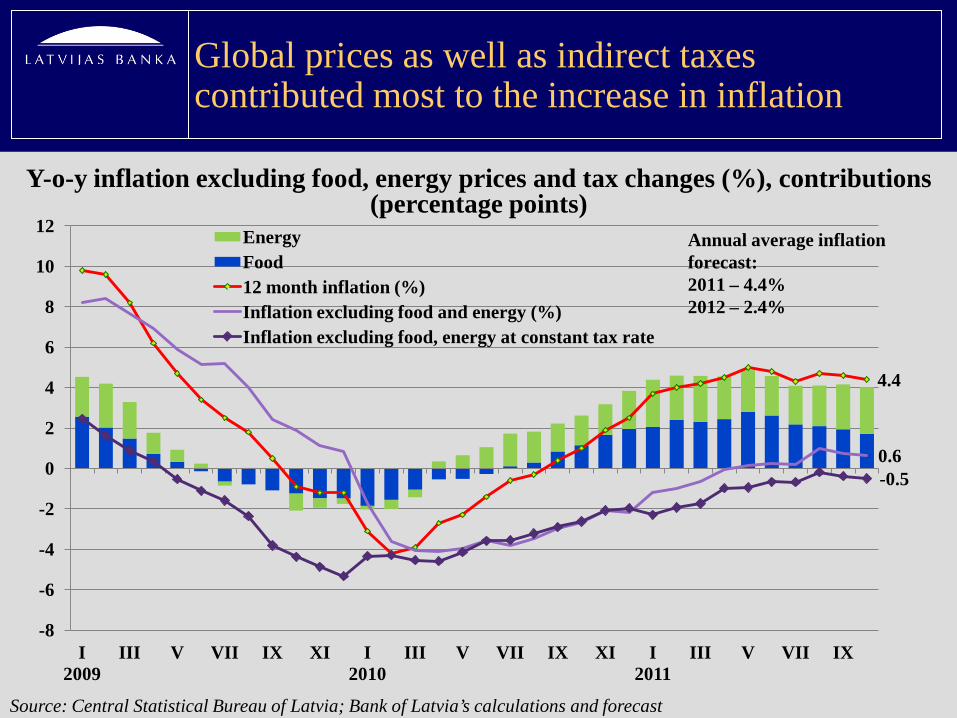
Global prices as well as indirect taxes contributed most to the increase in inflation
4.4
0.6 -0.5
-8
-6
-4
-2
0
2
4
6
8
10
12
I 2009
III V VII IX XI I 2010
III V VII IX XI I 2011
III V VII IX
Energy Food 12 month inflation (%) Inflation excluding food and energy (%) Inflation excluding food, energy at constant tax rate
Annual average inflation forecast: 2011 – 4.4% 2012 – 2.4%
Y-o-y inflation excluding food, energy prices and tax changes (%), contributions (percentage points)
Source: Central Statistical Bureau of Latvia; Bank of Latvia’s calculations and forecast
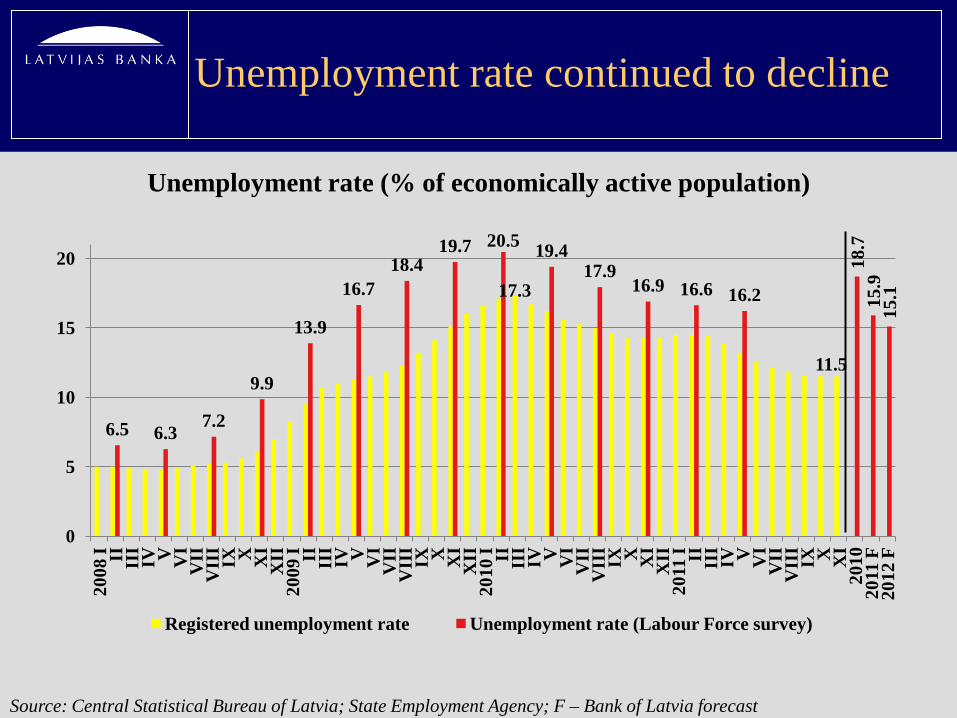
Unemployment rate continued to decline
17.3
11.5
6.5 6.3 7.2
9.9
13.9
16.7 18.4
19.7 20.5 19.4 17.9
16.9 16.6 16.2
18.7
15
.9
15.1
0
5
10
15
20
2008
I II
III
IV
V
VI
VII
V
III
IX
X
XI
XII
20
09 I II
II
I IV
V
V
I V
II
VII
I IX
X
X
I X
II
2010
I II
III
IV
V
VI
VII
V
III
IX
X
XI
XII
20
11 I II
II
I IV
V
V
I V
II
VII
I IX
X
X
I 20
10
2011
F
2012
F
Registered unemployment rate Unemployment rate (Labour Force survey)
Unemployment rate (% of economically active population)
Source: Central Statistical Bureau of Latvia; State Employment Agency; F – Bank of Latvia forecast
Competitiveness issues
8
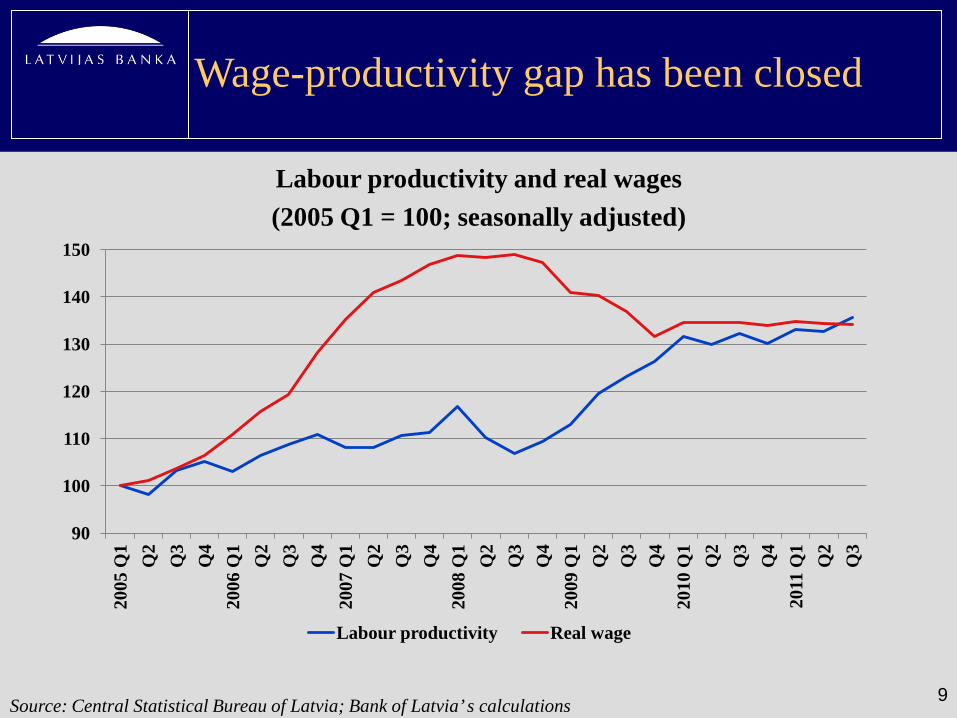
Wage-productivity gap has been closed
90
100
110
120
130
140
150
2005
Q1
Q2
Q3
Q4
2006
Q1
Q2
Q3
Q4
2007
Q1
Q2
Q3
Q4
2008
Q1
Q2
Q3
Q4
2009
Q1
Q2
Q3
Q4
2010
Q1
Q2
Q3
Q4
2011
Q1
Q2
Q3
Labour productivity Real wage
Labour productivity and real wages (2005 Q1 = 100; seasonally adjusted)
Source: Central Statistical Bureau of Latvia; Bank of Latvia’ s calculations 9
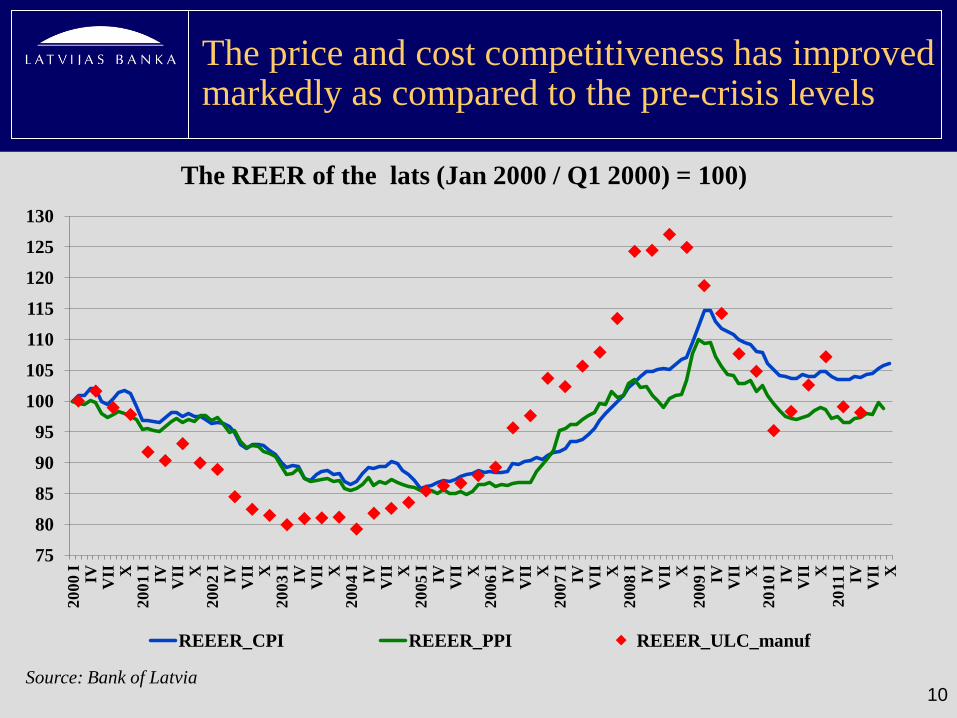
The price and cost competitiveness has improved markedly as compared to the pre-crisis levels
75 80 85 90 95
100 105 110 115 120 125 130
2000
I IV
VII
X
20
01 I IV
V
II
X
2002
I IV
VII
X
20
03 I IV
V
II
X
2004
I IV
VII
X
20
05 I IV
V
II
X
2006
I IV
VII
X
20
07 I IV
V
II
X
2008
I IV
VII
X
20
09 I IV
V
II
X
2010
I IV
VII
X
20
11 I IV
V
II
X
REEER_CPI REEER_PPI REEER_ULC_manuf
Source: Bank of Latvia
The REER of the lats (Jan 2000 / Q1 2000) = 100)
10
0.00
0.15
0.30
0.45
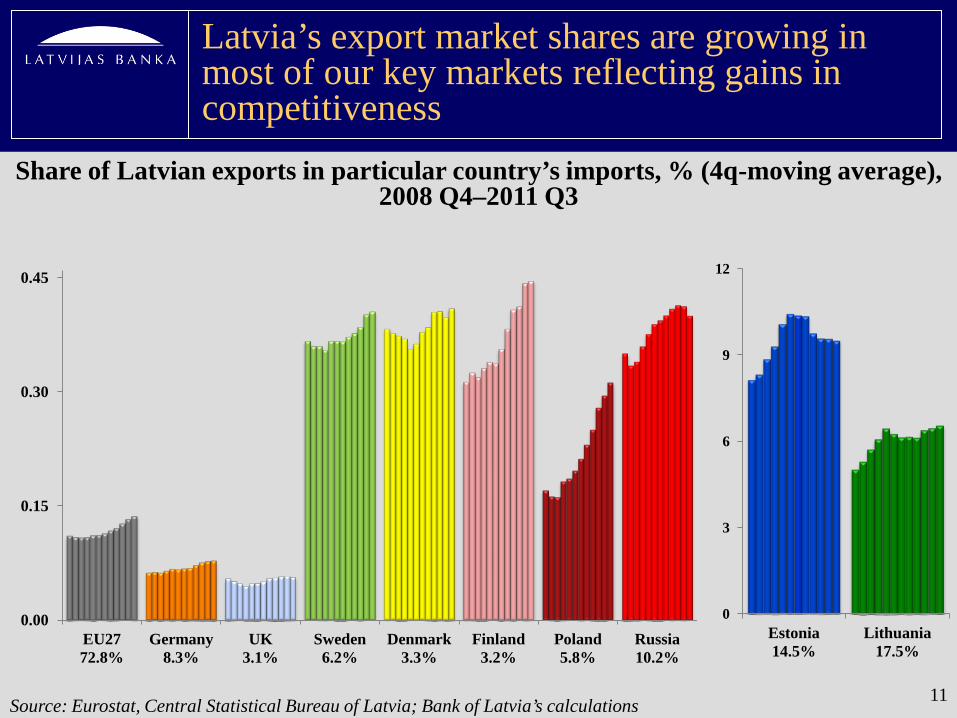
EU27 72.8%
Germany 8.3%
UK 3.1%
Sweden 6.2%
Denmark 3.3%
Finland 3.2%
Poland 5.8%
Russia 10.2%
Latvia’s export market shares are growing in most of our key markets reflecting gains in competitiveness
Share of Latvian exports in particular country’s imports, % (4q-moving average), 2008 Q4–2011 Q3
0
3
6
9
12
Estonia 14.5%
Lithuania 17.5%
Source: Eurostat, Central Statistical Bureau of Latvia; Bank of Latvia’s calculations 11
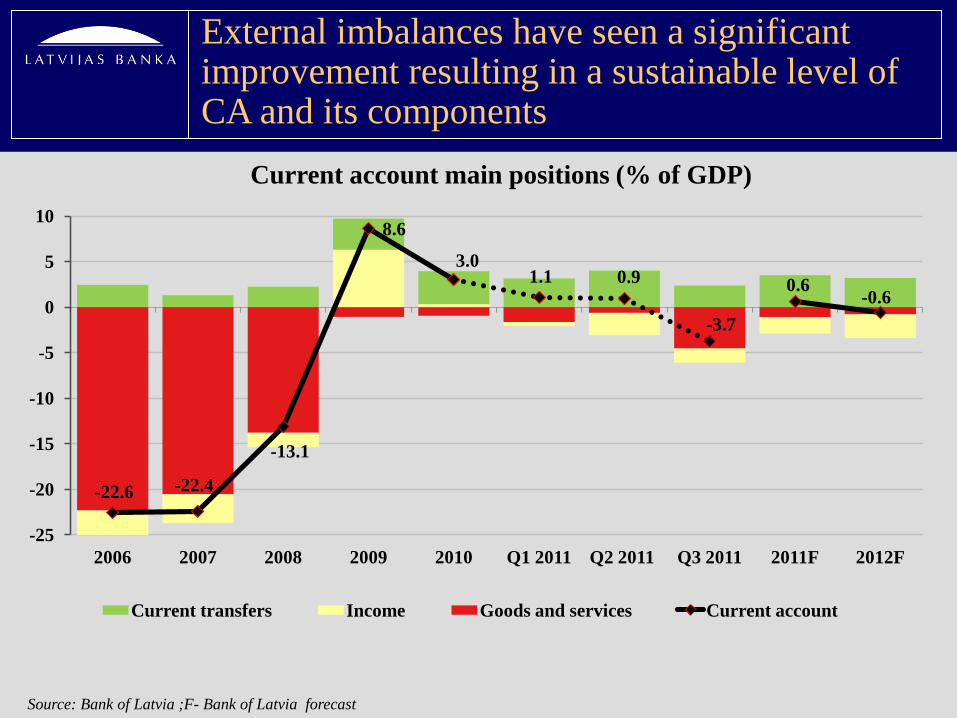
External imbalances have seen a significant improvement resulting in a sustainable level of CA and its components
-22.6 -22.4
-13.1
8.6
3.0 1.1 0.9
-3.7
0.6 -0.6
-25
-20
-15
-10
-5
0
5
10
2006 2007 2008 2009 2010 Q1 2011 Q2 2011 Q3 2011 2011F 2012F
Current transfers Income Goods and services Current account
Source: Bank of Latvia ;F- Bank of Latvia forecast
Current account main positions (% of GDP)
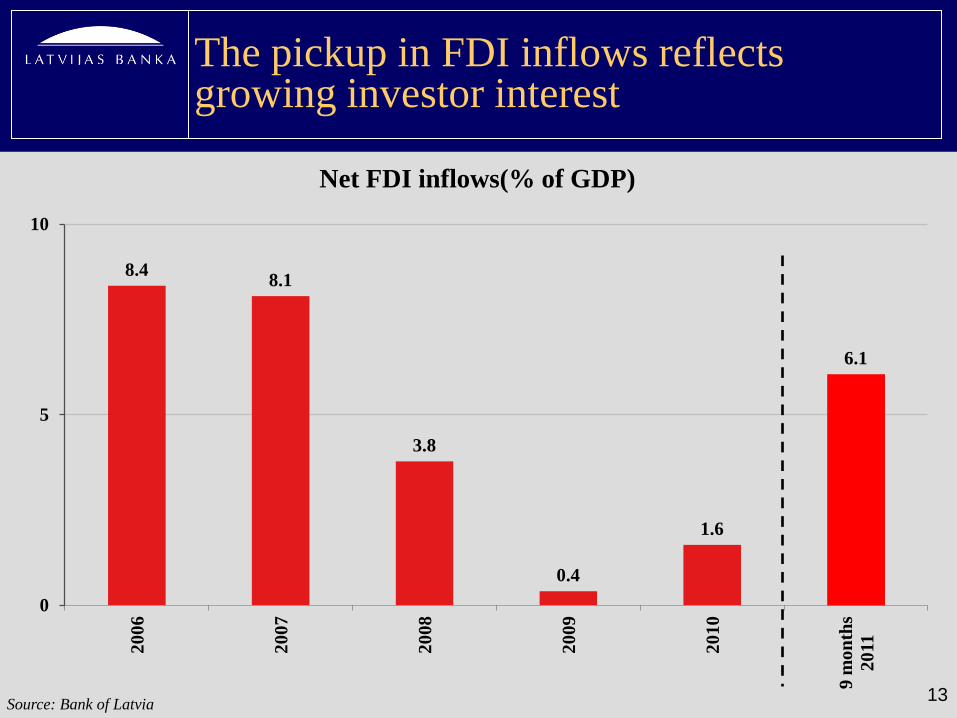
The pickup in FDI inflows reflects growing investor interest
Net FDI inflows(% of GDP)
8.4 8.1
3.8
0.4
1.6
6.1
0
5
10
2006
2007
2008
2009
2010
9 m
onth
s 20
11
13 Source: Bank of Latvia
Monetary and Financial Market Developments
14
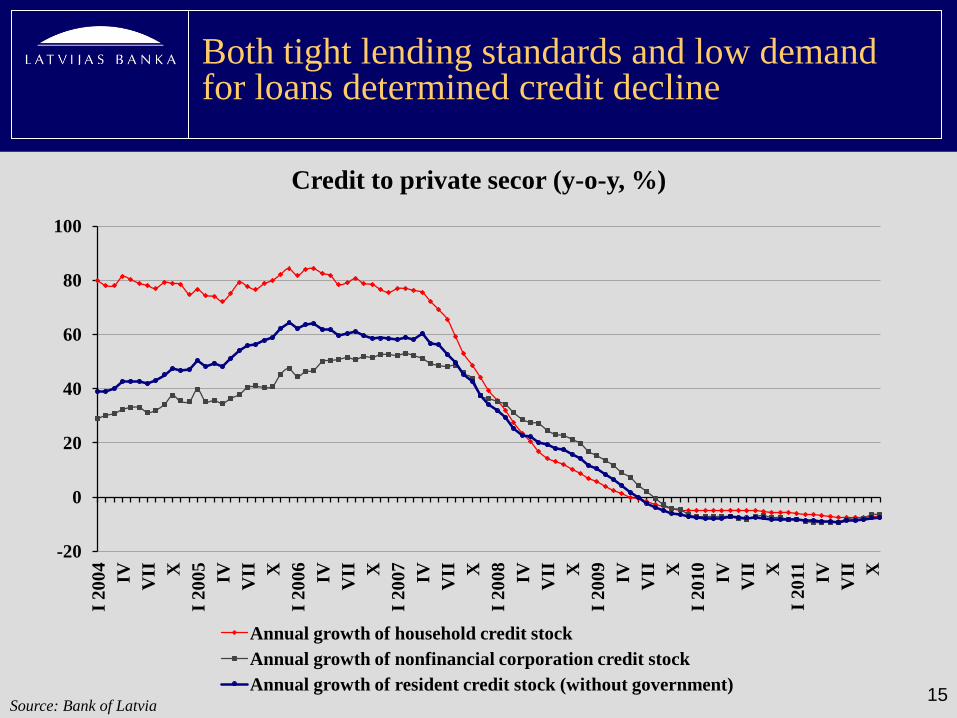
Both tight lending standards and low demand for loans determined credit decline
-20
0
20
40
60
80
100
I 200
4 IV
VII
X
I 2
005 IV
VII
X
I 2
006 IV
VII
X
I 2
007 IV
VII
X
I 2
008 IV
VII
X
I 2
009 IV
VII
X
I 2
010 IV
VII
X
I 2
011 IV
VII
X
Annual growth of household credit stock Annual growth of nonfinancial corporation credit stock Annual growth of resident credit stock (without government)
Credit to private secor (y-o-y, %)
15 Source: Bank of Latvia
0
500
1000
1500
2000
2500
3000
3500
4000
4500
I 200
8 II
III
IV
V
VI
VII
V
III
IX
X
XI
XII
I 2
009 II
II
I IV
V
V
I V
II
VII
I IX
X
X
I X
II
I 201
0 II
III
IV
V
VI
VII
V
III
IX
X
XI
XII
I 2
011 II
II
I IV
V
V
I V
II
VII
I IX
X
X
I
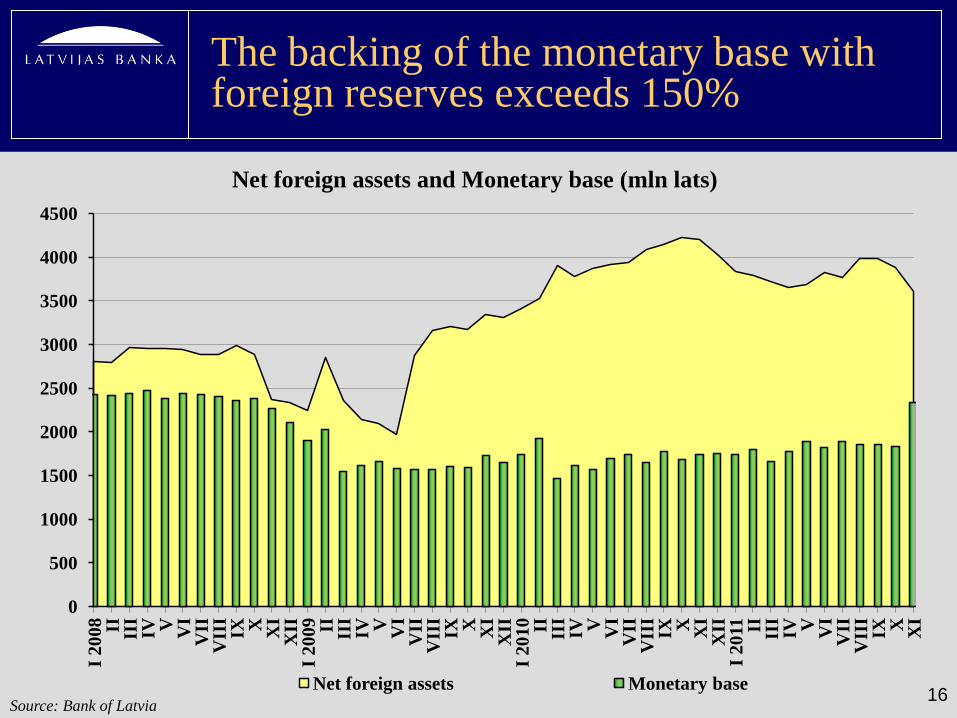
Net foreign assets Monetary base
The backing of the monetary base with foreign reserves exceeds 150%
16 Source: Bank of Latvia
Net foreign assets and Monetary base (mln lats)

Capital adequacy ratios continued to be significantly higher than the required minimum of 8%
0
2
4
6
8
10
12
14
16
18
Q1 2006
Q2 Q3 Q4 Q1 2007
Q2 Q3 Q4 Q1 2008
Q2 Q3 Q4 Q1 2009
Q2 Q3 Q4 Q1 2010
Q2 Q3 Q4 Q1 2011
Q2 Q3
CAR Tier 1 ratio
Capital adequacy ratios (%)
Source: Financial and Capital Market Commission 17
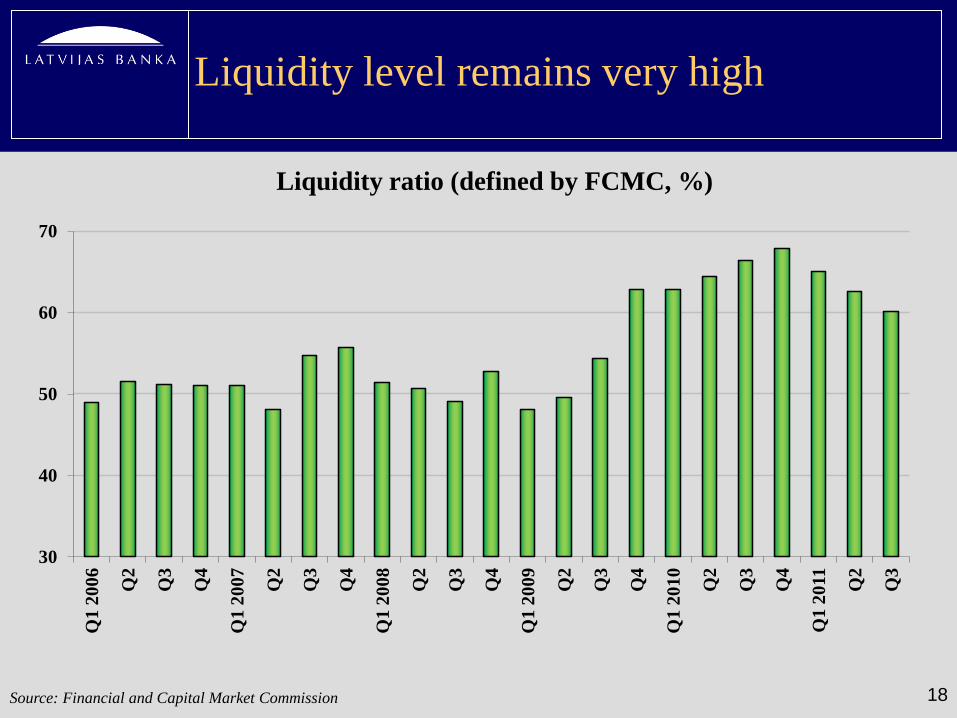
Liquidity level remains very high
30
40
50
60
70
Q1
2006
Q2
Q3
Q4
Q1
2007
Q2
Q3
Q4
Q1
2008
Q2
Q3
Q4
Q1
2009
Q2
Q3
Q4
Q1
2010
Q2
Q3
Q4
Q1
2011
Q2
Q3
Source: Financial and Capital Market Commission
Liquidity ratio (defined by FCMC, %)
18
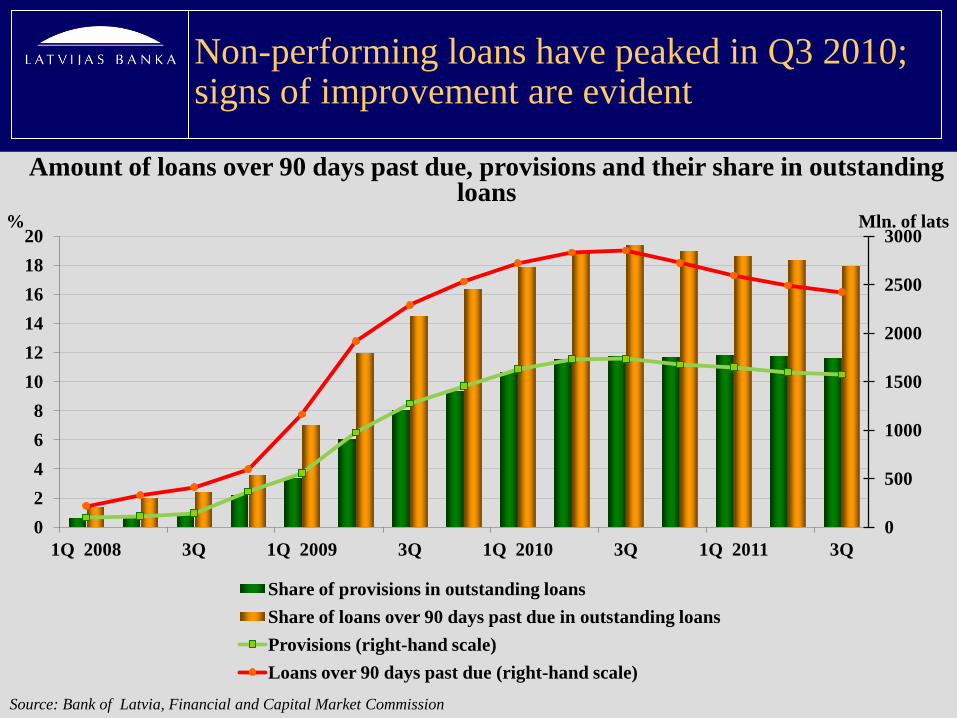
Non-performing loans have peaked in Q3 2010; signs of improvement are evident
0
500
1000
1500
2000
2500
3000
0 2 4 6 8
10 12 14 16 18 20
1Q 2008 3Q 1Q 2009 3Q 1Q 2010 3Q 1Q 2011 3Q
Mln. of lats %
Share of provisions in outstanding loans Share of loans over 90 days past due in outstanding loans Provisions (right-hand scale) Loans over 90 days past due (right-hand scale)
Amount of loans over 90 days past due, provisions and their share in outstanding loans
Source: Bank of Latvia, Financial and Capital Market Commission

RIGIBOR rates still remaine at low levels
0%
5%
10%
15%
20%
25%
30%
RIGIBOR 3M RIGIBOR 6M RIGIBOR 12M
Money market rates (%)
Source: Bank of Latvia 20
21