real time detection of hurricanes from satellite cloud ... · real time detection of hurricanes...
TRANSCRIPT
Real Time Detection of Hurricanes from SatelliteCloud Imagery Using Haar Wavelet
Murali Prasad Raja, Narasimha Prasad L V, Member, IAENG, and Vasavi Krishna Yacham
Abstract—Hurricane is one of the most powerful and disas-trous natural calamities of all times. Hurricanes form over thewarm oceans due to the complex interactions of the underlyingocean and the storm environment. Prediction of the trajectoryof these hurricane storms is quite accurate after landfall butthe forecast of the future storm is more difficult due to intensitychange. There are different observations used for forecastinghurricane. A direct observation using research aircraft isextremely expensive and an indirect observation method calledDoppler radar is useful only the storm comes close to shore andafter landfall. So in order to predict before landfall, satellitescan be used and even this is an indirect observation. Visiblesatellite images are used for estimating precipitation, amount ofice within the clouds, which tells us the strength of convectionor the overturn of the atmosphere within the hurricane. Thehurricane storm detection model presented in this paper usessatellite images containing different textures are subjected tok-means clustering to obtain cloud texture on which analysisis carried out. The distance difference between clusters istypically based on pixel color, intensity, texture, and location,or a weighted combination of these factors. The Haar wavelettransform is used to eliminate striping noise and transform thesatellite image in spatial domain to frequency. The thresholdvalues of wavelength for cloud image are estimated with higheraccuracy using soft thresholding and square root balancesparsity norm.
Index Terms—Hurricane, Haar wavelet, Image processing,Satellite imagery, k-means clustering
I. INTRODUCTION
HURRICANE has a very intense impact on most ofthe countries around the globe. It falls under the
category of the meteorological phenomenon known as thetropical cyclone. These tropical cyclones are low pressuresystems that rotate in counter clockwise direction, having athunderstorm activity. The tropical cyclone can be classifiedbased on the intensity of the wind. When the winds are of38 mph (33 kt) or less, they are called tropical depression.When it reaches 39-73 mph (34-63 kt), it is classified astropical storm and if it exceeds 74 mph (64kt) it is consideredto be a hurricane. It is an intense circular storm withwell defined surface circulation generally formed at tropics,having strong thunderstorms and maximum sustained winds.The word hurricane has been originated from the Spanishword huracan which was inspired by hunraken, the namefor the ancient Mayan storm God. In recent decades, thenumber and strength of intense hurricanes which fall under
Manuscript received July 03, 2014; revised August 04, 2014.Murali Prasad Raja is with the Department of Electronics and Communi-
cation Engineering, Vardhaman College of Engineering, Hyderabad, India.e-mail: [email protected]
Narasimha Prasad L V is with the Department of Computer Science andEngineering, Vardhaman College of Engineering, Hyderabad, India. e-mail:[email protected]
Vasavi Krishna Yacham is with the Department of Computer Science andEngineering, Vardhaman College of Engineering, Hyderabad, India. e-mail:[email protected]
category 4 and 5 of the Saffir-Simpson scale have increased,where major hurricanes hit Florida and the east coast ofthe United States near north Atlantic ocean. In the westernpacific, hurricanes are said to be typhoons and the similarstorms in Indian ocean are known as cyclones. However,their physical nature is the same.
Hurricanes form over the warm oceans (at least 800F )in the tropics. The disastrous conditions which lead tothe formation of hurricane could be prior disturbances inweather, high moisture levels, relatively light winds aloft anda wind pattern near the surface which spirals the air inward.If these conditions persist for a long period of time, cyclonesdevelop from tropical depressions to tropical storms, andthen to hurricanes, producing violent winds, turbulent waves,torrential rains and floods. The prime factors that help inpredicting the hurricane are sea surface temperature, lowpressure, humidity, precipitation, heat emitted by the sunand spinning of the earth. The factors like direction ofwind and speed depend on the location of the hurricaneeye, since hurricane winds circulate around the center in acounter-clockwise fashion. Hurricanes also depend on thepath it follows, like in a fairly straight manner, looping orwobbling along its path. Hurricanes are classified based onSaffir-Simpson scale as it is the most accurate method ofdescribing a storm that affects large areas. This scale definesthe hurricane strength by categorizing them where category 1storm is the weakest hurricane and category 5 is the strongestas shown in Table I.
The right front quadrant of the hurricane is most dangerousas it has an additive effect of the high hurricane wind speedand steering winds in the atmosphere. It is dangerous interms of its highest storm surge, winds, heavy rainfalls whichproduces destructive floods (hurricane Camille in 1969 whichaffected the gulf coast area, combined with a cold frontin the mountains of Virginia, produced 30 inches of rain,killing 109 people.), tornadoes (The hurricane Beulah in1967, had an off-shoot of 141 tornadoes in the Texas coast)and riptides. Hurricane damage might also cause chemicalspills in industries that could make the disaster even worse.A large number of people and property fall prey to hurricanethreats. This can be supported by the facts and figureswhich go by understanding that in an average 3 year periodtime, close to five hurricanes have struck the US coastlines
TABLE I: Saffir-Simpson Scale of Hurricane
Category Saffire-Simpson Scale Damage Examples1 74-95 mph Minimal Florence, 1988, LA2 96-110 mph Moderate Kate,19853 110-130 mph Extensive Alicia, 1983, TX4 131-155 mph Extreme Andrew,1992, FL5 >155 mph Catastrophic Camille,1969,MS
Proceedings of the World Congress on Engineering and Computer Science 2014 Vol I WCECS 2014, 22-24 October, 2014, San Francisco, USA
ISBN: 978-988-19252-0-6 ISSN: 2078-0958 (Print); ISSN: 2078-0966 (Online)
WCECS 2014
claiming around 50-100 lives. Hurricane Andrew (1992)which struck South Florida and Louisiana caused a heavydamage of about $25 billion. When a hurricane hits land,it can do great damage through its fierce winds, torrentialrains, inland flooding, and huge waves crashing ashore killingpeople and destroying property. So, there is dire need topredict hurricanes before landfall. The proposed techniqueuses satellite images to predict the occurrence of hurricanebefore landfall by determining its wavelength range.
Prediction of the trajectory of hurricane storms is quiteaccurate only after landfall. The forecast of the future stormintensity is more difficult to predict. The reason for thisis that storm tracks are primarily determined by the large-scale atmospheric environment surrounding the storm, butthe intensity is affected on a wide variety of scales bythe convection near the storm center, interactions with theunderlying ocean and complex interactions with the stormenvironment, including the effects of vertical shear, troughinteraction and moisture availability which leads to difficultyin prediction.
NOAA’s National Weather Service has several tools tomonitor hurricanes. While the storms are still far out in theocean, indirect measurements using satellites which are themain tool, although ships and buoy provide observations.Once the storms come closer to land, more direct measure-ments like reconnaissance aircraft that fly into these storms,radiosondes, and automated surface observing stations areused. These aircraft observations are extremely expensive,and are not available in all regions of the globe owing torange and safety limitation.
Radar provides an important and indirect measurementonce the storm comes closer to the shore and after landfall(within about 200 miles of the coast). As hurricanes spendmost of their lifetime over the oceans, it has always been aproblem to obtain continuous and quality data from hurri-canes before landfall, using radar. Satellites can be used forcertain observations for predicting the hurricanes before thelandfall. Radar cannot track if deceleration is greater thanone mph/second. Sometimes, large targets close to radar cansaturate the receiver and radar images which contain specklenoise due to random fluctuations in the return signal whichcause difficulties for interpretation of the image [1].
Computer models were used to forecast storm intensityand movement. This method requires collection of hugeamount of data about the atmosphere. Lack of observations(especially over the ocean), errors and other inconsistenciesin data are the major reasons for the occurrence of erroneousresults in the forecast.
The methodology employed here involves processing ofvisible satellite image using Haar wavelet transform in orderto enhance the image or to eliminate striping noise, specklenoise [2]. The resulted satellite images are subjected toclustering based on the color attribute. To percolate thesepixels into the clusters, k-means algorithm is used [3]-[5].Then finding the threshold and standard deviation valueswhich are further used to locate the region of visiblewavelengths in which hurricane occurs. This mechanism isdeveloped to detect the presence of hurricane by determiningthe wavelength range in which this storm occurs.
The remaining paper is structured as follows: SectionII emphasizes on the literature survey. Section III gives
brief information on formation and lifecycle of hurricane.Section IV demonstrates the experimentation methodologyemployed. Section V provides the experimental results andperformance measures. Finally, section VI gives conclusionand future enhancements.
II. RELATED WORK
Research accounts to the systematic approach of gatheringinformation or data, studying the gathered data and also var-ious materials, investigating new scientific areas, exploringnew ideas in order to enhance deeper understanding of atopic and for the advancement of knowledge. The researchmethodology depends upon the sources from where theinformation has been assembled, sampling of the data andthe basis on which the conclusions have been drawn. Themain motto of research process of this paper is to detect thehurricane in clouds.
YonghuiWeng, Meng Zhang and Fuqing Zhang used ad-vanced data assimilating techniques to decrease errors ininitial conditions and used 3DVar and 4DVar algorithmsfor assimilating doppler radar observations by implementingEnKF in the WRF models [6]. Brent A. Williams andDavid G. Long developed a hurricane model which providesprior information that can be used in maximum a posteri-ori probability estimation of rain-contaminated ocean windsand some useful hurricane parameters like location of eyecenter using sea winds instrument [7]. Antonio Reppucciperformed wavelet analyses on SAR images and proposed anew algorithm, which uses least square minimization of SARimages in combination with a parametric holland-type modelof wind speed in order to predict hurricane intensity [1].Fuqing Zhang et al. assimilated radial velocity observationsof doppler radar with an ensemble Kalman filter for predic-tion and cloud resolving analysis of hurricanes [8]. Shuyi S.Chen et al. studied many factors that lead to hurricane anddeveloped a fully coupled atmosphere-wave-ocean modelingsystem that can be useful for the next-generation hurricaneprediction [9]. Alark Joshi et al. approached in understandingthe structure of hurricanes, identifying of the amount ofvertical wind shear in a hurricane with the aid of visualizationtechniques [10]. Banner I. Miller et al. used some statisticalmethods and derived equations by using data at sea level,700 mb and 500 mb that can be useful for prediction ofhurricane motion [11]. Colin Price et al. discovered that thereis a correlation between lightning frequency and maximumsustained winds where the maximum sustained winds andminimum pressures in hurricanes are preceded by increasesin lightning activity, this contributes in forecasting by contin-uously monitoring the lightning activity in hurricanes aroundthe globe [12].
III. FORMATION OF HURRICANE
The evaporation of ocean water occurs due to the heatemitted from the sun. This evaporated water forms clouds ofwarm, moist air that moves upward. Evaporation dependson warm waters and thus tropical cyclones develop overwarm water of temperature above 270C for a considerabledepth and is caused due to prior disturbances in the areaswhere the weather is unsettled. Tropical cyclones can alsoform from the trailing ends of cold fronts. To instigate the
Proceedings of the World Congress on Engineering and Computer Science 2014 Vol I WCECS 2014, 22-24 October, 2014, San Francisco, USA
ISBN: 978-988-19252-0-6 ISSN: 2078-0958 (Print); ISSN: 2078-0966 (Online)
WCECS 2014
cyclone’s rotation, there should be some adequate coriolisforce. Absence of this force near equator, limits the formationof tropical cyclone between 00 − 70 latitudes.
The process by which a tropical cyclone forms and sub-sequently strengthens into a hurricane depends on someconditions like pre-existing disturbance with thunderstorms,where the temperature of oceans [13] is at least 800F upto adepth of about 150 feet and the light upper level winds thatdo not change much in direction and speed throughout theatmosphere (low wind shear). Hurricane comes in contactwith warm ocean waters and gathers heat and energy fromthe disturbances. The wind near the ocean surface spiral intothe disturbance’s in low pressure area. The raised air gets intouch with the moisture and heat which is produced by thewarm ocean. As this moisture condenses into drops, moreheat is released, contributing additional energy to power thestorm. Bands of thunderstorms are formed and the cloudtips of the storm rise higher into the atmosphere. If thewinds at these high levels remain relatively light and haveno wind shear, then the storm can remain intact and continueto strengthen.
There are three stages of tropical cyclone development. Inthe early stages, the system appears on the satellite image asa relatively unorganized cluster of thunderstorms. If weatherand ocean conditions continue to be favorable, the systemcan strengthen and become a tropical depression with windsless than 38 mph or 33 kt. At this point, the storm beginsto take on the familiar spiral appearance due to the flowof the winds and the rotation of the earth. If the stormcontinues to strengthen to tropical storm status of winds at39-73 mph or 34-63 kt, the bands of thunderstorms contributeadditional heat and moisture to the storm. The storm becomesa hurricane when winds reach a minimum of 74 mph or 64kt.
Rapidly sinking air at the center dries and warms the areato form the cloud-free hurricane eye which is relatively calmand has a clear area of approximately 20-40 miles across. Theeyewall surrounding the eye is composed of dense cloudsof thunderstorms that contain the highest winds of storm.Hurricane-force winds called rain bands can stretch out asfar as 300 miles from the center of a large hurricane. Airspirals towards the center in a counter-clockwise pattern andcomes out in the opposite direction. Changes in the structureof the eye and eyewall can cause changes in the wind speed,which is an indicator of the storm’s intensity. During theirlife span, hurricanes can last for more than two weeks overthe ocean and can travel up the entire Atlantic coast.
Hurricane will decay due to many reasons. When thewind shear tears the hurricane apart, it decays. Moving overcooler water or drier areas can also lead to weakening.Landfall evaporates the moisture source of hurricane due tothe reduced surface circulation by friction when it passes overthe land causing hurricanes to diminish. These hurricanesare spiraling masses, relying on complex combination ofatmospheric processes to grow, mature and then die. There isa scope for these weakening hurricanes to reintensify if theymove to a more favorable region or interact with mid-latitudefrontal systems.
IV. EXPERIMENTATION METHODOLOGY
Large advances have been done by the meteorologists inthe field of forecasting technology in order to track the poten-tial path of tropical storms and hurricanes. But this researchdid not prove to be sufficient in predicting storm intensityas it is difficult to determine the rapid intensification ofstorms when they suddenly transform into stronger cyclonesor hurricanes. Also, the internal processes within the stormsystem and large-scale winds that determine the direction ofthe storms contribute to the difficulties in predicting the rapidintensification of storms.
The satellite imagery is most commonly used for meteorol-ogy which looks at the clouds above the storms, giving littleinsight about whats going on inside the system. In particular,satellites have greatly improved our ability to monitor andunderstand hurricanes. Hence, satellite or digital images areone of the efficient sources for predicting hurricanes. Satelliteimages use albedo factor for estimating precipitation andamount of ice within the clouds. This helps in determiningthe strength of convection or the overturn of the atmospherewithin the hurricane. Clouds having high albedos are thickand show up bright in satellite images and thin cirrus cloudshave low albedos and are semi-transparent to sunlight.
The hurricane storm detection model established in thispaper has considered visible satellite images (∼ 0.6µm)and through the process of image acquisition we often findbarriers like noise, burrs among others. Denoising conceptsshould be applied in order to analyze the image. The noisepresent in the images may appear as additive or multiplicativecomponents and the main purpose of denoising is to removethese noisy components and retain the significant informationto preserve useful data. Image denoising is an importanttask in image processing and the use of wavelet transformimproves the quality of an image and reduces noise level[14]. The wavelet transform due to their excellent local-ization property, have evolved into an indispensable imageprocessing tool in compression and denoising and thereforepreserving the image characteristics making use of waveletthreshold proposed by Donoho [15].
Other than wavelet transform there is fourier transform.In some application, there is a need to know the frequencyand temporal information at the same time. In conventionalfourier transform, we use sinusoids for basic functions.It can only provide the frequency information. Temporalinformation is lost in this transformation process [14]. Sothe proposed model is implemented using wavelet transformin two dimensions in processing the image. Images canbe decomposed into four parts by two-dimensional wavelettransform. In fact, the decomposition can continue until thesize of the sub-image is as small as we want. The image isdecomposed using Haar wavelet, which is one of the oldestand simplest type which provides prototype for all otherwavelet transforms. Haar transform decomposes the discretesignals into two sub-signals of half in which one sub-signalis a running average or trend and other sub-signal is runningdifference or fluctuation. The advantage of Haar wavelet isthat it is fast, memory efficient and conceptually simple [14].
Original satellite images could be segmented by groupingthe pixels into clusters to perform cluster analysis. Thereforethe result of image segmentation is a set of segments thatcollectively cover the entire image, or a set of contours
Proceedings of the World Congress on Engineering and Computer Science 2014 Vol I WCECS 2014, 22-24 October, 2014, San Francisco, USA
ISBN: 978-988-19252-0-6 ISSN: 2078-0958 (Print); ISSN: 2078-0966 (Online)
WCECS 2014
extracted from the image. Each of the pixels in a regionis similar with respect to some characteristic or computedproperty, such as color, intensity, or texture [16]. Clusteringwas carried out using MATLAB with image processing toolbox, which provide image segmentation algorithms, tools anda comprehensive environment for data analysis, visualizationand algorithm development. Satellite image which containsdifferent textures such as water body, forests, grass, asphalt,barren lands, concrete and clouds etc., have different pixelvalues shown in Table II.
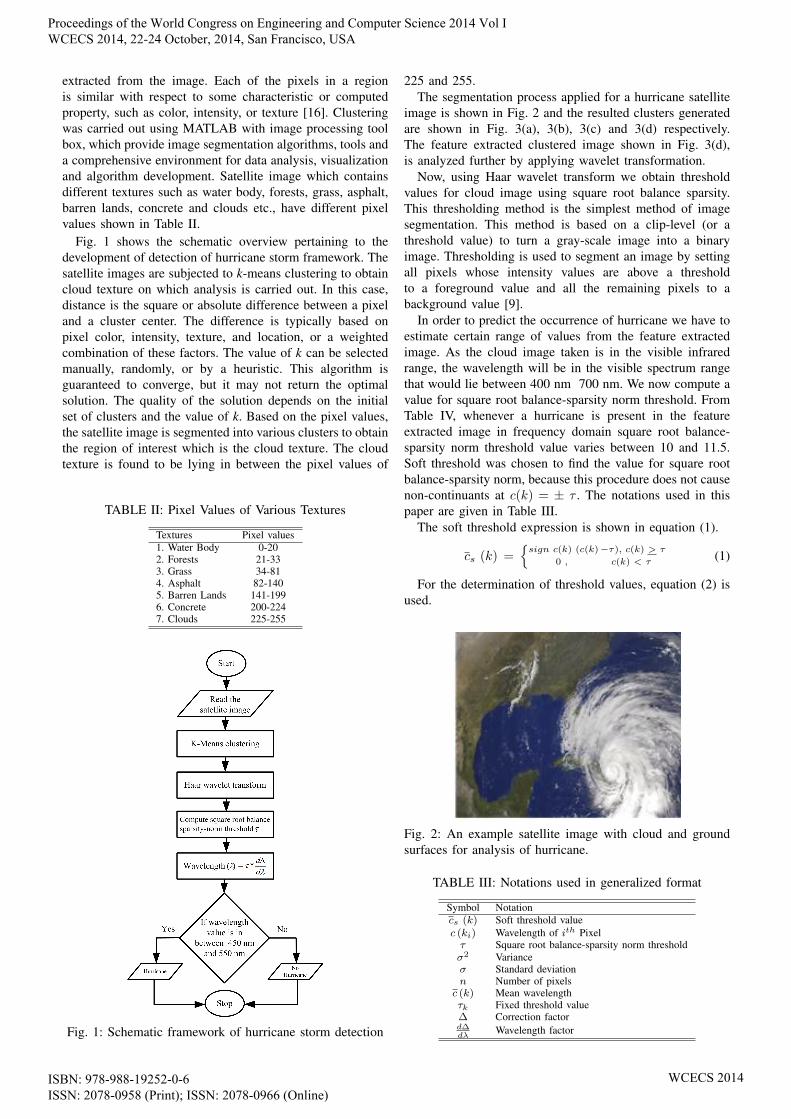
Fig. 1 shows the schematic overview pertaining to thedevelopment of detection of hurricane storm framework. Thesatellite images are subjected to k-means clustering to obtaincloud texture on which analysis is carried out. In this case,distance is the square or absolute difference between a pixeland a cluster center. The difference is typically based onpixel color, intensity, texture, and location, or a weightedcombination of these factors. The value of k can be selectedmanually, randomly, or by a heuristic. This algorithm isguaranteed to converge, but it may not return the optimalsolution. The quality of the solution depends on the initialset of clusters and the value of k. Based on the pixel values,the satellite image is segmented into various clusters to obtainthe region of interest which is the cloud texture. The cloudtexture is found to be lying in between the pixel values of
TABLE II: Pixel Values of Various Textures
Textures Pixel values1. Water Body 0-202. Forests 21-333. Grass 34-814. Asphalt 82-1405. Barren Lands 141-1996. Concrete 200-2247. Clouds 225-255
Fig. 1: Schematic framework of hurricane storm detection
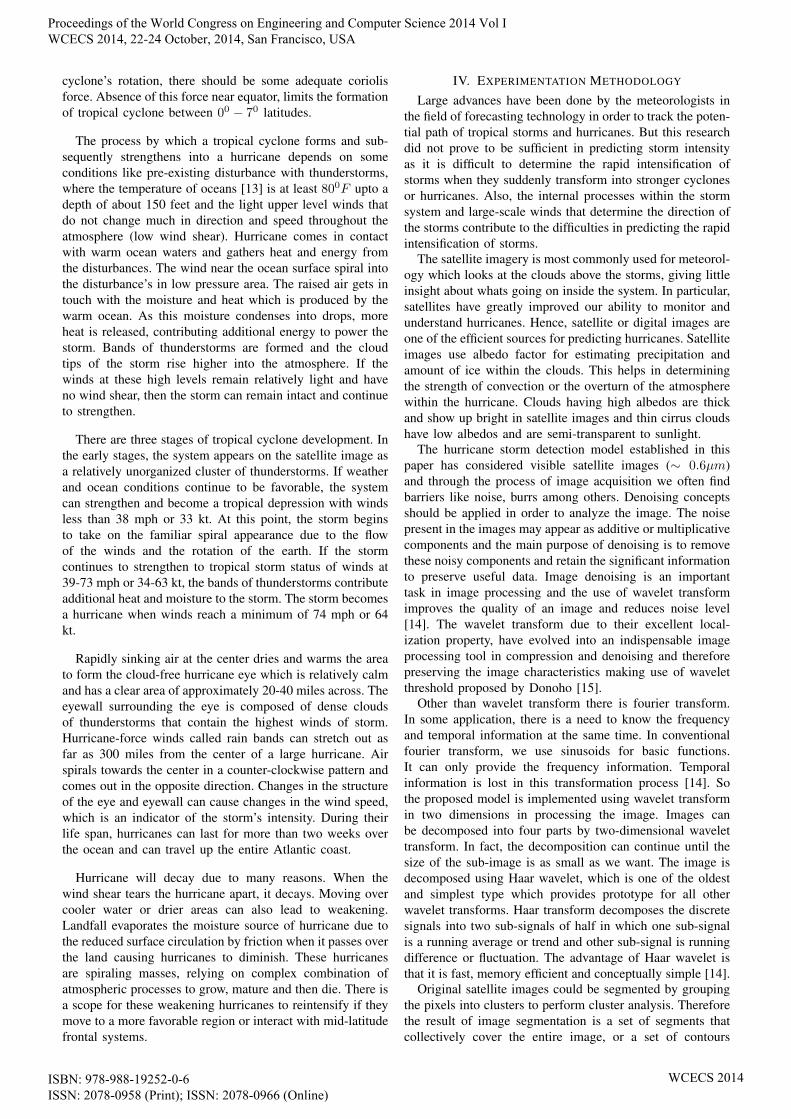
225 and 255.The segmentation process applied for a hurricane satellite
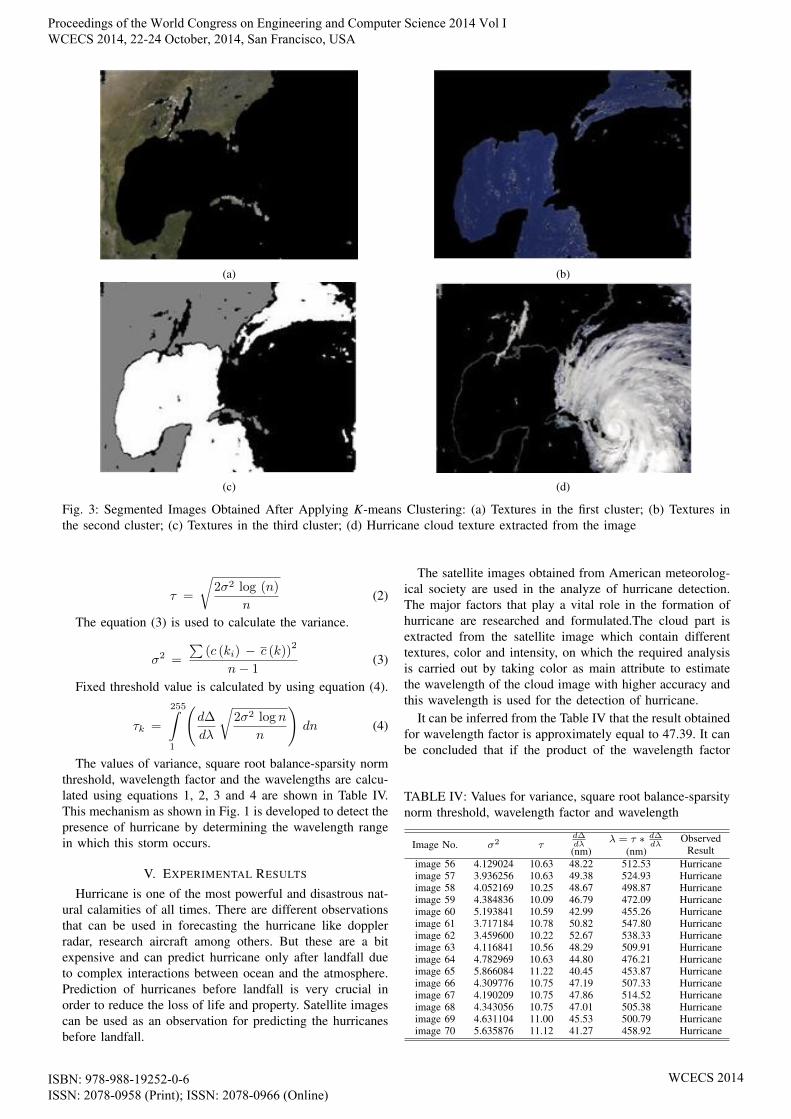
image is shown in Fig. 2 and the resulted clusters generatedare shown in Fig. 3(a), 3(b), 3(c) and 3(d) respectively.The feature extracted clustered image shown in Fig. 3(d),is analyzed further by applying wavelet transformation.
Now, using Haar wavelet transform we obtain thresholdvalues for cloud image using square root balance sparsity.This thresholding method is the simplest method of imagesegmentation. This method is based on a clip-level (or athreshold value) to turn a gray-scale image into a binaryimage. Thresholding is used to segment an image by settingall pixels whose intensity values are above a thresholdto a foreground value and all the remaining pixels to abackground value [9].
In order to predict the occurrence of hurricane we have toestimate certain range of values from the feature extractedimage. As the cloud image taken is in the visible infraredrange, the wavelength will be in the visible spectrum rangethat would lie between 400 nm 700 nm. We now compute avalue for square root balance-sparsity norm threshold. FromTable IV, whenever a hurricane is present in the featureextracted image in frequency domain square root balance-sparsity norm threshold value varies between 10 and 11.5.Soft threshold was chosen to find the value for square rootbalance-sparsity norm, because this procedure does not causenon-continuants at c(k) = ± τ . The notations used in thispaper are given in Table III.
The soft threshold expression is shown in equation (1).
cs (k) ={sign c(k) (c(k)−τ), c(k) > τ
0 , c(k) < τ (1)
For the determination of threshold values, equation (2) isused.
Fig. 2: An example satellite image with cloud and groundsurfaces for analysis of hurricane.
TABLE III: Notations used in generalized format
Symbol Notationcs (k) Soft threshold valuec (ki) Wavelength of ith Pixelτ Square root balance-sparsity norm thresholdσ2 Varianceσ Standard deviationn Number of pixels
c (k) Mean wavelengthτk Fixed threshold value∆ Correction factord∆dλ
Wavelength factor
Proceedings of the World Congress on Engineering and Computer Science 2014 Vol I WCECS 2014, 22-24 October, 2014, San Francisco, USA
ISBN: 978-988-19252-0-6 ISSN: 2078-0958 (Print); ISSN: 2078-0966 (Online)
WCECS 2014
(a) (b)
(c) (d)
Fig. 3: Segmented Images Obtained After Applying K-means Clustering: (a) Textures in the first cluster; (b) Textures inthe second cluster; (c) Textures in the third cluster; (d) Hurricane cloud texture extracted from the image
τ =
√2σ2 log (n)
n(2)
The equation (3) is used to calculate the variance.
σ2 =
∑(c (ki) − c (k))
2
n− 1(3)
Fixed threshold value is calculated by using equation (4).
τk =
255∫1
(d∆
dλ
√2σ2 log n
n
)dn (4)
The values of variance, square root balance-sparsity normthreshold, wavelength factor and the wavelengths are calcu-lated using equations 1, 2, 3 and 4 are shown in Table IV.This mechanism as shown in Fig. 1 is developed to detect thepresence of hurricane by determining the wavelength rangein which this storm occurs.
V. EXPERIMENTAL RESULTS
Hurricane is one of the most powerful and disastrous nat-ural calamities of all times. There are different observationsthat can be used in forecasting the hurricane like dopplerradar, research aircraft among others. But these are a bitexpensive and can predict hurricane only after landfall dueto complex interactions between ocean and the atmosphere.Prediction of hurricanes before landfall is very crucial inorder to reduce the loss of life and property. Satellite imagescan be used as an observation for predicting the hurricanesbefore landfall.
The satellite images obtained from American meteorolog-ical society are used in the analyze of hurricane detection.The major factors that play a vital role in the formation ofhurricane are researched and formulated.The cloud part isextracted from the satellite image which contain differenttextures, color and intensity, on which the required analysisis carried out by taking color as main attribute to estimatethe wavelength of the cloud image with higher accuracy andthis wavelength is used for the detection of hurricane.
It can be inferred from the Table IV that the result obtainedfor wavelength factor is approximately equal to 47.39. It canbe concluded that if the product of the wavelength factor
TABLE IV: Values for variance, square root balance-sparsitynorm threshold, wavelength factor and wavelength
Image No. σ2 τd∆dλ(nm)
λ = τ ∗ d∆dλ
(nm)Observed
Resultimage 56 4.129024 10.63 48.22 512.53 Hurricaneimage 57 3.936256 10.63 49.38 524.93 Hurricaneimage 58 4.052169 10.25 48.67 498.87 Hurricaneimage 59 4.384836 10.09 46.79 472.09 Hurricaneimage 60 5.193841 10.59 42.99 455.26 Hurricaneimage 61 3.717184 10.78 50.82 547.80 Hurricaneimage 62 3.459600 10.22 52.67 538.33 Hurricaneimage 63 4.116841 10.56 48.29 509.91 Hurricaneimage 64 4.782969 10.63 44.80 476.21 Hurricaneimage 65 5.866084 11.22 40.45 453.87 Hurricaneimage 66 4.309776 10.75 47.19 507.33 Hurricaneimage 67 4.190209 10.75 47.86 514.52 Hurricaneimage 68 4.343056 10.75 47.01 505.38 Hurricaneimage 69 4.631104 11.00 45.53 500.79 Hurricaneimage 70 5.635876 11.12 41.27 458.92 Hurricane
Proceedings of the World Congress on Engineering and Computer Science 2014 Vol I WCECS 2014, 22-24 October, 2014, San Francisco, USA
ISBN: 978-988-19252-0-6 ISSN: 2078-0958 (Print); ISSN: 2078-0966 (Online)
WCECS 2014
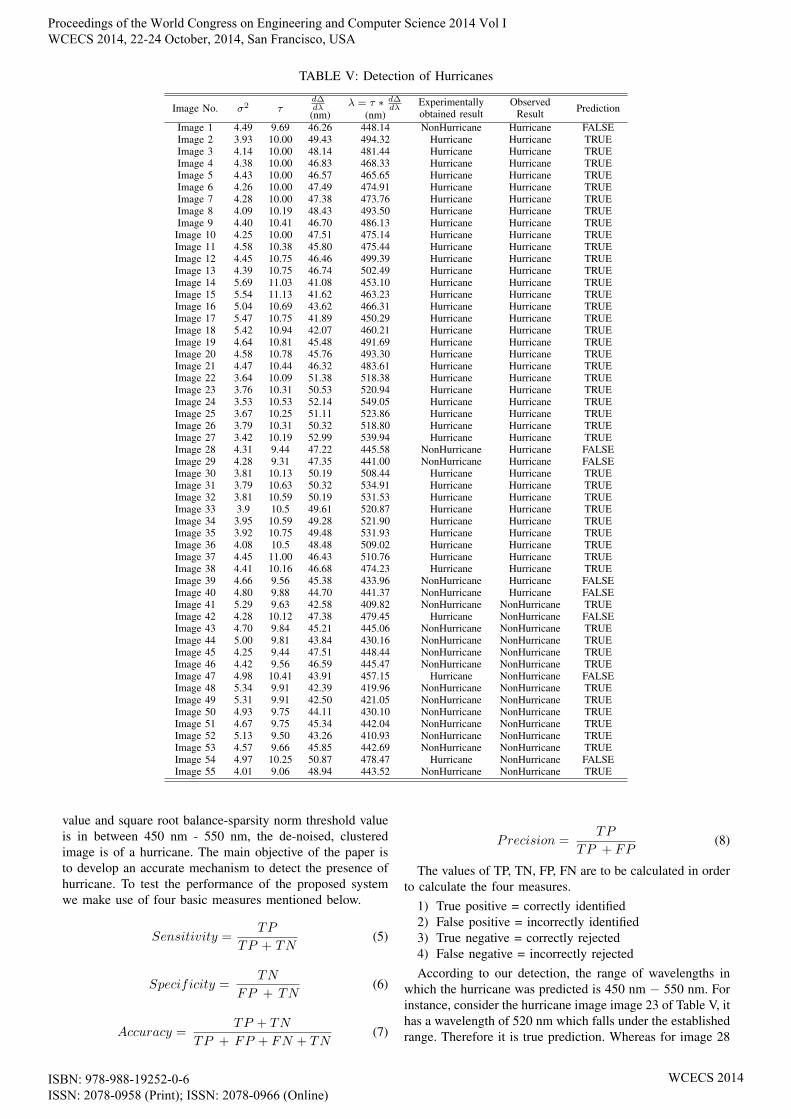
TABLE V: Detection of Hurricanes
Image No. σ2 τd∆dλ(nm)
λ = τ ∗ d∆dλ
(nm)Experimentallyobtained result
ObservedResult Prediction
Image 1 4.49 9.69 46.26 448.14 NonHurricane Hurricane FALSEImage 2 3.93 10.00 49.43 494.32 Hurricane Hurricane TRUEImage 3 4.14 10.00 48.14 481.44 Hurricane Hurricane TRUEImage 4 4.38 10.00 46.83 468.33 Hurricane Hurricane TRUEImage 5 4.43 10.00 46.57 465.65 Hurricane Hurricane TRUEImage 6 4.26 10.00 47.49 474.91 Hurricane Hurricane TRUEImage 7 4.28 10.00 47.38 473.76 Hurricane Hurricane TRUEImage 8 4.09 10.19 48.43 493.50 Hurricane Hurricane TRUEImage 9 4.40 10.41 46.70 486.13 Hurricane Hurricane TRUE
Image 10 4.25 10.00 47.51 475.14 Hurricane Hurricane TRUEImage 11 4.58 10.38 45.80 475.44 Hurricane Hurricane TRUEImage 12 4.45 10.75 46.46 499.39 Hurricane Hurricane TRUEImage 13 4.39 10.75 46.74 502.49 Hurricane Hurricane TRUEImage 14 5.69 11.03 41.08 453.10 Hurricane Hurricane TRUEImage 15 5.54 11.13 41.62 463.23 Hurricane Hurricane TRUEImage 16 5.04 10.69 43.62 466.31 Hurricane Hurricane TRUEImage 17 5.47 10.75 41.89 450.29 Hurricane Hurricane TRUEImage 18 5.42 10.94 42.07 460.21 Hurricane Hurricane TRUEImage 19 4.64 10.81 45.48 491.69 Hurricane Hurricane TRUEImage 20 4.58 10.78 45.76 493.30 Hurricane Hurricane TRUEImage 21 4.47 10.44 46.32 483.61 Hurricane Hurricane TRUEImage 22 3.64 10.09 51.38 518.38 Hurricane Hurricane TRUEImage 23 3.76 10.31 50.53 520.94 Hurricane Hurricane TRUEImage 24 3.53 10.53 52.14 549.05 Hurricane Hurricane TRUEImage 25 3.67 10.25 51.11 523.86 Hurricane Hurricane TRUEImage 26 3.79 10.31 50.32 518.80 Hurricane Hurricane TRUEImage 27 3.42 10.19 52.99 539.94 Hurricane Hurricane TRUEImage 28 4.31 9.44 47.22 445.58 NonHurricane Hurricane FALSEImage 29 4.28 9.31 47.35 441.00 NonHurricane Hurricane FALSEImage 30 3.81 10.13 50.19 508.44 Hurricane Hurricane TRUEImage 31 3.79 10.63 50.32 534.91 Hurricane Hurricane TRUEImage 32 3.81 10.59 50.19 531.53 Hurricane Hurricane TRUEImage 33 3.9 10.5 49.61 520.87 Hurricane Hurricane TRUEImage 34 3.95 10.59 49.28 521.90 Hurricane Hurricane TRUEImage 35 3.92 10.75 49.48 531.93 Hurricane Hurricane TRUEImage 36 4.08 10.5 48.48 509.02 Hurricane Hurricane TRUEImage 37 4.45 11.00 46.43 510.76 Hurricane Hurricane TRUEImage 38 4.41 10.16 46.68 474.23 Hurricane Hurricane TRUEImage 39 4.66 9.56 45.38 433.96 NonHurricane Hurricane FALSEImage 40 4.80 9.88 44.70 441.37 NonHurricane Hurricane FALSEImage 41 5.29 9.63 42.58 409.82 NonHurricane NonHurricane TRUEImage 42 4.28 10.12 47.38 479.45 Hurricane NonHurricane FALSEImage 43 4.70 9.84 45.21 445.06 NonHurricane NonHurricane TRUEImage 44 5.00 9.81 43.84 430.16 NonHurricane NonHurricane TRUEImage 45 4.25 9.44 47.51 448.44 NonHurricane NonHurricane TRUEImage 46 4.42 9.56 46.59 445.47 NonHurricane NonHurricane TRUEImage 47 4.98 10.41 43.91 457.15 Hurricane NonHurricane FALSEImage 48 5.34 9.91 42.39 419.96 NonHurricane NonHurricane TRUEImage 49 5.31 9.91 42.50 421.05 NonHurricane NonHurricane TRUEImage 50 4.93 9.75 44.11 430.10 NonHurricane NonHurricane TRUEImage 51 4.67 9.75 45.34 442.04 NonHurricane NonHurricane TRUEImage 52 5.13 9.50 43.26 410.93 NonHurricane NonHurricane TRUEImage 53 4.57 9.66 45.85 442.69 NonHurricane NonHurricane TRUEImage 54 4.97 10.25 50.87 478.47 Hurricane NonHurricane FALSEImage 55 4.01 9.06 48.94 443.52 NonHurricane NonHurricane TRUE
value and square root balance-sparsity norm threshold valueis in between 450 nm - 550 nm, the de-noised, clusteredimage is of a hurricane. The main objective of the paper isto develop an accurate mechanism to detect the presence ofhurricane. To test the performance of the proposed systemwe make use of four basic measures mentioned below.
Sensitivity =TP
TP + TN(5)
Specificity =TN
FP + TN(6)
Accuracy =TP + TN
TP + FP + FN + TN(7)
Precision =TP
TP + FP(8)
The values of TP, TN, FP, FN are to be calculated in orderto calculate the four measures.
1) True positive = correctly identified2) False positive = incorrectly identified3) True negative = correctly rejected4) False negative = incorrectly rejectedAccording to our detection, the range of wavelengths in
which the hurricane was predicted is 450 nm − 550 nm. Forinstance, consider the hurricane image image 23 of Table V, ithas a wavelength of 520 nm which falls under the establishedrange. Therefore it is true prediction. Whereas for image 28
Proceedings of the World Congress on Engineering and Computer Science 2014 Vol I WCECS 2014, 22-24 October, 2014, San Francisco, USA
ISBN: 978-988-19252-0-6 ISSN: 2078-0958 (Print); ISSN: 2078-0966 (Online)
WCECS 2014
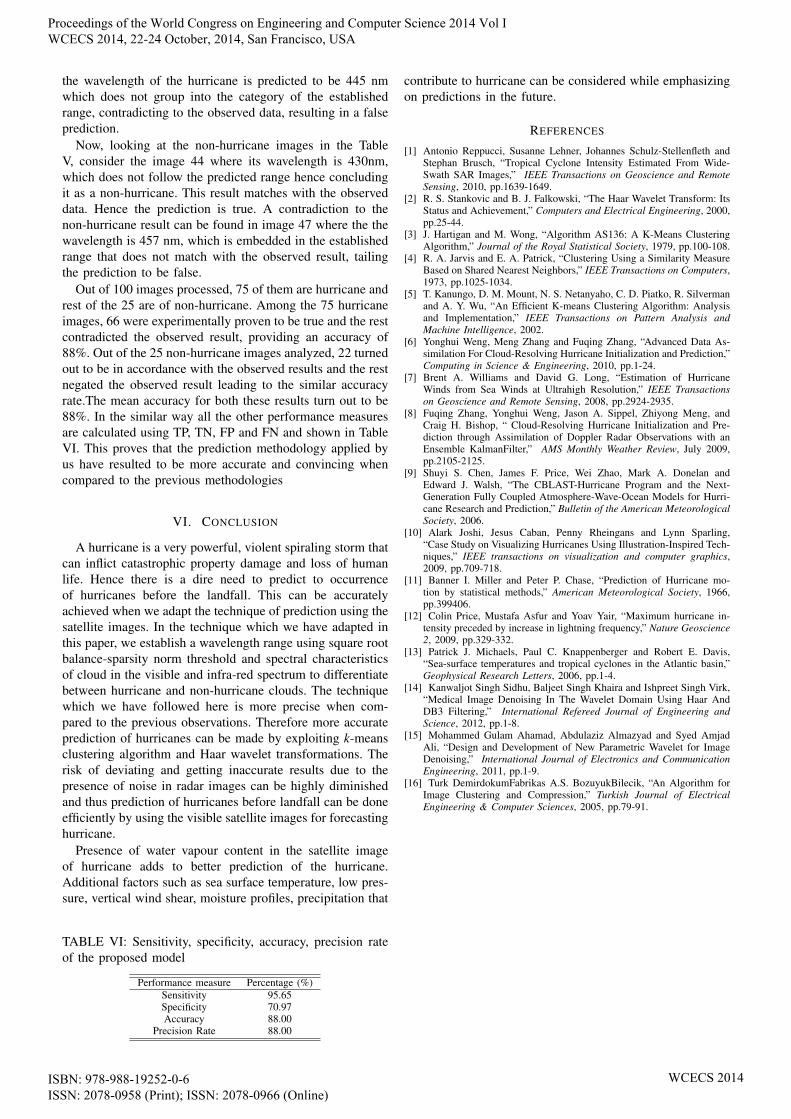
the wavelength of the hurricane is predicted to be 445 nmwhich does not group into the category of the establishedrange, contradicting to the observed data, resulting in a falseprediction.
Now, looking at the non-hurricane images in the TableV, consider the image 44 where its wavelength is 430nm,which does not follow the predicted range hence concludingit as a non-hurricane. This result matches with the observeddata. Hence the prediction is true. A contradiction to thenon-hurricane result can be found in image 47 where the thewavelength is 457 nm, which is embedded in the establishedrange that does not match with the observed result, tailingthe prediction to be false.
Out of 100 images processed, 75 of them are hurricane andrest of the 25 are of non-hurricane. Among the 75 hurricaneimages, 66 were experimentally proven to be true and the restcontradicted the observed result, providing an accuracy of88%. Out of the 25 non-hurricane images analyzed, 22 turnedout to be in accordance with the observed results and the restnegated the observed result leading to the similar accuracyrate.The mean accuracy for both these results turn out to be88%. In the similar way all the other performance measuresare calculated using TP, TN, FP and FN and shown in TableVI. This proves that the prediction methodology applied byus have resulted to be more accurate and convincing whencompared to the previous methodologies
VI. CONCLUSION
A hurricane is a very powerful, violent spiraling storm thatcan inflict catastrophic property damage and loss of humanlife. Hence there is a dire need to predict to occurrenceof hurricanes before the landfall. This can be accuratelyachieved when we adapt the technique of prediction using thesatellite images. In the technique which we have adapted inthis paper, we establish a wavelength range using square rootbalance-sparsity norm threshold and spectral characteristicsof cloud in the visible and infra-red spectrum to differentiatebetween hurricane and non-hurricane clouds. The techniquewhich we have followed here is more precise when com-pared to the previous observations. Therefore more accurateprediction of hurricanes can be made by exploiting k-meansclustering algorithm and Haar wavelet transformations. Therisk of deviating and getting inaccurate results due to thepresence of noise in radar images can be highly diminishedand thus prediction of hurricanes before landfall can be doneefficiently by using the visible satellite images for forecastinghurricane.
Presence of water vapour content in the satellite imageof hurricane adds to better prediction of the hurricane.Additional factors such as sea surface temperature, low pres-sure, vertical wind shear, moisture profiles, precipitation that
TABLE VI: Sensitivity, specificity, accuracy, precision rateof the proposed model
Performance measure Percentage (%)Sensitivity 95.65Specificity 70.97Accuracy 88.00
Precision Rate 88.00
contribute to hurricane can be considered while emphasizingon predictions in the future.
REFERENCES
[1] Antonio Reppucci, Susanne Lehner, Johannes Schulz-Stellenfleth andStephan Brusch, “Tropical Cyclone Intensity Estimated From Wide-Swath SAR Images,” IEEE Transactions on Geoscience and RemoteSensing, 2010, pp.1639-1649.
[2] R. S. Stankovic and B. J. Falkowski, “The Haar Wavelet Transform: ItsStatus and Achievement,” Computers and Electrical Engineering, 2000,pp.25-44.
[3] J. Hartigan and M. Wong, “Algorithm AS136: A K-Means ClusteringAlgorithm,” Journal of the Royal Statistical Society, 1979, pp.100-108.
[4] R. A. Jarvis and E. A. Patrick, “Clustering Using a Similarity MeasureBased on Shared Nearest Neighbors,” IEEE Transactions on Computers,1973, pp.1025-1034.
[5] T. Kanungo, D. M. Mount, N. S. Netanyaho, C. D. Piatko, R. Silvermanand A. Y. Wu, “An Efficient K-means Clustering Algorithm: Analysisand Implementation,” IEEE Transactions on Pattern Analysis andMachine Intelligence, 2002.
[6] Yonghui Weng, Meng Zhang and Fuqing Zhang, “Advanced Data As-similation For Cloud-Resolving Hurricane Initialization and Prediction,”Computing in Science & Engineering, 2010, pp.1-24.
[7] Brent A. Williams and David G. Long, “Estimation of HurricaneWinds from Sea Winds at Ultrahigh Resolution,” IEEE Transactionson Geoscience and Remote Sensing, 2008, pp.2924-2935.
[8] Fuqing Zhang, Yonghui Weng, Jason A. Sippel, Zhiyong Meng, andCraig H. Bishop, “ Cloud-Resolving Hurricane Initialization and Pre-diction through Assimilation of Doppler Radar Observations with anEnsemble KalmanFilter,” AMS Monthly Weather Review, July 2009,pp.2105-2125.
[9] Shuyi S. Chen, James F. Price, Wei Zhao, Mark A. Donelan andEdward J. Walsh, “The CBLAST-Hurricane Program and the Next-Generation Fully Coupled Atmosphere-Wave-Ocean Models for Hurri-cane Research and Prediction,” Bulletin of the American MeteorologicalSociety, 2006.
[10] Alark Joshi, Jesus Caban, Penny Rheingans and Lynn Sparling,“Case Study on Visualizing Hurricanes Using Illustration-Inspired Tech-niques,” IEEE transactions on visualization and computer graphics,2009, pp.709-718.
[11] Banner I. Miller and Peter P. Chase, “Prediction of Hurricane mo-tion by statistical methods,” American Meteorological Society, 1966,pp.399406.
[12] Colin Price, Mustafa Asfur and Yoav Yair, “Maximum hurricane in-tensity preceded by increase in lightning frequency,” Nature Geoscience2, 2009, pp.329-332.
[13] Patrick J. Michaels, Paul C. Knappenberger and Robert E. Davis,“Sea-surface temperatures and tropical cyclones in the Atlantic basin,”Geophysical Research Letters, 2006, pp.1-4.
[14] Kanwaljot Singh Sidhu, Baljeet Singh Khaira and Ishpreet Singh Virk,“Medical Image Denoising In The Wavelet Domain Using Haar AndDB3 Filtering,” International Refereed Journal of Engineering andScience, 2012, pp.1-8.
[15] Mohammed Gulam Ahamad, Abdulaziz Almazyad and Syed AmjadAli, “Design and Development of New Parametric Wavelet for ImageDenoising,” International Journal of Electronics and CommunicationEngineering, 2011, pp.1-9.
[16] Turk DemirdokumFabrikas A.S. BozuyukBilecik, “An Algorithm forImage Clustering and Compression,” Turkish Journal of ElectricalEngineering & Computer Sciences, 2005, pp.79-91.
Proceedings of the World Congress on Engineering and Computer Science 2014 Vol I WCECS 2014, 22-24 October, 2014, San Francisco, USA
ISBN: 978-988-19252-0-6 ISSN: 2078-0958 (Print); ISSN: 2078-0966 (Online)
WCECS 2014