real estate in a digital age
TRANSCRIPT
Courtesy CENTURY 21 Four Seasons Select Properties
Introduction In 1964, 40 percent of home buyers read newspaper ads to find a home and seven percent drove
around looking for an open house. In 2014, 43 percent looked for properties online first.
The world we live in today is a digital one and searching for a home is no different. Buyers now
have apps that let them search by location and neighborhoods. Online listings have virtual tours so
viewers can look at a bunch of potential homes while narrowing down their search to a select few in
the effort to save time. Online searching maximizes the ability to compare and contrast homes on
the market by selected features. Most of this is done before a potential home buyer connects with a
real estate agent.
Also in 1964, 61 percent of home buyers contacted agents they knew. In 2014, buyers worked with
an agent 87 percent of the time to find their home, so trust in a REALTOR® is still king. While the
initial process may start online, home buyers turn to the advice from a trusted real estate agent.
The difference is that home buyers are entering the process more educated about the market before
they speak to a home seller or an agent.
In addition to the home buying process, REALTORS® also utilize technology in their everyday
business practices. Staying up to date with new technology is important, but also cited as one of
the biggest challenges for firms in the next two years.
Over 90 percent of real estate firms have websites, and the most common feature on their websites
were property listings. Along with web use, REALTORS® are also using their mobile devices for a
multitude of different activities, with the primary being to communicate with their clients. In the
Real Estate in a Digital Age report, we examine the process home buyers go through in the initial
online search and how REALTORS® are connecting with customers in the digital space.
How Buyers Use Technology in
the Home Search Process Section 1
Sources: NAR Home Buyer and Seller Generational Trends Report 2015 & 2014 Profile of Home Buyers and Sellers
A Day in the Life of a Home Buyer
How Home Buyers find a home …
The typical buyer used a mobile device to search for
properties online. S/he looked at websites with photos, home listings, and information about the home buying process. S/he then contacted an agent and visited a median of 10 homes over 10 weeks in 2014 before purchasing a home.
The typical home buyers is a Millennial 25-35 years old, married without children living at home, and has a median income of $84,500.
Sources: NAR Home Buyer and Seller Generational Trends Report 2015 & 2014 Profile of Home Buyers and Sellers
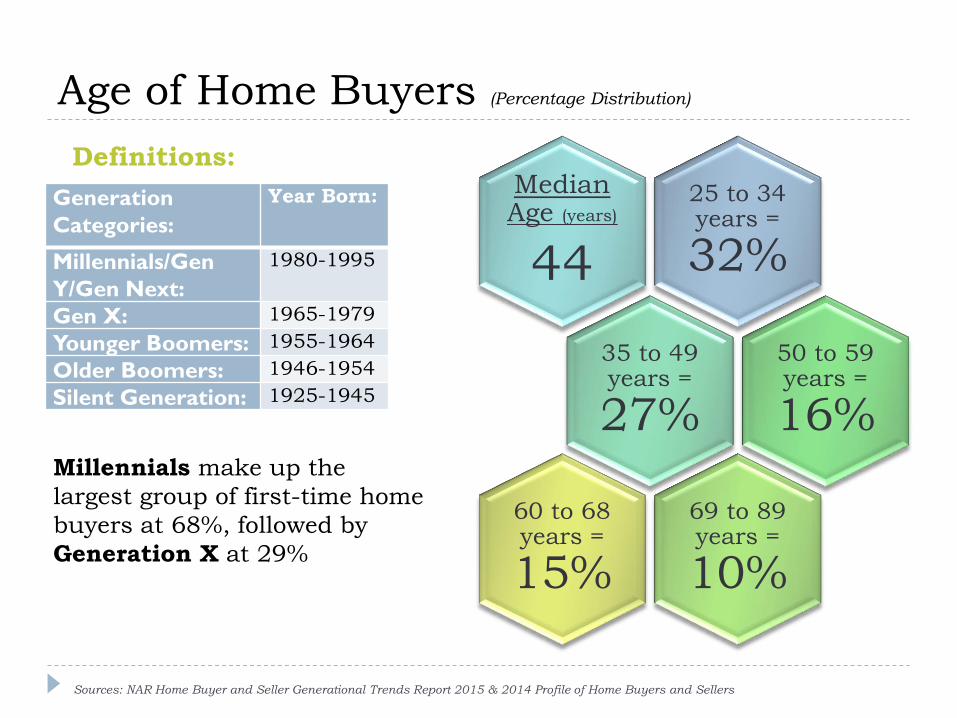
Age of Home Buyers (Percentage Distribution)
25 to 34 years =
32%
Median Age (years)
44
35 to 49 years =
27%
50 to 59 years =
16%
69 to 89 years =
10%
60 to 68 years =
15%
Sources: NAR Home Buyer and Seller Generational Trends Report 2015 & 2014 Profile of Home Buyers and Sellers
Generation
Categories:
Year Born:
Millennials/Gen
Y/Gen Next:
1980-1995
Gen X: 1965-1979
Younger Boomers: 1955-1964
Older Boomers: 1946-1954
Silent Generation: 1925-1945
Millennials make up the
largest group of first-time home
buyers at 68%, followed by
Generation X at 29%
Definitions:
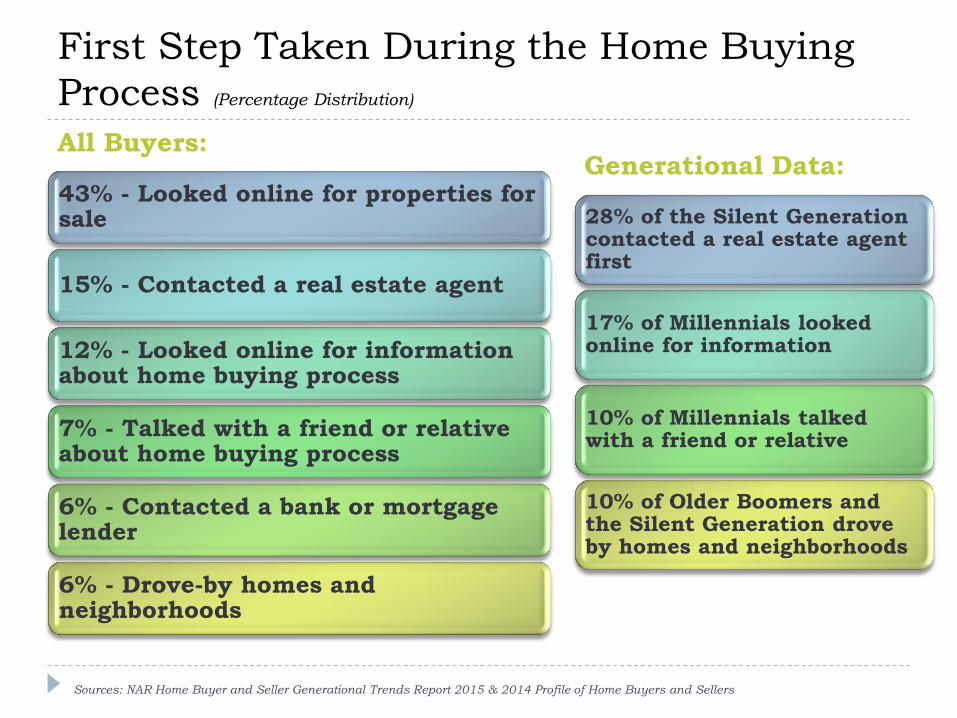
First Step Taken During the Home Buying
Process (Percentage Distribution)
43% - Looked online for properties for sale
15% - Contacted a real estate agent
12% - Looked online for information about home buying process
7% - Talked with a friend or relative about home buying process
6% - Contacted a bank or mortgage lender
6% - Drove-by homes and neighborhoods
Sources: NAR Home Buyer and Seller Generational Trends Report 2015 & 2014 Profile of Home Buyers and Sellers
28% of the Silent Generation contacted a real estate agent first
17% of Millennials looked online for information
10% of Millennials talked with a friend or relative
10% of Older Boomers and the Silent Generation drove by homes and neighborhoods
Generational Data: All Buyers:
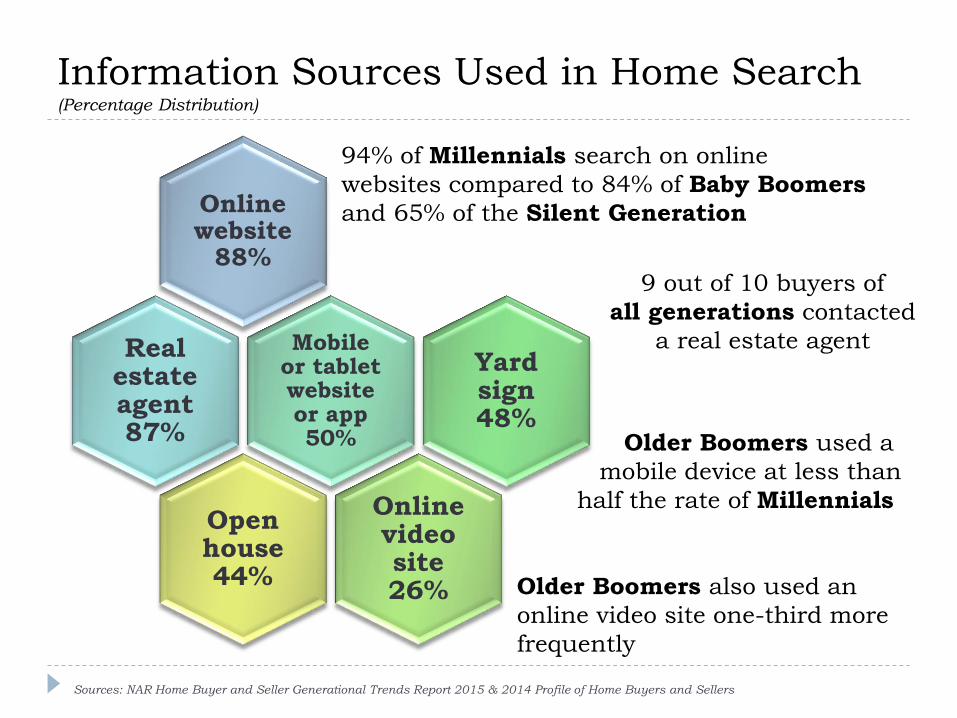
Information Sources Used in Home Search (Percentage Distribution)
Online website
88%
Real estate agent 87%
Mobile or tablet website or app 50%
Yard sign 48%
Online video site 26%
Open house 44%
Sources: NAR Home Buyer and Seller Generational Trends Report 2015 & 2014 Profile of Home Buyers and Sellers
94% of Millennials search on online
websites compared to 84% of Baby Boomers
and 65% of the Silent Generation
9 out of 10 buyers of
all generations contacted
a real estate agent
Older Boomers used a
mobile device at less than
half the rate of Millennials
Older Boomers also used an
online video site one-third more
frequently
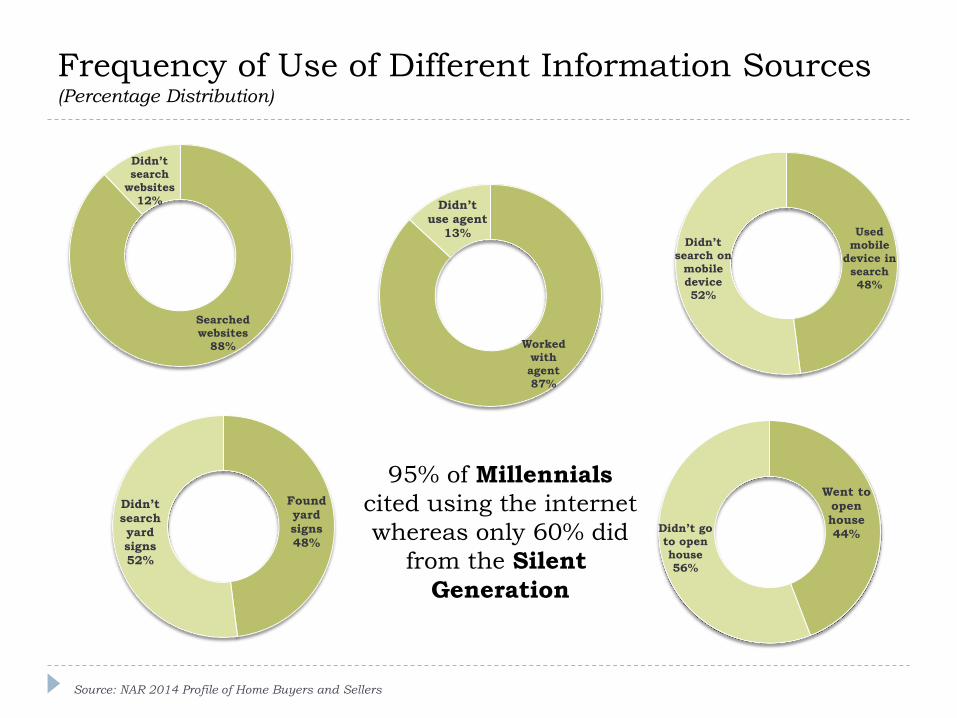
Frequency of Use of Different Information Sources (Percentage Distribution)
Source: NAR 2014 Profile of Home Buyers and Sellers
95% of Millennials
cited using the internet
whereas only 60% did
from the Silent
Generation
Searched websites
88%
Didn’t search
websites 12%
Worked with agent 87%
Didn’t use agent
13%
Found yard signs 48%
Didn’t
search yard signs 52%
Went to open house
44% Didn’t go to open house 56%
Used mobile
device in search 48%
Didn’t search on
mobile device 52%
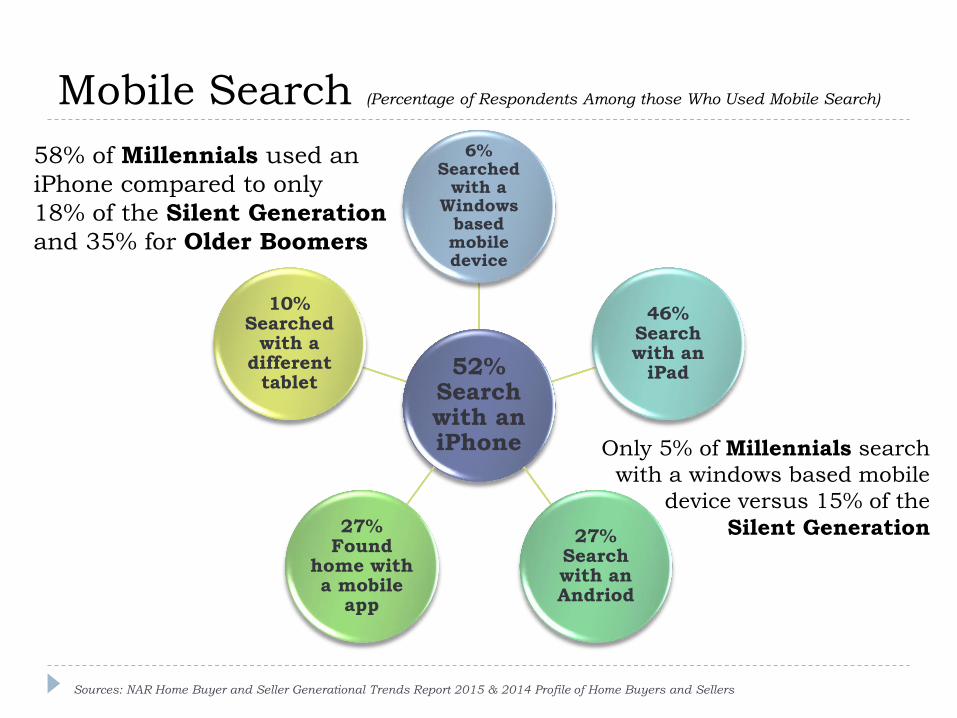
Mobile Search (Percentage of Respondents Among those Who Used Mobile Search)
52% Search with an iPhone
6% Searched
with a Windows
based mobile device
46% Search with an
iPad
27% Search with an Andriod
27% Found
home with a mobile
app
10% Searched
with a different
tablet
58% of Millennials used an
iPhone compared to only
18% of the Silent Generation
and 35% for Older Boomers
Only 5% of Millennials search
with a windows based mobile
device versus 15% of the
Silent Generation
Sources: NAR Home Buyer and Seller Generational Trends Report 2015 & 2014 Profile of Home Buyers and Sellers
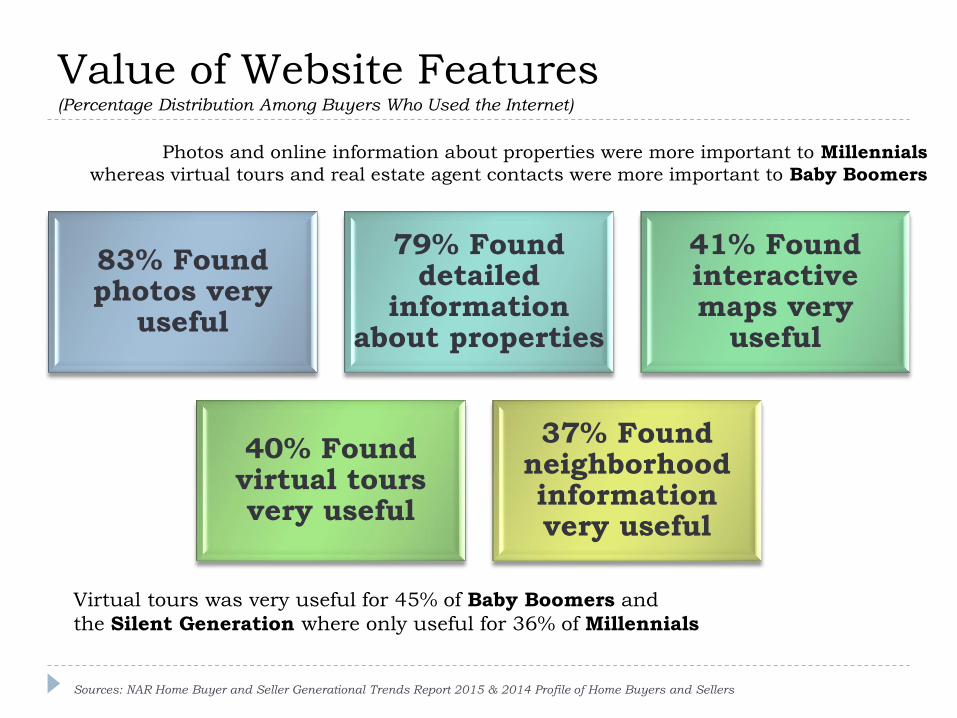
Value of Website Features (Percentage Distribution Among Buyers Who Used the Internet)
83% Found photos very
useful
79% Found detailed
information about properties
41% Found interactive maps very
useful
40% Found virtual tours very useful
37% Found neighborhood information very useful
Photos and online information about properties were more important to Millennials
whereas virtual tours and real estate agent contacts were more important to Baby Boomers
Virtual tours was very useful for 45% of Baby Boomers and
the Silent Generation where only useful for 36% of Millennials
Sources: NAR Home Buyer and Seller Generational Trends Report 2015 & 2014 Profile of Home Buyers and Sellers
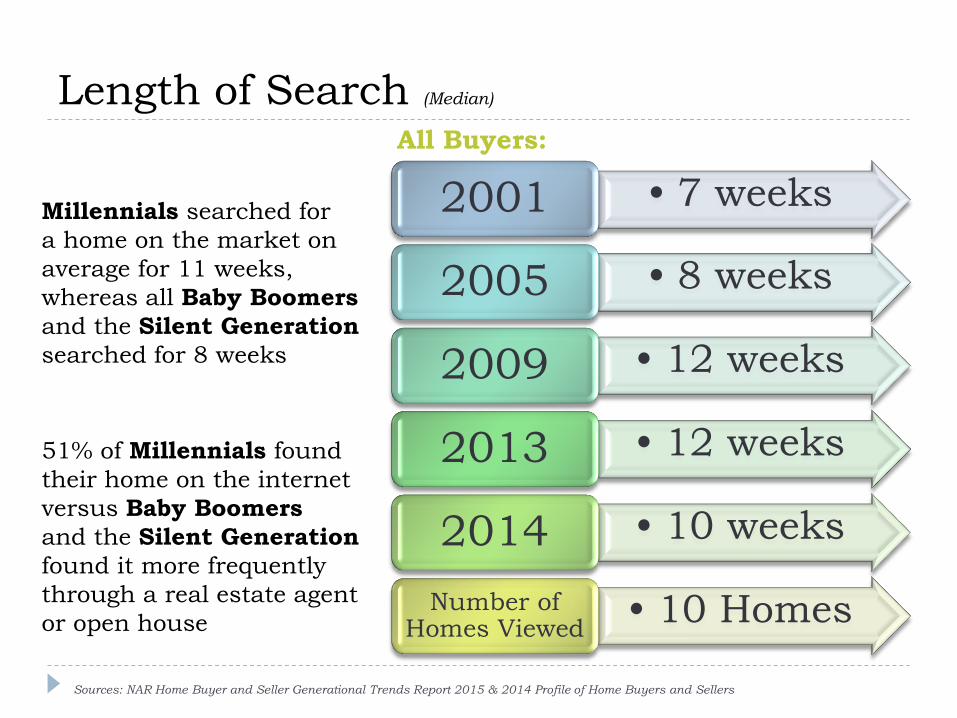
Length of Search (Median)
• 7 weeks 2001
• 8 weeks 2005
• 12 weeks 2009
• 12 weeks 2013
• 10 weeks 2014
• 10 Homes Number of Homes Viewed
Sources: NAR Home Buyer and Seller Generational Trends Report 2015 & 2014 Profile of Home Buyers and Sellers
All Buyers:
Millennials searched for
a home on the market on
average for 11 weeks,
whereas all Baby Boomers
and the Silent Generation
searched for 8 weeks
51% of Millennials found
their home on the internet
versus Baby Boomers
and the Silent Generation
found it more frequently
through a real estate agent
or open house
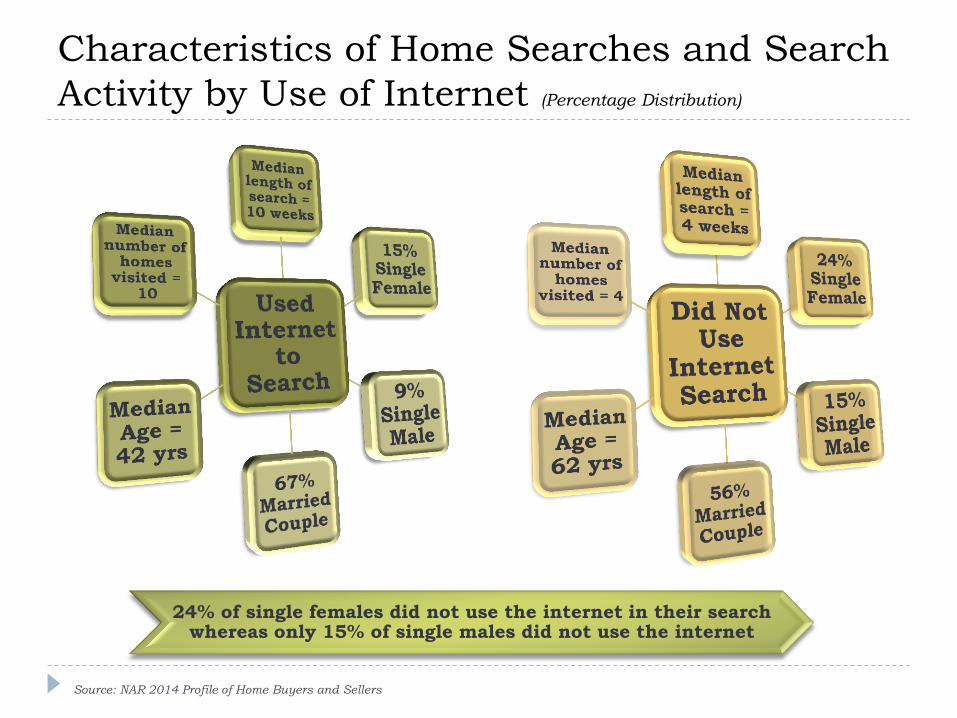
Characteristics of Home Searches and Search
Activity by Use of Internet (Percentage Distribution)
Source: NAR 2014 Profile of Home Buyers and Sellers
24% of single females did not use the internet in their search whereas only 15% of single males did not use the internet
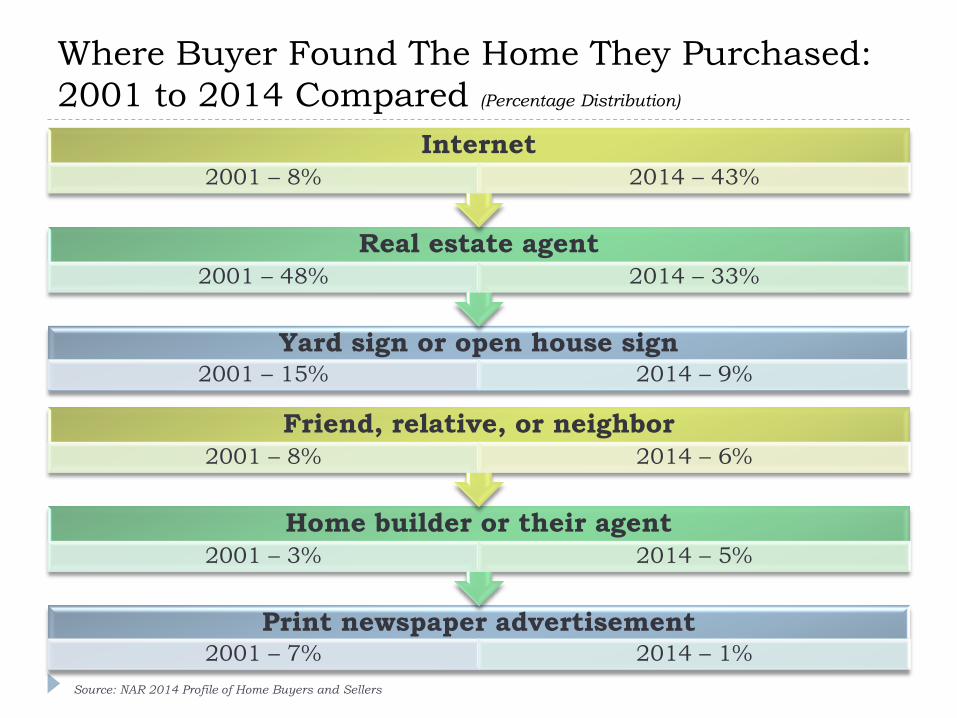
Where Buyer Found The Home They Purchased:
2001 to 2014 Compared (Percentage Distribution)
Yard sign or open house sign 2001 – 15% 2014 – 9%
Real estate agent 2001 – 48% 2014 – 33%
Internet 2001 – 8% 2014 – 43%
Print newspaper advertisement 2001 – 7% 2014 – 1%
Home builder or their agent 2001 – 3% 2014 – 5%
Friend, relative, or neighbor 2001 – 8% 2014 – 6%
Source: NAR 2014 Profile of Home Buyers and Sellers
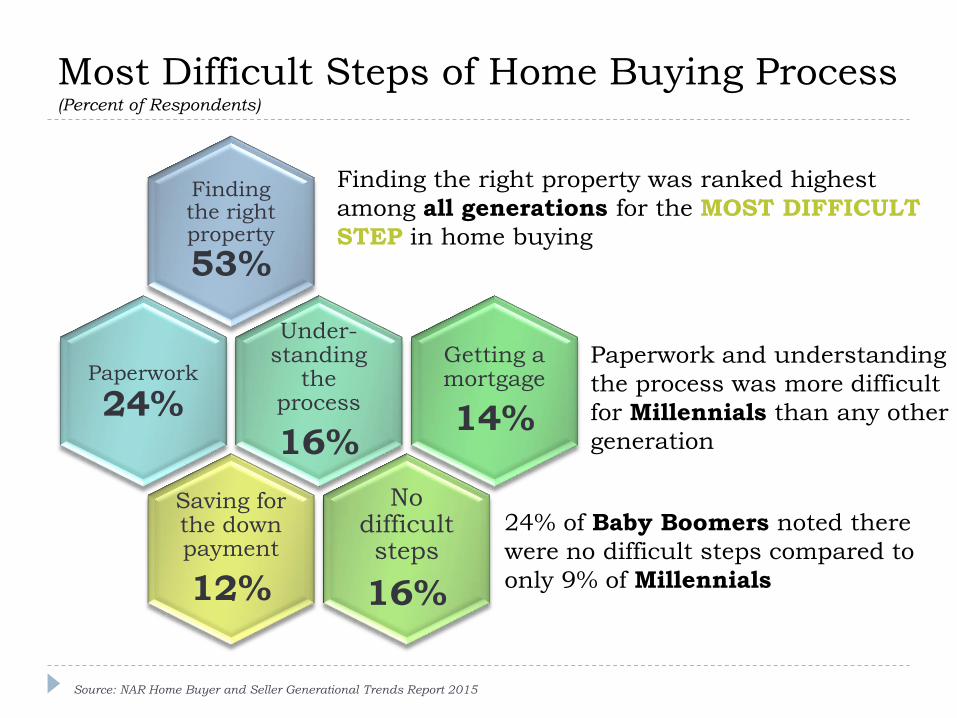
Most Difficult Steps of Home Buying Process (Percent of Respondents)
Finding the right property
53%
Paperwork
24%
Under-standing
the process
16%
Getting a mortgage
14%
No difficult steps
16%
Saving for the down payment
12%
24% of Baby Boomers noted there
were no difficult steps compared to
only 9% of Millennials
Paperwork and understanding
the process was more difficult
for Millennials than any other
generation
Source: NAR Home Buyer and Seller Generational Trends Report 2015
Finding the right property was ranked highest
among all generations for the MOST DIFFICULT
STEP in home buying

Satisfaction in Buying Process (Percentage Distribution)
A person’s satisfaction with the home buying process grows with age!
Source: NAR Home Buyer and Seller Generational Trends Report 2015
0%
10%
20%
30%
40%
50%
60%
70%
All Buyers 34 and younger 35 to 49 50 to 59 60 to 68 69 to 89
56%
52% 53%
59% 59%
68%
33%
37% 35%
28%
30%
24%
8% 8% 8% 9%
7% 5%
4% 3% 4% 4%
4% 3%
Very Satisfied Somewhat Satisfied Somewhat Dissatisfied Very Dissatisfied
The Utilization of Technology by
Real Estate Firms
Section 2
Sources: 2015 Profile of Real Estate Firms and 2015 Member Profile
REALTORS® Everyday Use of Technology
REALTORS® most often prefer to communicate with their
clients through email, at 93 percent. As well, 85 percent prefer
to communicate through text messaging, and 35 percent
through instant messaging.
Over 90 percent of REALTORS® are also using e-mail,
laptops/desk tops computers, and smartphones daily.
While members are taking advantage of the technology that is
available to them, one of the biggest challenges firms are facing
in the next two years is keeping up with technology.
Sources: 2015 Profile of Real Estate Firms and 2015 Member Profile
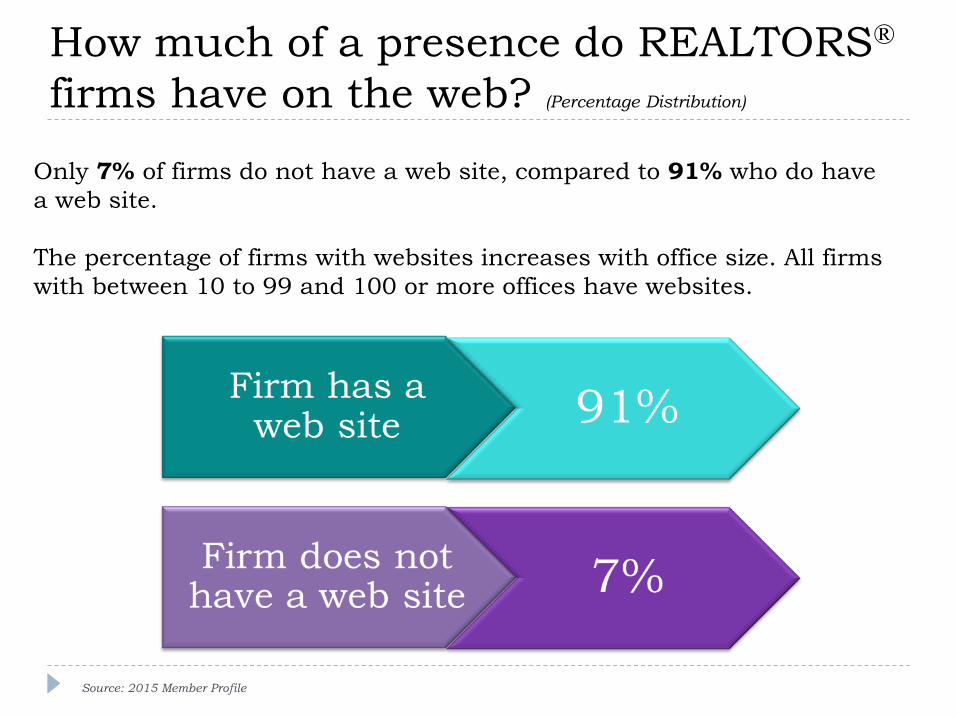
How much of a presence do REALTORS®
firms have on the web? (Percentage Distribution)
Only 7% of firms do not have a web site, compared to 91% who do have
a web site.
The percentage of firms with websites increases with office size. All firms
with between 10 to 99 and 100 or more offices have websites.
Source: 2015 Member Profile
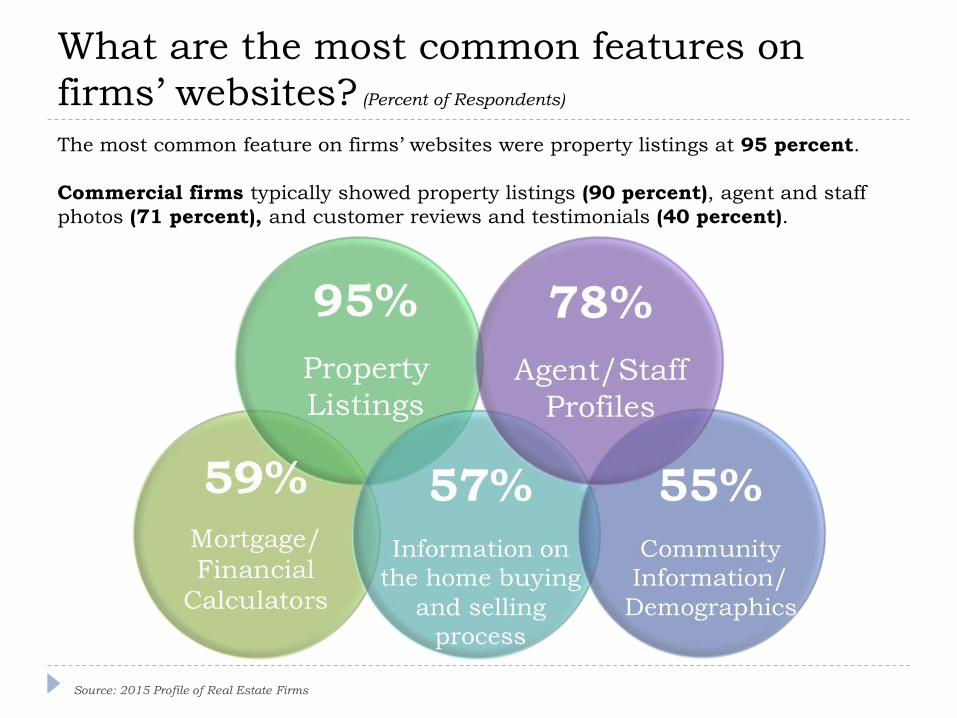
What are the most common features on
firms’ websites? (Percent of Respondents)
Source: 2015 Profile of Real Estate Firms
The most common feature on firms’ websites were property listings at 95 percent.
Commercial firms typically showed property listings (90 percent), agent and staff
photos (71 percent), and customer reviews and testimonials (40 percent).
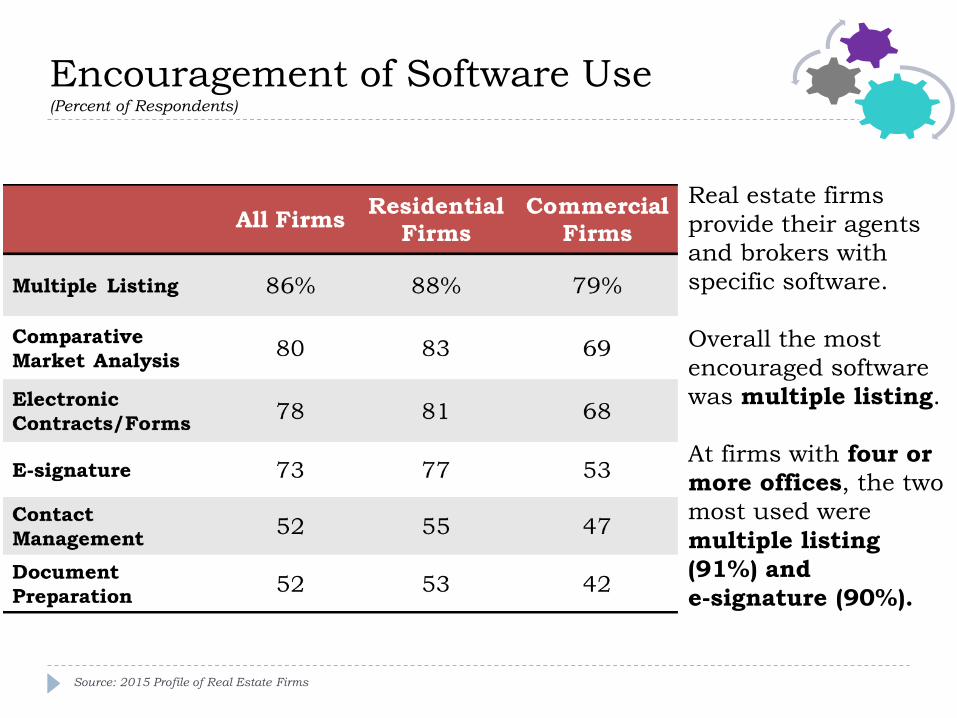
Encouragement of Software Use (Percent of Respondents)
Real estate firms
provide their agents
and brokers with
specific software.
Overall the most
encouraged software
was multiple listing.
At firms with four or
more offices, the two
most used were
multiple listing
(91%) and
e-signature (90%).
Source: 2015 Profile of Real Estate Firms
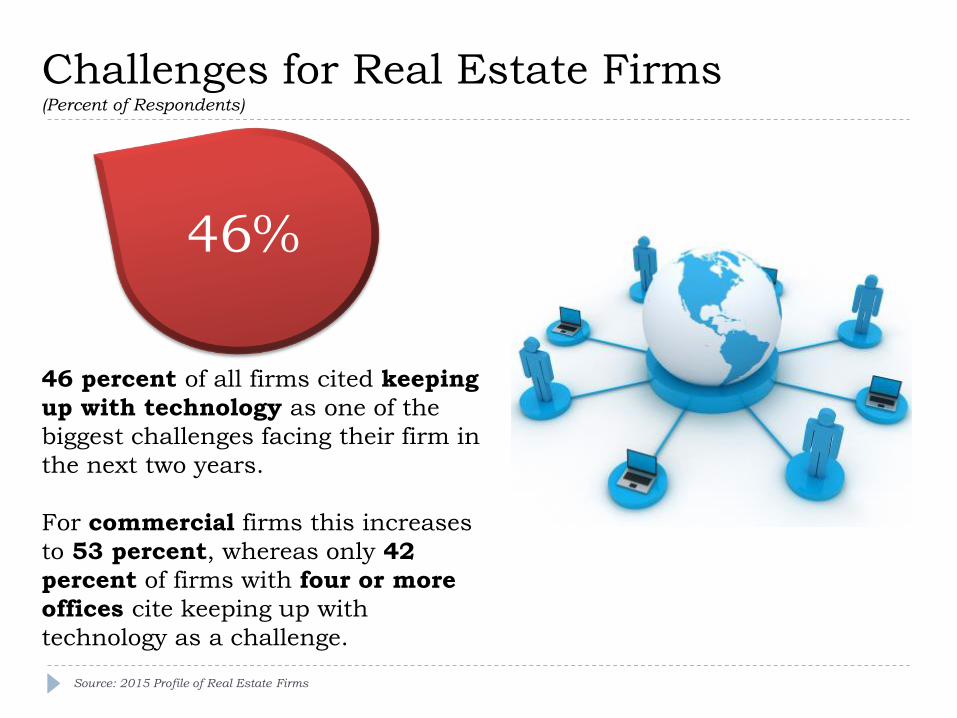
Challenges for Real Estate Firms (Percent of Respondents)
46 percent of all firms cited keeping
up with technology as one of the
biggest challenges facing their firm in
the next two years.
For commercial firms this increases
to 53 percent, whereas only 42
percent of firms with four or more
offices cite keeping up with
technology as a challenge.
Source: 2015 Profile of Real Estate Firms
46%
Trends and Demographics in
REALTOR® Technology Use
Section 3
Source: 2015 Member Profile
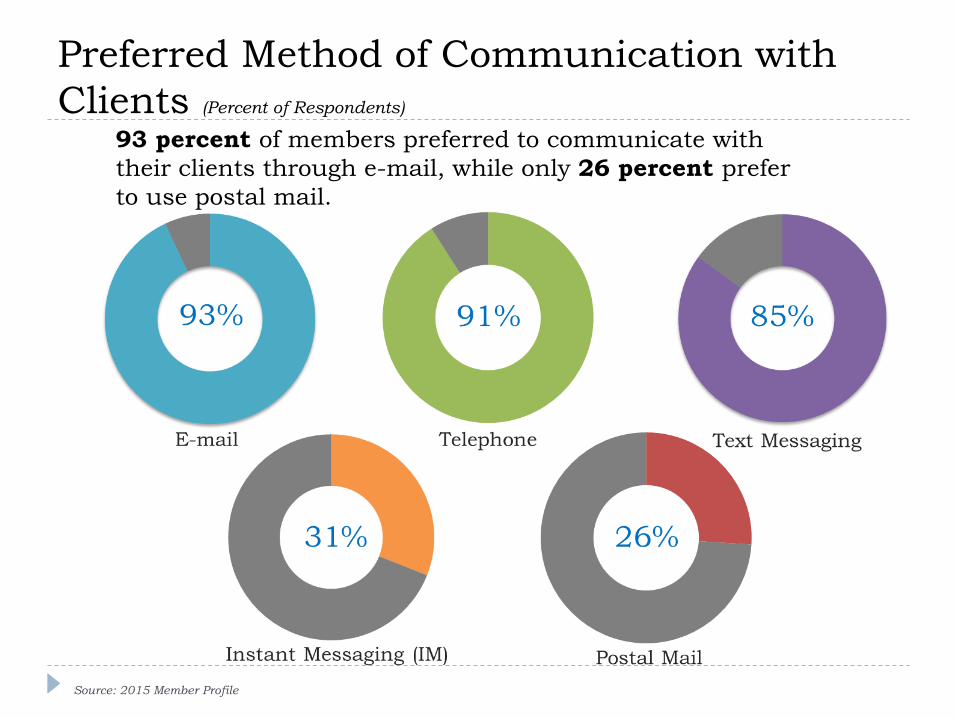
Preferred Method of Communication with
Clients (Percent of Respondents)
93 percent of members preferred to communicate with
their clients through e-mail, while only 26 percent prefer
to use postal mail.
Source: 2015 Member Profile
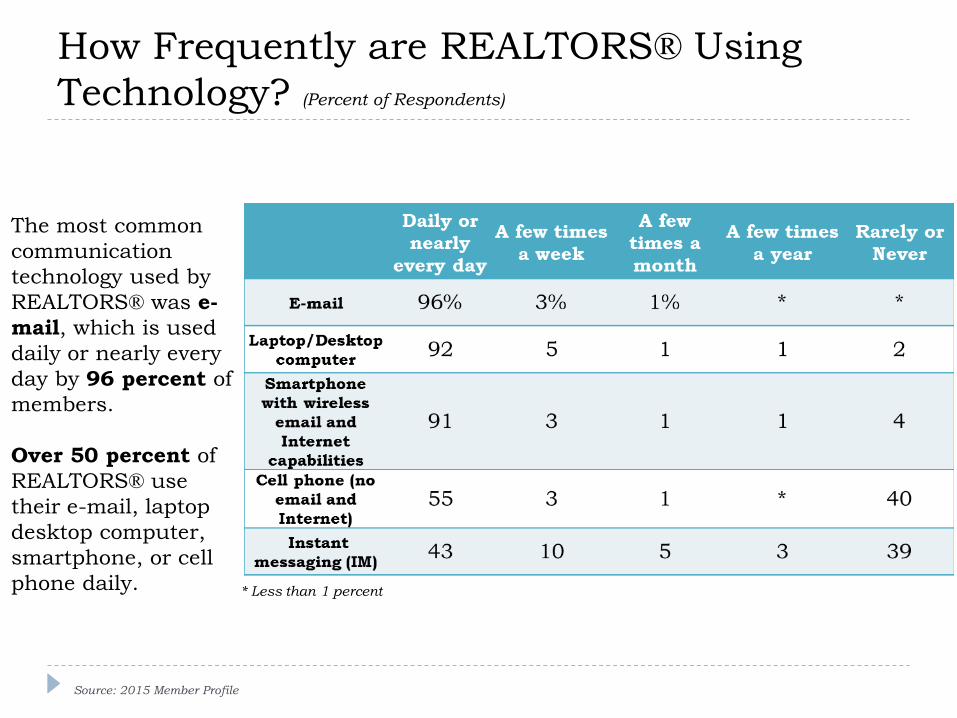
How Frequently are REALTORS® Using
Technology? (Percent of Respondents)
Source: 2015 Member Profile
* Less than 1 percent
The most common
communication
technology used by
REALTORS® was e-
mail, which is used
daily or nearly every
day by 96 percent of
members.
Over 50 percent of
REALTORS® use
their e-mail, laptop
desktop computer,
smartphone, or cell
phone daily.
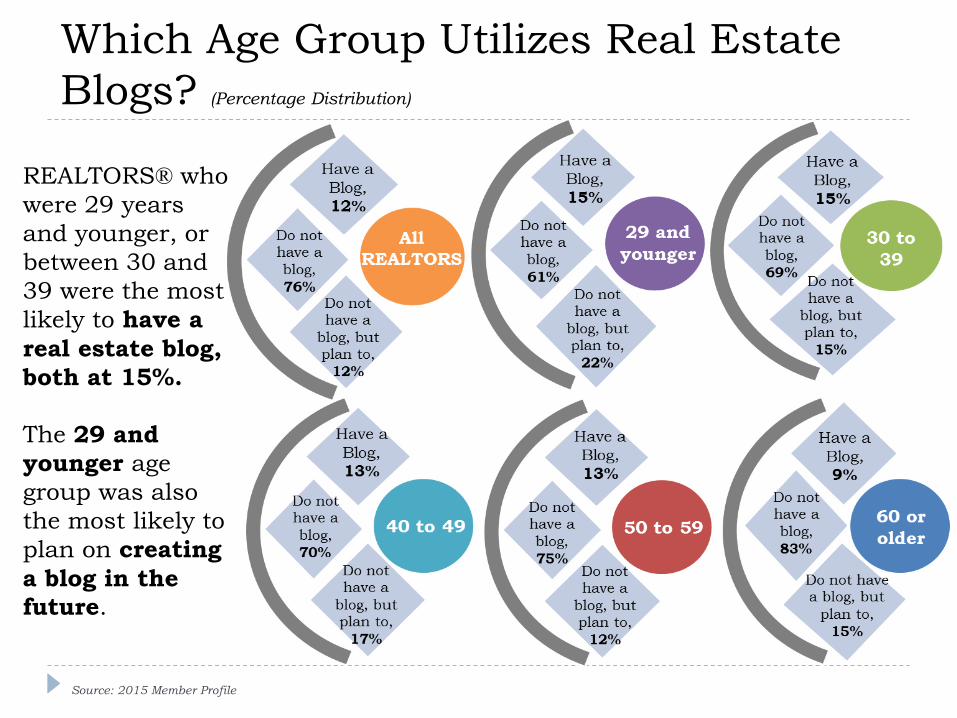
Which Age Group Utilizes Real Estate
Blogs? (Percentage Distribution)
REALTORS® who
were 29 years
and younger, or
between 30 and
39 were the most
likely to have a
real estate blog,
both at 15%.
The 29 and
younger age
group was also
the most likely to
plan on creating
a blog in the
future.
Source: 2015 Member Profile
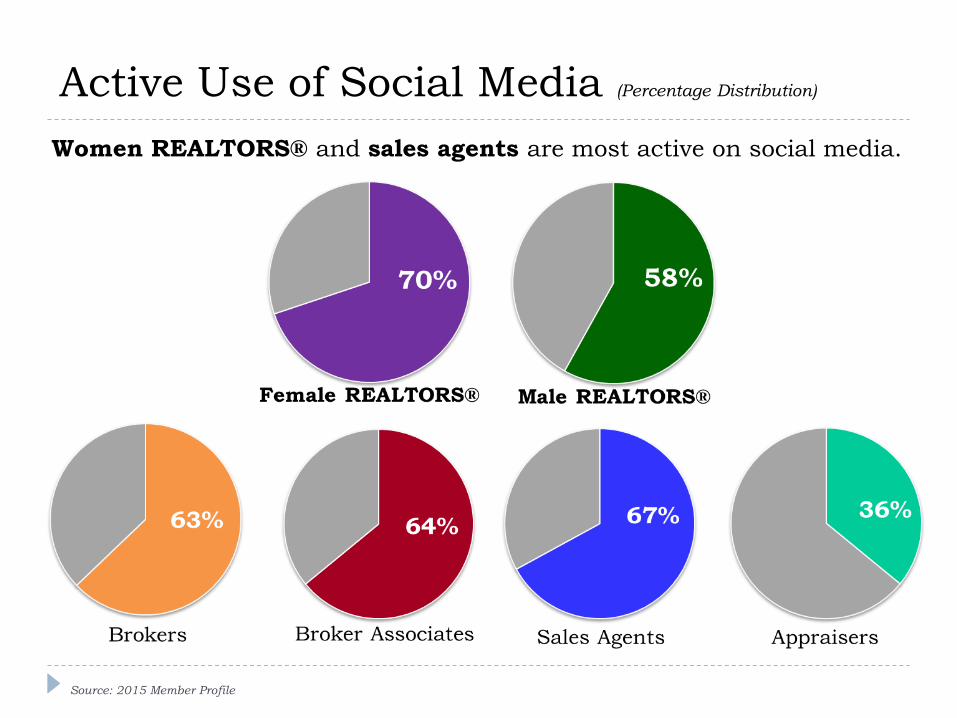
Active Use of Social Media (Percentage Distribution)
Women REALTORS® and sales agents are most active on social media.
Source: 2015 Member Profile
Keeping Up with Changing Trends
Section 4
Source: Center for REALTOR® Technology Survey
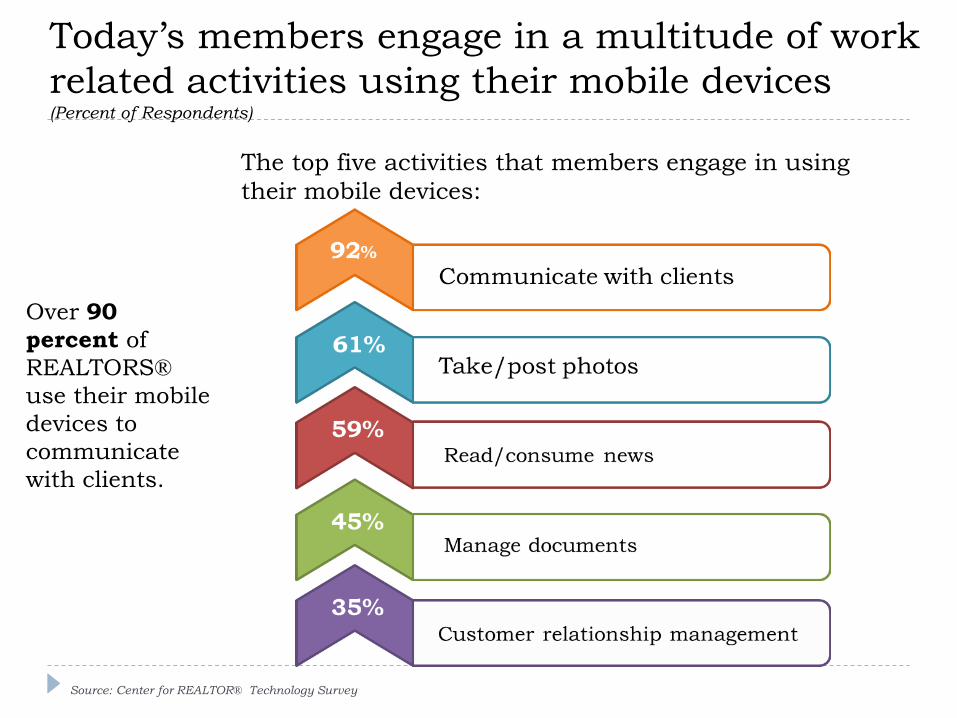
Today’s members engage in a multitude of work
related activities using their mobile devices (Percent of Respondents)
The top five activities that members engage in using
their mobile devices:
Source: Center for REALTOR® Technology Survey
Over 90
percent of
REALTORS®
use their mobile
devices to
communicate
with clients.
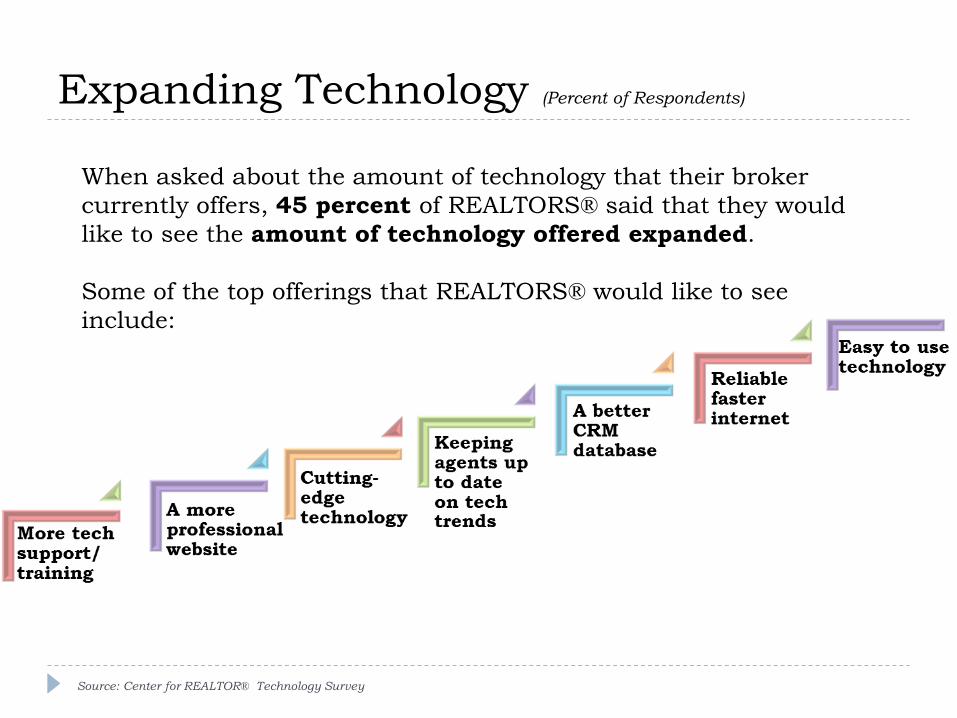
Expanding Technology (Percent of Respondents)
45%
When asked about the amount of technology that their broker
currently offers, 45 percent of REALTORS® said that they would
like to see the amount of technology offered expanded.
Some of the top offerings that REALTORS® would like to see
include:
Source: Center for REALTOR® Technology Survey
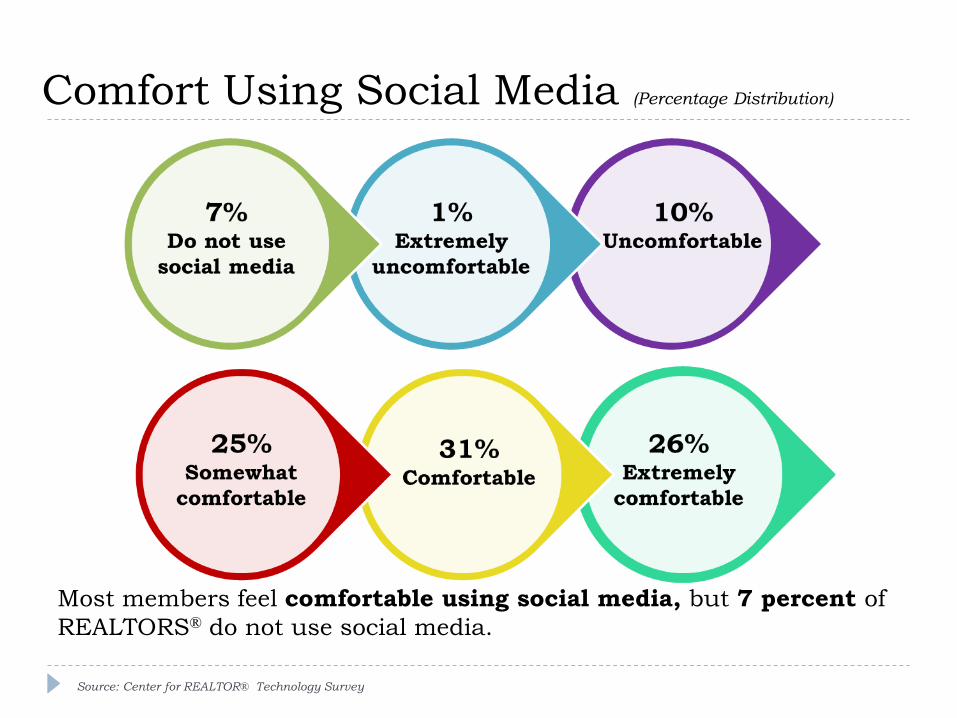
Comfort Using Social Media (Percentage Distribution)
Most members feel comfortable using social media, but 7 percent of
REALTORS® do not use social media.
Source: Center for REALTOR® Technology Survey
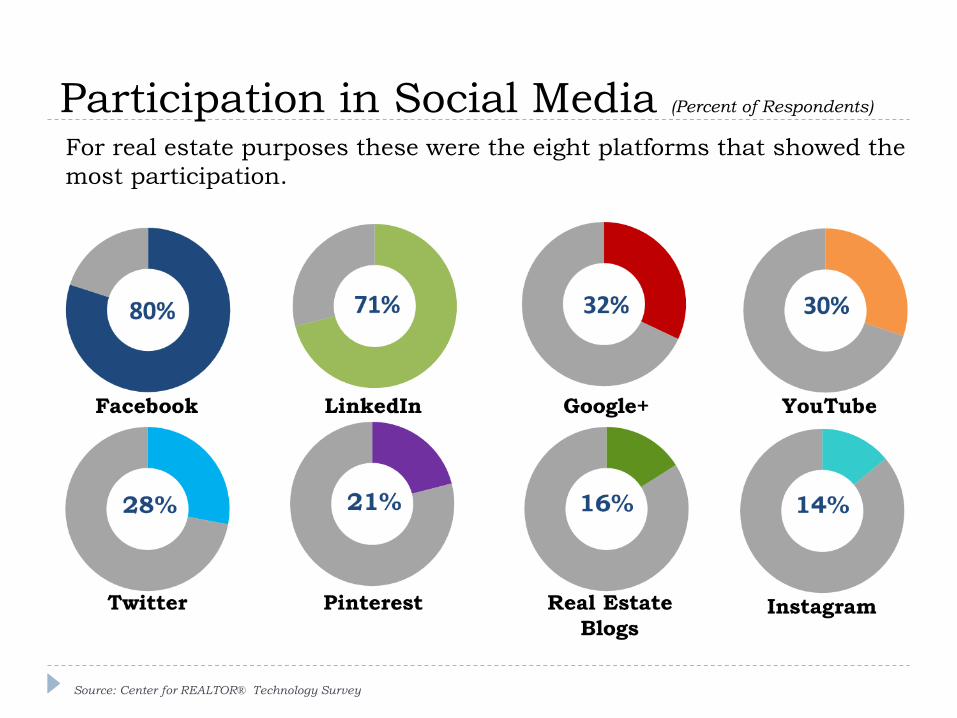
Participation in Social Media (Percent of Respondents)
Source: Center for REALTOR® Technology Survey
For real estate purposes these were the eight platforms that showed the
most participation.
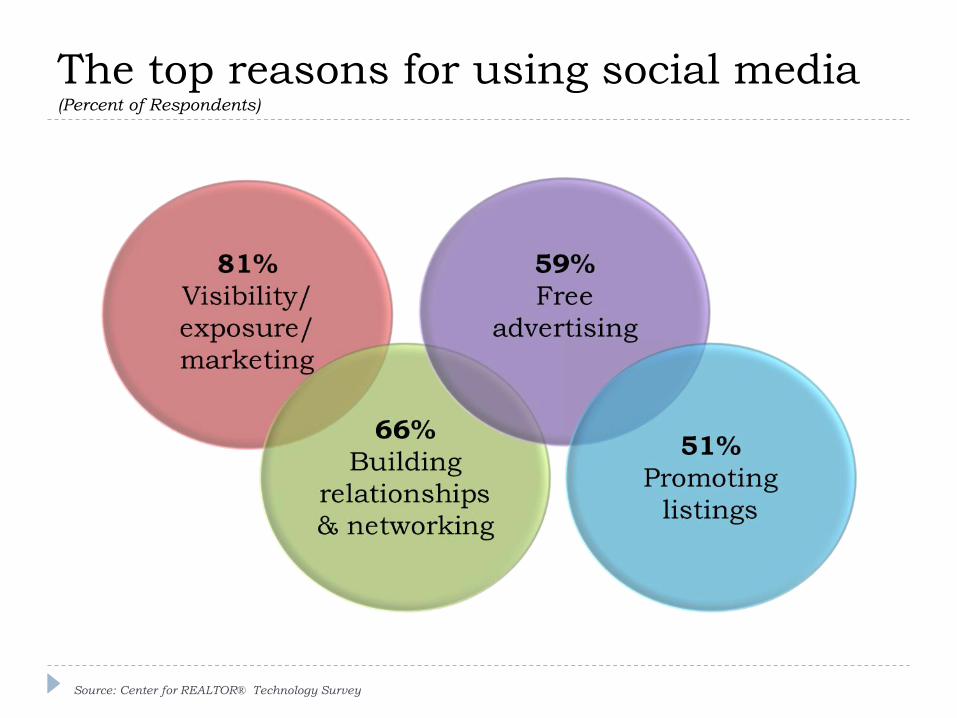
The top reasons for using social media (Percent of Respondents)
Source: Center for REALTOR® Technology Survey
NAR RESEARCH STAFF
Jessica Lautz
Director, Survey Research and Communications
Meredith Dunn
Research Communications Manager
Authors
Brandi Snowden
Research Survey Analyst
Amanda Riggs
Research Survey Analyst
September 2015