reading users’ minds from their eyes: a method for...
TRANSCRIPT

Copyright (c) 2011 IEEE. Personal use is permitted. For any other purposes, permission must be obtained from the IEEE by emailing [email protected].
This article has been accepted for publication in a future issue of this journal, but has not been fully edited. Content may change prior to final publication.
1
Reading Users’ Minds from Their Eyes: A
Method for Implicit Image AnnotationS. Navid Hajimirza, Michael J. Proulx, and Ebroul Izquierdo, Senior, IEEE
Abstract
This report explores the possible solutions for image annotation and retrieval by implicitly monitoring
user attention via eye-tracking. Features are extracted from the gaze trajectory of users examining sets
of images to provide implicit information on the target template that guides visual attention. Our Gaze
Inference System (GIS) is a fuzzy logic based framework thatanalyses the gaze-movement features to
assign a user interest level (UIL) from 0 to 1 to every image that appeared on the screen. Because
some properties of the gaze features are unique for every user, our user adaptive framework builds a
new processing system for every new user to achieve higher accuracy. The generated UILs can be used
for image annotation purposes however the output of our system is not limited as it can be used also
for retrieval or other scenarios. The developed framework produces promising and reliable UILs where
approximately 53% of target images in the users’ minds can beidentified by the machine with an error of
less than 20% and the top 10% of them with no error. We show in this paper that the existing information
in gaze patterns can be employed to improve the machine’s judgement of image content by assessment
of human interest and attention to the objects inside virtual environments.
Copyright (c) 2012 IEEE. Personal use of this material is permitted. However, permission to use this material for any other
purposes must be obtained from the IEEE by sending a request to [email protected].
Manuscript received September 14, 2011; revised January 16, 2012. This work was partially supported by the European
Commission under contract FP7-216444 PetaMedia. The associate editor coordinating the review of this manuscript and approving
it for publication was Prof. Shrikanth Narayanan.
S. N. Hajimirza is with the Multimedia and Vision Group, School of Electronics Engineering and Computer Science, Queen
Mary University of London, Tel: +44 (0)20 7882 7880,Fax. +44(020) 7882 7997, Email:[email protected]
M. Proulx is with the Biological and Experimental Psychology Group School of Biological and Chemical Sciences, Queen
Mary University of London, Tel:02078827484, Fax:02078827794, Email:[email protected]
E. Izquierdo is the head of Multimedia and Vision Group, School of Electronics Engineering and Computer Science,Queen
Mary University of London, Tel: +44 (0)20 7882 7880,Fax. +44(020) 7882 7997, Email:[email protected]
January 28, 2012 DRAFT
Copyright (c) 2011 IEEE. Personal use is permitted. For any other purposes, permission must be obtained from the IEEE by emailing [email protected].
This article has been accepted for publication in a future issue of this journal, but has not been fully edited. Content may change prior to final publication.
2
I. INTRODUCTION
The history of eye-tracking goes back to the 19th century when scientists tried to study the reading pro-
cess by direct observation [1], [2]. Along with the development of eye-tracking equipment, experimental
studies in psychology and engineering have taken advantageof this new form of implicit human feedback
opting for the day that every screen will have an affordable embedded eye-tracker. Some approaches to
exploit this implicit feedback can be found in [3]–[8]. In this paper we discuss the use of eye-trackers
for image annotation in the field of multimedia and vision to classify images as a function of the target
template that guides user visual attention implicitly, promptly and accurately.
By increasing the size of the visual databases specifically in distributed environments (such as social
networks like Facebook and image sharing websites like Flicker) the necessity has risen to annotate and
organize images with an undemanding, inexpensive and accurate method. There are three approaches for
image annotation [9], [10]: 1)Manual such as LabelMe [11]: Accurate but expensive, time consuming and
exhaustive. 2)Automatic: Prompt and cheap but accuracy remains an important issue. 3)Semi-Automatic:
Performed by interaction between human and computer with a higher accuracy than automatic method
and cheaper approach than manual method (the method proposed in this article).
If the annotation is automatic [12], the machines conduct the process by inspection of the low-level
features of the images [10], classification of them and optimization of the classification results. However,
regardless of how well the classification is performed, the semantic gap [13] remains a problem. At the
current state of the technology the human contribution to the process of annotation seems unavoidable.
Consequently many researchers have started to investigatesemi-automatic algorithms. These methods are
formed of an extensive machine preprocessing followed by human judgement [10]. It is called implicit
image annotation when the feedback of the human factor is provided unconsciously and without the
requirement of an explicit, direct response.
Unlike other semi-automatic annotation methods, implicittechniques do not need the users to spend
any effort and pay any attention to the process of the annotation. It is the responsibility of the machine
to monitor the user’s reactions and interactions when they come across visual data in their normal life
and annotate or classify them accordingly. Implicit image annotation by playing games [14],monitoring
the brain waves by Electroencephalography (EEG) [15] and studying users’ eye movements [16] can
be mentioned as three approaches under this category which are currently under research. Studying eye
movements has the direct benefit of an extensive psychological and psychophysical literature demonstrat-
ing that where a user looks reveals the target template that guides one’s attentional set [17]. That is, overt
January 28, 2012 DRAFT
Copyright (c) 2011 IEEE. Personal use is permitted. For any other purposes, permission must be obtained from the IEEE by emailing [email protected].
This article has been accepted for publication in a future issue of this journal, but has not been fully edited. Content may change prior to final publication.
3
attention as indexed by eye movements reveals what one is looking for [18], and thus can be used as a
means of implicitly annotating images. Furthermore eye tracking is less intrusive than EEG, in that the
equipment does not have to be in contact with the user, thus allowing the user to behave more normally.
Most of the studies that are being conducted in the field of implicit image evaluation by gaze movement
feedbacks are focused on image retrieval. Pasupa et al. [7] used Ranking SVM to improve on line learning
of ranking images for retrieval with fused content based features of the images and the implicit gaze data.
In a further study Hardoon and Pasupa [5] found it “unrealistic as no eye movement will be presented
a-priori for new images”. As a result they extend the approach by using the images with gaze data as
training set and rank the images for retrieval only with image features. Auer et al. [19] used the findings
of the previous two studies to develop the Pinview system that adds the implicit gaze feedback to the
mouse clicks as relevance feedback and uses them for Content-Based Image retrieval. Klami et al. [20]
used Linear Discriminant Analysis for classification. The output of their system is binary in that it only
shows whether a page of four images contains their target concept (sports) and if an image is a target
concept. Kozma et al. [6] introduced GaZIR which is a gaze-based interface for image browsing and
search. They used Logistic Regression classification algorithm. As it will be discussed in section VI-C
this algorithm is effective in recall performance however its accuracy did not exceed 90%. In addition
their framework is scenario dependent as 5 out of 17 used features cannot be used in other scenarios.
Humans use selective visual attention [21] in order to interact with their surroundings that comprise
of unlimited visual data. To study this phenomenon psychologists have formulated two mechanisms that
control visual attention: top down and bottom up. The formeris marked by volitional shifts of attention
and the latter implies the automatic capture of attention [22]. Here we primarily rely on volitional, top-
down shifts of attention as a method to classify images that are attended due to a relation with the target
template provided to the users to guide attention in this task.
In this study we introduce a metamorphic real-time framework named Gaze Inference System (GIS)
that is capable of both image annotation and retrieval by thehelp of the implicit feedback acquired from
eye-trackers. This framework benefits from 21 features extracted from the user’s gaze movement. For
every new user that is introduced into the system there is a calibration phase that helps to construct a
specific processing unit for the user. We show with our model that the user adapted system has better
accuracy, which is more desirable for image annotation, compared to a pool-trained (globally developed)
system. However the overall performance (F1 measure) of both systems is similar.
For development of the processing unit two algorithms (TSK-fuzzy inference system and a feed forward
back propagation neural network) are tested and their results are compared. As we will see in section V-C,
January 28, 2012 DRAFT
Copyright (c) 2011 IEEE. Personal use is permitted. For any other purposes, permission must be obtained from the IEEE by emailing [email protected].
This article has been accepted for publication in a future issue of this journal, but has not been fully edited. Content may change prior to final publication.
4
the use of fuzzy logic increased the ability to interpret [23] the developed system. In addition it reduced
the training period extensively. It also decreased the computational cost and cut down the required time
for a user calibration phase in order to provide training datasets for the system (less than 2 minutes). On
the other hand using the pattern recognition neural networkresulted in a slightly improved performance
of the framework but costs it more training time and it is morecomputationally expensive.
After the fuzzy inference system is trained, it is able to assign a User Interest Level (UIL) score from
0 to 1 to every image that appears on the screen. We use the produced UILs to annotate the images that
the system has no information about by having some key information about the concept in their mind or
by looking at the cluster of the images with high values of UIL.
Due to the nature of the used features (not scenario dependent) in this framework and the form of its
output, which reveals the degree of interest rather than just showing if it exists or not, it can be used to
derive a UIL for every non-motional object that appears on the screen. These objects can be text boxes,
icons, screen areas, lists, etc. The UIL for these objects can later be used in various other scenarios
besides image annotation. For example to provide relevancefeedback in retrieval process, to optimize
search results of a search engine for a user, and to improve the design of a web page.
II. EYE TRACKING
Eye tracking studies have shown that Fixations and Saccadesare the most important eye movement
behaviours for the process of revealing user cognition [1],[2]. A fixation happens when the eyes seize
on a single location and a saccade is the ballistic eye movement between any two fixations [5], [6], [16],
[20]. The main visual processing of stimuli takes place during fixations when the eyes focus on a single
location, centring the scene on the fovea for maximum fidelity of sampling the visual information present
for information processing and recognition in the brain [5].
In this study we employed a binocular set of 60Hz cameras withInfra-Red filters and the faceLAB 5.0
software package as the eye-tracking technology. In this framework first the captured video images by
cameras are stamped by their corresponding capture time andsent to the processing software. Next the
positions of both eyes are identified in every single image and two glints which are the brightest spots
in the image are located in them. This glint is the reflection of an infra-red source by the eyes which is
positioned between the cameras. By comparing the position of the glints to the position of the pupils in
each video image the software can estimate the direction vector of the user’s gaze.
This system requires a user calibration phase which takes less than one minute. Also it offers an error
of less than 0.5 degrees that suggests approximately less than 5mm diversion from the actual gaze point
January 28, 2012 DRAFT

Copyright (c) 2011 IEEE. Personal use is permitted. For any other purposes, permission must be obtained from the IEEE by emailing [email protected].
This article has been accepted for publication in a future issue of this journal, but has not been fully edited. Content may change prior to final publication.
5
Fig. 1. Snapshot of the video images of the eye-tracker: The white glint in the eyes are the reflection of the Infra-Red source,
the green vectors show the gaze direction and the red vector shows the head direction of the user.
when the user is looking at the screen from a distance of 50cm.Figure 1 shows the identified glints and
pupils in both eyes along with the gaze vectors of each eye (the green vectors) and the head direction
vector (the red vector). After the identification of the gazeintersection point these data are available in
real-time either directly on the local machine or on the LAN networks via TCP/IP protocol.
III. F RAMEWORK
The developed real-time framework is designed so flexibly that different experiments with various
scenarios can be plugged into it. The output of this framework is a User Interest Level (UIL) score
assigned to every image appeared on the screen and shows thathow much interest the user did show to
an image during the course of experiment. Based on the user’sinterest, these UILs can be used to classify
or cluster the images depending on the requirements of the scenario of the experiment. In the scenario
of this framework the sets of images appear on the screen simultaneously in four rows and six columns,
where every set is referred to as ’page’ throughout this paper. The first 5 pages (called Training Pages)
of the experiment are used to adapt the UIL generator engine to the user. The scenario of this training
phase is the same as the scenario of the evaluation course with the difference that fully annotated images
are used in the training phase.
Figure 2 shows the block diagram of the developed framework.First depending on the scenario, images
appear on the screen. Then the user’s gaze intersection withthe trial screen is monitored and in case of
intersection with any of the images on the screen the corresponding gaze coordinates and gaze duration
are recorded and sent to the feature extraction unit. In thisunit two different feature vectors are extracted
which are called the Transition Feature Vector (TFV) and theImage Feature Vector (IFV). Next if the
feature vectors belong to the pages from the training phase (first five pages with fully annotated images)
they are sent to the model construction unit.
January 28, 2012 DRAFT

Copyright (c) 2011 IEEE. Personal use is permitted. For any other purposes, permission must be obtained from the IEEE by emailing [email protected].
This article has been accepted for publication in a future issue of this journal, but has not been fully edited. Content may change prior to final publication.
6
-Gaze Coordinates (x,y)
- Corresponding Time
Stamp
Eye Tracker
Feature
Extraction
Unit
(I FV)
Processing
unit
(T FV)
Processing
Unit
AverageUser
Interest
Level (UIL)I-
UIL
T-U
IL
Model
Construction
Unit
UIL
Gen
era
tor
Un
it
Fig. 2. Block diagram of the developed framework.
For both of the feature vectors two independent processing systems are developed (both by fuzzy logic
based and neural networks based structures). As the experiment exits the training phase and continues
with non-annotated images, the developed processing systems start to interpret the user’s gaze movement
feature vectors, and the processing system of each vector assigns a UIL to the images based on the
information in that vector (T-UIL and I-UIL for TFV and IFV respectively). Finally for every image the
average of the T-UIL and I-UIL values is calculated as the final output of the system.
A. User Interface
The introduced Graphical User Interface (GUI) in this paperwas experienced on a 32cm× 20cm
screen with 1280× 800 pixels. A subset of 700 images from the Corel Content database was used as the
database. This subset was formed of seven key concepts of sky, lion, tiger, elephant, building, car and
vegetation with 100 images belonging to each category. The original size of all of the images was 384×
256 pixels in either landscape or portrait. In all of the scenarios the images appeared slightly dark on the
screen and in case of gaze intersection they turned into their normal brightness. This was to make sure
that the users were paying attention to the image that they are looking at without distracting them. It also
helped them to stay focused on the appointed tasks and get less bored during the experiments. This was
determined by pilot research with 10 users (3 women and 7 men aged between 22-35 holding university
degrees) who also tried the static form of the displays. To avoid the saliency effect of the shape of the
January 28, 2012 DRAFT

Copyright (c) 2011 IEEE. Personal use is permitted. For any other purposes, permission must be obtained from the IEEE by emailing [email protected].
This article has been accepted for publication in a future issue of this journal, but has not been fully edited. Content may change prior to final publication.
7
images on the user’s attention, the aspect ratio of all of theimages were stretched from 3:2 or 2:3 into
1:1.
B. The Clarified User Directed (CUD) Scenario
The real-world case of this scenario is when a user has a specific concept, Target Concept (TC), in
mind and he/she is exploring a database of images to find the ones that contain similar concept to the
TC. This can take place when using a search engine or exploring the images of an on-line photo gallery
like Flicker or Facebook. In these situations the users normally click on a limited number of images to
enlarge them, read their corresponding comments, etc. However there remain many images that appeared
on the screen which the user noticed but did not click on for various reasons resulting in no information
for the system. The aim of this scenario is to simulate such situations and classify these images into
two classes, either Favoured by the user or Not-Favoured by the user based on his/her eye movement
attention. We assumed that there is a strong likelihood thatwe can find most of the images similar to
the TC in the Favoured class.
In this scenario every time that the user clicks on a providedNext button or clicks on an image
while looking at it he/she is provided with the next page of 24images. Each image appears only once
during the experiment and it is chosen randomly from the database. For performance measurement of the
framework the users were told to imagine that they are responsible for selecting an image for the cover
of a magazine from the images that appear on the screen. This image had to contain the same concept as
a randomly selected image that appeared at the beginning of the experiment in the start page. The key
concept of this image considered to be the TC in user’s mind.
After visiting the start page by clicking on the provided ’Next’ button at the bottom right side of the
Graphical User Interface(GUI) the scenario starts. The users were instructed to find the most similar
images to the TC and click on it to proceed to the next page. If such an image did not exist in the page,
they had to click on the ’Next’ button. To prevent the users from clicking on the first similar image
that they face on each new page they were told that there is a point based system which considers how
they look at other similar images and scores them. However the users were strongly reminded that the
main job is not to gain higher scores but to simulate an image search scenario. The point based system
also helped to keep the users motivated throughout the experiment. Figure 3 shows a screen-shot of this
scenario and the start page with the ’garden of a house’ key concept as the TC.
January 28, 2012 DRAFT

Copyright (c) 2011 IEEE. Personal use is permitted. For any other purposes, permission must be obtained from the IEEE by emailing [email protected].
This article has been accepted for publication in a future issue of this journal, but has not been fully edited. Content may change prior to final publication.
8
(a) Start Page (b) Scenario
Fig. 3. Framework Scenario Screen-shots: The image in the start page is regarded as the target concept in the user’s mind.
IV. FEATURE EXTRACTION UNIT (FEU)
The raw data of every page of the scenario are sent to the FEU after the user finished exploring the
page and requested a new page. The inputs of this unit are three vectors of fixation coordinates, fixation
duration and ID and spatial properties of the images on the screen.
Many researchers in the field of eye-tracking [20], [24]–[26] developed their processing framework
with few numbers (3 to 6) of different features including thenumber of fixations, duration of fixations
and its derivatives and saccades. Kozma et al. [6] used 17 features however 5 of them are specific to their
scenario as they are calculated based on eye movements over circles that are formed of images. The most
comprehensive feature extraction in this field was reportedby Antti Ajanki et al. [27] for the reading
process with 22 features, but most of them (14 features) are not applicable in the image processing
domain. Pasupa et al. [7] and Hardoon and Pasupa [5] used the same 33 features in two consecutive
approaches emphasizing mostly the spatial properties of the gaze movements and their features calculated
based on within image fixations independent from the rest of the images on screen. All of these studies
focused on the gaze features for individual objects (text orimage).
In this study we extracted two different feature vectors (intotal 21 features) where one of them
contains the properties of eye-movements regardless of theunderlying objects and the other one contains
information about the properties of gaze intersection withthe image. The outputs of the FEU are
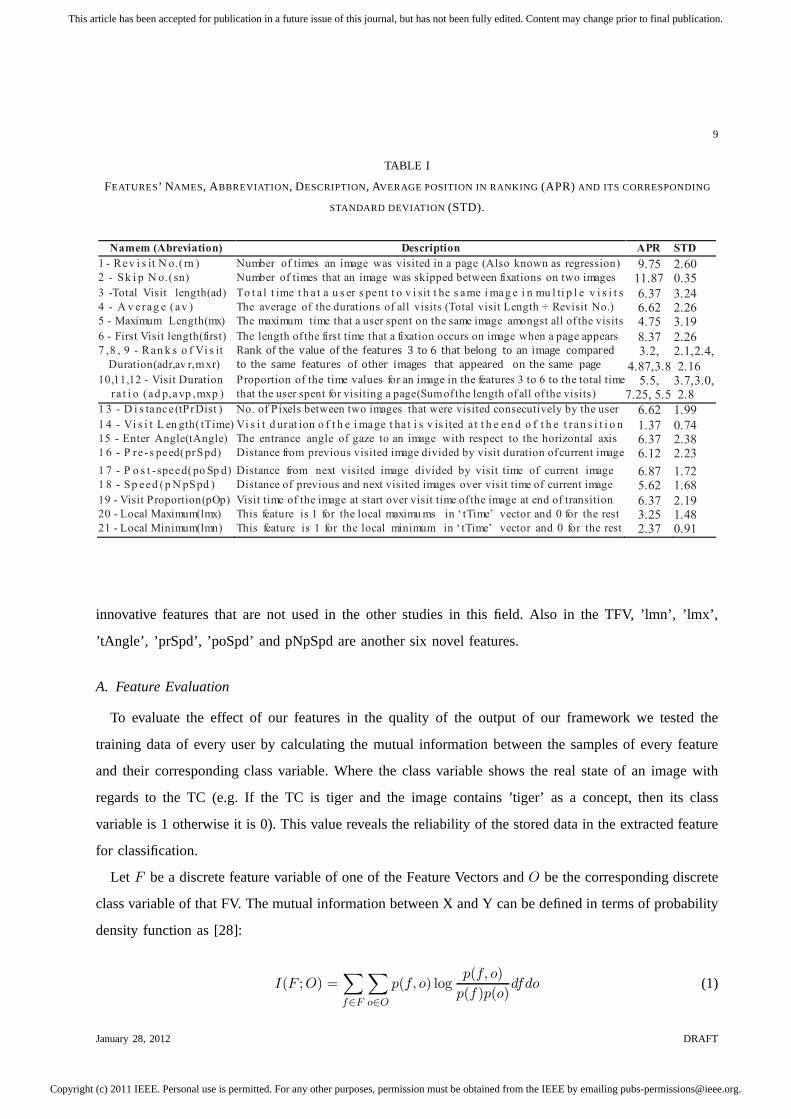
represented in table I as two feature vectors (IFV and TFV). First, the Image Feature Vector (IFV)
contains the features 1-12 in the table. These features showhow the user paid attention to an individual
image. The length of feature variable of every feature in this FV is equal to the number of images that
appeared on the screen. Second, the Transition Feature Vector contains the features 13-21 in the table.
These features show the properties of transition of gaze from one image to another. Please refer to Table
I for definitions of the features used to classify user interest levels. In the IFV, the features number 7
to 9 (adr, avr and mxr) which are derived from the features 3 to5 (ad, av and mx) respectively are
January 28, 2012 DRAFT
Copyright (c) 2011 IEEE. Personal use is permitted. For any other purposes, permission must be obtained from the IEEE by emailing [email protected].
This article has been accepted for publication in a future issue of this journal, but has not been fully edited. Content may change prior to final publication.
9
TABLE I
FEATURES’ N AMES, ABBREVIATION , DESCRIPTION, AVERAGE POSITION IN RANKING(APR) AND ITS CORRESPONDING
STANDARD DEVIATION (STD).
Namem (Abreviation) Description APR STD
1 - Rev i s it N o.( rn ) Number of times an image was visited in a page (Also known as regression) 9.75 2.60 2 - Sk i p N o.(sn) Number of times that an image was skipped between fixations on two images 11.87 0.35
3 -Total Visit length(ad) To t a l t ime t h a t a u s er s pent t o v i sit t he s ame i mag e i n mu l ti p l e v i s i t s 6.37 3.24 4 - A v erag e (av ) The average of the durations of all visits (Total visit Length ÷ Revisit No.) 6.62 2.26 5 - Maximum Length(mx) The maximum time that a user spent on the same image amongst all of the visits 4.75 3.19
6 - First Visit length(first) The length of the first time that a fixation occurs on image when a page appears 8.37 2.26 7 ,8 , 9 - Ran k s o f Vi s it
Duration(adr,av r,mxr)
Rank of the value of the features 3 to 6 that belong to an image compared
to the same features of other images that appeared on the same page 3.2,
4.87,3.8
2.1,2.4,
2.16 10,11,12 - Visit Duration
ra t i o (ad p,avp ,mxp )
Proportion of the time values for an image in the features 3 to 6 to the total time
that the user spent for visiting a page(Sum of the length of all of the visits) 5.5,
7.25, 5.5 3.7,3.0, 2.8
1 3 - D i s tance (tPrDist ) No. of P ixels between two images that were visited consecutively by the user 6.62 1.99
1 4 - Vi s i t L en gth( tTime) Vi s i t d urat ion o f t h e i mage t ha t i s v is ited a t t h e en d o f t h e t ran s i t i o n 1.37 0.74 15 - Enter Angle(tAngle) The entrance angle of gaze to an image with respect to the horizontal axis 6.37 2.38 1 6 - P re -s peed(prSpd) Distance from previous visited image divided by visit duration of current image 6.12 2.23
1 7 - P o s t - speed(po Sp d) Distance from next visited image divided by visit time of current image 6.87 1.72 1 8 - Sp eed (p N pSpd ) Distance of previous and next visited images over visit time of current image 5.62 1.68
19 - Visit Proportion(pOp) Visit time of the image at start over visit time of the image at end of transition 6.37 2.19 20 - Local Maximum(lmx) This feature is 1 for the local maximu ms in ‘ tTime’ vector and 0 for the rest 3.25 1.48 21 - Local Minimum(lmn) This feature is 1 for the local minimum in ‘ tTime’ vector and 0 for the rest 2.37 0.91
innovative features that are not used in the other studies inthis field. Also in the TFV, ’lmn’, ’lmx’,
’tAngle’, ’prSpd’, ’poSpd’ and pNpSpd are another six novelfeatures.
A. Feature Evaluation
To evaluate the effect of our features in the quality of the output of our framework we tested the
training data of every user by calculating the mutual information between the samples of every feature
and their corresponding class variable. Where the class variable shows the real state of an image with
regards to the TC (e.g. If the TC is tiger and the image contains ’tiger’ as a concept, then its class
variable is 1 otherwise it is 0). This value reveals the reliability of the stored data in the extracted feature
for classification.
Let F be a discrete feature variable of one of the Feature Vectors andO be the corresponding discrete
class variable of that FV. The mutual information between X and Y can be defined in terms of probability
density function as [28]:
I(F ;O) =∑
f∈F
∑
o∈O
p(f, o) logp(f, o)
p(f)p(o)dfdo (1)
January 28, 2012 DRAFT
Copyright (c) 2011 IEEE. Personal use is permitted. For any other purposes, permission must be obtained from the IEEE by emailing [email protected].
This article has been accepted for publication in a future issue of this journal, but has not been fully edited. Content may change prior to final publication.
10
0
0.02
0.04
0.06
0.08
0.1
0.15
0.2
0.25
0.27
Mutu
al In
form
ation s
core
ad
adp
adr
av
avp
avr
first
mx
mxp
mxr rn sn
poS
pd
pNpS
pd
pOp
prS
pd
tAng
le
tTim
e
tPrD
ist
lmx
lmn
user1
user2
user3
user4
user5
user6
user7
user8
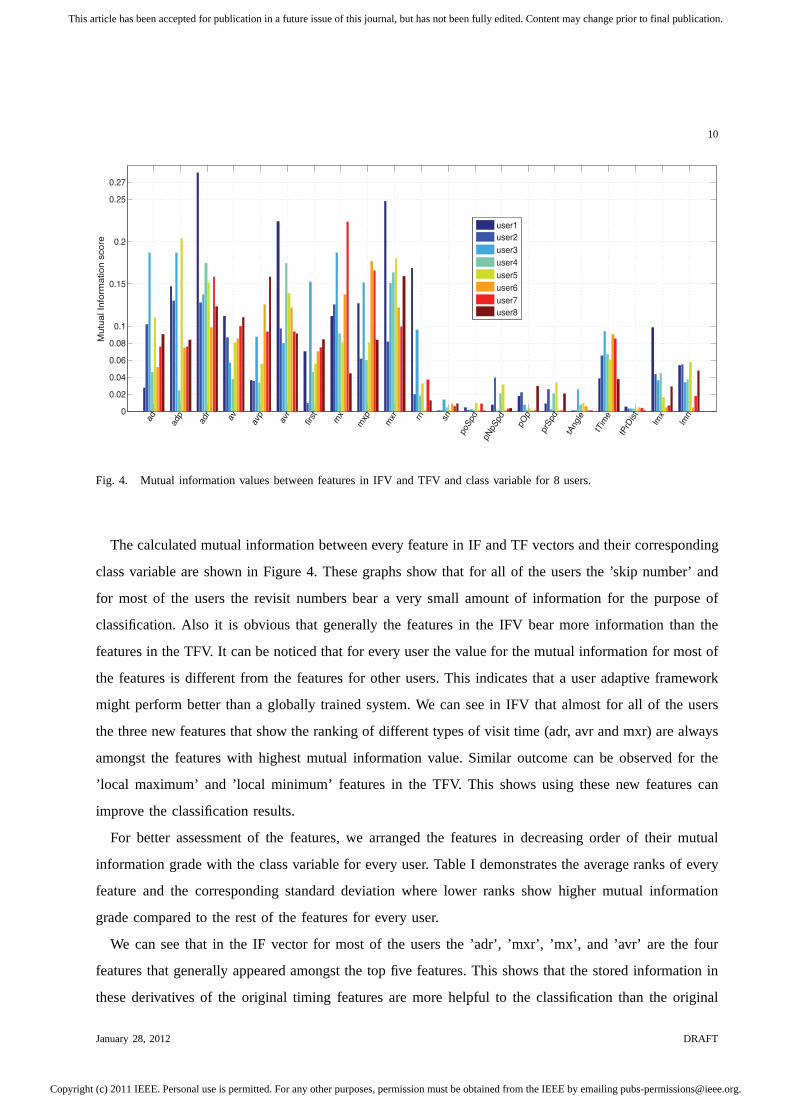
Fig. 4. Mutual information values between features in IFV and TFV and class variable for 8 users.
The calculated mutual information between every feature inIF and TF vectors and their corresponding
class variable are shown in Figure 4. These graphs show that for all of the users the ’skip number’ and
for most of the users the revisit numbers bear a very small amount of information for the purpose of
classification. Also it is obvious that generally the features in the IFV bear more information than the
features in the TFV. It can be noticed that for every user the value for the mutual information for most of
the features is different from the features for other users.This indicates that a user adaptive framework
might perform better than a globally trained system. We can see in IFV that almost for all of the users
the three new features that show the ranking of different types of visit time (adr, avr and mxr) are always
amongst the features with highest mutual information value. Similar outcome can be observed for the
’local maximum’ and ’local minimum’ features in the TFV. This shows using these new features can
improve the classification results.
For better assessment of the features, we arranged the features in decreasing order of their mutual
information grade with the class variable for every user. Table I demonstrates the average ranks of every
feature and the corresponding standard deviation where lower ranks show higher mutual information
grade compared to the rest of the features for every user.
We can see that in the IF vector for most of the users the ’adr’,’mxr’, ’mx’, and ’avr’ are the four
features that generally appeared amongst the top five features. This shows that the stored information in
these derivatives of the original timing features are more helpful to the classification than the original
January 28, 2012 DRAFT

Copyright (c) 2011 IEEE. Personal use is permitted. For any other purposes, permission must be obtained from the IEEE by emailing [email protected].
This article has been accepted for publication in a future issue of this journal, but has not been fully edited. Content may change prior to final publication.
11
features. Also it confirms that we can achieve better resultsby comparing the user’s attention to different
images in a ’page’ than just studying the user’s attention toan individual image. It is notable that the
’first’, ’rn’ and ’sn’ features are normally the features with the least information in correlation with class
variable. This shows that generally the number of times thata user skips an image rather than looking at
it is not a very good criterion to decide whether the image is aTC+. The high standard deviation of the
’ad’ and ’adp’ in ranking place shows that the total amount oftime that one user spends on an image is
significantly different from another; however we can see that when this time is considered with respect
to the total time that the user paid attention to the rest of the images that appeared on the same page
(adr feature) we have more consistency in the results.
By looking at the TFV we can see that ’lmn’ is one of the top features in ranking with very low
standard deviation. This is very interesting because it shows that when users have looked at an image
for less amount of time than its previous and next observed images, they have paid differential attention
to that image. A less strong but similar comment can be made for the ’lmx’ feature.
V. MODEL CONSTRUCTIONUNIT
This unit is responsible for constructing two fuzzy logic based systems for the two feature vectors each
with a single output by using the training (input:output) pairs from the training pages of the experiment
where: 1) The ’input’ is formed of the extracted feature vectors for every image and the corresponding
transition that they belong to. 2)The ’output’ is determined as +1 and -1 if the image belongs to TC+ or
TC- classes respectively and is known as the Class Variable(CV).
A. Developing Takagi-Sugeno-Kang Fuzzy Inference System (TSK-FIS)
The ability of fuzzy logic [29] “to deliver a satisfactory performance in the face of uncertainty and
imprecision” [30] has made it one of the favourite models to design the systems that have to cope with
unpredictable input/output data sets. Unlike the classical crisp logic that an object is either a member or
not a member of a set, in fuzzy logic a membership degree is assigned to the object that defines its level
of membership to a set. The systems that use fuzzy logic basedalgorithms are called Fuzzy Inference
Systems (FIS).
The behaviour of a FIS is governed by its If-Then rules. For example one of the rules for the fan
speed of a freezer can be:
- If temperature is high and stored food amount is large then fan speed is very high.
January 28, 2012 DRAFT

Copyright (c) 2011 IEEE. Personal use is permitted. For any other purposes, permission must be obtained from the IEEE by emailing [email protected].
This article has been accepted for publication in a future issue of this journal, but has not been fully edited. Content may change prior to final publication.
12
These descriptive rules can be divided into two parts [29]: 1) premise and 2) consequent. The former
part is formed of lingual variables as inputs (temperature,stored food amount), the input sets (high
temperature, large amount) and descriptive T-norm operators (’and’ operator) that are applied on these
inputs. Depending on the type of the FIS the consequent part of the rules can be either lingual like
the sample rule above (high speed) or a mathematical function. A FIS can understand the membership
degree of the descriptive variables of a rule to an input set by the help of the Membership Functions
(MF) which are previously defined for the system. The final output of the FIS is the aggregation result
of all of the consequent parts. It should be noted that the aggregation method varies according to the
type of the system.
TSK-FIS is the most commonly used FIS for system modelling [31]. This type of FIS uses the lingual
form and mathematical functions for the premise and consequent parts of the fuzzy rules of a fuzzy
system respectively [32]. This structure of TSK-FIS makes it interpretable both for human and machine
and adopts flexibility to the developed systems.
We used the first order TSK-FIS for our framework as with significantly less complexity compared to
higher orders [33] it still can be trained. It is called first-order because first-order polynomials form the
output of each rule as the consequent. A generic form of the k-th rule of a first-order TSK-FIS with M
inputs and one output can be denoted as follow:
Rk: If x1 is Ak,1 andx2 isAk,2 and ...andxM is Ak,M thenzk = bk,1x1+bk,2x2+...+bk,MxM+bk,M+1
Wherexm, Ak,m andzk are the m-th input, m-th input set and the output of the k-th rule respectively.
Also bk,1tobk,M+1 are the coefficients that define the linear relationship between the output membership
function of the k-th rule to the corresponding inputs of the system.
Normally in order to develop a FIS, human experts with the knowledge about inputs and outputs of
the system are required who are able to design and evaluate the MFs and the necessary variables for the
system. To reduce the role of human factors in the development process of the FISes some algorithms are
introduced which automatize the process of identifying theFIS structure by fuzzy clustering , generating
rules for each cluster and developing corresponding MFs.
Fuzzy clustering is a form of clustering in which every element belongs to all clusters with a mem-
bership degree in [0 1] interval. The popular methods for fuzzy clustering are: 1) Fuzzy C-means [34]:
In this method the number of clusters and initial cluster centres should be defined explicitly then the
algorithm tries to find the cluster centre iteratively. Thisresults in the clustering quality to be highly
dependable on the manually defined initial values. 2) Mountain clustering [35]: This method can find
the number of clusters and their corresponding centres but in this method by increasing the dimension
January 28, 2012 DRAFT

Copyright (c) 2011 IEEE. Personal use is permitted. For any other purposes, permission must be obtained from the IEEE by emailing [email protected].
This article has been accepted for publication in a future issue of this journal, but has not been fully edited. Content may change prior to final publication.
13
of the input vector the computation cost grows exponentially. 3) Subtractive clustering [31], [32]: This
method is an enhanced form of the second method with the difference that “the computation is simply
proportional to the number of data points”. [36].
To generate the MFs for the input sets and find the number of rules for our TSK-FIS we used subtractive
clustering. This is because subtractive clustering does not depend on the initial conditions. This property
makes it consistent in the outputs. Also it is not an exhaustive process like Mountain clustering. All of
these reasons make it suitable for real-time systems.
B. GIS’s TSK-FIS Structure Identification by Subtractive Clustering
Every discovered cluster centre by subtractive clustering(SC) is an example of a characteristic be-
haviour of the system [36] which results in a new rule for the to be constructed TSK-FIS.
Because we have developed two TSK-FISes there are two sets ofdata pairs with IFV and TFV as
inputs. Their corresponding Class Variable (CV) is 1 if theybelong to a TC+ image or a gaze transition
that involves a TC+ image respectively and it is 0 otherwise.
Let X = {x1, x2, ..., xN} be N data pairs that are used for constructing GIS’s TSK-FIS.Each data
pair (xn) is formed of an input vector and a scalar output where:
xn = [xn|IFV/TFV
... xn|CV ]
In our case for data pairs with IFV as input:
N = 5× No. of Images on Each Page
For data pairs with TFV as input:
N= Total No. of times that the user moved from one image to another during the first five pages.
Also let X∗ be the set of C discovered cluster centres with their corresponding radius of the effective
neighbourhood (ra) identified by SC method which are found in X. A TSK-FIS can be constructed with
C rules that [36]:
wc = e−α‖x|IFV/TFV −x∗
c‖ (2)
Wherewc is the firing strength of the c-th rule andα = 4
ra. Based on the introduced generic form of
the ruleRk earlier, the output of each rule of the TSK-FIS can be shown as:
zc = Bc[x|IFV/TFV
... 1]T = Bcx|TIFV/TFV (3)
January 28, 2012 DRAFT
Copyright (c) 2011 IEEE. Personal use is permitted. For any other purposes, permission must be obtained from the IEEE by emailing [email protected].
This article has been accepted for publication in a future issue of this journal, but has not been fully edited. Content may change prior to final publication.
14
WhereBc = [b1 · · · bM+1] shows the coefficient matrix of the output membership function of the c-th
rule and the system is identified by finding these coefficients. By using eq (2) and eq (3) and considering
wc =wc
∑Cc=1
wc
the final output of the TSK-FIS can be shown as follow:
z =[
w1x|IFV/TFV · · · wC x|IFV/TFV
]
BT1
...
BTC
Now for N data pairs of[x|IFV/TFV : x|CV ] we can write:
x1|CV
...
xN |CV
=
w1,1
x1|IFV/TFV· · · w
1,Cx1|IFV/TFV
.... . .
...
wN,1xN |IFV/TFV
· · · wN,C xN |IFV/TFV
BT1
...
BTC
(4)
With a closer look it can be seen that eq (4) has the form ofB = AX which can be solved simply
by using the popular method of Least-Square Estimation [29], [36] for system identification.
C. The Developed GIS’s TSK-FIS
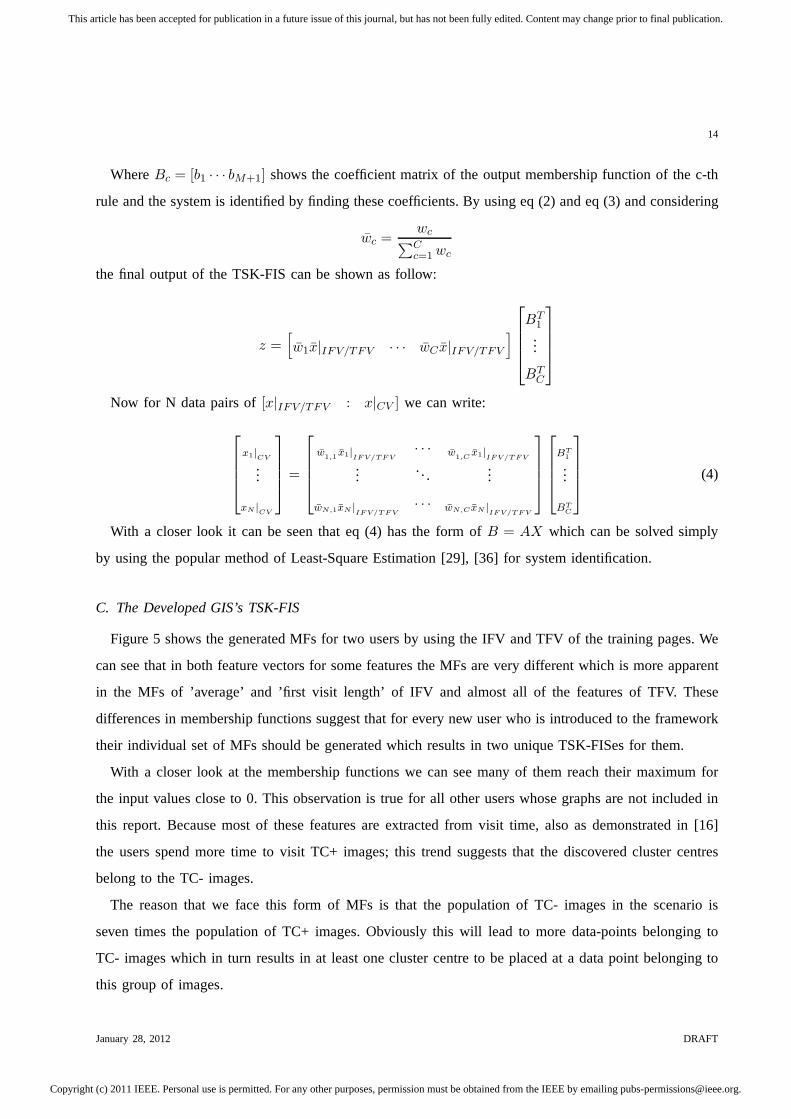
Figure 5 shows the generated MFs for two users by using the IFVand TFV of the training pages. We
can see that in both feature vectors for some features the MFsare very different which is more apparent
in the MFs of ’average’ and ’first visit length’ of IFV and almost all of the features of TFV. These
differences in membership functions suggest that for everynew user who is introduced to the framework
their individual set of MFs should be generated which results in two unique TSK-FISes for them.
With a closer look at the membership functions we can see manyof them reach their maximum for
the input values close to 0. This observation is true for all other users whose graphs are not included in
this report. Because most of these features are extracted from visit time, also as demonstrated in [16]
the users spend more time to visit TC+ images; this trend suggests that the discovered cluster centres
belong to the TC- images.
The reason that we face this form of MFs is that the populationof TC- images in the scenario is
seven times the population of TC+ images. Obviously this will lead to more data-points belonging to
TC- images which in turn results in at least one cluster centre to be placed at a data point belonging to
this group of images.
January 28, 2012 DRAFT
Copyright (c) 2011 IEEE. Personal use is permitted. For any other purposes, permission must be obtained from the IEEE by emailing [email protected].
This article has been accepted for publication in a future issue of this journal, but has not been fully edited. Content may change prior to final publication.
15
Input Value
MF
Nam
e
0 50 100 150
adadp
adr
avavp
avrfirst
mx
mxp
mxrrn
sn
poSpd
pNpSpd
pOp
prSpd
tAngle
tTime
tPrDist
lmx
lmn
(a) User A
Input Value0 50 100 150
ad
adp
adr
av
avp
avr
first
mx
mxp
mxr
rn
sn
poSpd
pNpSpd
pOp
prSpd
tAngle
tTime
tPrDist
lmx
lmn0
0.1
0.2
0.3
0.4
0.5
0.6
0.7
0.8
0.9
1
(b) User B
Fig. 5. Samples of Generated Membership Functions of IFV/TFV for two users:The input values for IFV and TFV are scaled
down from 0-250 and 0-1200 to 0-180 respectively.
VI. RESULTS
To evaluate our framework we used the TFV and IFT of the last 25pages of each user’s experiment
as the test data. For performance evaluation we considered our system to be a classifier which the closer
its output (UIL) for an image is to 1, the more likely that image belongs to the TC+ class. For each
system output we swiped a threshold from 0 to 1 with steps of 0.05. At every step of the threshold
the images with aUIL > Threshold considered to belong to the TC+ class and the images with a
UIL < Threshold considered to belong to the TC- class. Finally we compared the classified outputs to
the actual classes of the images and measured the precision,recall and F1 measure for every threshold.
A. Effect of Adjustable Variables
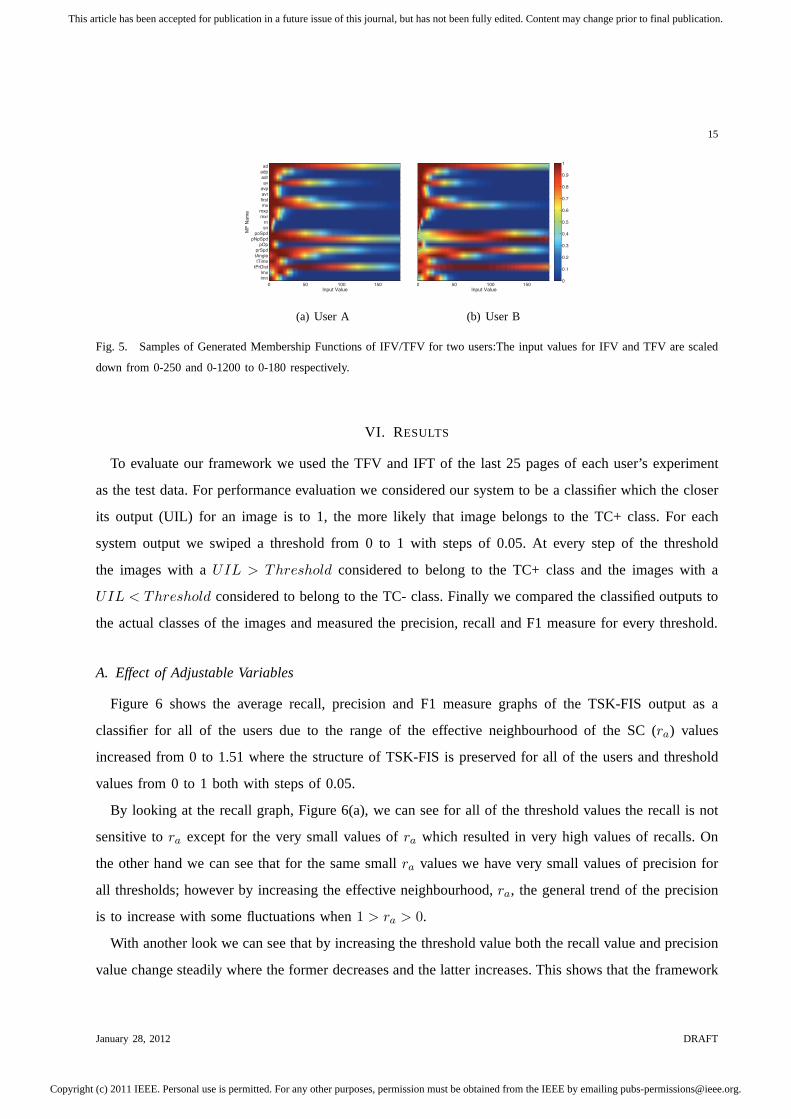
Figure 6 shows the average recall, precision and F1 measure graphs of the TSK-FIS output as a
classifier for all of the users due to the range of the effective neighbourhood of the SC (ra) values
increased from 0 to 1.51 where the structure of TSK-FIS is preserved for all of the users and threshold
values from 0 to 1 both with steps of 0.05.
By looking at the recall graph, Figure 6(a), we can see for allof the threshold values the recall is not
sensitive tora except for the very small values ofra which resulted in very high values of recalls. On
the other hand we can see that for the same smallra values we have very small values of precision for
all thresholds; however by increasing the effective neighbourhood,ra, the general trend of the precision
is to increase with some fluctuations when1 > ra > 0.
With another look we can see that by increasing the thresholdvalue both the recall value and precision
value change steadily where the former decreases and the latter increases. This shows that the framework
January 28, 2012 DRAFT
Copyright (c) 2011 IEEE. Personal use is permitted. For any other purposes, permission must be obtained from the IEEE by emailing [email protected].
This article has been accepted for publication in a future issue of this journal, but has not been fully edited. Content may change prior to final publication.
16
Threshold
r a N
eig
hboro
od
0 0.2 0.4 0.6 0.80
0.5
1
1.5
(a) TSK-FIS Recall
Threshold
r a Neig
hboro
od
0 0.2 0.4 0.6 0.80
0.5
1
1.5
(b) TSK-FIS Precision
Threshold
a
0 0.2 0.4 0.6 0.80
0.5
1
1.5
0
0.2
0.4
0.6
0.8
1
(c) TSK-FIS F1 Measure
Fig. 6. TSK-FIS performance due to different ranges of effective neighbourhood.
assigns the UIL value to the images homogeneously that by each step increase in threshold more TC-
images fall below the threshold than TC+.
Finally we can see in Figure 6(c) that except for the very small values ofra the F1 score reaches its
maximum at some threshold between 0.2 and 0.4. This is because, as stated earlier, the sensitivity of
the recall is very low to changes inra and although the values of F1 score increase by increasing the
range of effective neighbourhood but the shape of the curvesalmost stay the same, consequently it can
be concluded that by increasing thera the accuracy of the classifier increases.
It should be noted that although the graphs in figure 6 are for the average of all of the users but the
stated properties are applicable for every single user.
B. Framework Performance
Figure 8 shows the performance of our framework for the ultimate outputs. In this figure the average
and standard deviation of the Precision, Recall and F1 scoreof the User Adaptive TSK (UA-TSK) system
for all users are shown where the UA-TSK is trained independently for every user with the first 5 pages
of their experiment. These curves are drawn from the values of UILs in the interval of [0 1] versus the
January 28, 2012 DRAFT
Copyright (c) 2011 IEEE. Personal use is permitted. For any other purposes, permission must be obtained from the IEEE by emailing [email protected].
This article has been accepted for publication in a future issue of this journal, but has not been fully edited. Content may change prior to final publication.
17
Threshold
Num
ber
of
Neuro
ns
F1 Measure
0 0.2 0.4 0.6 0.8
50
100
150
200
0
0.2
0.4
0.6
0.8
1
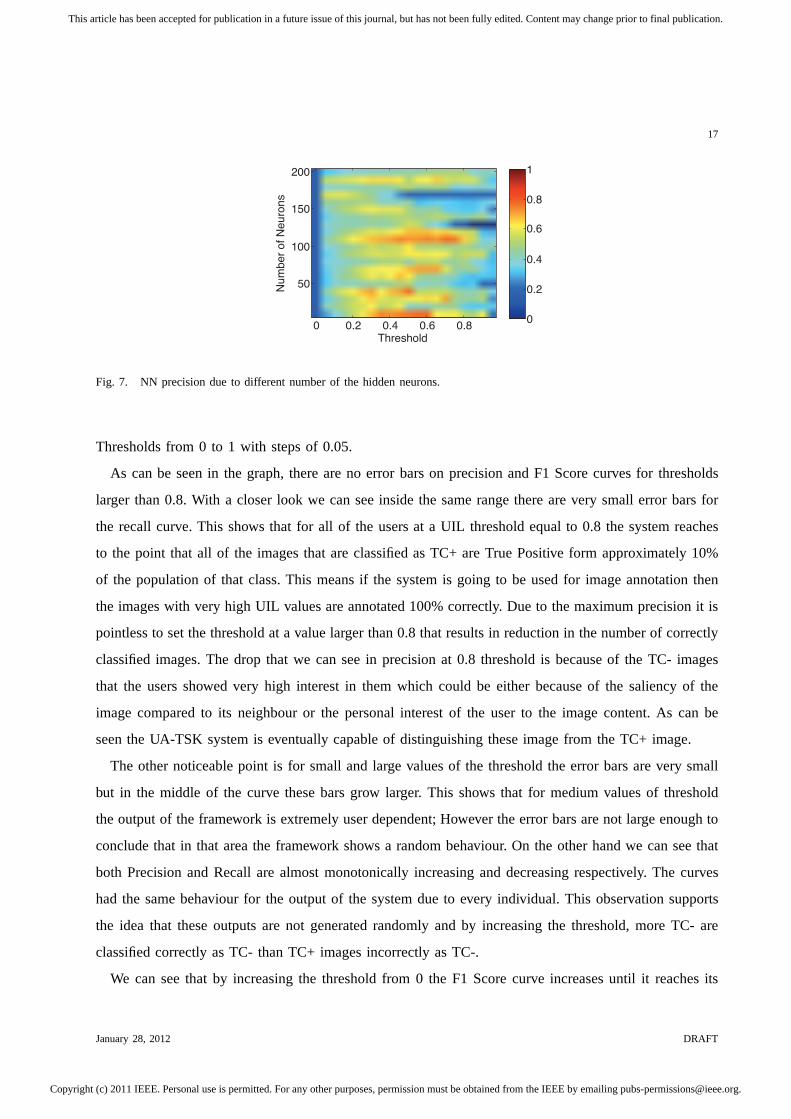
Fig. 7. NN precision due to different number of the hidden neurons.
Thresholds from 0 to 1 with steps of 0.05.
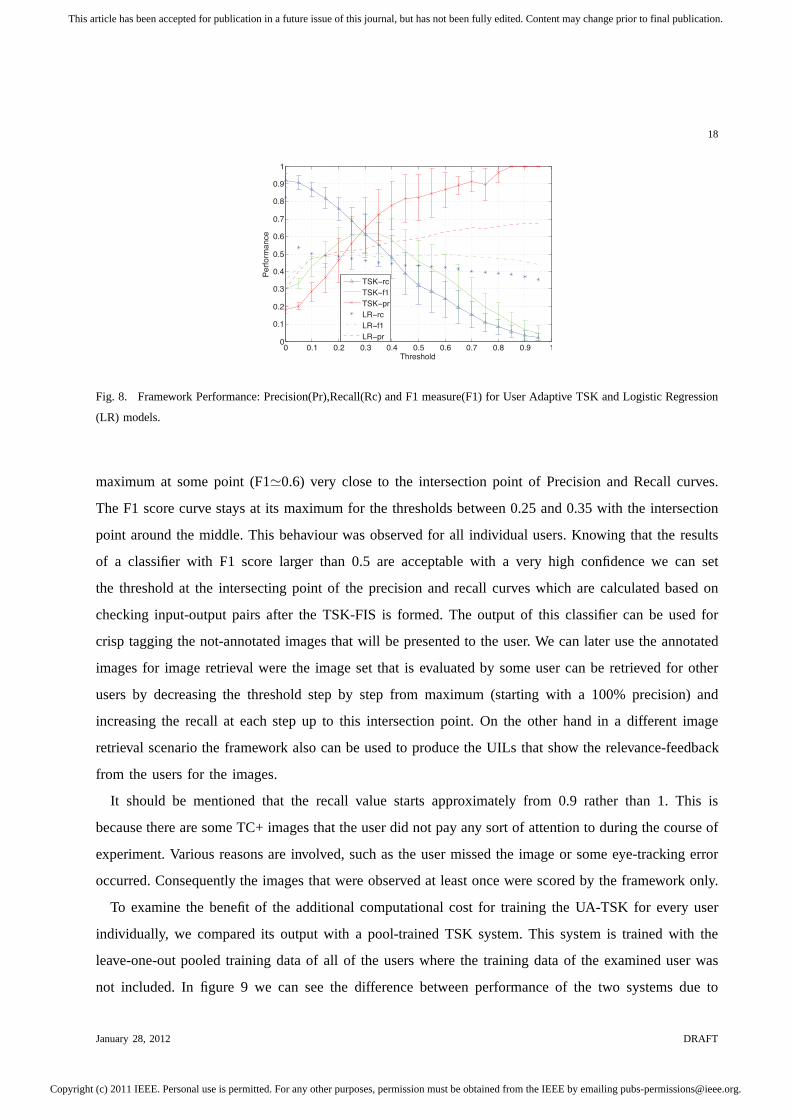
As can be seen in the graph, there are no error bars on precision and F1 Score curves for thresholds
larger than 0.8. With a closer look we can see inside the same range there are very small error bars for
the recall curve. This shows that for all of the users at a UIL threshold equal to 0.8 the system reaches
to the point that all of the images that are classified as TC+ are True Positive form approximately 10%
of the population of that class. This means if the system is going to be used for image annotation then
the images with very high UIL values are annotated 100% correctly. Due to the maximum precision it is
pointless to set the threshold at a value larger than 0.8 thatresults in reduction in the number of correctly
classified images. The drop that we can see in precision at 0.8threshold is because of the TC- images
that the users showed very high interest in them which could be either because of the saliency of the
image compared to its neighbour or the personal interest of the user to the image content. As can be
seen the UA-TSK system is eventually capable of distinguishing these image from the TC+ image.
The other noticeable point is for small and large values of the threshold the error bars are very small
but in the middle of the curve these bars grow larger. This shows that for medium values of threshold
the output of the framework is extremely user dependent; However the error bars are not large enough to
conclude that in that area the framework shows a random behaviour. On the other hand we can see that
both Precision and Recall are almost monotonically increasing and decreasing respectively. The curves
had the same behaviour for the output of the system due to every individual. This observation supports
the idea that these outputs are not generated randomly and byincreasing the threshold, more TC- are
classified correctly as TC- than TC+ images incorrectly as TC-.
We can see that by increasing the threshold from 0 the F1 Scorecurve increases until it reaches its
January 28, 2012 DRAFT
Copyright (c) 2011 IEEE. Personal use is permitted. For any other purposes, permission must be obtained from the IEEE by emailing [email protected].
This article has been accepted for publication in a future issue of this journal, but has not been fully edited. Content may change prior to final publication.
18
0 0.1 0.2 0.3 0.4 0.5 0.6 0.7 0.8 0.9 10
0.1
0.2
0.3
0.4
0.5
0.6
0.7
0.8
0.9
1
Threshold
Perf
orm
ance
TSK−rc
TSK−f1
TSK−pr
LR−rc
LR−f1
LR−pr
Fig. 8. Framework Performance: Precision(Pr),Recall(Rc)and F1 measure(F1) for User Adaptive TSK and Logistic Regression
(LR) models.
maximum at some point (F1≃0.6) very close to the intersection point of Precision and Recall curves.
The F1 score curve stays at its maximum for the thresholds between 0.25 and 0.35 with the intersection
point around the middle. This behaviour was observed for allindividual users. Knowing that the results
of a classifier with F1 score larger than 0.5 are acceptable with a very high confidence we can set
the threshold at the intersecting point of the precision andrecall curves which are calculated based on
checking input-output pairs after the TSK-FIS is formed. The output of this classifier can be used for
crisp tagging the not-annotated images that will be presented to the user. We can later use the annotated
images for image retrieval were the image set that is evaluated by some user can be retrieved for other
users by decreasing the threshold step by step from maximum (starting with a 100% precision) and
increasing the recall at each step up to this intersection point. On the other hand in a different image
retrieval scenario the framework also can be used to producethe UILs that show the relevance-feedback
from the users for the images.
It should be mentioned that the recall value starts approximately from 0.9 rather than 1. This is
because there are some TC+ images that the user did not pay anysort of attention to during the course of
experiment. Various reasons are involved, such as the user missed the image or some eye-tracking error
occurred. Consequently the images that were observed at least once were scored by the framework only.
To examine the benefit of the additional computational cost for training the UA-TSK for every user
individually, we compared its output with a pool-trained TSK system. This system is trained with the
leave-one-out pooled training data of all of the users wherethe training data of the examined user was
not included. In figure 9 we can see the difference between performance of the two systems due to
January 28, 2012 DRAFT
Copyright (c) 2011 IEEE. Personal use is permitted. For any other purposes, permission must be obtained from the IEEE by emailing [email protected].
This article has been accepted for publication in a future issue of this journal, but has not been fully edited. Content may change prior to final publication.
19
4 6 8 10 12 14 16 18 20
−0.2
0
0.2
0.4
0.6
0.8
Num. of Training Pages
Perf
orm
ance
Diff
ere
nce
precision
recall
F1 Measure
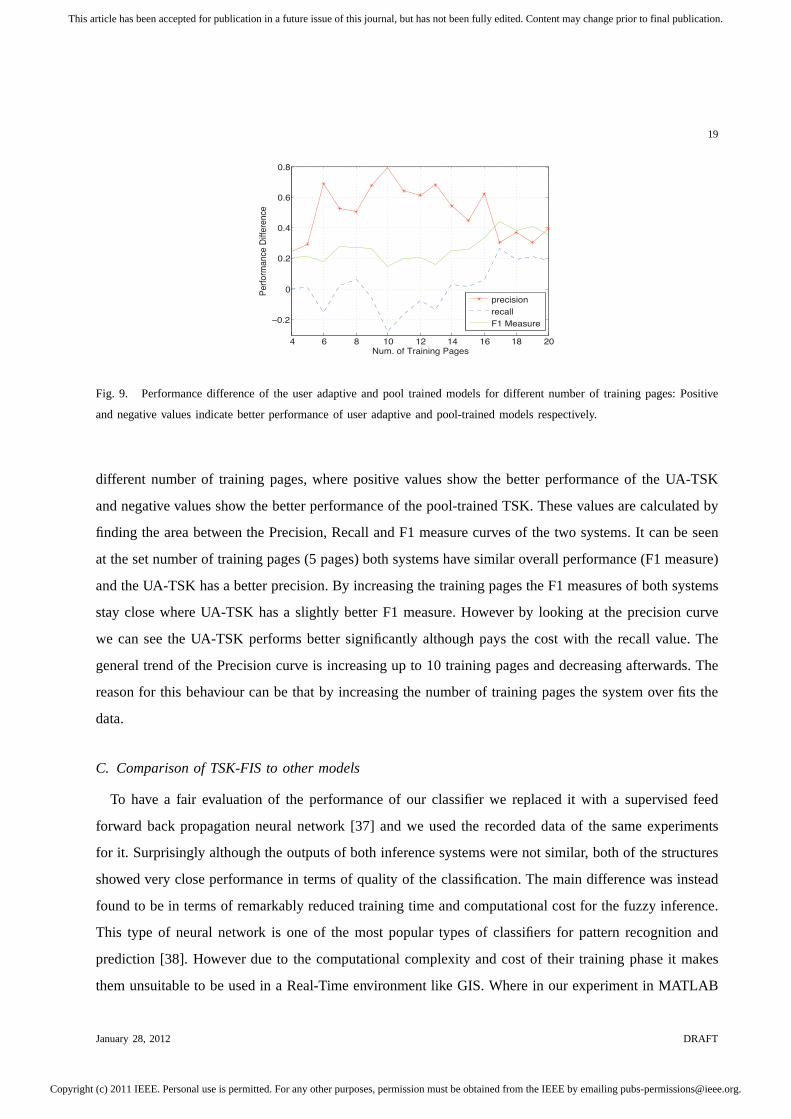
Fig. 9. Performance difference of the user adaptive and pooltrained models for different number of training pages: Positive
and negative values indicate better performance of user adaptive and pool-trained models respectively.
different number of training pages, where positive values show the better performance of the UA-TSK
and negative values show the better performance of the pool-trained TSK. These values are calculated by
finding the area between the Precision, Recall and F1 measurecurves of the two systems. It can be seen
at the set number of training pages (5 pages) both systems have similar overall performance (F1 measure)
and the UA-TSK has a better precision. By increasing the training pages the F1 measures of both systems
stay close where UA-TSK has a slightly better F1 measure. However by looking at the precision curve
we can see the UA-TSK performs better significantly althoughpays the cost with the recall value. The
general trend of the Precision curve is increasing up to 10 training pages and decreasing afterwards. The
reason for this behaviour can be that by increasing the number of training pages the system over fits the
data.
C. Comparison of TSK-FIS to other models
To have a fair evaluation of the performance of our classifierwe replaced it with a supervised feed
forward back propagation neural network [37] and we used therecorded data of the same experiments
for it. Surprisingly although the outputs of both inferencesystems were not similar, both of the structures
showed very close performance in terms of quality of the classification. The main difference was instead
found to be in terms of remarkably reduced training time and computational cost for the fuzzy inference.
This type of neural network is one of the most popular types ofclassifiers for pattern recognition and
prediction [38]. However due to the computational complexity and cost of their training phase it makes
them unsuitable to be used in a Real-Time environment like GIS. Where in our experiment in MATLAB
January 28, 2012 DRAFT

Copyright (c) 2011 IEEE. Personal use is permitted. For any other purposes, permission must be obtained from the IEEE by emailing [email protected].
This article has been accepted for publication in a future issue of this journal, but has not been fully edited. Content may change prior to final publication.
20
on average it took approximately 180.10 seconds for the neural network to be trained for each user versus
the training time for the TSK-FIS with 0.7 seconds.
Figure 7 shows the precision of these networks for increasing number of neurons from 10 to 200 in
steps of 10. We can see the precision is extremely sensitive to the number of neurons also it has a lot of
fluctuations that suggests randomness in the results. The mean precision at the best system performance
does not go above 0.8. As a result for our data we can conclude,compared to fuzzy logic systems,
neural networks are not a good candidate because of their extreme sensitivity to the number of neurons.
It is common that to choose the number of neurons that shows the best output. The problem with that
requirement in this case is that every time a new user is introduced a new system should be trained
and for every new user we need to discover the best number of neurons. This would make our system
computationally complex, costly and very slow in the real-time experiment.
One advantage of fuzzy logic over LDA and SVM models is its output as a membership degree versus
the crisp output of the other two. In other words if the LDA andSVM were used in this framework the
only information one would have about a user’s interest in animage would be limited to whether such
an interest existed. After we tested our data with LDA the average precision, recall and F1 for all users
where 0.75, 0.56, 0.63 respectively. By looking at Figure 8 we can see at the precision=0.75 we have
almost the same output.
In another attempt we evaluated our data with the Logistic Regression (LR) Model which the corre-
sponding results are shown in Figure 8. We can see that with our data the precision of this model is
always under 70%. After we doubled the number of training pages for the LR model to 10 pages, we
observed that although the precision curve elevated but it never exceeded 90%. We can see that for our
data the sensitivity of this model to the thresholds larger than 0.2 is very low and it almost produces
similar outputs by changing the threshold and at its best precision the overall performance (F1) is worse
than the TSK where for the UA-TSK model by setting the threshold on 0.35 we get over 55% recall
with 70% precision versus the 45% of recall with the same precision at the threshold of 0.95 for LR.
VII. C ONCLUSION
A real-time user adaptive framework is introduced which is capable of measuring the interest of the
users to images that appear on the screen by tracking their eyes. This framework assigns a User Interest
Level score to every observed image that can be used for imageannotation. In this framework a TSK-
Fuzzy Inference System was developed to process the gaze data. This algorithm was able to be trained
for every user and produce results with high accuracy at an acceptable rate. The chosen gaze features
January 28, 2012 DRAFT

Copyright (c) 2011 IEEE. Personal use is permitted. For any other purposes, permission must be obtained from the IEEE by emailing [email protected].
This article has been accepted for publication in a future issue of this journal, but has not been fully edited. Content may change prior to final publication.
21
and the form of output of the framework make it flexible where by some trivial changes it can be used
for retrieval purpose and measurement of the user’s interest to other forms of visual objects on screen.
REFERENCES
[1] A. L. Yarbus, Eye Movements and Vision. New York: Plenum Press, 1967, translated from Russian by Basil Haigh.
Original Russian edition published in Moscow in 1965.
[2] K. Rayner, “Eye movements in reading and information processing: 20 years of research,”Psychological Bulletin, vol.
124, no. 3, pp. 372–422, 1998.
[3] M. F. Lan, “Vision, eye movements, and natural behavior,” Visual Neuroscienc, vol. 26, no. 1, pp. 51–62, 2009.
[4] J. D. S. andRoel Vertegaal andChanguk Sohn, “Viewpointer: Lightweight calibration-free eye tracking for ubiquitous
handsfree deixis,” inProceedings of UIST 2005, 2005, pp. 53–61.
[5] D. R. Hardoon and K. Pasupa, “Image ranking with implicitfeedback from eye movements,” inProceedings of the 2010
Symposium on Eye-Tracking Research Applications, ser. ETRA ’10. New York, NY, USA: ACM, 2010, pp. 291–298.
[6] L. Kozma, A. Klami, and S. Kaski, “Gazir: gaze-based zooming interface for image retrieval,” inProceedings of the 2009
international conference on Multimodal interfaces, ser. ICMI-MLMI ’09. New York, NY, USA: ACM, 2009, pp. 305–312.
[7] K. Pasupa, A. Klami, C. J. Saunders, S. Kaski, S. Szedmak,and S. R. Gunn, “Learning to rank images from eye movements,”
in In HCI 09: Proceeding of the IEEE 12th International Conference on Computer Vision (ICCV09) Workshops on Human-
Computer Interaction, 2009, pp. 2009–2016.
[8] Z. Zhu, K. Fujimura, and Q. Ji, “Real-time eye detection and tracking under various light conditions,” inIn Proceedings
of ETRA: Eye Tracking Research and Applications Symposium. ACM Press, 2002, pp. 139–144.
[9] D. Djordjevic, “User relevance feedback, search and retrieval of visual content,” Ph.D. dissertation, Queen Mary University
of London, London, UK, 2006.
[10] X. S. Zhou and T. S. Huang, “Relevance feedback in image retrieval: A comprehensive review,”Multimedia Systems,
vol. 8, pp. 536–544, 2003.
[11] B. Russell, A. Torralba, and W. T. Freeman, “Labelme theopen annotation tool,” http://labelme.csail.mit.edu/, accessed
on: 09/04/2011.
[12] R. Shi, H. Feng, T.-S. Chua, and C.-H. Lee, “An adaptive image content representation and segmentation approach to
automatic image annotation,” inImage and Video Retrieval, ser. Lecture Notes in Computer Science. Springer Berlin
Heidelberg, 2004, vol. 3115, pp. 1951–1951.
[13] H. Ma, J. Zhu, M.-T. Lyu, and I. King, “Bridging the semantic gap between image contents and tags,”Multimedia, IEEE
Transactions on, vol. 12, no. 5, pp. 462–473, 2010.
[14] L. Seneviratne and E. Izquierdo, “Image annotation through gaming (tag4fun),” inDigital Signal Processing, 2009 16th
International Conference on, 2009, pp. 1–6.
[15] A. Yazdani, J.-S. Lee, and T. Ebrahimi, “Implicit emotional tagging of multimedia using eeg signals and brain computer
interface,” inProceedings of the first SIGMM workshop on Social media, ser. WSM ’09. New York, NY, USA: ACM,
2009, pp. 81–88.
[16] S. Hajimirza and E. Izquierdo, “Gaze movement inference for implicit image annotation,” inImage Analysis for Multimedia
Interactive Services (WIAMIS), 2010 11th International Workshop on, 2010, pp. 1–4.
[17] J. M. Wolfe, T. S. Horowitz, N. Kenner, M. Hyle, and N. Vasan, “How fast can you change your mind? the speed of
top-down guidance in visual search,”Vision Research, vol. 44, no. 12, pp. 1411–1426, 2004.
January 28, 2012 DRAFT

Copyright (c) 2011 IEEE. Personal use is permitted. For any other purposes, permission must be obtained from the IEEE by emailing [email protected].
This article has been accepted for publication in a future issue of this journal, but has not been fully edited. Content may change prior to final publication.
22
[18] C. Ludwig and I. Gilchrist, “Goal-driven modulation ofoculomotor capture,”Attention, Perception, and Psychophysics,
vol. 65, pp. 1243–1251, 2003.
[19] P. Auer, Z. Hussain, S. Kaski, A. Klami, J. Kujala, J. Laaksonen, A. Leung, K. Pasupa, and J. Shawe-Taylor, “Pinview:
Implicit feedback in content-based image retrieval,” inWorkshop on Applications of Pattern Analysis, ser. WAPA ’10, 2010,
pp. 21–57.
[20] A. Klami, C. Saunders, T. E. de Campos, and S. Kaski, “Canrelevance of images be inferred from eye movements?” in
Proceeding of the 1st ACM international conference on Multimedia information retrieval, ser. MIR ’08. New York, NY,
USA: ACM, 2008, pp. 134–140.
[21] C. Koch and S. Ullman, “Shifts in selective visual attention: Towards the underlying neural circuitry,”Human Neurobiology,
vol. 4, pp. 219–227, 1985.
[22] M. J. Proulx, “Bottom-up guidance in visual search for conjunctions,” Journal of Experimental Psychology: Human
Perception and Performance, vol. 33, no. 1, pp. 48–56, 2007.
[23] F. Marquez, A. Peregrin, and F. Herrera, “Cooperative evolutionary learning of linguistic fuzzy rules and parametric
aggregation connectors for mamdani fuzzy systems,”Fuzzy Systems, IEEE Transactions on, vol. 15, no. 6, pp. 1162–1178,
2007.
[24] K. Tomanek, U. Hahn, S. Lohmann, and J. Ziegler, “A cognitive cost model of annotations based on eye-tracking data,”
in Proceedings of the 48th Annual Meeting of the Association for Computational Linguistics. Stroudsburg, PA, USA:
Association for Computational Linguistics, 2010, pp. 1158–1167.
[25] O. Oyekoya and F. Stentiford, “A performance comparison of eye tracking and mouse interfaces in a target image
identification task,”IEE Seminar Digests, vol. 2005, no. 11099, pp. 139–144, 2005.
[26] Y. Zhang, H. Fu, Z. Liang, Z. Chi, and D. Feng, “Eye movement as an interaction mechanism for relevance feedback in a
content-based image retrieval system,” inProceedings of the 2010 Symposium on Eye-Tracking Research& Applications.
New York, NY, USA: ACM, 2010, pp. 37–40.
[27] A. Ajanki, D. R. Hardoon, S. Kaski, K. Puolamaki, and J.Shawe-Taylor, “Can eyes reveal interest? implicit queriesfrom
gaze patterns,”User Modeling and User-Adapted Interaction, vol. 19, pp. 307–339, 2009.
[28] P. Estevez, M. Tesmer, C. Perez, and J. Zurada, “Normalized mutual information feature selection,”Neural Networks, IEEE
Transactions on, vol. 20, no. 2, pp. 189–201, 2009.
[29] J.-S. R. Jang, “Neuro-fuzzy modeling :architectures,analyses, and applications,” Ph.D. dissertation, University of California,
Berkeley, CA 94720, 1992.
[30] C. Wagner and H. Hagras, “Toward general type-2 fuzzy logic systems based on zslices,”Fuzzy Systems, IEEE Transactions
on, vol. 18, no. 4, pp. 637 –660, 2010.
[31] A. Celikyilmaz and I. Burhan Turksen, “Enhanced fuzzy system models with improved fuzzy clustering algorithm,”Fuzzy
Systems, IEEE Transactions on, vol. 16, no. 3, pp. 779–794, 2008.
[32] S.-M. Zhou and J. Q. Gan, “Extracting takagi-sugeno fuzzy rules with interpretable submodels via regularization of linguistic
modifiers,” IEEE Transactions on Knowledge and Data Engineering, vol. 21, pp. 1191–1204, 2009.
[33] S. Sivanandam, S. Sumathi, and S. N. Deepa,Introduction to Fuzzy Logic using MATLAB. Berlin Heidelberg: Springer,
2007.
[34] D. Li, C. Zhong, and L. Zhang, “Fuzzy c-means clusteringof partially missing data sets based on statistical representation,”
in Fuzzy Systems and Knowledge Discovery (FSKD), 2010 SeventhInternational Conference on, vol. 1, 2010, pp. 460
–464.
January 28, 2012 DRAFT

Copyright (c) 2011 IEEE. Personal use is permitted. For any other purposes, permission must be obtained from the IEEE by emailing [email protected].
This article has been accepted for publication in a future issue of this journal, but has not been fully edited. Content may change prior to final publication.
23
[35] N. Verma, P. Gupta, P. Agrawal, and Y. Cui, “Mri brain image segmentation for spotting tumors using improved mountain
clustering approach,” inApplied Imagery Pattern Recognition Workshop (AIPRW), 2009 IEEE, 2009, pp. 1 –8.
[36] S. L. Chiu, “Fuzzy model estimation based on cluster esimation,” Journal of Intelligent and Fuzzy Systems, vol. 2, no. 3,
pp. 267–278, September 1994.
[37] MATLAB, version 7.10.0 (R2010a). Natick, Massachusetts: The MathWorks Inc., 2010.
[38] N. Chowdhury and M. Kashem, “A comparative analysis of feed-forward neural network 26; recurrent neural network to
detect intrusion,” inElectrical and Computer Engineering, 2008. ICECE 2008. International Conference on, 2008, pp. 488
–492.
Navid Hajimirza received his MSc. degree in Mechatronics Engineering from Kings College, University
of London in 2008 and the BSc. Degree in Electronics Engineering from Noshirvani Faculty of Technology,
Mazandaran University in 2005 . He is currently pursuing hisPhD. degree with the Multimedia and Vision
Group, School of Electronics Engineering and Computer Science, Queen Mary University of London.
He is a researcher in human-computer interaction and his research interests lie in image processing,
eye-tracking methods, human cognition, human vision, image annotation and retrieval, machine learning,
fuzzy logic, neural networks, robot vision and robot self-localisation.
Michael J Proulx is Lecturer of Cognitive Psychology and founder of the Crossmodal Cognition Lab-
oratory in the Research Centre for Psychology of the School of Biological and Chemical Sciences. He
received his MA and PhD in Psychological and Brain Sciences from Johns Hopkins University and his
BSc in Psychology from Arizona State University.
He has published over 30 technical papers and book chapters on multisensory integration, attention,
ergonomics, auditory-to-visual sensory substitution, synaesthesia, visual search, and eye-tracking for image
annotation and he is the recipient of the APA Division of Experimental Psychology New Investigator Award in Human Perception
and Performance.
Dr Proulx is a member of the editorial board for PLoS ONE and isa guest editor for a forthcoming special issue of Neuroscience
and Biobehavioral Reviews. His international expertise has been acknowledged through awards and invited presentations, such
as opening speaker for the meeting of the International Multisensory Research Forum in Japan and the American Psychological
Association’s Science Showcase Award. Dr Proulx also has private sector experience in project management for a survey research
firm after his first degree. In acknowledgement of Dr Proulxs role as a research supervisor and lecturer he was awarded the
2011 Drapers Award for Excellence in Teaching, and is a Fellow of the Higher Education Academy (UK).
January 28, 2012 DRAFT

Copyright (c) 2011 IEEE. Personal use is permitted. For any other purposes, permission must be obtained from the IEEE by emailing [email protected].
This article has been accepted for publication in a future issue of this journal, but has not been fully edited. Content may change prior to final publication.
24
Ebroul Izquierdo (M97SM02) received the Dr.Rerun Naturalium (Ph.D. degree)from the Humboldt
University, Berlin, Germany, in 1993 for his thesis on the numerical approximation of algebraic-differential
equations.
Since 2000, he has been with the Electronic Engineering Department, Queen Mary, University of
London (QMUL), London, U.K. He is a Professor (Chair) of Multimedia and Computer Vision and Head
of the Multimedia and Vision Group at QMUL. From 1990 to 1992,he was a Teaching Assistant at
the Department of Applied Mathematics, Technical University of Berlin. From 1993 to 1997, he was with the Heinrich-Hertz
Institute for Communication Technology, Berlin, as an Associate Researcher. From 1998 to 1999, he was a Senior Research
Officer with the Department of Electronic Systems Engineering, University of Essex, Colchester, U.K. He has published over 300
technical papers, including chapters in books. He coordinated the European Union IST project BUSMAN on video annotation
and retrieval. He is a main contributor to the IST integratedprojects aceMedia and MESH on the convergence of knowledge,
semantics, and content for user-centred intelligent mediaservices. He coordinates the European project Cost292 and the FP6
network of excellence on semantic inference for automatic annotation and retrieval of multimedia content, K-Space.
Prof. Izquierdo is an Associate Editor of the IEEE TRANSACTIONS ON CIRCUITS AND SYSTEMS FOR VIDEO
TECHNOLOGY (TCSVT) and the EURASIP Journal on Image and Video Processing. He has served as a Guest Editor of
three special issues of the IEEE TRANSACTIONS ON CIRCUITS AND SYSTEMS FOR VIDEO TECHNOLOGY, a special
issue of the journal Signal Processing: Image Communication, and a special issue of the EURASIP Journal on Applied Signal
Processing. He is a Chartered Engineer, a Fellow of the Institution of Engineering and Technology (IET), Chairman of the
Executive Group of the IET Visual Engineering ProfessionalNetwork, a member of the British Machine Vision Association, and
a member of the Steering Board of the Networked Audiovisual Media technology platform of the European Union. He is member
of the programme committee of the IEEE Conference on Information Visualization, the International Program Committee of
EURASIP, and the IEEE Conference on Video Processing and Multimedia Communication and the European Workshop on
Image Analysis for Multimedia Interactive Services. He hasserved as a Session Chair and organizer of invited sessions at
several conferences.
January 28, 2012 DRAFT