urban water balance and hydrology models - centaurcentaur.reading.ac.uk/52792/1/urban water...
TRANSCRIPT
Urban water balance and hydrology models Book or Report Section
Accepted Version
Moors, E. J., Grimmond, C. S. B., Veldhuizen, A. B., Järvi, L. and van der Bolt, F. (2014) Urban water balance and hydrology models. In: Chrysoulakis, N., de Castro, E. A. and Moors, E. J. (eds.) Understanding Urban Metabolism. Routledge, pp. 106116. ISBN 9780415835114 Available at http://centaur.reading.ac.uk/52792/
It is advisable to refer to the publisher’s version if you intend to cite from the work. See Guidance on citing .
Publisher: Routledge
All outputs in CentAUR are protected by Intellectual Property Rights law, including copyright law. Copyright and IPR is retained by the creators or other copyright holders. Terms and conditions for use of this material are defined in the End User Agreement .
www.reading.ac.uk/centaur
CentAUR

Central Archive at the University of Reading
Reading’s research outputs online

Moors EJ, CSB Grimmond, A Veldhuizen, L Järvi, F van der Bolt 2015: Urban water balance and hydrology models (Chapter 10) in Understanding Urban
Metabolism ed N Chrysoulakis, E Castro, E Moors, Routledge, 106-116 http://www.routledge.com/books/details/9780415835114/ ISBN 978-0-415-83511-4
1
URBAN WATER BALANCE AND HYDROLOGY MODELS
Eddy J. Moors1, CSB Grimmond2,3, Ab Veldhuizen1, Leena Järvi4 and Frank van der Bolt1 1Alterra - Wageningen UR, Department of Physics, P.O. Box 47, 6700 AA, Wageningen, The Netherlands, t+31-317-486431,
[email protected] University of Reading, Department of Meteorology, Reading UK RG6 6BB, UK, T: 44 118 378 6248
[email protected] 3 King’s College London, Department of Geography, London WC2R 2LS, UK, 4 University of Helsinki, Department
of Physics, PL 48, FIN-00014, Helsinki, Finland,
INTRODUCTION
The urban water balance ensures conservation of mass of water in the same way the energy balance requires conservation of energy
(Chapter 4 for details). By considering all the exchanges in the urban water balance, insight can be gained into the dynamic
processes and feedback mechanisms in the urban environment, providing important insights into urban sustainability.
To create a sustainable urban area requires a coherent strategy that applies planning/design tools at the appropriate scale and ensures
that actions at one scale are not counteracted at another. These strategies need to apply not only to the built area, but also to the
surrounding area that is intertwined. To integrate these sustainability principles into urban planning strategies at the level of land use
(1:5000 - 10,000; neighbourhood to settlement) and master plans (1:500 - 1000; building block), knowledge of the urban water
balance is needed as a guidance for innovative planning and design on a more detailed level. In addition, an accurate representation
of the urban water balance through modelling is imperative for the assessment of future sustainable urban water management
practices, realistic simulation of urban surface processes and for predicting the effects of climate change.
In urban areas the water system often consists of two separate parts that strongly interact: the semi-natural surface and groundwater
system and the man-made sewer and supply systems. Knowledge of the semi-natural surface and groundwater system is especially
important at the level of neighbourhood and master plans, while the man-made sewer and supply systems become essential at the
more detailed level.
As this book aims to support planning processes at the scale of city to neighbourhoods and master plans, the emphasis in this
chapter is on hydrological models rather than more detailed hydraulic models needed to design an urban sewer system. After a short
review of the available types of urban water balance models, two urban water balance models used in the BRIDGE project
(Chrysoulakis et al. 2013) SIMGRO and SUEWS are presented. These physically based hydrological models for urban spatial
planning are applied in two BRIDGE case study cities, London and Helsinki. The energy and water balances are linked by the
evaporative or latent heat flux terms (see Chapter 4 for details). The urban land surface models that determine the surface energy
balance fluxes were tested independently, as it has been presented in Chapter 9.
OVERVIEW OF URBAN WATER BALANCE MODELS
In the literature three general types of urban water balance models exist with varying degrees of complexity and spatial extent. Each
is described below.
Mass balance models
Models based on the mass balance are largely used to determine the urban water balance for urban hydrology and water
management applications. They consider both natural and anthropogenic hydrological systems through the use of a number of
empirical relations to determine the fluxes and storage of the urban system for the desired spatial and temporal scale. The latter
depends on data availability and resolution (typically daily data are used). These models consider the inputs, outputs, flows and
stores of the water balance.
Grimmond & Oke (1986) describe such a model and evaluate it using observations from Vancouver, Canada. That model has been
used to study urban irrigation and the urban water link to the energy budget via evapotranspiration. Two urban water balance
models developed in Australia for the assessment of water management techniques are Aquacycle (Mitchell et al. 2001) and the
Urban Volume and Quality (UVQ) model (Mitchell & Diaper 2005). Aquacycle contains options to apply water management
techniques to the urban water balance and was evaluated using data from Woden Valley, Canberra, Australia (Mitchell et al. 2003).
UVQ is essentially an expanded version of Aquacycle with the added ability to model contaminant fluxes (Diaper & Mitchell 2007)
for a number of cities around the world (Wolf et al. 2007). Site specific input values are required to calibrate and run the models
with three nested spatial scales in each (unit block property), cluster (neighbourhood) and the study area as a whole (Wolf et al.
2007). Unlike the Urban Water Balance model of Grimmond & Oke (1986), there is less focus on required meteorological data,
with only daily precipitation and potential evapotranspiration values needed.
Surface atmosphere transfer schemes
Secondly, urban parameterization schemes used in global and meso-scale numerical weather models are available; examples include
the Urban Hydrological Element (UHE) model (Berthier et al. 2004, 2006); the urbanized Submesoscale Soil Model (SM2-U)
(Dupont et al. 2006); the combined Town Energy Balance and Interaction Soil-Biosphere-Atmosphere scheme (TEB-806 ISBA)
(Lemonsu et al. 2007); and the Surface Urban Energy and Water balance Scheme (SUEWS) (Järvi et al. 2011). Each scheme differs
in complexity and focus, but in essence all are formed of a number of surface and subsurface layers and model the surface water
balance using inputs from a numerical atmospheric model (typically net radiation and precipitation) and generate outputs for use in
the next model time step (evapotranspiration). All the schemes presented use no, or very simple drainage networks and have mixed
land uses (urban and natural surface types), each of which have individual surface and hydrologic properties weighted by their
relative areal coverage of a particular grid box. Unlike the dedicated urban water balance models, these parameterizations focus only
on the external water system.
Moors EJ, CSB Grimmond, A Veldhuizen, L Järvi, F van der Bolt 2015: Urban water balance and hydrology models (Chapter 10) in Understanding Urban
Metabolism ed N Chrysoulakis, E Castro, E Moors, Routledge, 106-116 http://www.routledge.com/books/details/9780415835114/ ISBN 978-0-415-83511-4
2
The UHE model (Berthier et al. 2004, 2006) focuses on simulating storm water runoff and soil infiltration within the urban water
balance. Two main layers are used: a surface layer with three possible land cover types (natural, paved and building roof) and a soil
layer (subdivided into an upper and lower sub-layer for infiltration purposes), which takes the form of a fine mesh grid. In addition
to these layers, there is a storm water drainage system which is represented as a trench collecting all available runoff as well as
seepage from soil water (this acts in both directions depending on soil moisture conditions). The original version (Berthier et al.
2004) considered evapotranspiration (and infiltration) by applying a ‘mixed’ boundary condition on modelled soil moisture,
observed rainfall and potential evapotranspiration. Further developments included a dual evapotranspiration scheme based on the
Penman-Monteith-Rutter-Shuttleworth equation (Grimmond & Oke 1991) for paved and roof surfaces and a scheme based on
Feddes et al. (1988) to calculate the potential evaporation and transpiration for the natural surface types (Berthier et al. 2006).
Model evaluation was done using site specific parameters and observed meteorological and hydrological variables from the Reze
field site, Nantes.
SM2-U is a mesoscale model surface parameterisation scheme (Dupont et al. 2006) formed of four levels (lower atmosphere,
surface layer, root zone and deep soil) and a rudimentary drainage network as used in Berthier et al. (2004). It is an extension of
Noilhan & Planton’s (1989) ISBA scheme with the addition of four artificial urban surface types (building roofs, paved surfaces,
vegetation elements over paved surfaces and paved surfaces below vegetation), each with their own surface properties (Dupont et al.
2006). The scheme was evaluated with data from three measurement sites, two rural and the suburban site at Reze which allowed
comparison of the runoff running through the drainage network with the original version of UHE (Berthier et al. 2004). It was
concluded that the SM2-U scheme performed well annually and in summer storm events in comparison to UHE but was poor at
simulating winter storms as infiltration to and from the drainage network was not modelled.
Lemonsu et al. (2007) also used ISBA but with Masson’s (2000) Town Energy Balance (TEB) urban surface parameterization
scheme. The scheme has three layers (the surface and two soil layers) and four surface types, the three ISBA vegetation surfaces
(bare soil, soil between vegetation and vegetation) and an urban surface which in TEB is modelled as a three dimensional urban
canyon. An off-line simulation of the TEB-ISBA water balance was undertaken using meteorological data to force the model and
input parameters from the literature relevant to a suburban area. The results were compared with data from the Reze study area.
Discrepancies between modelled and observed runoff suggested further work on the parameterization of surface infiltration through
roads was needed (Lemonsu et al. 2007).
The fourth surface parameterization scheme SUEWS simulates the urban water balance components including irrigation, surface
runoff, infiltration, evaporation and storage at a local or neighbourhood scale (Järvi et al. 2011). It consists of three layers (the
surface and two soil layers) and seven surface types (paved, buildings, evergreen and deciduous trees/shrubs, irrigated and non-
irrigated grass and water). SUEWS does not have separate tiles for urban and vegetative surface fractions, but rather dynamic
interaction between the different surface types is allowed. The model has been successfully run for Los Angeles, USA, and
Vancouver, Canada. As its performance in cold climate cities in wintertime was poor due to the inadequate description of snow,
further development has been undertaken (Järvi et al. 2014).
Hydrological models
Hydrologic models are typically composed of two parts: a surface scheme and a hydrological flow model (described as a natural,
anthropogenic or a combination drainage system often represented by a combination of a surface and groundwater module) that
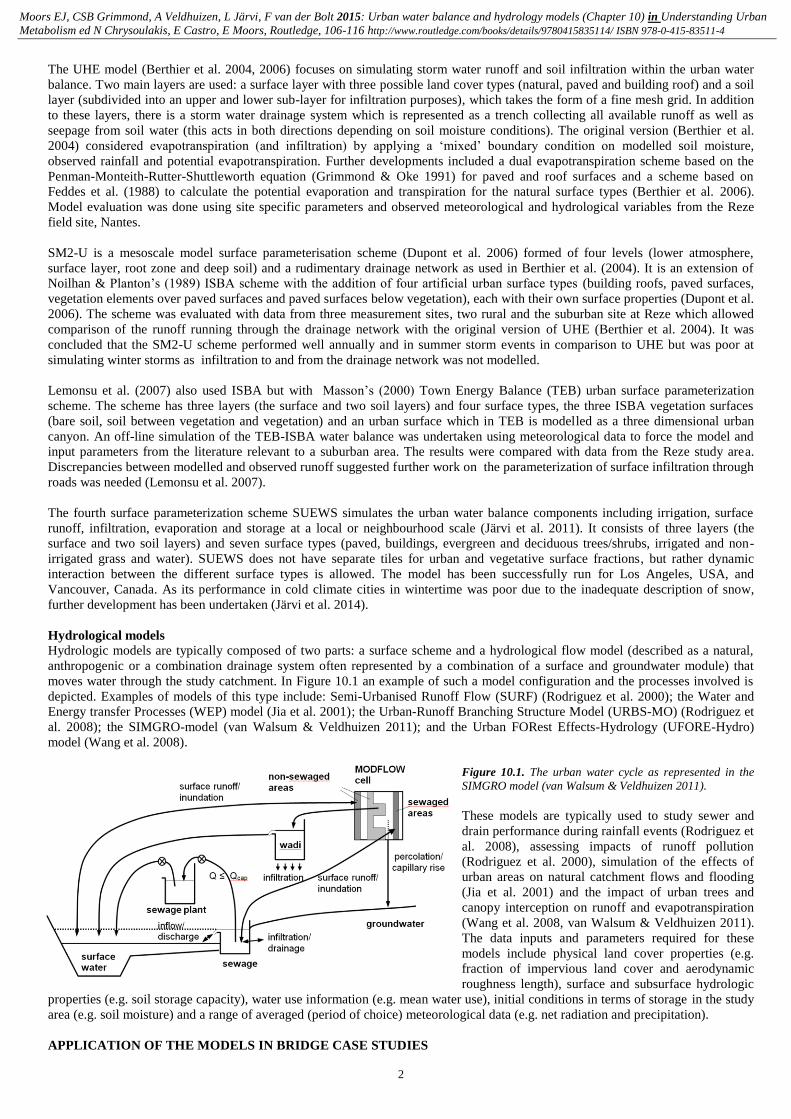
moves water through the study catchment. In Figure 10.1 an example of such a model configuration and the processes involved is
depicted. Examples of models of this type include: Semi-Urbanised Runoff Flow (SURF) (Rodriguez et al. 2000); the Water and
Energy transfer Processes (WEP) model (Jia et al. 2001); the Urban-Runoff Branching Structure Model (URBS-MO) (Rodriguez et
al. 2008); the SIMGRO-model (van Walsum & Veldhuizen 2011); and the Urban FORest Effects-Hydrology (UFORE-Hydro)
model (Wang et al. 2008).
Figure 10.1. The urban water cycle as represented in the
SIMGRO model (van Walsum & Veldhuizen 2011).
These models are typically used to study sewer and
drain performance during rainfall events (Rodriguez et
al. 2008), assessing impacts of runoff pollution
(Rodriguez et al. 2000), simulation of the effects of
urban areas on natural catchment flows and flooding
(Jia et al. 2001) and the impact of urban trees and
canopy interception on runoff and evapotranspiration
(Wang et al. 2008, van Walsum & Veldhuizen 2011).
The data inputs and parameters required for these
models include physical land cover properties (e.g.
fraction of impervious land cover and aerodynamic
roughness length), surface and subsurface hydrologic
properties (e.g. soil storage capacity), water use information (e.g. mean water use), initial conditions in terms of storage in the study
area (e.g. soil moisture) and a range of averaged (period of choice) meteorological data (e.g. net radiation and precipitation).
APPLICATION OF THE MODELS IN BRIDGE CASE STUDIES
Moors EJ, CSB Grimmond, A Veldhuizen, L Järvi, F van der Bolt 2015: Urban water balance and hydrology models (Chapter 10) in Understanding Urban
Metabolism ed N Chrysoulakis, E Castro, E Moors, Routledge, 106-116 http://www.routledge.com/books/details/9780415835114/ ISBN 978-0-415-83511-4
3
As an illustration of how urban water balance models can be used to consider sustainable planning strategies, the application is
presented of two models of the BRIDGE project, i.e. a surface atmosphere transfer scheme (SUEWS) and a hydrological model
(SIMGRO). Here SUEWS is applied to Helsinki to evaluate its performance and both models are applied to the London case study.
In the next sections a short description of the two sites, model set-up and scenarios is given. A more detailed description of both
sites, as well as of the measurements taken at these sites is given in Chapter 5, whereas the urban Planning Alternatives (PA) that
considered in BRIDGE are presented in detail in Chapter 3.
Helsinki
In Helsinki, runoff observations were undertaken in three catchments (see Chapter 5, and Table 10.1): Pasila (Pa) with few pervious
surfaces and a complex building and pedestrian road structure, Pihlajamäki (Pi) with much less built-up, or impervious surfaces and
Veräjämäki (not included in Table 10.1) where the surface is mainly natural vegetation. The high fraction of impervious surfaces
has a clear influence on the water balance. For example, in November 2010 runoff from the high-intensity built catchment was
seven times higher than from the low-intensity built catchment. In November 2010, the monthly precipitation 62 mm was observed
at the Kumpula site and in the low-intensity catchment 8% of this left the catchment as runoff, whereas in the medium- and high-
intensity catchments over 50% of the precipitation ended up in runoff. This shows how increasing impervious surface cover
enhances the risk for urban floods, while water storage and evaporation to vegetation cover decreases.
Here SUEWS is used to simulate summer water balance for January - August 2010 at the Pa and Pi catchments (Table 10.1). The
first four months is the spin-up time to ensure, such things as soil moisture and surface states are appropriate. The forcing data used
were from the nearby SMEAR III measurement station (Järvi et al. 2009). Thus the amount of precipitation at both sites is assumed
to be the same (168 mm total for the period), but in Pi the amount of external irrigation is clearly smaller, causing precipitation to be
the more important source of water. In Pi there is lots of natural state vegetation whereas in Pa, despite the smaller fraction of
vegetation, it is more managed. At both sites, the change in soil water storage helps to maintain evaporation in summer time June to
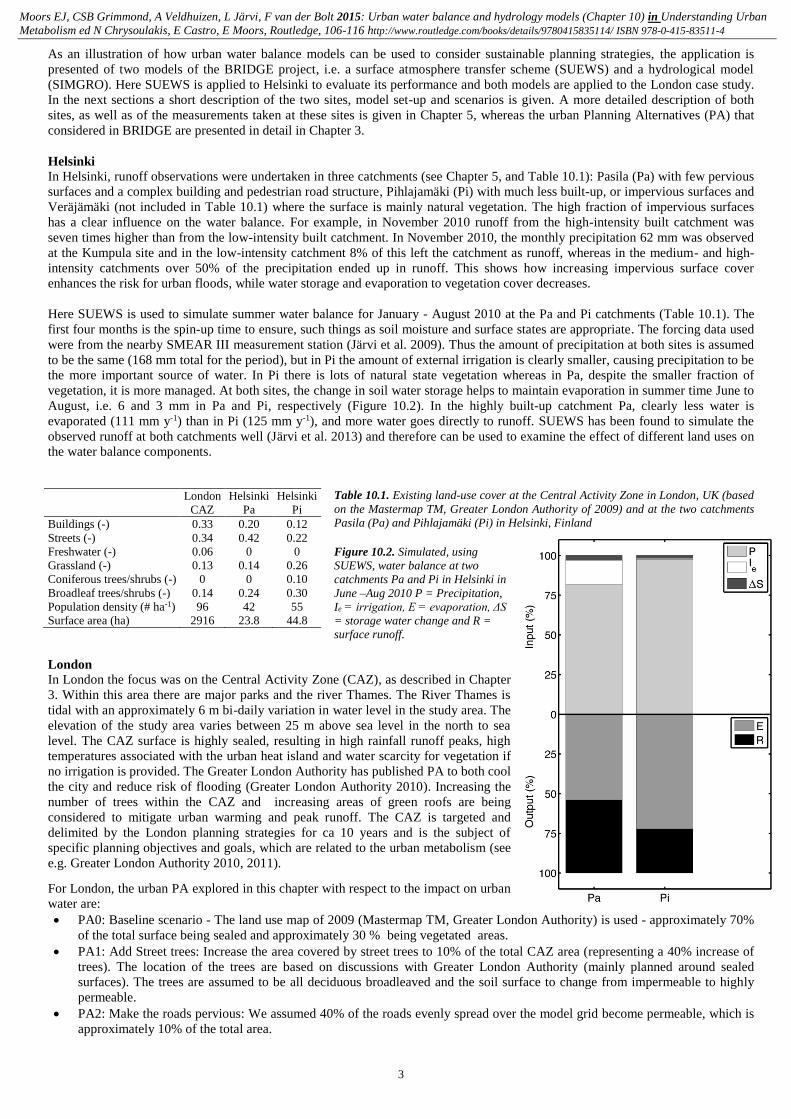
August, i.e. 6 and 3 mm in Pa and Pi, respectively (Figure 10.2). In the highly built-up catchment Pa, clearly less water is
evaporated (111 mm y-1) than in Pi (125 mm y-1), and more water goes directly to runoff. SUEWS has been found to simulate the
observed runoff at both catchments well (Järvi et al. 2013) and therefore can be used to examine the effect of different land uses on
the water balance components.
Table 10.1. Existing land-use cover at the Central Activity Zone in London, UK (based
on the Mastermap TM, Greater London Authority of 2009) and at the two catchments
Pasila (Pa) and Pihlajamäki (Pi) in Helsinki, Finland
Figure 10.2. Simulated, using
SUEWS, water balance at two
catchments Pa and Pi in Helsinki in
June –Aug 2010 P = Precipitation,
Ie = irrigation, E = evaporation, ΔS
= storage water change and R =
surface runoff.
London
In London the focus was on the Central Activity Zone (CAZ), as described in Chapter
3. Within this area there are major parks and the river Thames. The River Thames is
tidal with an approximately 6 m bi-daily variation in water level in the study area. The
elevation of the study area varies between 25 m above sea level in the north to sea
level. The CAZ surface is highly sealed, resulting in high rainfall runoff peaks, high
temperatures associated with the urban heat island and water scarcity for vegetation if
no irrigation is provided. The Greater London Authority has published PA to both cool
the city and reduce risk of flooding (Greater London Authority 2010). Increasing the
number of trees within the CAZ and increasing areas of green roofs are being
considered to mitigate urban warming and peak runoff. The CAZ is targeted and
delimited by the London planning strategies for ca 10 years and is the subject of
specific planning objectives and goals, which are related to the urban metabolism (see
e.g. Greater London Authority 2010, 2011).
For London, the urban PA explored in this chapter with respect to the impact on urban
water are:
PA0: Baseline scenario - The land use map of 2009 (Mastermap TM, Greater London Authority) is used - approximately 70%
of the total surface being sealed and approximately 30 % being vegetated areas.
PA1: Add Street trees: Increase the area covered by street trees to 10% of the total CAZ area (representing a 40% increase of
trees). The location of the trees are based on discussions with Greater London Authority (mainly planned around sealed
surfaces). The trees are assumed to be all deciduous broadleaved and the soil surface to change from impermeable to highly
permeable.
PA2: Make the roads pervious: We assumed 40% of the roads evenly spread over the model grid become permeable, which is
approximately 10% of the total area.
London
CAZ
Helsinki
Pa
Helsinki
Pi
Buildings (-) 0.33 0.20 0.12
Streets (-) 0.34 0.42 0.22
Freshwater (-) 0.06 0 0
Grassland (-) 0.13 0.14 0.26
Coniferous trees/shrubs (-) 0 0 0.10
Broadleaf trees/shrubs (-) 0.14 0.24 0.30
Population density (# ha-1) 96 42 55
Surface area (ha) 2916 23.8 44.8
Moors EJ, CSB Grimmond, A Veldhuizen, L Järvi, F van der Bolt 2015: Urban water balance and hydrology models (Chapter 10) in Understanding Urban
Metabolism ed N Chrysoulakis, E Castro, E Moors, Routledge, 106-116 http://www.routledge.com/books/details/9780415835114/ ISBN 978-0-415-83511-4
4
PA3: Add Green roofs: The location of are based on discussions with Greater London Authority. For a green roof to be added,
the roof has to be flat or below 20% and the roof area has to be larger than 25 m2. In this scenario, 2% of roofs in the CAZ
were changed to green areas.
PA4: Make roads pervious and add street trees: This alternative combines A1 and A2.
PA5: Add street trees and increase the surface of green roofs: This alternative combines A1 and A3.
SIMULATION RESULTS FOR URBAN PLANNING ALTERNATIVES
For London SIMGRO and SUEWS were applied for the year 2010 to a 5.4 km x 5.4 km area at a resolution of 200 m x 200 m and
1000 m x 1000 m, respectively. The study area does not correspond to any water management unit or hydrological sub-catchment,
but was chosen to allow the output to be combined with other models that are based on rectangular grids, such as air quality models.
To perform the SIMGRO simulations, current CAZ land cover (see Table 10.1) and the proposed PA 1, 2 and 4 were mapped as 10
Urban Morphological Types (UMTs). Each UMT represents a specific land cover type with specified reservoir characteristics. Not
included in the model as presented in this paper are anthropogenic factors, such as watering gardens and leakage of water supply
and sewerage pipes. In London leakage of pipes is a significant term in the water balance, i.e. 675 Ml d-1 leakage in 2010/2011
(Thames Water 2013).
The greener city planning scenarios are compared to a baseline (PA0: CAZ land cover in 2009) with attention to evapotranspiration,
soil water shortages, and intensity of runoff peaks.
The SIMGRO results show that if the number of trees or other green areas are increased, the natural soil water storage for the
simulated year of 2010 will limit the evapotranspiration rate during a part of the year. If insufficient soil water is available during
hot periods, evaporation will be limited and as a result the potential cooling effect by urban green will not be realised. To maintain
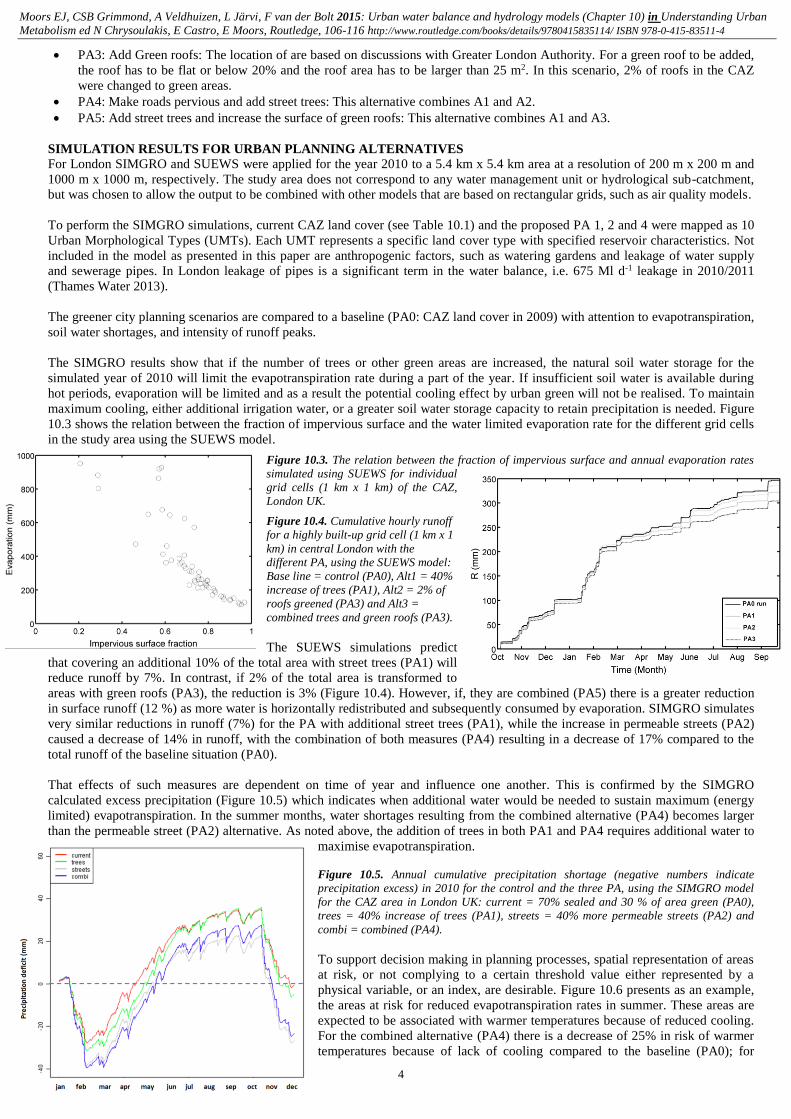
maximum cooling, either additional irrigation water, or a greater soil water storage capacity to retain precipitation is needed. Figure
10.3 shows the relation between the fraction of impervious surface and the water limited evaporation rate for the different grid cells
in the study area using the SUEWS model.
Figure 10.3. The relation between the fraction of impervious surface and annual evaporation rates
simulated using SUEWS for individual
grid cells (1 km x 1 km) of the CAZ,
London UK.
Figure 10.4. Cumulative hourly runoff
for a highly built-up grid cell (1 km x 1
km) in central London with the
different PA, using the SUEWS model:
Base line = control (PA0), Alt1 = 40%
increase of trees (PA1), Alt2 = 2% of
roofs greened (PA3) and Alt3 =
combined trees and green roofs (PA3).
The SUEWS simulations predict
that covering an additional 10% of the total area with street trees (PA1) will
reduce runoff by 7%. In contrast, if 2% of the total area is transformed to
areas with green roofs (PA3), the reduction is 3% (Figure 10.4). However, if, they are combined (PA5) there is a greater reduction
in surface runoff (12 %) as more water is horizontally redistributed and subsequently consumed by evaporation. SIMGRO simulates
very similar reductions in runoff (7%) for the PA with additional street trees (PA1), while the increase in permeable streets (PA2)
caused a decrease of 14% in runoff, with the combination of both measures (PA4) resulting in a decrease of 17% compared to the
total runoff of the baseline situation (PA0).
That effects of such measures are dependent on time of year and influence one another. This is confirmed by the SIMGRO
calculated excess precipitation (Figure 10.5) which indicates when additional water would be needed to sustain maximum (energy
limited) evapotranspiration. In the summer months, water shortages resulting from the combined alternative (PA4) becomes larger
than the permeable street (PA2) alternative. As noted above, the addition of trees in both PA1 and PA4 requires additional water to
maximise evapotranspiration.
Figure 10.5. Annual cumulative precipitation shortage (negative numbers indicate
precipitation excess) in 2010 for the control and the three PA, using the SIMGRO model
for the CAZ area in London UK: current = 70% sealed and 30 % of area green (PA0),
trees = 40% increase of trees (PA1), streets = 40% more permeable streets (PA2) and
combi = combined (PA4).
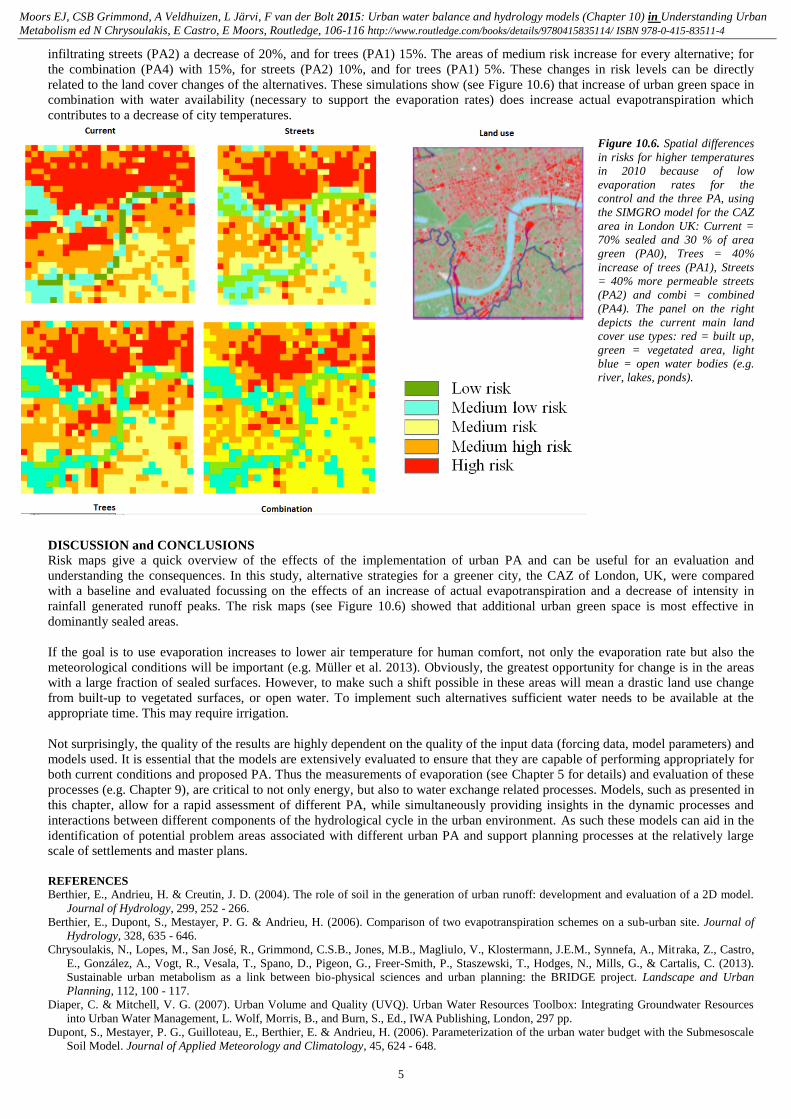
To support decision making in planning processes, spatial representation of areas
at risk, or not complying to a certain threshold value either represented by a
physical variable, or an index, are desirable. Figure 10.6 presents as an example,
the areas at risk for reduced evapotranspiration rates in summer. These areas are
expected to be associated with warmer temperatures because of reduced cooling.
For the combined alternative (PA4) there is a decrease of 25% in risk of warmer
temperatures because of lack of cooling compared to the baseline (PA0); for
Moors EJ, CSB Grimmond, A Veldhuizen, L Järvi, F van der Bolt 2015: Urban water balance and hydrology models (Chapter 10) in Understanding Urban
Metabolism ed N Chrysoulakis, E Castro, E Moors, Routledge, 106-116 http://www.routledge.com/books/details/9780415835114/ ISBN 978-0-415-83511-4
5
infiltrating streets (PA2) a decrease of 20%, and for trees (PA1) 15%. The areas of medium risk increase for every alternative; for
the combination (PA4) with 15%, for streets (PA2) 10%, and for trees (PA1) 5%. These changes in risk levels can be directly
related to the land cover changes of the alternatives. These simulations show (see Figure 10.6) that increase of urban green space in
combination with water availability (necessary to support the evaporation rates) does increase actual evapotranspiration which
contributes to a decrease of city temperatures.
Figure 10.6. Spatial differences
in risks for higher temperatures
in 2010 because of low
evaporation rates for the
control and the three PA, using
the SIMGRO model for the CAZ
area in London UK: Current =
70% sealed and 30 % of area
green (PA0), Trees = 40%
increase of trees (PA1), Streets
= 40% more permeable streets
(PA2) and combi = combined
(PA4). The panel on the right
depicts the current main land
cover use types: red = built up,
green = vegetated area, light
blue = open water bodies (e.g.
river, lakes, ponds).
DISCUSSION and CONCLUSIONS
Risk maps give a quick overview of the effects of the implementation of urban PA and can be useful for an evaluation and
understanding the consequences. In this study, alternative strategies for a greener city, the CAZ of London, UK, were compared
with a baseline and evaluated focussing on the effects of an increase of actual evapotranspiration and a decrease of intensity in
rainfall generated runoff peaks. The risk maps (see Figure 10.6) showed that additional urban green space is most effective in
dominantly sealed areas.
If the goal is to use evaporation increases to lower air temperature for human comfort, not only the evaporation rate but also the
meteorological conditions will be important (e.g. Müller et al. 2013). Obviously, the greatest opportunity for change is in the areas
with a large fraction of sealed surfaces. However, to make such a shift possible in these areas will mean a drastic land use change
from built-up to vegetated surfaces, or open water. To implement such alternatives sufficient water needs to be available at the
appropriate time. This may require irrigation.
Not surprisingly, the quality of the results are highly dependent on the quality of the input data (forcing data, model parameters) and
models used. It is essential that the models are extensively evaluated to ensure that they are capable of performing appropriately for
both current conditions and proposed PA. Thus the measurements of evaporation (see Chapter 5 for details) and evaluation of these
processes (e.g. Chapter 9), are critical to not only energy, but also to water exchange related processes. Models, such as presented in
this chapter, allow for a rapid assessment of different PA, while simultaneously providing insights in the dynamic processes and
interactions between different components of the hydrological cycle in the urban environment. As such these models can aid in the
identification of potential problem areas associated with different urban PA and support planning processes at the relatively large
scale of settlements and master plans.
REFERENCES
Berthier, E., Andrieu, H. & Creutin, J. D. (2004). The role of soil in the generation of urban runoff: development and evaluation of a 2D model.
Journal of Hydrology, 299, 252 - 266.
Berthier, E., Dupont, S., Mestayer, P. G. & Andrieu, H. (2006). Comparison of two evapotranspiration schemes on a sub-urban site. Journal of
Hydrology, 328, 635 - 646.
Chrysoulakis, N., Lopes, M., San José, R., Grimmond, C.S.B., Jones, M.B., Magliulo, V., Klostermann, J.E.M., Synnefa, A., Mitraka, Z., Castro,
E., González, A., Vogt, R., Vesala, T., Spano, D., Pigeon, G., Freer-Smith, P., Staszewski, T., Hodges, N., Mills, G., & Cartalis, C. (2013).
Sustainable urban metabolism as a link between bio-physical sciences and urban planning: the BRIDGE project. Landscape and Urban
Planning, 112, 100 - 117.
Diaper, C. & Mitchell, V. G. (2007). Urban Volume and Quality (UVQ). Urban Water Resources Toolbox: Integrating Groundwater Resources
into Urban Water Management, L. Wolf, Morris, B., and Burn, S., Ed., IWA Publishing, London, 297 pp.
Dupont, S., Mestayer, P. G., Guilloteau, E., Berthier, E. & Andrieu, H. (2006). Parameterization of the urban water budget with the Submesoscale
Soil Model. Journal of Applied Meteorology and Climatology, 45, 624 - 648.
Moors EJ, CSB Grimmond, A Veldhuizen, L Järvi, F van der Bolt 2015: Urban water balance and hydrology models (Chapter 10) in Understanding Urban
Metabolism ed N Chrysoulakis, E Castro, E Moors, Routledge, 106-116 http://www.routledge.com/books/details/9780415835114/ ISBN 978-0-415-83511-4
6
Feddes, R. A., Kabat, P., van Bakel, P. J. T., Bronswijk, J. J. B. & Halbertsma, J. (1988). Modeling soil water dynamics in the unsaturated zone -
state of the art. Journal of Hydrology, 100, 69 - 111.
Greater London Authority (2011a) Securing London’s water future. The Mayor’s Water Strategy. City Hall, The Queen’s Walk, London, UK, 116
pp
Greater London Authority (2011b). Managing risks and increasing resilience. The Mayor’s climate change adaptation strategy. City Hall, The
Queen’s Walk, London, UK, 126 pp.
Grimmond C.S.B., Oke, T.R. & Steyn, D.G. (1986). Urban water balance: 1. A model for daily totals. Water Resources Research, 22, 1397 - 1403.
Grimmond, C. S. B. & Oke, T. R. (1986). Urban Water-Balance 2: Results From A Suburb Of Vancouver, British-Columbia. Water Resources
Research, 22, 1404 - 1412.
Grimmond, C. S. B. & Oke, T. R. (1991). An evapotranspiration-interception model for urban areas. Water Resources Research, 27, 1739 - 1755.
Järvi, L., Hannuniemi, H., Hussein, T., Junninen, H., Aalto, P. P., Hillamo, R., Makela, T., Keronen, P., Siivola, E., Vesala, T. & Kulmala, M.
(2009). The Urban Measurement Station Smear III: Continuous Monitoring of Air Pollution and Surface-Atmosphere Interactions in Helsinki,
Finland, Boreal Environment Research, 14, 86 - 109.
Järvi, L., Grimmond, C.S.B. & Christen, A. (2011). The Surface Urban Energy and Water Balance Scheme (SUEWS): Evaluation in Los Angeles
and Vancouver. J. Hydrol. 411, 219 - 237.
Järvi, L., Grimmond, C.S.B., Taka, M., Nordbo, A., Setälä, H. & Strachan, I. (2014) Developments of the Surface Urban Energy and Water
balance Scheme (SUEWS) for cold climate cities. Geoscientific Model Developments Discussion, 7, 1063 - 1114.
Jia, Y. W., Ni, G. H., Kawahara, Y. & Suetsugi, T. (2001). Development of WEP model and its application to an urban watershed. Hydrol.
Process., 15, 2175 - 2194.
Lemonsu, A., Masson, V. & Berthier, E. (2007). Improvement of the hydrological component of an urban soil-vegetation-atmosphere-transfer
model. Hydrol. Process., 21, 2100 - 2111.
Masson V. (2000). A physically-based scheme for the urban energy budget in atmospheric models. Boundary-Layer Meteorol., 94, 357 – 397.
Mitchell, V. G., Mein, R. G. & McMahon, T. A. (2001). Modelling the urban water cycle. Environ. Modell. Softw., 16, 615 - 629.
Mitchell, V. G., McMahon, TA & Mein RG (2003) Components of the total water balance of an urban catchment. Environ. Manage., 32, 735- 746.
Mitchell, V. G. & Diaper, C. (2005). UVQ: A tool for assessing the water and contaminant balance impacts of urban development scenarios. Water
Science and Technology, 52(12), 91 - 98.
Müller, N., Kuttler, W. and Barlag, A.-B. (2013). Counteracting urban climate change: adaptation measures and their effect on thermal comfort.
Theor. Appl. Climatol., DOI 10.1007/s00704-013-0890-4.
Noilhan, J. & Planton, S. (1989). A simple parameterization of land surface processes for meteorological models. Monthly Weather Review, 117,
536 - 549.
Rodriguez, F., Andrieu, H. & Zech, Y. (2000). Evaluation of a distributed model for urban catchments using a 7-year continuous data series.
Hydrol. Process., 14, 899 - 914.
Rodriguez, F., Andrieu, H. & Morena, F. (2008). A distributed hydrological model for urbanized areas; Model development and application to case
studies. Journal of Hydrology, 351, 268 - 287.
Thames Water, 2013. Final Drought Plan. Main Report. Thames Water Utilities Limited, Clearwater Court, Vastern Road, Reading, UK. 151 pp.
Van Walsum, P.E.V. & Veldhuizen, A.A. (2011). Integration of models using shared state variables: Implementation in the regional hydrologic
modelling system SIMGRO, Journal of Hydrology, 409, 363 - 370.
Wang, J., Endreny, T. A. & Nowak, D. J. (2008). Mechanistic simulation of tree effects in an urban water balance model. J. Am. Water Resour.
Assoc., 44, 75-85.
Wolf, L., Morris, B. & Burn, S. (2007). Urban Water Resources Toolbox: Integrating Groundwater into Urban Water Management. IWA, 309 pp.