ultrasound biomicroscopic corneal thickness measurement for corneal thickness mapping
TRANSCRIPT
ELSEVIER
Ultrasound Biomicroscopic Cornea1 Thickness Measurement for Cornea1 Thickness Mapping
Izumi Wada
Department of Ophthalmology, Mie University School of Medicine, Mie, Japan
Abstract: Digitalized ultrasound biomicroscopic measurements of vertical cross sections from a 5 mm diameter area of the central cornea of normal and morbid eyes were used to cre- ate a computerized cornea1 thickness map. Mean comeal thickness in normal eyes was 0.503 ? 0.027 nun; the coefficient of variation, an index of reproducibility, was < 10% in all eyes. Jpn J Ophthalmol1997,41:1218 0 1997 Japanese Ophthalmological Society
Key Words: Cornea1 thickness, cornea1 thickness mapping, ultrasound biomicroscopy.
Introduction Cornea1 thickness is closely related to the functions
of endothelial cells, making measurement of cornea1 thickness a helpful indicator when studying the patho- physiology of the cornea, and the endothelial cells, in particular.’ There are currently three widely accepted methods for measuring cornea1 thickness: (1) the Haag-Streit pachometer (Hedby-Mishima method)? (2) ultrasound,3P and (3) specular microscopy.5 Pavlin et a16y7 have recently reported on ultrasound biomi- croscopic measurement (UBM) of cornea1 thickness. In this study, vertical cross-section images of a 5 mm diameter area of the central cornea were measured by UBM, and cornea1 thickness maps were created by computer from cornea1 thickness data.
Materials and Methods Equipment
We used a Humphrey ultrasound biomicroscope (Model 840, Humphrey Instruments, San Leandro, CA, USA). Transducer specifications were: frequency, 50 MHz; focal distance, 5.5 mm; diameter, 3.0 mm; fo- cal depth, 0.7 mm; resolution, 864 X 432 pixels per 5 x 5 mm; measurement resolution, ? 5 pm; mechan- ical linear scanning.
Received: February 6,1996 Address correspondence and reprint requests to: Izumi
WADA, MD, Department of Ophthalmology, Mie University School of Medicine, 2-174 Edobashi, Tsu, Mie 514, Japan
Part of this study was published in the Journal of the Japanese Ophthalmological Society 100~46-49 (1996).
Jpn .I Ophthalmol41,12-18 (1997) 0 1997 Japanese Ophthalmological Society Published by Elsevier Science Inc.
Subjects Twenty-two eyes of 15 healthy volunteers (ages: 25-
62 years) who had no abnormalities, except ametropia, and did not wear contact lenses, were studied. Six mor- bid eyes (6 patients) were also studied: 2 from patients who had keratoconus; 2, cornea1 dystrophy; 1, corneal herpes; and 1, bullous keratopathy.
Methods Thickness measurement. The subject was usually
examined in a supine position looking up at the ceil- ing. For the scanning procedure, each subject re- ceived one drop of topical anesthetic (oxybupro- Caine hydrochloride 0.4%, Benox@‘). The eyelids were held open by an eye cup and hydroxyethyl cellu- lose (Scopisol@) was poured into the cup. The subject focused his gaze on the ceiling during the procedure. With the transducer probe positioned perpendicularly to the cornea, and the distance adjusted so that the cornea was within the focal zone, scanning was done in the clock positions of 1:30 to 7:30,3:00 to 9:00,4:30 to 10~30, and 6:00 to 12:O0. This provided a qualita- tive check on subject movement during the few min- utes of scanning; 5 mm vertical cross-section images through a 5 mm diameter area of the optic center of the cornea were taken. Each image included the iris and the anterior part of the lens as well as the cor- nea. The point at which a line perpendicular to the tan- gent of the anterior surface of the lens crossed the cornea1 surface at the center of the pupil was re- garded as the center of the cornea. Cornea1 thickness was measured with a scale on the monitor perpendic-
0021-5155/97/$17.00 PII SooZl-5155(96)00006-S

I. WADA CORNEAL THICKNESS MAPPING
13
Anterior Chamber
Figure 1. (A: left) Ultrasound biomicroscopic vertical cross section of the cornea. (B: right) Cornea1 center: the point at which a line perpendicular to the tangent of the anterior surface of the lens crosses the cornea1 surface in the center of the pupil. t = cornea1 thickness.
ular to the tangent of the cornea1 surface at 0.25 mm intervals from the center of the cornea (Figure l), at 80 points in the 4 directions, using a speed-of-sound constant of 15.50 m/second.8,9
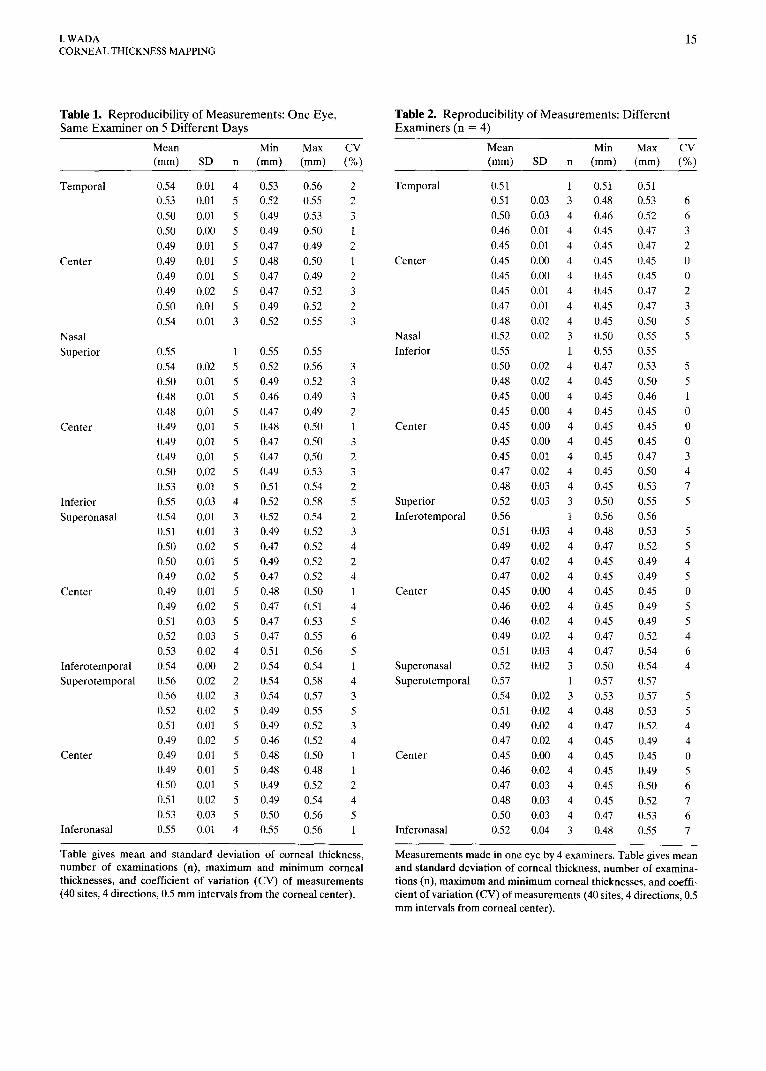
Reproducibility of measurement. Measurement was done (as above) at 40 sites in 4 directions at 0.5 mm intervals from the cornea1 center in one eye of one volunteer by the same examiner on 5 different days; the same measurements were obtained in the same eye of one volunteer by four examiners on 1 day. The coef- ficient of variation (CV) was determined: < 10% was considered to indicate good reproducibility.i3
Cornea1 thickness mapping. Cornea1 thicknesses measured in these eyes were processed with Delta- Graph Pro3.0J software (Delta Point, Monterey, CA, USA) on a personal computer (Macintosh Quadra 950, Apple, Cupertino, CA, USA). A cornea was first projected as a coronal cross section from the front; the normal projection obtained was plot- ted on xy coordinates with the origin at the cornea1 center and the axes scaled upward and to the right. Next, the actual measurements were entered as two- dimensional coordinate data. Cornea1 thickness data were paired with coordinate data. Graphs were plot- ted with three-dimensional xyz coordinates. After plotting, the viewing angle was shifted to overlook the xy plane from directly above, using the three-dimen-
sional display capability of the software. These steps produced a color map of the cornea1 thicknesses.
Results Measurement of Cornea1 Thickness
Figure 2 shows cornea1 thicknesses in normal eyes (n = 22) measured at 0.5 mm intervals from the cor- neal center at 40 sites in 4 directions. The central thickness was 0.503 + 0.027 mm (mean + SD). The maximum CV of the measured values at each mea- surement point in the 22 eyes was 7%.
Reproducibility of Measurement The CV was 5 6% at all points for measurements
by the same examiner in the same eye on 5 different days (Table l), and % 7% for measurements on the same day by four different examiners (Table 2).
Cornea1 Thickness Mapping Figure 3 shows cornea1 thickness maps of normal
and morbid eyes.
Discussion Accurate determination of the measuring points
as well as precise measurement of the cornea1 thick- ness is essential for cornea1 thickness mapping. The

14 Jpn J Ophthalmol Vol41: 12-l&1997
6-4 (mm) (mm)
.64
.62 1 0
648 1
0
.46 0 0 0 0 A4 . . . . * . . . , . .
2.5 2.0 1.5 1.0 0.5 0 0.5 1.0 1.5 2.0 2.5 (mm)
TSI !3 3 s & 0 P
B
(mm1 A41
.62 ’ o 1
.44f. - ’ - - 0 ” ’ * *.
2.5 2.0 1.5 1.0 0.5 0 0.5 1.0 1.5 2.02.5
0 0
28
3 s B .o g
.54
-g s2
F
g .50
A8
.46 1 8 0
O O 0 0 0
2.5 2.0 1.5 1.0 0.5 0 0.5 1.0 1.5 2.0 2.5
(4
.62 1
.60 Ir 0 0 0 0 0
.58
1’ 56
B .54 .Y z .52
Q so 0 .48
.46
lrkil P
!‘p !i! 1 .44J* ’ ’ s * *
0 2.5 2.0 1.5 1.0 0.5 0 0:s 1.0 1.5 2.0 2.5
Figure 2, Cornea1 thickness in normal eyes: Box plots show comeal thickness in 22 normal eyes based on measurements at 40 sites at 0.5 mm intervals from the comeal center on 4 axes. (A) Temporal-nasal, (B) Inferior-superior, (C) Inferotemporal- superonasal, (D) Superotemporal-inferonasal.
I. WADA CORNEAL THICKNESS MAPPING
15
Table 1. Reproducibility of Measurements: One Eye, Table 2. Reproducibility of Measurements: Different Same Examiner on 5 Different Days Examiners (n = 4)
Mean Min Max CV Mean Min Max CV (mm) SD n (mm) (mm) (%) (mm) SD n (mm) (mm) (%)
Temporal
Center
Nasal Superior
Center
Inferior Superonasal
Center
Inferotemporal Superotemporal
Center
Inferonasal
0.54 0.53 0.50 0.50 0.49 0.49 0.49 0.49 0.50 0.54
0.55 0.54 0.50 0.48 0.48 0.49 0.49 0.49 0.50 0.53 0.55 0.54 0.51 0.50 0.50 0.49 0.49 0.49 0.51 0.52 0.53 0.54 0.56 0.56 0.52 0.51 0.49 0.49 0.49 0.50 0.51 0.53 0.55
0.01 4 0.01 5 0.01 5 0.00 5 0.01 5 0.01 5 0.01 5 0.02 5 0.01 5 0.01 3
1 0.02 5 0.01 5 0.01 5 0.01 5 0.01 5 0.01 5 0.01 5 0.02 5 0.01 5 0.03 4 0.01 3 0.01 3 0.02 5 0.01 5 0.02 5 0.01 5 0.02 5 0.03 5 0.03 5 0.02 4 0.00 2 0.02 2 0.02 3 0.02 5 0.01 5 0.02 5 0.01 5 0.01 5 0.01 5 0.02 5 0.03 5 0.01 4
0.53 0.56 2 0.52 0.55 2 0.49 0.53 3 0.49 0.50 1 0.47 0.49 2 0.48 0.50 1 0.47 0.49 2 0.47 0.52 3 0.49 0.52 2 0.52 0.55 3
0.55 0.55 0.52 0.56 0.49 0.52 0.46 0.49 0.47 0.49 0.48 0.50 0.47 0.50 0.47 0.50 0.49 0.53 0.51 0.54 0.52 0.58 0.52 0.54 0.49 0.52 0.47 0.52 0.49 0.52 0.47 0.52 0.48 0.50 0.47 0.51 0.47 0.53 0.47 0.55 0.51 0.56 0.54 0.54 0.54 0.58 0.54 0.57 0.49 0.55 0.49 0.52 0.46 0.52 0.48 0.50 0.48 0.48 0.49 0.52 0.49 0.54 0.50 0.56 0.55 0.56
3 3 3 2 1 3 2 3 2 5 2 3 4 2 4 1 4 5 6 5 1 4 3 5 3 4 1 1 2 4 5 1
Table gives mean and standard deviation of cornea1 thickness, number of examinations (n), maximum and minimum cornea1 thicknesses, and coefficient of variation (CV) of measurements (40 sites, 4 directions, 0.5 mm intervals from the cornea1 center).
Temporal
Center
Nasal Inferior
Center
Superior Inferotemporal
Center
Superonasal Superotemporal
Center
Inferonasal
0.51 1 0.51 0.51 0.51 0.03 3 0.48 0.53 0.50 0.03 4 0.46 0.52 0.46 0.01 4 0.45 0.47 0.45 0.01 4 0.45 0.47 0.45 0.00 4 0.45 0.45 0.45 0.00 4 0.45 0.45 0.45 0.01 4 0.45 0.47 0.47 0.01 4 0.45 0.47 0.48 0.02 4 0.45 0.50 0.52 0.02 3 0.50 0.55 0.55 1 0.55 0.55 0.50 0.02 4 0.47 0.53 0.48 0.02 4 0.45 0.50 0.45 0.00 4 0.45 0.46 0.45 0.00 4 0.45 0.45 0.45 0.00 4 0.45 0.45 0.45 0.00 4 0.45 0.45 0.45 0.01 4 0.45 0.47 0.47 0.02 4 0.45 0.50 0.48 0.03 4 0.45 0.53 0.52 0.03 3 0.50 0.55 0.56 1 0.56 0.56 0.51 0.03 4 0.48 0.53 0.49 0.02 4 0.47 0.52 0.47 0.02 4 0.45 0.49 0.47 0.02 4 0.45 0.49 0.45 0.00 4 0.45 0.45 0.46 0.02 4 0.45 0.49 0.46 0.02 4 0.45 0.49 0.49 0.02 4 0.47 0.52 0.51 0.03 4 0.47 0.54 0.52 0.02 3 0.50 0.54 0.57 1 0.57 0.57 0.54 0.02 3 0.53 0.57 0.51 0.02 4 0.48 0.53 0.49 0.02 4 0.47 0.52 0.47 0.02 4 0.45 0.49 0.45 0.00 4 0.45 0.45 0.46 0.02 4 0.45 0.49 0.47 0.03 4 0.45 0.50 0.48 0.03 4 0.45 0.52 0.50 0.03 4 0.47 0.53 0.52 0.04 3 0.48 0.55
6 6 3 2 0 0 2 3 5 5
5 5 1 0 0 0 3 4 7 5
5 5 4 5 0 5 5 4 6 4
5 5 4 4 0 5 6 7 6 7
Measurements made in one eye by 4 examiners. Table gives mean and standard deviation of cornea1 thickness, number of examina- tions (n), maximum and minimum cornea1 thicknesses, and coeffi- cient of variation (CV) of measurements (40 sites, 4 directions, 0.5 mm intervals from cornea1 center).

16 Jpn J Ophthalmol Vol41: 12-18,1997
a
Figure 3. Cornea1 maps. (A) Normal left eye of 26-year-old female. Thinned area within 1 mm from center, thickness in- creased toward medial and superior directions of the periphery. Cornea1 thickness was 0.487 mm in the center and 0.544 0.568 mm in the periphery. (B) Right eye of a 46-year-old female with lattice cornea1 dystrophy. Cornea generally thicker than normal eye: 0.587-0.633 mm in the center, thickened to 0.677-0.702 mm in some lateral and medial areas. (C) Left eye of a 65year-old male with granular cornea1 dystrophy. Area with reduced thickness of 0.450-0.543 mm c 1 mm from the center; cornea1 thickness gradually increased toward periphery. (D) Left eye of 18-year-old female with cornea1 herpes. Cor- neal thickness generally thinned in opacified areas of cornea; especially thin, 0.187-0.189 mm, 1 mm laterally from the cen- ter. Thickness of the area 5 mm diameter around the center was 0.187-0.496 mm, thinner inferiorly. (E) Right eye of a 78-

I. WADA CORNEAL THICKNESS MAPPING
17
pachometer and specular microscope allow accurate measurement of the cornea1 thickness in the trans- parent central cornea, but do not provide accurate location data so that mapping with these techniques is unsatisfactory. There is also an ultrasonic pachom- eter of a contact type. With ultrasound biomicros- copy, however, measurement of cornea1 thickness can be done without touching the cornea, and loca- tions can be determined even in a clouded cornea. The axial resolution of ultrasound imaging is deter- mined by the ultrasound frequency and interval.6,7,‘0 Theoretically, UBM with a frequency of 50 MHz has an axial resolution 2.5-5 times higher than currently used scanners, which have a 10 MHz frequency with combined A-B scans, or ultrasound pachometers with a frequency of 20 MHz; UBM makes more ac- curate cornea1 thickness mapping possible.8 Mea- surement accuracy in ultrasound biomicroscopy is limited by the lateral and axial resolution of the sys- tem, the stability of the mechanical motion, and the pixel size of the image. Axial resolution refers to the instrument’s capability to distinguish between two surfaces as they are brought closer together.
Measurement precision can be significantly better than the axial resolution might indicate when the two planar interfaces are well resolved and parallel (anterior and posterior cornea1 surfaces).7 Although a change in cornea1 thickness during a single day was reported, no clinical differences were found with the various measurement times.” No significant differ- ence in cornea1 thickness was found between the left and right eyes, regardless of sex.l Ultrasound passes through air very poorly; the fluid used should have low sound attenuation. We use ethylcellulose for most examinations because of its minimal sound at- tenuation. For all practical purposes, changes in re- fractive index caused by the fluid used result in only a negligible error in thickness measurement in vivo.7
According to the mean cornea1 thickness in 22 normal eyes, the cornea was thinnest in the center and thicker toward the margins, despite individual differences, as reported by Kato et aLI The maxi- mum CV was 7%) indicating a certain degree of regu- larity. Tello et all3 reported that the CV of the central cornea1 thickness was 3 % and that reproducibility is sat- isfactory when the CV is < 10%. Our results give a CV
for the central comeal thickness of 1%: it was 5 6% on measurements (central and peripheral) by the same examiner, and I 7% on measurements by different examiners. From these observations, our measure- ment of cornea1 thickness with UBM is highly repro- ducible and reliable.
We have been able to create a cornea1 thickness map using UBM data, which indicates that there are individual variations in the cornea1 thickness. One component of this method is the time difference be- tween reflected ultrasound from the front and back of the cornea. This time difference, multiplied by the ultrasound velocity as it passes through the cornea, gives the cornea1 thickness measurement. A ques- tion may arise because different velocities have been reported, ranging from 1500 to 1640 m/seconds.ll However, this applies to all ultrasonic pachometers: the transducer must be placed vertically over the cornea. A geometric error of 5” from the vertical axis would be 0.38%; lo” would be 1.54% of the cornea1 thickness. Variations in cornea1 thickness from small deviations of fixation were minimized in our study by requesting the subject to focus on a point on the ceiling during scanning. Errors from slightly eccen- tric fixation produce only negligible errors in cornea1 thickness measurements.lO
Cornea1 thickness mapping can now contribute to the evaluation of the cornea following refraction sur- gery or in pathologic conditions to evaluate postop- erative healing.
The author wishes to thank Prof Y. Uji for his interest and suggestions throughout this research. The author is also grateful to Drs K. Emi and H. Ishikawa for their valuable guidance and collaboration.
References 1. Mishima S. Cornea1 thickness. Surv Ophthalmol1968;13:57-96. 2. Mishima S, Hedby BO. Measurement of cornea1 thickness
with the Haag-Streit Pachometer. Arch Ophthalmol 1968; 80:710-13.
3. Giasson C, Ehler N. Comparison of central cornea1 thickness measurements between optical and ultrasound pachometers. Optom Vis Sci 1992;69:23&41.
4. Wheeler NC, Morantes CM, Kristensen FUvl, et al. Reliability coefficients of three cornea1 pachometers. Am J Ophthalmol 1992;113:645-51.
5. Olsen T, Ehlers N. The thickness of the human cornea as de-
year-old man with bullous keratopathy. Cornea1 thickness was generally increased to 2 0.9 mm especially in lower area. (F) Right eye of 35year-old man with keratoconus. Thinned area extended from center to medioinferior direction; thickness near apex of keratoconus (1.5 mm medioinferiorly from center) was reduced to 0.143-0.252 mm. (G) Right eye of a 47-year- old woman with a history of posterior keratotomy for keratoconus. Cornea was flattened; almost even thickness: 0.330-0.435 mm to 1 mm from center; 0.445-0.549 mm in peripheries.

18 Jpn J Ophthalmol Vol41: 12-18.1997
termined by a specular method. Acta Ophthalmol 1984;162: 859-71.
6. Pavlm Cl, Sherar MD, Foster FS. Subsurface ultrasound macro- scopic imaging of the intact eye. Ophthalmology 1990;97:244-SO.
7. Pavlin Cl, Foster FS. Basic considerations. In: Pavlin CJ, Foster FS, eds. Ultrasound biomicroscopy of the eye. New York: Springer-Verlag, 1995:%60.
8. Matsuda M, Ohsako K, Hotta M, Suda T, Manabe R. Pa- chometry with the Vida-55 ultrasonic pachometer. Folia Oph- thalmol Japon 1982;33:209-12.
9. Oksala A, Lehtinen A. Measurement of the velocity of sound in some parts of the eye. Acta Ophthalmol1955;36:633-39.
10. Reinstein DZ, Silverman RH, Rondeau MJ, Coleman DJ. Ep- ithelial and cornea1 thickness measurements by high-fre- quency ultrasound digital signal processing. Ophthalmology 1994;101:140-46.
11. Sawa M. Measurements of cornea1 thickness. Jap Rev Clin Ophthalmol1986;80:177-84.
12. Kato H, Hayashi F, Nakao F. Japanese cornea1 thickness measured by the DGH-2000 ultrasonic pachometer. J Eye 1989;6:103740.
13. Tello C, Liebmann J, Potash S, et al. Measurement of ultra- sound biomicroscopy images. Ophthalmol Vis Sci 1994;35: 3549-52.