trends and strategies for outbound real estate investments · trends and strategies for outbound...
TRANSCRIPT
Trends and Strategies for Outbound Real Estate Investments Presented by
Dr Henry Chin
Head of Research, Asia Pacific
CBRE
2 CBRE | CHINA OVERSEAS REAL ESTATE INVESTMENT SUMMIT | 2 JULY, 2014
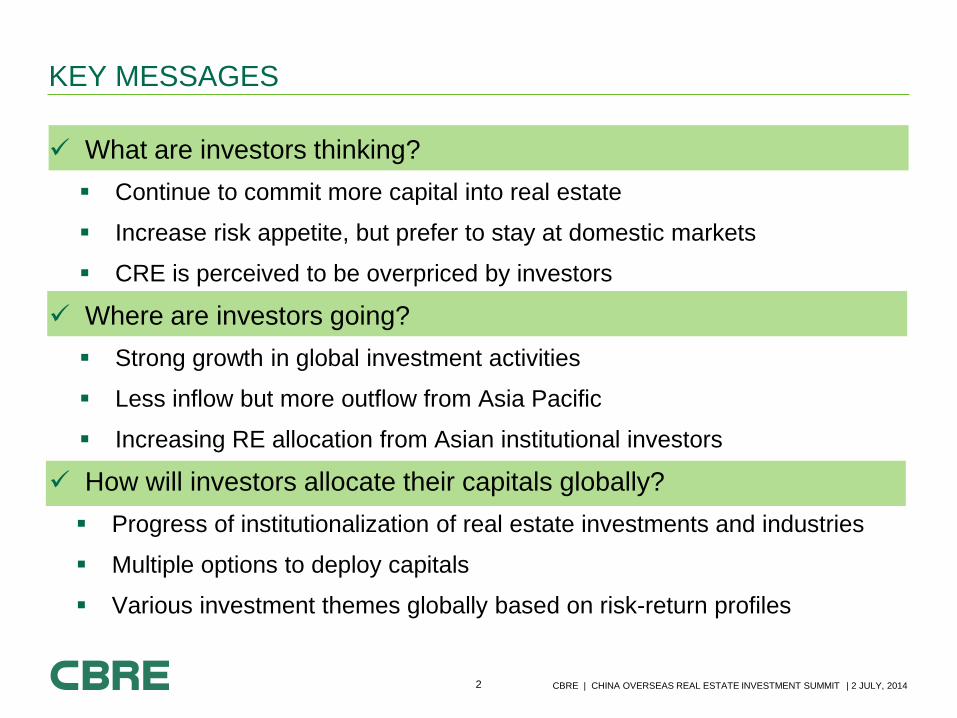
What are investors thinking?
Continue to commit more capital into real estate
Increase risk appetite, but prefer to stay at domestic markets
CRE is perceived to be overpriced by investors
Where are investors going?
Strong growth in global investment activities
Less inflow but more outflow from Asia Pacific
Increasing RE allocation from Asian institutional investors
How will investors allocate their capitals globally?
Progress of institutionalization of real estate investments and industries
Multiple options to deploy capitals
Various investment themes globally based on risk-return profiles
KEY MESSAGES
WHAT ARE INVESTORS THINKING? Key Findings from Investor Intentions Survey
4 CBRE | CHINA OVERSEAS REAL ESTATE INVESTMENT SUMMIT | 2 JULY, 2014
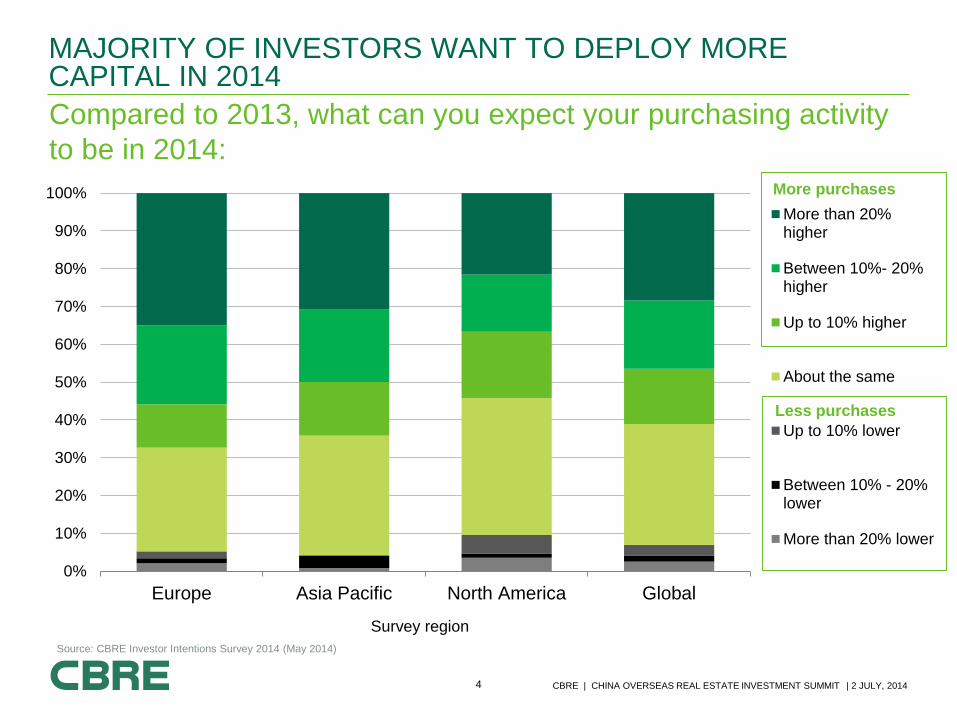
Compared to 2013, what can you expect your purchasing activity
to be in 2014:
MAJORITY OF INVESTORS WANT TO DEPLOY MORE CAPITAL IN 2014
0%
10%
20%
30%
40%
50%
60%
70%
80%
90%
100%
Europe Asia Pacific North America Global
Survey region
More than 20%higher
Between 10%- 20%higher
Up to 10% higher
About the same
Up to 10% lower
Between 10% - 20%lower
More than 20% lower
Source: CBRE Investor Intentions Survey 2014 (May 2014)
More purchases
Less purchases
5 CBRE | CHINA OVERSEAS REAL ESTATE INVESTMENT SUMMIT | 2 JULY, 2014
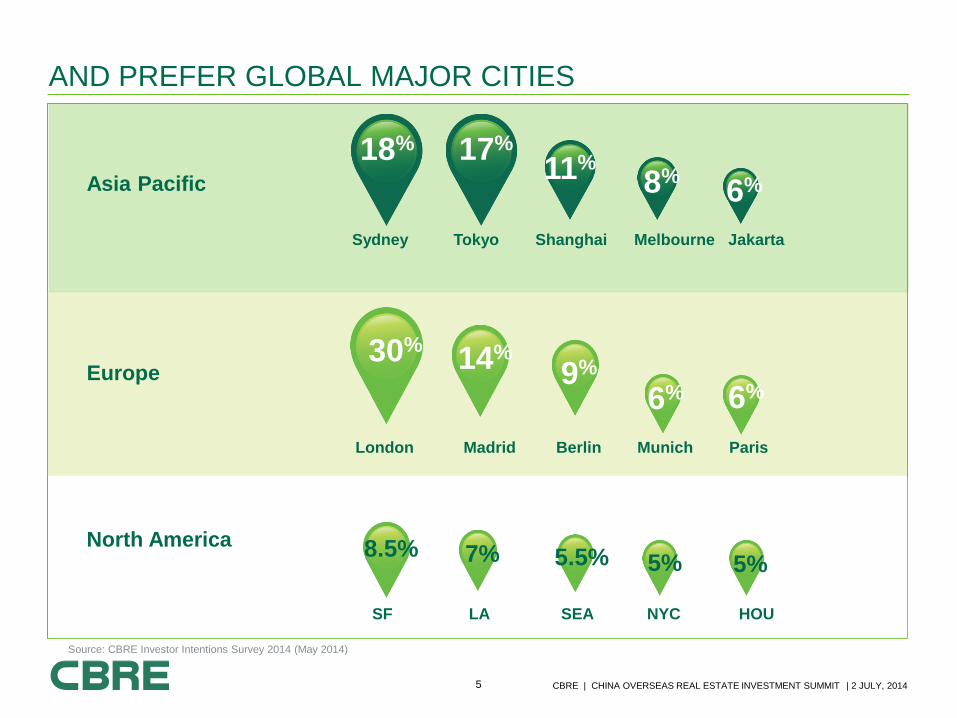
AND PREFER GLOBAL MAJOR CITIES
30% 14%
9%
London Madrid Berlin Munich Paris
6% 6%
Sydney Tokyo Shanghai Melbourne Jakarta
18% 17%
11% 8%
6%
Source: CBRE Investor Intentions Survey 2014 (May 2014)
Asia Pacific
Europe
North America 8.5%
SF LA SEA NYC HOU
7% 5.5% 5% 5%
6 CBRE | CHINA OVERSEAS REAL ESTATE INVESTMENT SUMMIT | 2 JULY, 2014
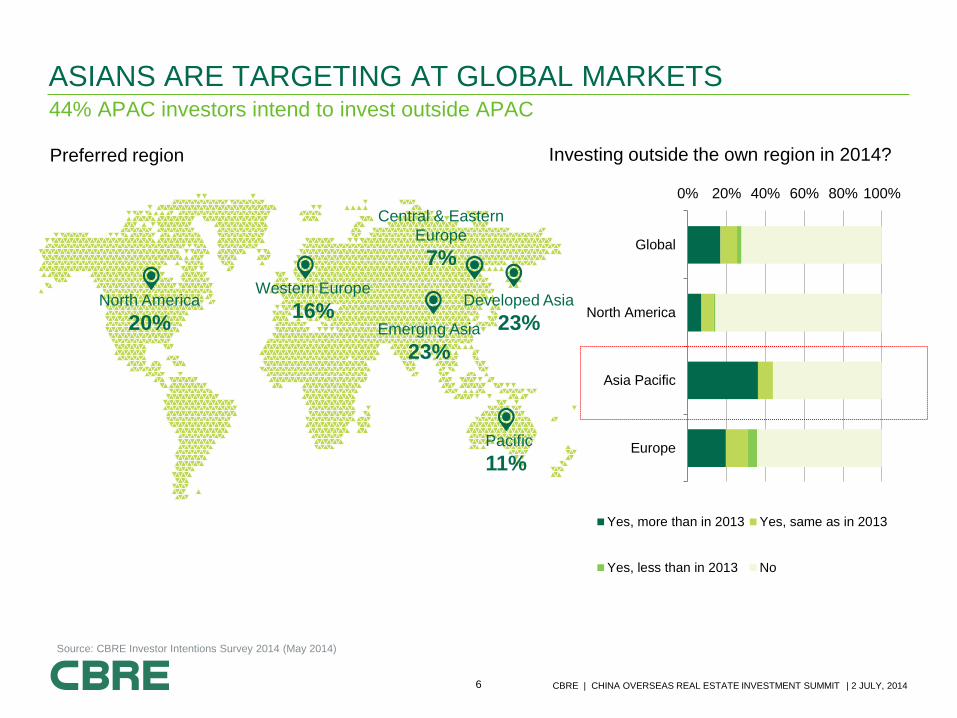
44% APAC investors intend to invest outside APAC
ASIANS ARE TARGETING AT GLOBAL MARKETS
Pacific
11%
Western Europe
16% North America
20% Developed Asia
23% Emerging Asia
23%
Central & Eastern
Europe
7%
0% 20% 40% 60% 80% 100%
Europe
Asia Pacific
North America
Global
Yes, more than in 2013 Yes, same as in 2013
Yes, less than in 2013 No
Investing outside the own region in 2014? Preferred region
Source: CBRE Investor Intentions Survey 2014 (May 2014)
7 CBRE | CHINA OVERSEAS REAL ESTATE INVESTMENT SUMMIT | 2 JULY, 2014
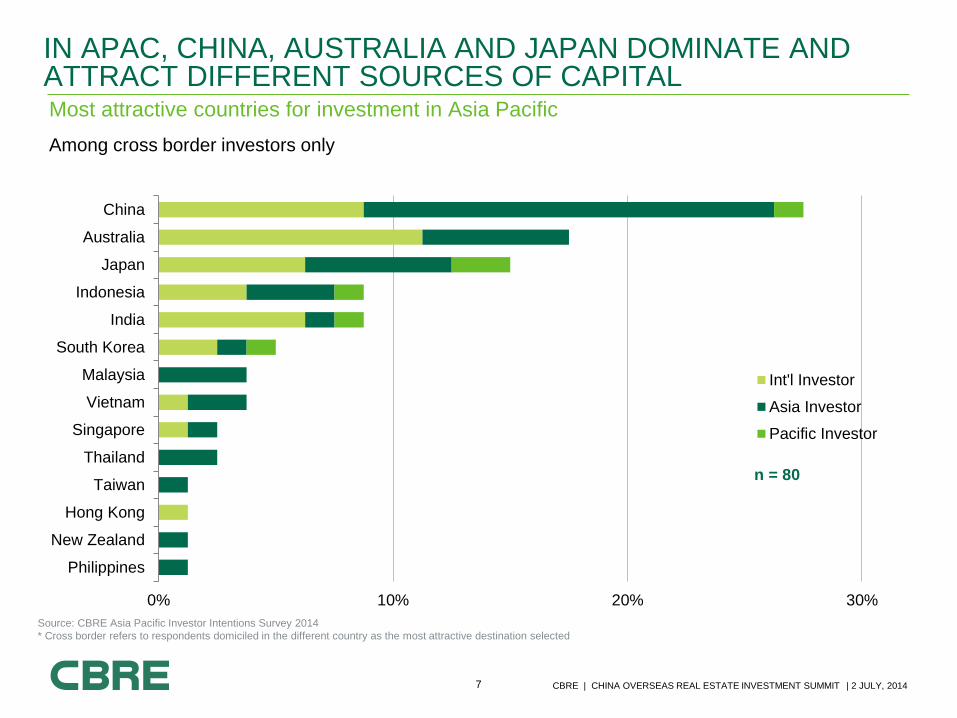
Most attractive countries for investment in Asia Pacific
Among cross border investors only
IN APAC, CHINA, AUSTRALIA AND JAPAN DOMINATE AND ATTRACT DIFFERENT SOURCES OF CAPITAL
Source: CBRE Asia Pacific Investor Intentions Survey 2014
* Cross border refers to respondents domiciled in the different country as the most attractive destination selected
0% 10% 20% 30%
Philippines
New Zealand
Hong Kong
Taiwan
Thailand
Singapore
Vietnam
Malaysia
South Korea
India
Indonesia
Japan
Australia
China
Int'l Investor
Asia Investor
Pacific Investor
n = 80
8 CBRE | CHINA OVERSEAS REAL ESTATE INVESTMENT SUMMIT | 2 JULY, 2014
0%
5%
10%
15%
20%
25%
30%
35%
40%
45%
50%
Prime or coreassets
Goodsecondary
Opportunistic /value-added
Distressedassets
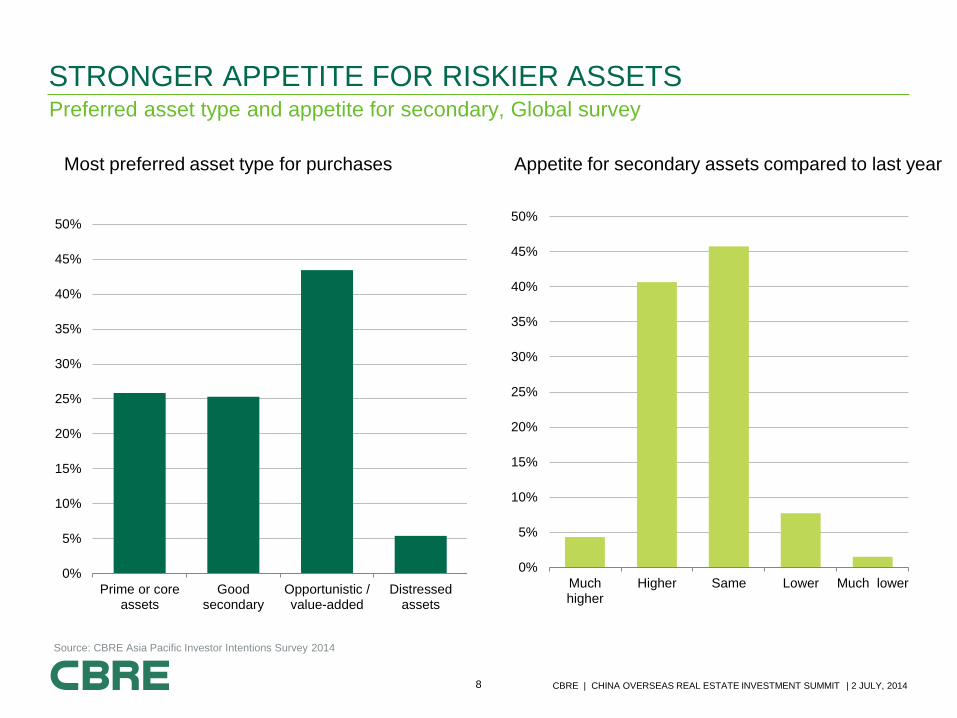
STRONGER APPETITE FOR RISKIER ASSETS Count of Final Size (mn USD)
Primary Strategy Total
Core 7
Core-Plus 13
Debt 23
Distressed 15
Fund of Funds 9
Opportunistic 45
Secondaries
Value Added 45
Grand Total 157
Sum of Final Size (mn
USD)
Primary Strategy Total
Core
1,839
Core-Plus
2,214
Debt
12,237
Distressed
12,701
Fund of Funds
1,076
Opportunistic
34,698
Secondaries
Value Added
17,534
Grand Total
82,298
Source: CBRE Asia Pacific Investor Intentions Survey 2014
Most preferred asset type for purchases Appetite for secondary assets compared to last year
Preferred asset type and appetite for secondary, Global survey
0%
5%
10%
15%
20%
25%
30%
35%
40%
45%
50%
Muchhigher
Higher Same Lower Much lower
9 CBRE | CHINA OVERSEAS REAL ESTATE INVESTMENT SUMMIT | 2 JULY, 2014
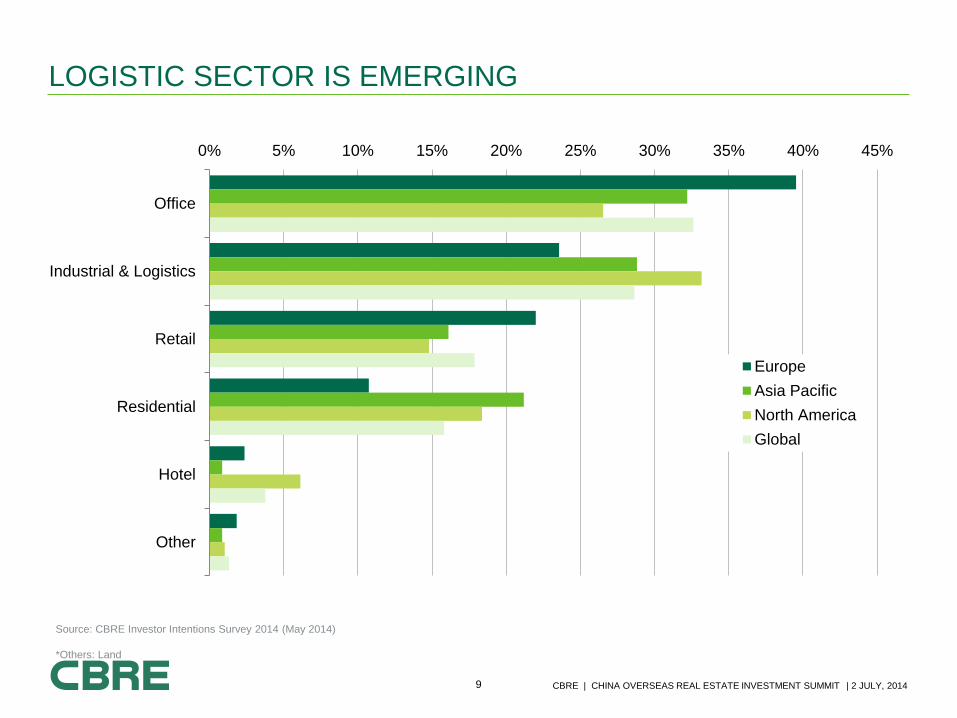
LOGISTIC SECTOR IS EMERGING
0% 5% 10% 15% 20% 25% 30% 35% 40% 45%
Office
Industrial & Logistics
Retail
Residential
Hotel
Other
Europe
Asia Pacific
North America
Global
Source: CBRE Investor Intentions Survey 2014 (May 2014)
*Others: Land
10 CBRE | CHINA OVERSEAS REAL ESTATE INVESTMENT SUMMIT | 2 JULY, 2014
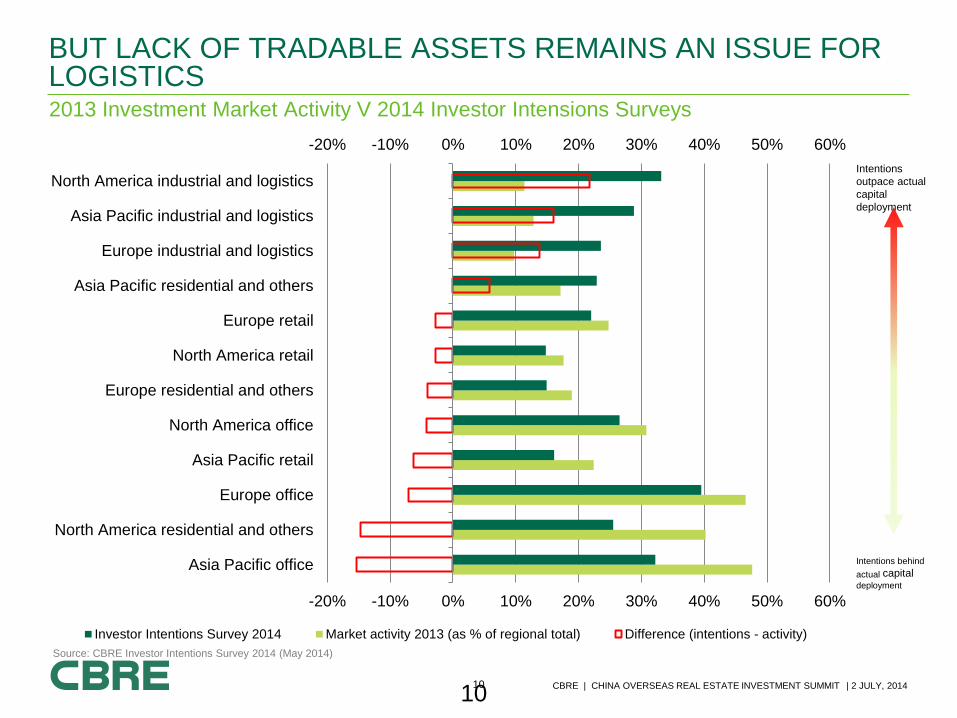
BUT LACK OF TRADABLE ASSETS REMAINS AN ISSUE FOR LOGISTICS
-20% -10% 0% 10% 20% 30% 40% 50% 60%
-20% -10% 0% 10% 20% 30% 40% 50% 60%
Asia Pacific office
North America residential and others
Europe office
Asia Pacific retail
North America office
Europe residential and others
North America retail
Europe retail
Asia Pacific residential and others
Europe industrial and logistics
Asia Pacific industrial and logistics
North America industrial and logistics
Investor Intentions Survey 2014 Market activity 2013 (as % of regional total) Difference (intentions - activity)
10
2013 Investment Market Activity V 2014 Investor Intensions Surveys
Intentions
outpace actual
capital
deployment
Intentions behind actual capital deployment
Source: CBRE Investor Intentions Survey 2014 (May 2014)
11 CBRE | CHINA OVERSEAS REAL ESTATE INVESTMENT SUMMIT | 2 JULY, 2014
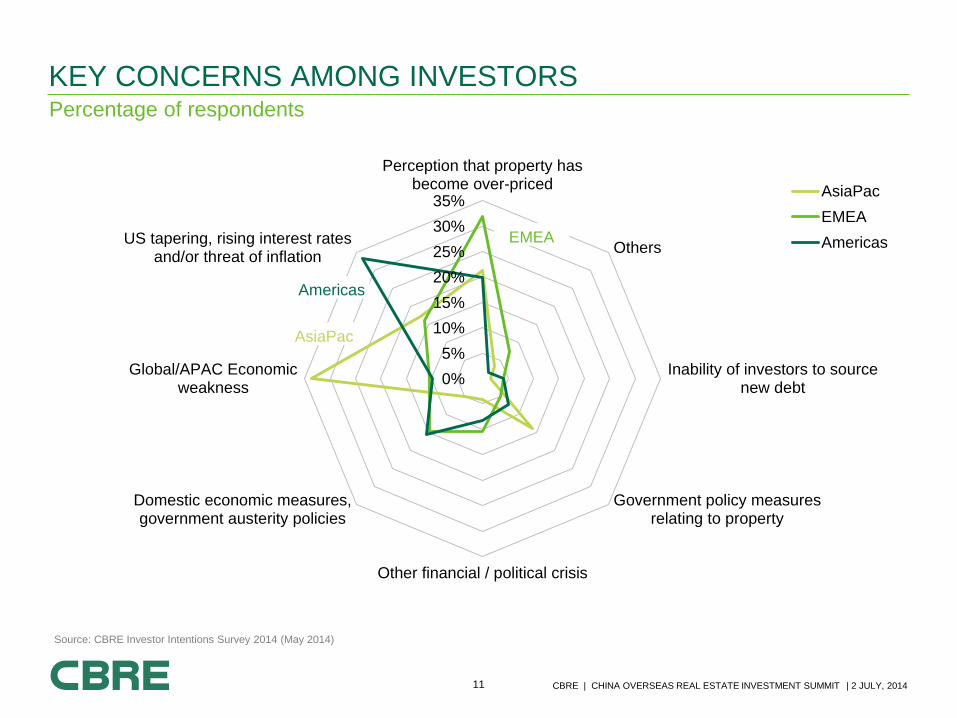
Percentage of respondents
KEY CONCERNS AMONG INVESTORS
0%
5%
10%
15%
20%
25%
30%
35%
Perception that property hasbecome over-priced
US tapering, rising interest ratesand/or threat of inflation
Global/APAC Economicweakness
Domestic economic measures,government austerity policies
Other financial / political crisis
Government policy measuresrelating to property
Inability of investors to sourcenew debt
Others
AsiaPac
EMEA
AmericasEMEA
Americas
Source: CBRE Investor Intentions Survey 2014 (May 2014)
AsiaPac
12 CBRE | CHINA OVERSEAS REAL ESTATE INVESTMENT SUMMIT | 2 JULY, 2014
0.0
0.5
1.0
1.5
2.0
2.5
3.0
3.5
4.0
4.5
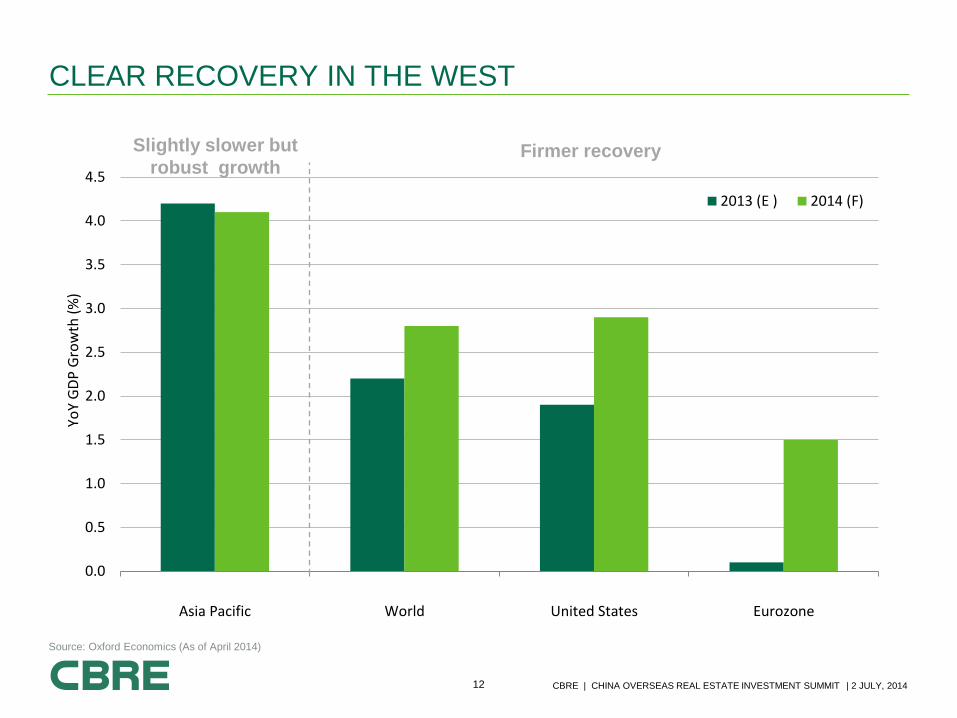
Asia Pacific World United States Eurozone
2013 (E ) 2014 (F)
YoY
GD
P G
row
th (
%)
CLEAR RECOVERY IN THE WEST
Source: Oxford Economics (As of April 2014)
Slightly slower but
robust growth Firmer recovery
13 CBRE | CHINA OVERSEAS REAL ESTATE INVESTMENT SUMMIT | 2 JULY, 2014
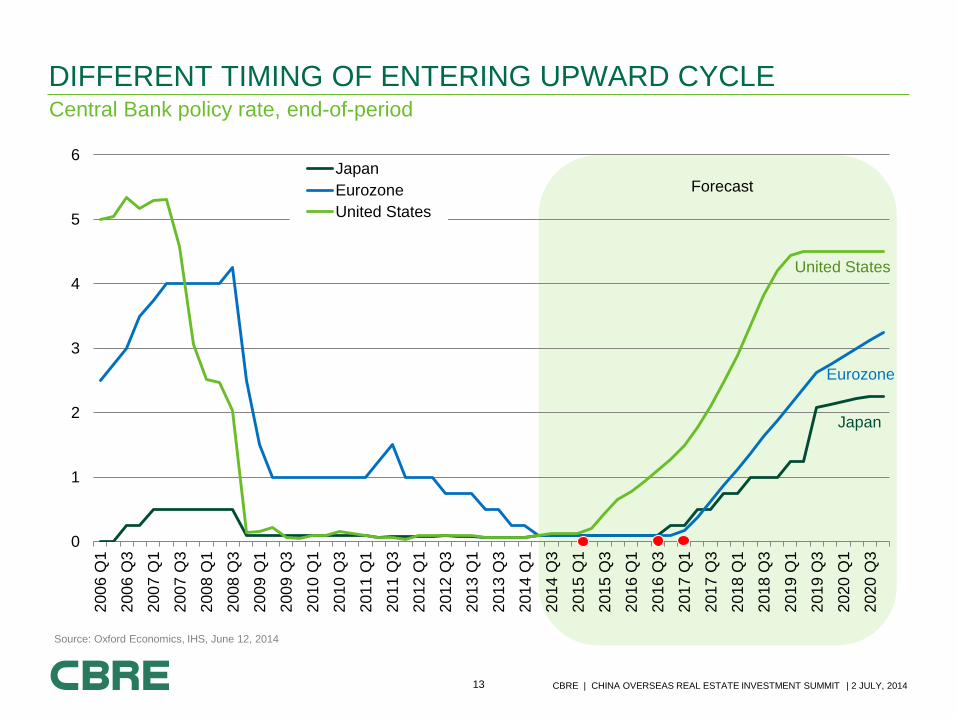
Central Bank policy rate, end-of-period
DIFFERENT TIMING OF ENTERING UPWARD CYCLE
0
1
2
3
4
5
6
200
6 Q
1
200
6 Q
3
200
7 Q
1
200
7 Q
3
200
8 Q
1
200
8 Q
3
200
9 Q
1
200
9 Q
3
201
0 Q
1
201
0 Q
3
201
1 Q
1
201
1 Q
3
201
2 Q
1
201
2 Q
3
201
3 Q
1
201
3 Q
3
201
4 Q
1
201
4 Q
3
201
5 Q
1
201
5 Q
3
201
6 Q
1
201
6 Q
3
201
7 Q
1
201
7 Q
3
201
8 Q
1
201
8 Q
3
201
9 Q
1
201
9 Q
3
202
0 Q
1
202
0 Q
3
Japan
Eurozone
United States
Forecast
Japan
Eurozone
United States
Source: Oxford Economics, IHS, June 12, 2014

CAPITAL FLOW Where are investors going?
15 CBRE | CHINA OVERSEAS REAL ESTATE INVESTMENT SUMMIT | 2 JULY, 2014
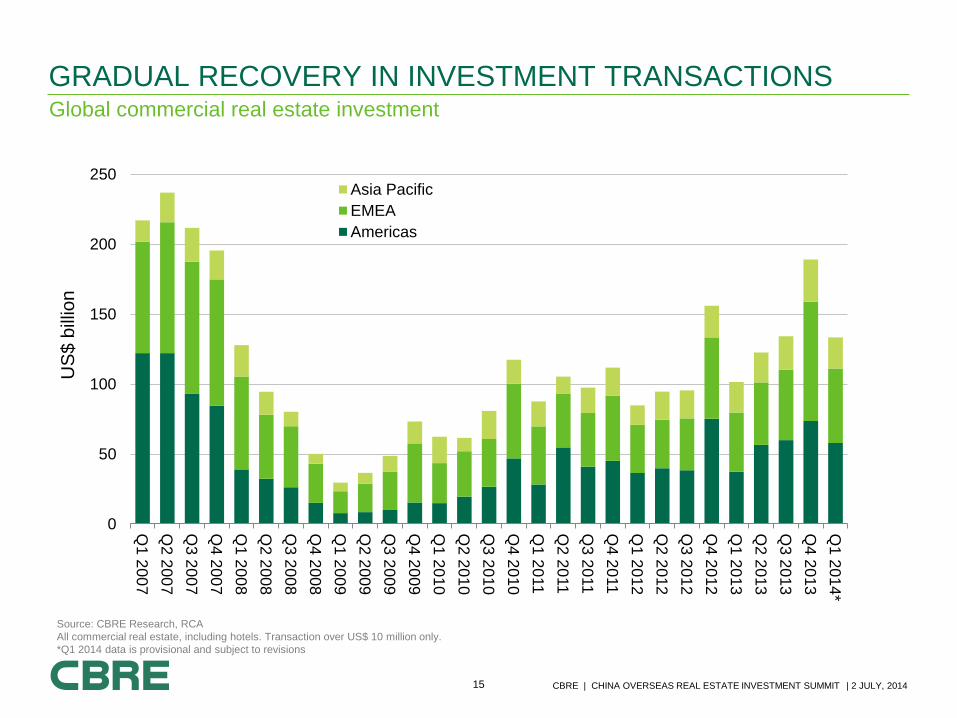
Global commercial real estate investment
GRADUAL RECOVERY IN INVESTMENT TRANSACTIONS
0
50
100
150
200
250
Q1
20
07
Q2
20
07
Q3
20
07
Q4
20
07
Q1
20
08
Q2
20
08
Q3
20
08
Q4
20
08
Q1
20
09
Q2
20
09
Q3
20
09
Q4
20
09
Q1
20
10
Q2
20
10
Q3
20
10
Q4
20
10
Q1
20
11
Q2
20
11
Q3
20
11
Q4
20
11
Q1
20
12
Q2
20
12
Q3
20
12
Q4
20
12
Q1
20
13
Q2
20
13
Q3
20
13
Q4
20
13
Q1
20
14
*
Asia Pacific
EMEA
Americas
US
$ b
illio
n
Source: CBRE Research, RCA
All commercial real estate, including hotels. Transaction over US$ 10 million only.
*Q1 2014 data is provisional and subject to revisions
16 CBRE | CHINA OVERSEAS REAL ESTATE INVESTMENT SUMMIT | 2 JULY, 2014
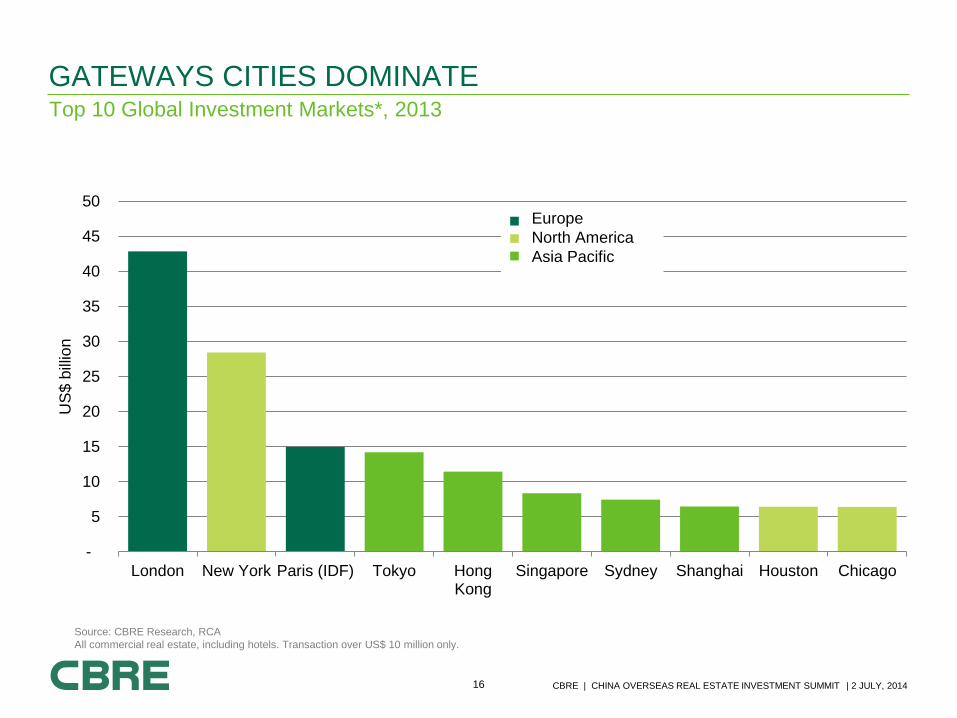
Top 10 Global Investment Markets*, 2013
GATEWAYS CITIES DOMINATE
-
5
10
15
20
25
30
35
40
45
50
London New York Paris (IDF) Tokyo HongKong
Singapore Sydney Shanghai Houston Chicago
US
$ b
illio
n
Europe
North America
Asia Pacific
Source: CBRE Research, RCA
All commercial real estate, including hotels. Transaction over US$ 10 million only.
17 CBRE | CHINA OVERSEAS REAL ESTATE INVESTMENT SUMMIT | 2 JULY, 2014
Beijing
Seoul Shanghai
Singapore Tokyo
Hong Kong
Taiwan
Madrid
Frankfurt
Paris
London West End
Brussels
Amsterdam
Milan
Chicago Washington
New York
San Francisco
Houston
Dallas
Atlanta Boston Las Vegas
Brisbane
Perth
Melbourne
Sydney
0
1
2
3
4
5
6
7
8
-2.0 -1.5 -1.0 -0.5 0.0 0.5 1.0 1.5
Pri
me o
ffic
e y
ield
(%
) , Q
1 2
014
Yield shift, y-o-y %
Asia
Europe
N America
Pacific
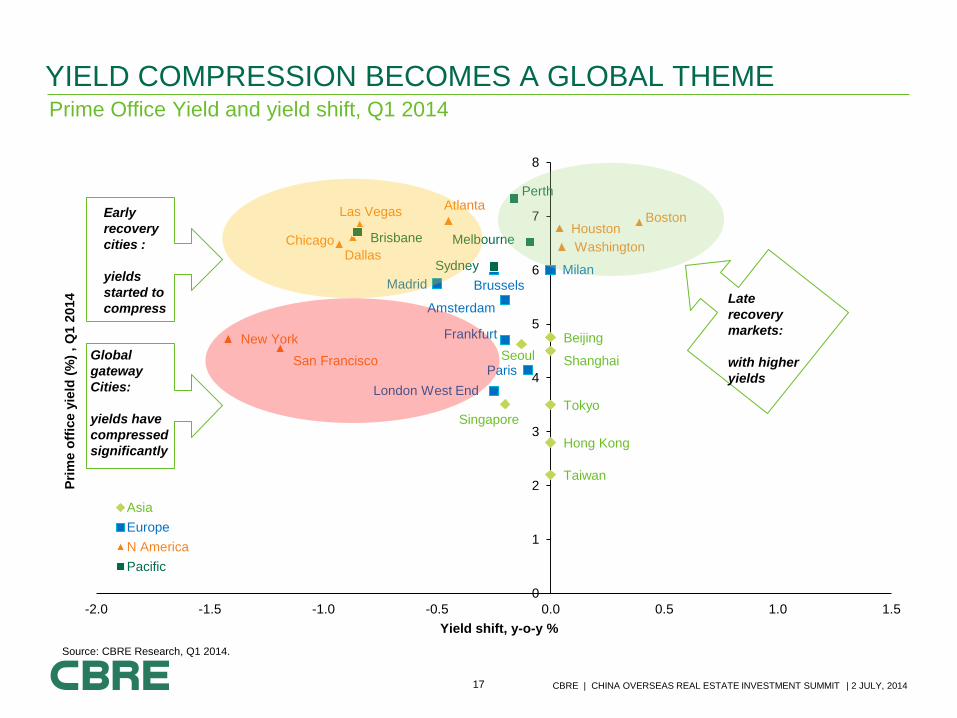
Global
gateway
Cities:
yields have
compressed
significantly
Early
recovery
cities :
yields
started to
compress
YIELD COMPRESSION BECOMES A GLOBAL THEME Prime Office Yield and yield shift, Q1 2014
Source: CBRE Research, Q1 2014.
Late
recovery
markets:
with higher
yields
18 CBRE | CHINA OVERSEAS REAL ESTATE INVESTMENT SUMMIT | 2 JULY, 2014
0%
2%
4%
6%
8%
10%
12%
0%
1%
2%
3%
4%
5%
6%
Apr-
03
Oct-
03
Apr-
04
Oct-
04
Apr-
05
Oct-
05
Apr-
06
Oct-
06
Apr-
07
Oct-
07
Apr-
08
Oct-
08
Apr-
09
Oct-
09
Apr-
10
Oct-
10
Apr-
11
Oct-
11
Apr-
12
Oct-
12
Apr-
13
Oct-
13
Apr-
14
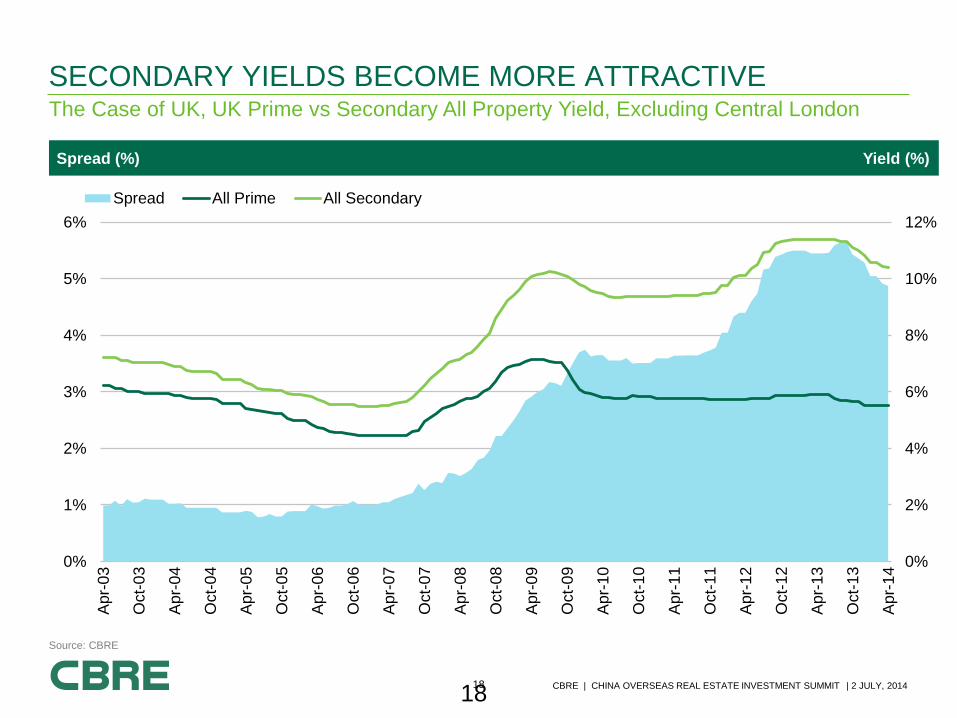
Spread All Prime All Secondary
18
SECONDARY YIELDS BECOME MORE ATTRACTIVE
Spread (%) Yield (%)
Source: CBRE
The Case of UK, UK Prime vs Secondary All Property Yield, Excluding Central London
19 CBRE | CHINA OVERSEAS REAL ESTATE INVESTMENT SUMMIT | 2 JULY, 2014
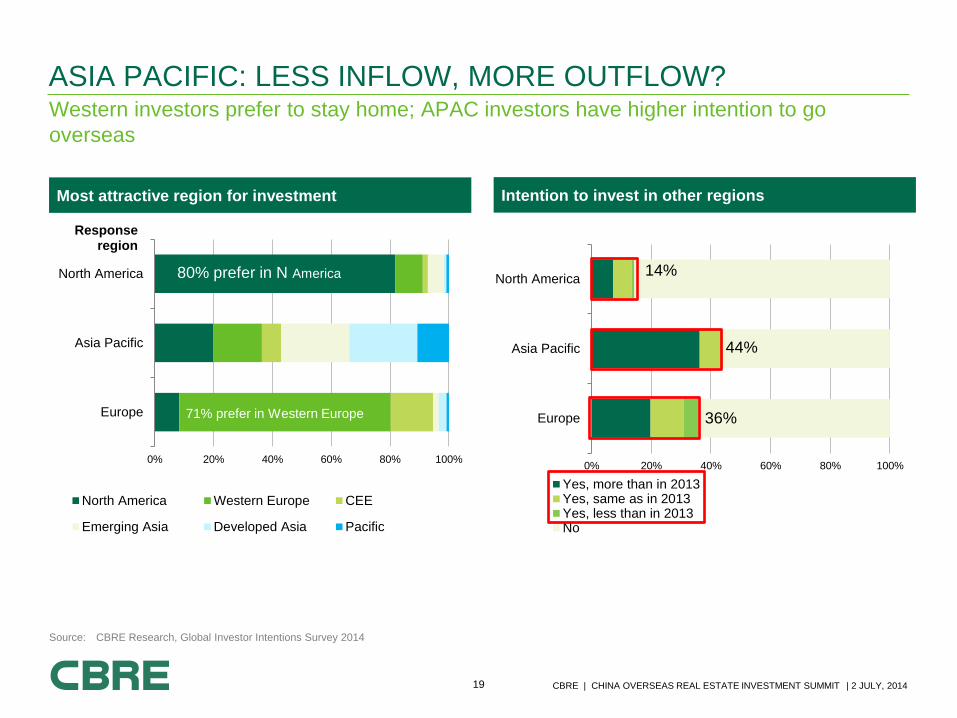
Western investors prefer to stay home; APAC investors have higher intention to go
overseas
ASIA PACIFIC: LESS INFLOW, MORE OUTFLOW?
Most attractive region for investment Intention to invest in other regions
• This chart is embedded
and can be edited
when required
STEPS
1. To edit elements
within the chart
select the element
and the ‘Chart Tools’
tabs will become
available in your
ribbon (alternatively
select the element
and right-click,
‘Format …’)
2. Apply required
changes
3. To edit data, select
the chart and right-
click. Select ‘Edit
Data’ – an Excel
window containing
the chart data will
open
Source: CBRE Research, Global Investor Intentions Survey 2014
0% 20% 40% 60% 80% 100%
Europe
Asia Pacific
North America
Response region
North America Western Europe CEE
Emerging Asia Developed Asia Pacific
0% 20% 40% 60% 80% 100%
Europe
Asia Pacific
North America
Yes, more than in 2013Yes, same as in 2013Yes, less than in 2013No
80% prefer in N America
71% prefer in Western Europe
14%
44%
36%
20 CBRE | CHINA OVERSEAS REAL ESTATE INVESTMENT SUMMIT | 2 JULY, 2014
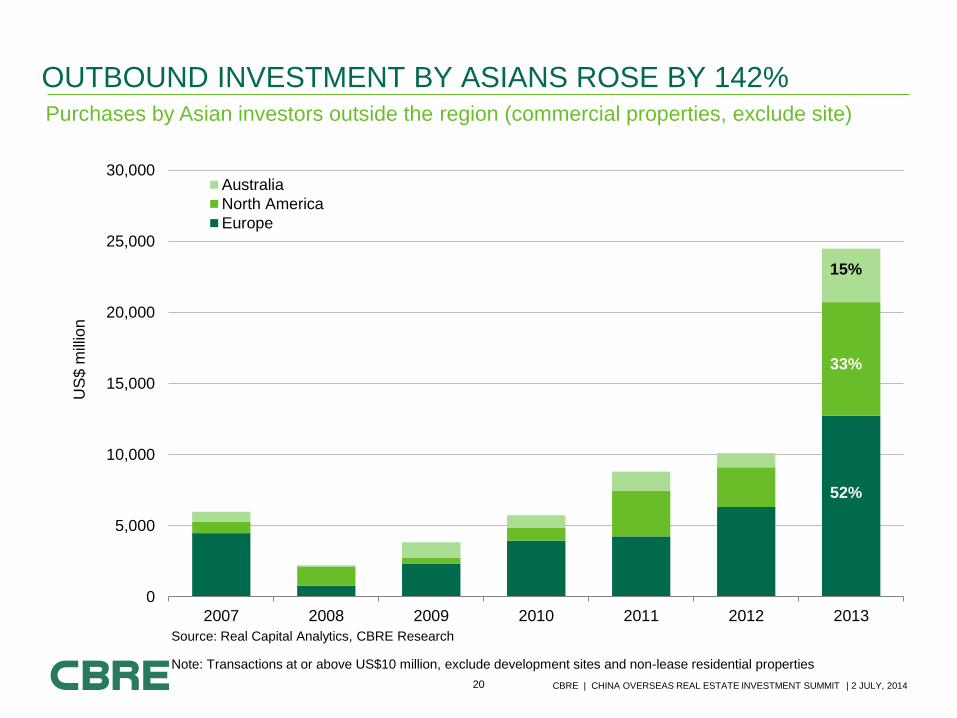
OUTBOUND INVESTMENT BY ASIANS ROSE BY 142%
0
5,000
10,000
15,000
20,000
25,000
30,000
2007 2008 2009 2010 2011 2012 2013
US
$ m
illio
n
Australia
North America
Europe
Source: Real Capital Analytics, CBRE Research
Note: Transactions at or above US$10 million, exclude development sites and non-lease residential properties
Purchases by Asian investors outside the region (commercial properties, exclude site)
52%
33%
15%

21 CBRE | CHINA OVERSEAS REAL ESTATE INVESTMENT SUMMIT | 2 JULY, 2014
…GROWTH WAS LED BY CHINESE AND SINGAPOREAN
0
5,000
10,000
15,000
20,000
25,000
30,000
2007 2008 2009 2010 2011 2012 2013
US
$ m
illio
n
Rest of Asia
Hong Kong
Japan
Malaysia
South Korea
China
Singapore
Source: Real Capital Analytics, CBRE Research
Note: Transactions at or above US$10 million, exclude development sites and non-lease residential properties
Purchases by Asian investors outside the region (commercial properties, exclude site)
22 CBRE | CHINA OVERSEAS REAL ESTATE INVESTMENT SUMMIT | 2 JULY, 2014
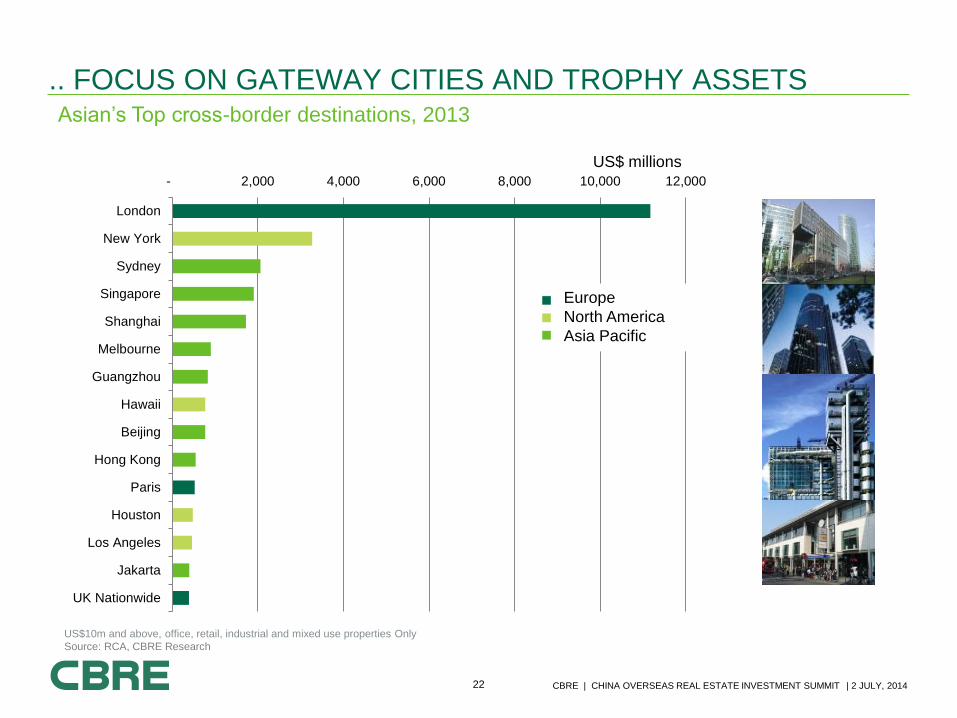
.. FOCUS ON GATEWAY CITIES AND TROPHY ASSETS
US$10m and above, office, retail, industrial and mixed use properties Only
Source: RCA, CBRE Research
- 2,000 4,000 6,000 8,000 10,000 12,000
London
New York
Sydney
Singapore
Shanghai
Melbourne
Guangzhou
Hawaii
Beijing
Hong Kong
Paris
Houston
Los Angeles
Jakarta
UK Nationwide
US$ millions
Asian’s Top cross-border destinations, 2013
Europe
North America
Asia Pacific
23 CBRE | CHINA OVERSEAS REAL ESTATE INVESTMENT SUMMIT | 2 JULY, 2014
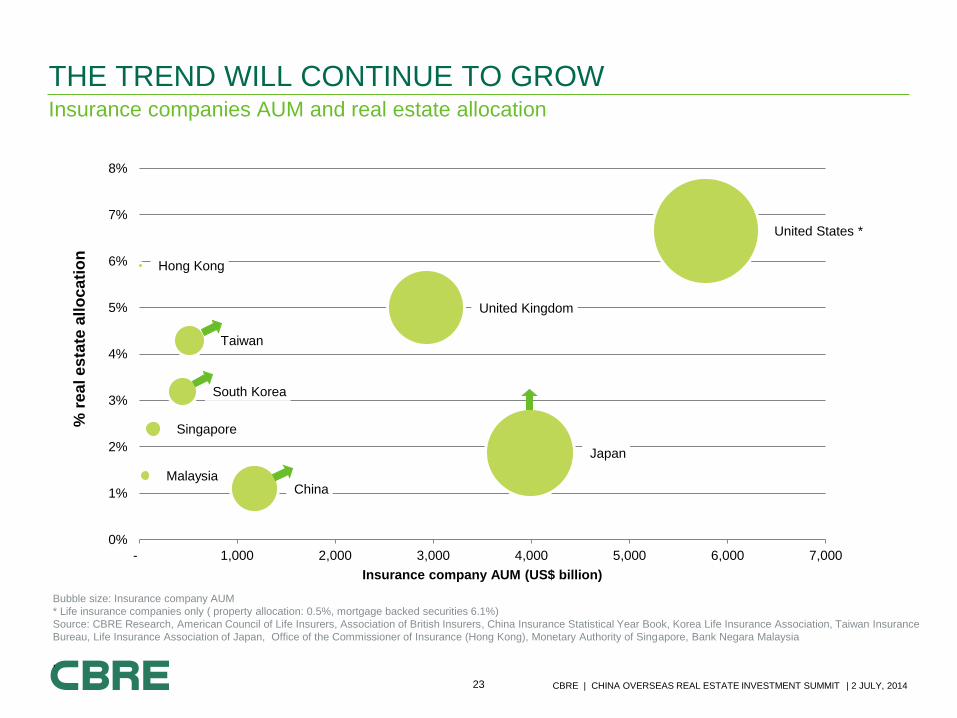
Insurance companies AUM and real estate allocation
THE TREND WILL CONTINUE TO GROW
United States *
Hong Kong
United Kingdom
Taiwan
South Korea
Singapore
Japan
Malaysia China
0%
1%
2%
3%
4%
5%
6%
7%
8%
- 1,000 2,000 3,000 4,000 5,000 6,000 7,000
% r
ea
l e
sta
te a
llo
ca
tio
n
Insurance company AUM (US$ billion)
Bubble size: Insurance company AUM
* Life insurance companies only ( property allocation: 0.5%, mortgage backed securities 6.1%)
Source: CBRE Research, American Council of Life Insurers, Association of British Insurers, China Insurance Statistical Year Book, Korea Life Insurance Association, Taiwan Insurance
Bureau, Life Insurance Association of Japan, Office of the Commissioner of Insurance (Hong Kong), Monetary Authority of Singapore, Bank Negara Malaysia
,

INVESTMENT STRATEGY How will investors allocate their capitals globally?
25 CBRE | CHINA OVERSEAS REAL ESTATE INVESTMENT SUMMIT | 2 JULY, 2014
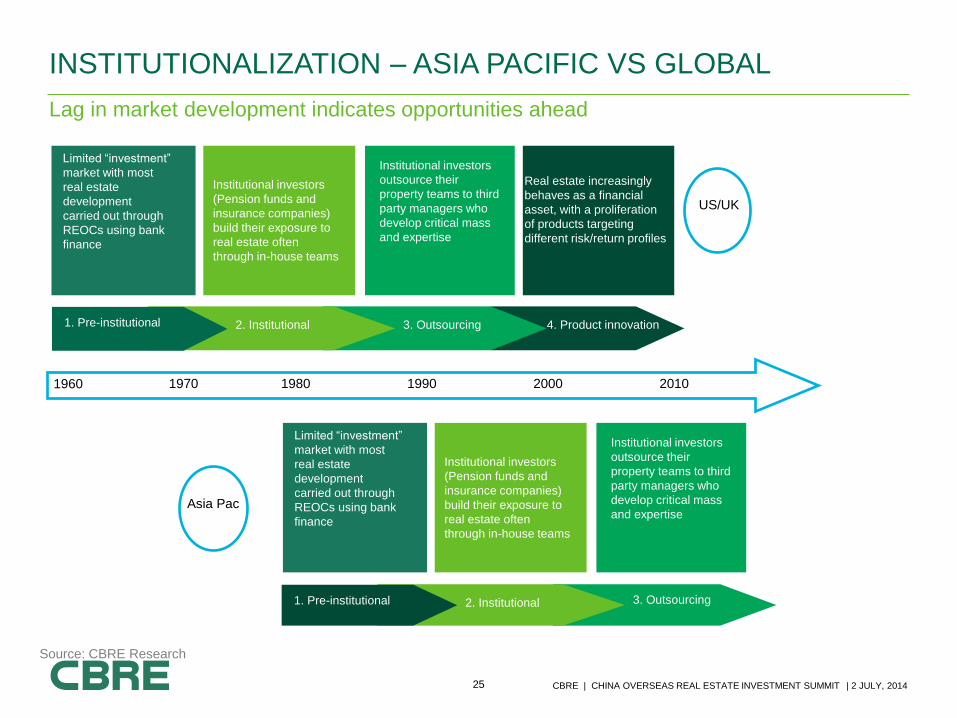
INSTITUTIONALIZATION – ASIA PACIFIC VS GLOBAL
Source: CBRE Research
Limited “investment”
market with most
real estate
development
carried out through
REOCs using bank
finance
Institutional investors
(Pension funds and
insurance companies)
build their exposure to
real estate often
through in-house teams
Institutional investors
outsource their
property teams to third
party managers who
develop critical mass
and expertise
Real estate increasingly
behaves as a financial
asset, with a proliferation
of products targeting
different risk/return profiles
1. Pre-institutional 2. Institutional 3. Outsourcing 4. Product innovation
1960 1970 1980 1990 2000 2010
US/UK
Asia Pac
Limited “investment”
market with most
real estate
development
carried out through
REOCs using bank
finance
Institutional investors
(Pension funds and
insurance companies)
build their exposure to
real estate often
through in-house teams
Institutional investors
outsource their
property teams to third
party managers who
develop critical mass
and expertise
1. Pre-institutional 2. Institutional 3. Outsourcing
Lag in market development indicates opportunities ahead
26 CBRE | CHINA OVERSEAS REAL ESTATE INVESTMENT SUMMIT | 2 JULY, 2014
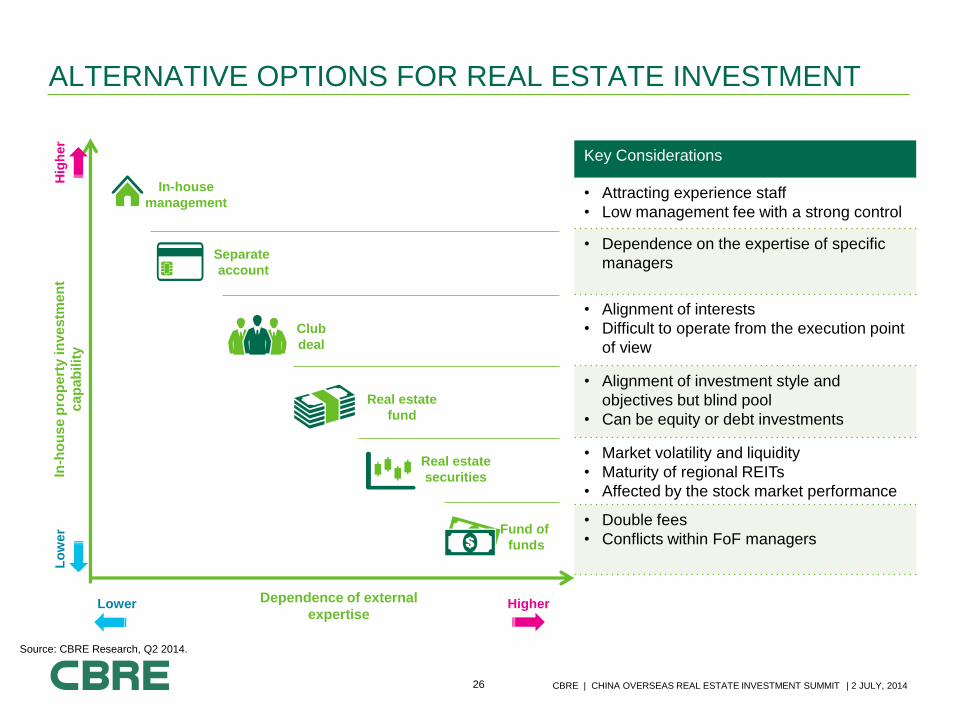
ALTERNATIVE OPTIONS FOR REAL ESTATE INVESTMENT
In-house
management
In-h
ou
se
pro
pe
rty i
nve
stm
en
t
ca
pa
bilit
y
Dependence of external
expertise
Separate
account
Club
deal
Real estate
fund
Real estate
securities
Fund of
funds
Source: CBRE Research, Q2 2014.
Lower Higher
Lo
wer
Hig
her
Key Considerations
• Attracting experience staff
• Low management fee with a strong control
• Dependence on the expertise of specific
managers
• Alignment of interests
• Difficult to operate from the execution point
of view
• Alignment of investment style and
objectives but blind pool
• Can be equity or debt investments
• Market volatility and liquidity
• Maturity of regional REITs
• Affected by the stock market performance
• Double fees
• Conflicts within FoF managers
27 CBRE | CHINA OVERSEAS REAL ESTATE INVESTMENT SUMMIT | 2 JULY, 2014 Source: CBRE Research
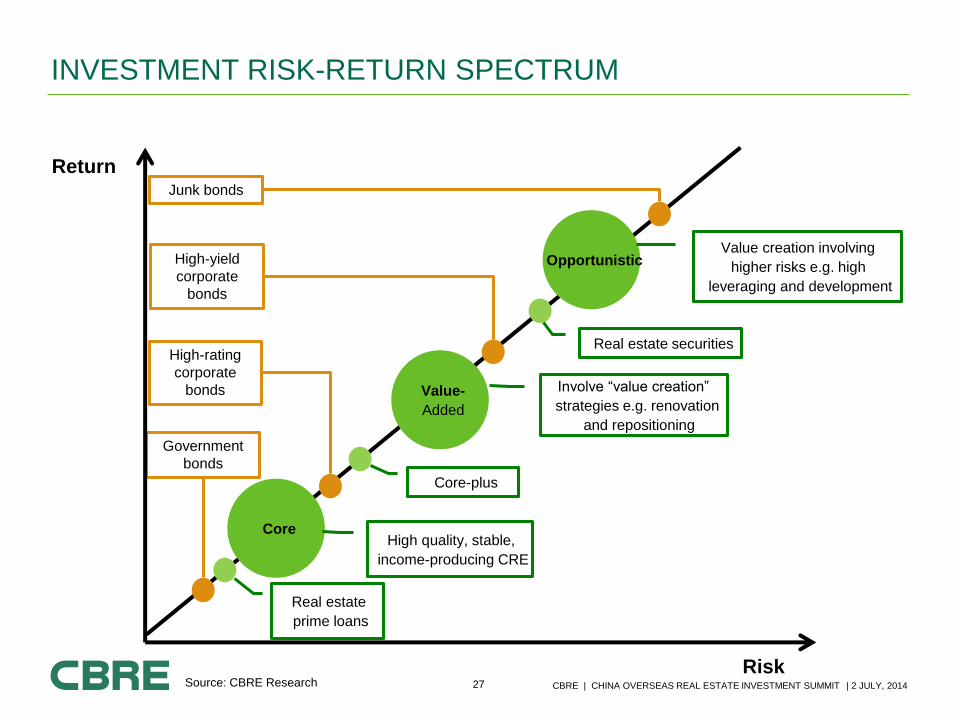
Core
Value-
Added
Opportunistic
High quality, stable,
income-producing CRE
Value creation involving
higher risks e.g. high
leveraging and development
Involve “value creation”
strategies e.g. renovation
and repositioning
Government
bonds
High-rating
corporate
bonds
High-yield
corporate
bonds
Junk bonds
Real estate
prime loans
Core-plus
Real estate securities
INVESTMENT RISK-RETURN SPECTRUM
Risk
Return
28 CBRE | CHINA OVERSEAS REAL ESTATE INVESTMENT SUMMIT | 2 JULY, 2014
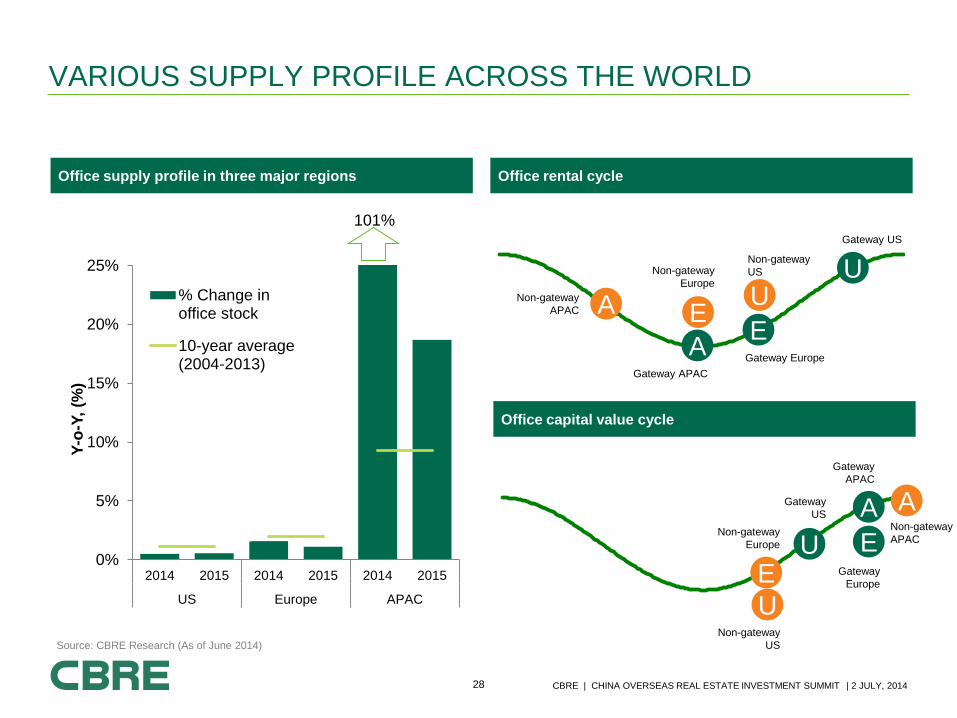
0%
5%
10%
15%
20%
25%
2014 2015 2014 2015 2014 2015
US Europe APAC
Y-o
-Y,
(%)
% Change inoffice stock
10-year average(2004-2013)
VARIOUS SUPPLY PROFILE ACROSS THE WORLD
Source: CBRE Research (As of June 2014)
A E
Office supply profile in three major regions Office rental cycle
U U
E A Non-gateway
APAC
Non-gateway
Europe
Gateway APAC
Gateway US
Gateway Europe
Non-gateway
US
A
E
Office capital value cycle
U
U
E
A Non-gateway
APAC Non-gateway
Europe
Gateway
APAC
Gateway
US
Gateway
Europe
Non-gateway
US
101%
29 CBRE | CHINA OVERSEAS REAL ESTATE INVESTMENT SUMMIT | 2 JULY, 2014
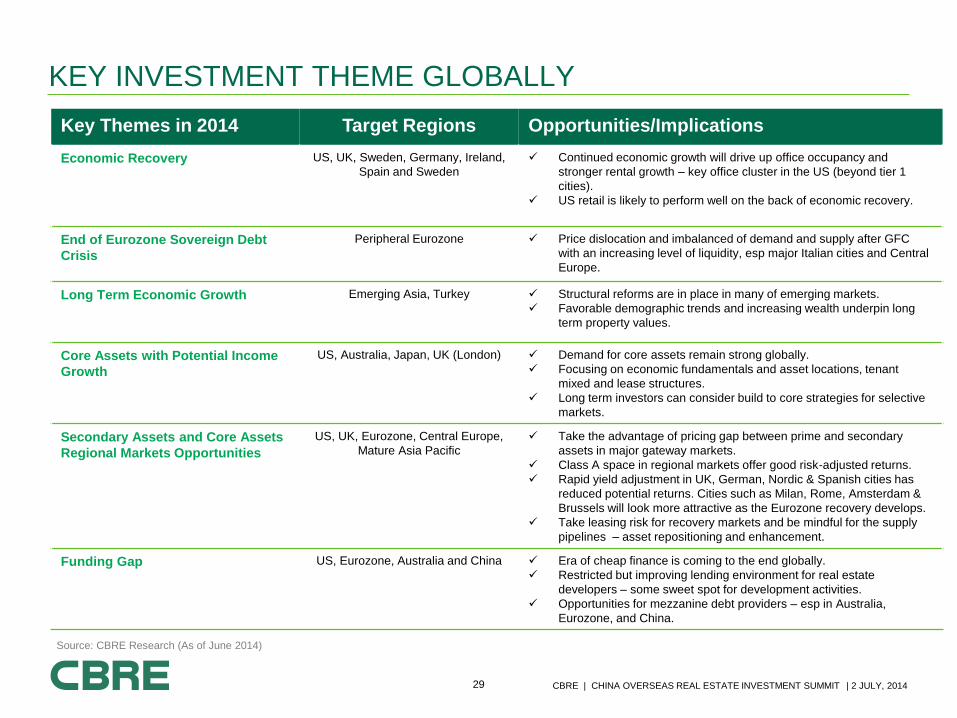
KEY INVESTMENT THEME GLOBALLY
Key Themes in 2014 Target Regions Opportunities/Implications
Economic Recovery US, UK, Sweden, Germany, Ireland,
Spain and Sweden
Continued economic growth will drive up office occupancy and
stronger rental growth – key office cluster in the US (beyond tier 1
cities).
US retail is likely to perform well on the back of economic recovery.
End of Eurozone Sovereign Debt
Crisis
Peripheral Eurozone Price dislocation and imbalanced of demand and supply after GFC
with an increasing level of liquidity, esp major Italian cities and Central
Europe.
Long Term Economic Growth Emerging Asia, Turkey Structural reforms are in place in many of emerging markets.
Favorable demographic trends and increasing wealth underpin long
term property values.
Core Assets with Potential Income
Growth
US, Australia, Japan, UK (London) Demand for core assets remain strong globally.
Focusing on economic fundamentals and asset locations, tenant
mixed and lease structures.
Long term investors can consider build to core strategies for selective
markets.
Secondary Assets and Core Assets
Regional Markets Opportunities
US, UK, Eurozone, Central Europe,
Mature Asia Pacific
Take the advantage of pricing gap between prime and secondary
assets in major gateway markets.
Class A space in regional markets offer good risk-adjusted returns.
Rapid yield adjustment in UK, German, Nordic & Spanish cities has
reduced potential returns. Cities such as Milan, Rome, Amsterdam &
Brussels will look more attractive as the Eurozone recovery develops.
Take leasing risk for recovery markets and be mindful for the supply
pipelines – asset repositioning and enhancement.
Funding Gap US, Eurozone, Australia and China Era of cheap finance is coming to the end globally.
Restricted but improving lending environment for real estate
developers – some sweet spot for development activities.
Opportunities for mezzanine debt providers – esp in Australia,
Eurozone, and China.
Source: CBRE Research (As of June 2014)

Thank you