transmutation in the electrolysis of light water – … · some nuclear transmutation, one...
TRANSCRIPT

1
Ohmori, T., et al., Transmutation in the electrolysis of lightwater - excess energy and iron
production in a gold electrode. Fusion Technol., 1997. 31: p. 210.
TRANSMUTATION IN THE ELECTROLYSIS OF LIGHT
WATER – EXCESS ENERGY AND IRON PRODUCTION
IN A GOLD ELECTRODE
NUCLEAR REACTIONSIN SOLIDS
TADAYOSHI OHMORI Hokkaido UniversityCatalysis Research Center, Kitaku Sapporo 060, Japan
MICHIO ENYO Hakodate National College of TechnologyTokuracho Hakodate 042, Japan
TADAHIKO MIZUNO Hokkaido UniversityFaculty of Engineering, Kitaku Sapporo 060, Japan
YOSHINOBU NODASAKA Hokkaido UniversitySchool of Dentistry, Kitaku Sapporo 060, Japan
HIDEKI MINAGAWA Hokkaido National Industrial Research InstituteToyohiraku Sapporo 062, Japan
Received January 29, 1996Accepted for Publication June 14, 1996
KEYWORDS: iron production, excess energy, isotopic abundance
The identification of some reaction products possibly produced during the generation of
excess energy is attempted. Electrolysis is performed for 7 days with a constant current intensity
of 1 A. The electrolytes used are Na2SO4, K2SO4, K2CO3, and KOH. After the electrolysis, the
elements in the electrode near the surface are analyzed by Auger electron spectroscopy and
electron probe microanalysis. In every case, a notable amount of iron atoms in the range of
1.0 × 10¹⁶ to 1.8 × 10¹⁷ atom/cm2 (true area) are detected together with the generation of a
certain amount of excess energy evolution. The isotopic abundance of iron atoms, which are 6.5,
77.5, and 14.5% for 54Fe, 56Fe, and 57Fe, respectively, and are obviously different from the
natural isotopic abundance, are measured at the top surface of a gold electrode by secondary
ion mass spectrometry. The content of 57Fe tends to increase up to 25% in the more inner layers
of the electrode.

2
INTRODUCTION
The nuclear transmutation that occurs in a metal cathode during electrolysis seems to be
essentially different from conventional nuclear transmutation. Its most striking characteristic is
that the radiation emission from the reaction zone is either lacking or extremely small. Perhaps
the energies generated in this reaction zone are dispersed to surrounding atoms; this dispersion
possibly acts as a driving force for further transmutations. Therefore, it is thought that the
possibility of some nuclear transmutation other than a hydrogen-deuterium, deuterium-deuterium,
or tritium-deuterium fusion reaction should be taken into account in such a system. Actually,
based on analysis using secondary ion mass spectrometry (SIMS) and inductively coupled
plasma-mass spectroscopy (ICPMS), Bush and Eagleton1 and Bush2 have reported that calcium
and strontium atoms are produced from K+ and Rb+ ions, respectively, in the electrolysis of light
water with a nickel cathode. The result, however, is not generally accepted because of the
difficulty of excluding the possibility of hydride formation of these metals. On the other hand,
we recently observed the production of iron atoms reaching 1.0 × 10¹⁶ to 1.8 × 10¹⁷ atom/cm2
(true area) together with the excess energy evolution of 215 to 723 mW for gold cathodes after
the electrolysis of light water.3,4 To verify that the production of iron atoms is induced because of
some nuclear transmutation, one absolutely must investigate the isotopic abundance of the
aforementioned iron atoms.
For this reason, we made a quantitative analysis and an isotopic quantification of all the
elements including iron (mass number <200) in a gold cathode after the electrolysis of light
water. In this work, we also measured the excess energies and checked the correlation with the
amounts of reaction products.
EXPERIMENT
Five fused quartz [iron < 0.3 parts per million (ppm)] electrolytic cells were used. These
were in the form of a flat-bottomed cylinder (~19.6 cm2 × 15 cm) with a 5-cm-thick silicone
rubber stopper holding a working electrode, a counter electrode, a thermocouple, and a quartz
glass inlet tube for H2 gas, which were cleaned carefully with hot mixed acid (1:1 H2SO4, HNO3),
rinsed with MQ water ultrasonically, and finally rinsed with MQ water before conducting the
electrolysis. The working electrode was suspended by a gold lead wire (0.03-cm diameter)
coated with thin Teflon film without its terminal parts.
The five cells were placed in either of two types of air thermostats, whose temperature was
regulated at ~21°C. The temperature fluctuation of one thermostat was periodical, that is, ±0.5°C
with 10 cycle/h, so that the fluctuation of the solution temperature in the electrolytic cell placed
in this thermostat was kept within ±0.03°C. While the temperature in another thermostat
fluctuated by ±0.5°C with 1 cycle/day, the fluctuation of the solution temperature in this
thermostat needed to be depressed within ± 0.03°C if the correction of the foregoing periodical
temperature fluctuation was to be made.

3
The working electrodes used were cold-worked gold sheets (which had an apparent area of
2.5 and 5.0 cm2, were 0.1-mm thick, and had 99.99% purity and iron <1 ppm), whose surface
was scraped with a cleaned glass fragment edge and then washed with methyl alcohol and MQ
water. The roughness factor of the electrode determined from the measurement of double-layer
capacitance5 was 2.0. The counter electrode was a 1- × 7-cm, 80-mesh platinum net (with
99.98% purity and iron <16 ppm). The working and the counter electrodes were placed at the
bottom of the cell to minimize the temperature gradient in the electrolyte solution by vigorously
stirring with H2 and O2 bubbles evolved from these electrodes. The electrolyte solutions used
were 0.5 M Na2SO4, K2SO4, K2CO3, and KOH, which were prepared from Merck Sprapur-grade
chemicals. The volume of the electrolyte solution was 100 ml. The electric heater for measuring
the calibration curves between the increment of the solution temperature and the input power was
a Ni-chrome spiral (0.3- and 1.6-mm diameter) connected to copper wires (1-mm diameter), both
ends of which were inserted into a Pyrex glass sheath (of 6-mm diameter and 15-cm length)
containing silicone oil. When the calibration curves were measured, the heater was set at the
position of the working electrode. During the measurement of the calibration curves, the solution
was stirred by passing H2 gas with the same flow rate as that of the H2 and O2 gases evolved in
the real electrolysis. The electrolysis was conducted galvanostatically for 7 days at a constant
current of 1 A, and the applied cell voltage and the increase in solution temperature were
monitored by a recorder. Before the electrolysis, the gold electrode was kept at RHE by passing
H2 gas into the cell. During the electrolysis, MQ water was added every 24 h to maintain the total
amount of the solution.
To identify the elements present in the gold electrodes after electrolysis and to determine
these isotopic abundances, we carried out Auger electron spectroscopy (AES), electron probe
microanalysis (EPMA), and SIMS measurements. The AES measurement was made with the use
of an ANELVA AAS-200 Auger electron spectrometer with 3.0-keV beam energy and 2.5-A
filament current. The electrode sample after having been washed with MQ water was placed on a
nickel plate holder in a chamber equipped with electron and ion guns in a vacuum of 2 × 10⁻⁸
Torr. The Ar+ ion bombardment was performed under 2.5 × 10⁻⁵ Torr of 99.9995% argon gas.
The pictures of the mapping of the reaction product (iron) in the electrode were obtained by
means of scanning electron microscopy (SEM) (Hitachi S-4000) and EPMA (SHIMADZU
EMX-SM and 25-kV accelerating voltage). The SIMS measurement was carried out with a
HITACHI IMA-3 ion microanalyzer under 5 × 10⁻⁹ Torr by O�� ion irradiation (100-nA primary
ion current and 12-keV accelerating voltage) from Hitachi Instruments Engineering Company.
RESULTS AND DISCUSSION
Heat Measurement
A typical calibration curve of the electrolytic cell between the increment of the solution
temperature and the input power is shown in Fig. 1. A very reproducible linear relationship was

4
obtained up to ~17°C in each cell. The cell constants of the five cells calculated from the
gradient of such linear relationships were 3.08, 3.10, 3.40, 3.53, and 3.47, the precision of which
was ±0.04. The change of the cell constants with losing solution volume within 10 ml (the
amount of which corresponds approximately to that lost through the electrolysis for 1 day) was
practically negligible.
Fig. 1. The calibration curve between the input power and the solution temperature rise.
When the increment of the solution temperature ΔT was lower than 17°C, the rate of excess
energy evolution Rex was determined by the following equation4:
Rex = ΔT/k – (Rapp - EthI), (1)
where
Rapp = applied electrolysis power
I = electrolysis current
Eth = thermoneutral potential, that is, 1.48 V for H2O decomposition.
On the other hand, when ΔT exceeded 17°C, the Rex was determined from the difference between
the input power of the calibration curve and (E + Eth)I, which is necessary to keep the solutions
in the calibration and the electrolytic cells at a given temperature.
Figure 2 shows the typical time courses of the solution temperature rise after starting
electrolysis in the Na2SO4 and K2CO3 solutions. Figure 2 also shows the time elapse of the cell
voltage. As one can see, the increase in the solution temperature in Na2SO4 is clearly larger than
that in K2CO3, although the cell voltages are nearly the same in both cases. This difference was
essentially unchanged over the entire time of the electrolysis. This result directly shows that

5
excess energy is steadily evolved at least during the electrolysis with the gold electrodes in the
Na2SO4 solutions.
The Rex obtained in the various electrolyte solutions are listed in Table I. The maximum Rex
obtained was 937 mW (2.5 cm2 gold in Na2SO4), which corresponds to 22% of the applied input
power. The values of Rex on eleven 5-cm2 gold/electrolyte systems and on nine 2.5-cm2
gold/electrolyte systems are in the ranges of 185 to 710 and 255 to 937 mW, respectively, the
amount of which seems to be somewhat increasing with increasing electrolysis current density.
These values fairly reproduce the results obtained for the gold electrode in the K2CO3, Na2CO3,
and Li2SO4 solutions.3,4 Measurement of the current efficiency was made repeatedly at a given
time during the electrolysis, the result of which was 100.6, 100.1, and 101.1%. This fact shows
that there is no conceivable possibility of the recombination of H2 and O2 as another cause of the
excess energy production.
TABLE IResults of the Heat Measurement
Electrode SolutionRapp - 1.48I
(W)
Rex(mW)
� � �� � � � � − 1.48 �
(%)
Gold (10 cm2) Na2SO4 3.70 710 19
3.68 353 10
3.79 534 14
4.00 580 15
3.72 625 17
3.72 343 9
3.40 215 6
3.44 218 6
K2CO3 4.36 428 10
KOH 4.28 185 4
Gold (5 cm2) Na2SO4 4.19 937 22
4.03 615 15
4.38 600 14
4.28 795 19
K2CO3 4.48 744 17
4.12 528 13
3.83 713 19
K2SO4 4.43 401 9
4.12 255 6

6
Fig. 2. The time elapse of the solution temperature and the input potential after the electrolysis: Na2SO4 (1) and (1′),
and K2CO3 (2) and (2′).
The results of the Rex measurement on gold and platinum electrodes in the 0.5 M H2SO4
solutions are listed in Table II. The values of Rex were negative, but the efficiency compared with
the applied power was close to 0 in every case. This shows that practically no excess heat was
evolved in the H2SO4 solutions. So far, hardly any papers have reported the evolution of excess
energy in acid solutions, which means that there is no excess energy evolution. Practically
without exception, we observed in the H2SO4 solutions no excess energy evolution. The
reliability of our heat measurements is supported.
TABLE IIResults of the Heat Measurement
Electrode SolutionRapp – 1.48 I
(W)Rex
(mW)
� � �� � � � � − 1.48 �
(%)
Gold H2SO4 1.62 -9 -0.61.62 -12 -0.71.35 -9 -0.7
Platinum 1.47 -30 -2.0
The total excess energies evolved during 7 days of electrolysis are estimated to be in the
range of 111 to 567 kJ from the data shown in Table I. This means that at least several moles of
reaction products should be produced during the electrolysis if the excess energies are caused by
some exothermic conventional chemical reaction. However, such a large amount of reaction

7
products was not obtained except for H2 and O2, which suggests that some anomalous reaction
was connected with the excess energy evolution.
Reaction Product
Figures 3 and 4 show the AES spectra of the gold electrodes after 7 days of electrolysis in the
Na2SO4 and K2CO3 solutions, respectively. On the spectra of the top surface (no Ar+ ion
bombardment treatment), rather than gold signals, iron and oxygen signals were observed. On
carrying out Ar+ ion bombardment, the iron and oxygen signals declined and disappeared after
several minutes of the bombardment. The iron and oxygen signals were observed for every
electrode independent of the nature of the electrolyte solutions. In some cases, carbon and
platinum signals were observed. However, signals of other elements were not detected.
The oxygen signal always appeared together with the iron signals, and the ratio of these
signal intensities was nearly the same in every AES spectrum obtained. The spectrum of pure
iron (99.99%) after 30 min of Ar+ ion bombardment is shown in Fig. 5. In this spectrum, the
oxygen signal appears together with the iron signals, and the shape of the oxygen and iron
signals is like those shown in Figs. 3 and 4. From this fact, one can see that oxygen atoms are
positioned not on gold atoms but on iron atoms. Perhaps traces of O2 contained in argon gas were
bound to iron atoms during the Ar+ ion bombardment. When estimating the total number of iron
atoms, we considered that the number of oxygen atoms estimated from the oxygen signal was
equal to the number of iron atoms covered with oxygen atoms and added the number of oxygen
atoms to the number of iron atoms estimated from the iron signal itself, assuming that oxygen
atoms are bound to iron atoms at a ratio of 1:1.
Fig. 3. The AES spectra in the electrode near the surface after the electrolysis in the Na2SO4 solution: Ar+ ion
bombardment time, nothing (1), 30 s (2), 120 s (3), 180 s (4), and 600 s (5).

8
Fig. 4. The AES spectra in the electrode close to the surface after the electrolysis in the K2C03 solution: Ar+ ion
bombardment time, nothing (1), 30 s (2), 60 s (3), and 90 s (4).
Fig. 5. The AES spectrum of a pure iron metal: Ar+ ion bombardment time, 30 min.

9
The distribution profile of the iron atoms in the bulk of the electrode was obtained in the
following way. The number of iron atoms NFe sputtered off from the electrode surface by Ar+ ion
bombardment can be estimated by the following equation:
� Fe = � Fe × � � � � =� Fe× � � � � × �
� . � × � � � � �, (2)
where
NAr+ = number of Ar+ ions bombarded per unit surface area
IAr+ = current density of Ar+ ion bombardment (2.5 µA)
fFe = sputtering yield for iron [1.2 (Ref. 7)]
t = duration of the bombardment.
The number of the atomic layers of iron layers sputtered off was estimated approximately from
NFe/1015.
The typical distribution profile of iron atoms calculated from the results in Fig. 3 is shown in
Fig. 6. The iron atoms occupied 44% of the top surface, which was distributed among ~100
layers (corresponding to ~5 min of bombardment time). Figure 7 shows the EPMA image of the
iron atoms in the gold electrode after electrolysis in the Na2SO4 solution; we can see that the iron
atoms were distributed uniformly over the entire electrode. The amounts of iron atoms produced
in the gold electrodes in the various electrolyte solutions ranged between 1.0 × 10¹⁵ and
1.8 × 10¹⁶ atom/cm2 (true area). The latter value shows that the total amount of iron produced on
this electrode was ~17 μg. However, in the case of the gold electrodes without any mechanical
treatment, the amount of iron atoms is two orders of magnitude smaller, ranging from 2.4 × 10¹⁴
to 8.0 × 10¹⁴ atom/cm2 under the same electrolysis condition. This result suggests that the
production of iron atoms is strongly affected on the crystal lattice strain of the electrode.

10
Fig. 6. The distribution profile of the iron atoms in the bulk of the electrode after the electrolysis in the Na2SO4
solution: iron is designated by the closed circles, platinum is designated by the open squares, and gold is designated
by the open circles.
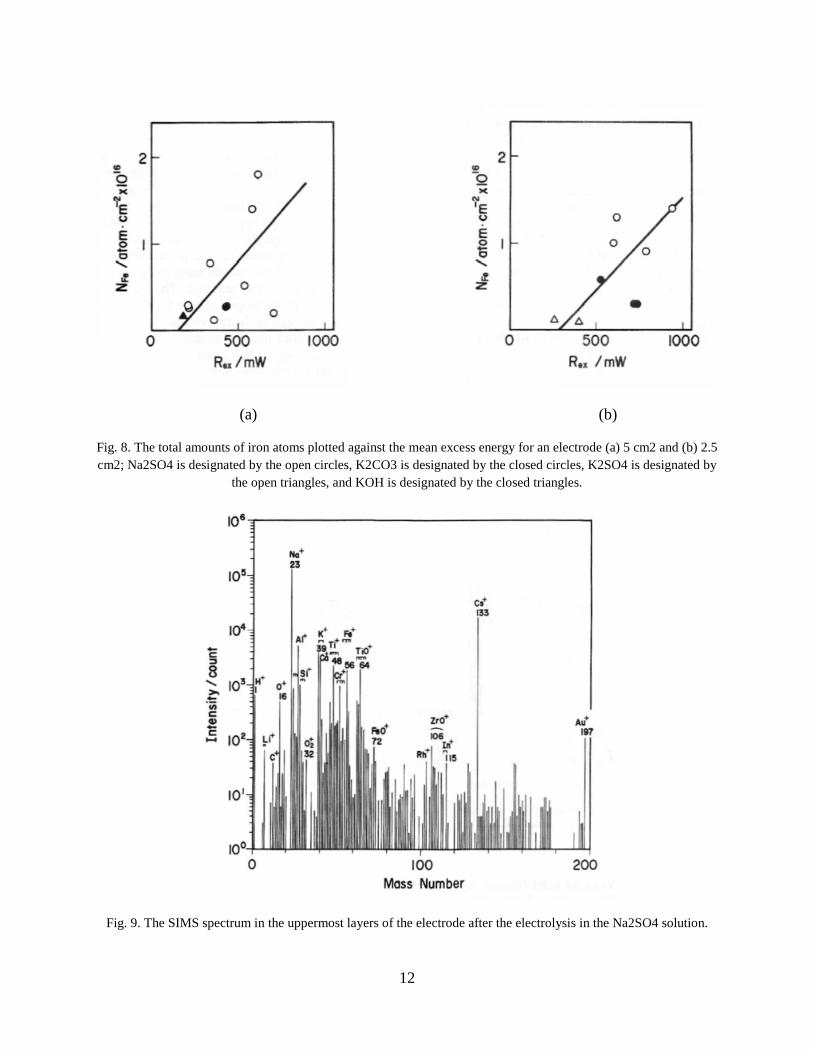
Figure 8 shows the relationship between the total amount of iron atoms and the mean Rex
obtained in every electrode/electrolyte system. Although the data were rather scattered, there
seemed to be a linear relationship between these two parameters. This supports strongly the
notion that iron atom production is related to excess energy evolution.
Isotopic Abundance of Iron Atoms
The SIMS measurement was made with an electrode after the electrolysis in the Na2SO4
solution. Figure 9 shows the SIMS spectra of the particles with mass numbers up to 200 caused
by the first scanning. Figure 9 shows the spectra of Na+, Al+, Si+, K+, Ca+, Ti+, and Cr+, which
could not be detected by the AES measurement, were also observed to some extent other than
those of Fe+. This is probably due to the high sensitivity of SIMS for these elements. The
spectrum of Cs+ is attributed to a trace of cesium that remained in the vacuum chamber itself.
The profile of the isotopic abundance of the iron atoms in the gold electrode is shown in Fig. 10.
The iron atoms detected at the 15th scanning corresponds to those present in ~180 monolayers
from the electrode surface.

11
(a) (b)
Fig. 7. The SEM and EPMA images of the distribution of the iron atoms for the electrode after the electrolysis: (a)
SEM image and (b) EPMA image (wavelength of X ray: 1.937 Å).
The rates of the content of the particles with mass numbers 54, 56, 57, and 58 corresponding to
the iron isotopes obtained from the spectra of the first scan are 6.5, 77.5, 14.5, and 1.5%,
respectively, which is clearly different from the natural isotopic abundance of the iron atoms. In
particular, the difference is remarkable for particles with mass number 57, whose content is ~6.6
times the natural isotopic abundance of 57Fe. The content of the particles with mass number 54 is
also increased to some extent—perhaps because of the mixing of 54Cr. On the other hand, the
content of particles with mass number 56 is decreased by 15.5% from the natural isotopic
abundance of 56Fe. Such a departure becomes significant with the increasing scan number.
Eventually, the content of the particles of mass number 57 after 10 scans (corresponding to >120
layers from the electrode surface) reaches 25%, which is ~11 times the natural isotopic
abundance of 57Fe.
12
(a) (b)
Fig. 8. The total amounts of iron atoms plotted against the mean excess energy for an electrode (a) 5 cm2 and (b) 2.5
cm2; Na2SO4 is designated by the open circles, K2CO3 is designated by the closed circles, K2SO4 is designated by
the open triangles, and KOH is designated by the closed triangles.
Fig. 9. The SIMS spectrum in the uppermost layers of the electrode after the electrolysis in the Na2SO4 solution.

13
Almost the same results are also obtained from the spectra with mass numbers of 70, 72, and
73, corresponding to 54FeO+, 56FeO+, and 57FeO+, respectively, if all the particles with mass
numbers 54, 56, and 57 are iron atoms. The ionic intensity ratios of mass number 57 to mass
number 56 and of mass number 73 to mass number 72 are plotted against the scan numbers in
Fig. 11. Although the plots are scattered, these two ratios can be seen on the whole to be in
agreement. Therefore, the change in the content of the particles with mass numbers 54, 56, and
57 shown in Fig. 8 is not due to FeH+ formation. From this fact, one may safely say that “heavy
iron” was produced and that its production was the result of some nuclear transmutation
occurring by the light water electrolysis.
The possibility of the formation of iron atoms from the impurities of chemical reagents or
cell materials would be negligible because of the following reasons. First, the number of iron
atoms from the reagent should be at most 7 × 10¹⁴ atoms, e.g., in 100 ml of 0.5 M Na2SO4
(Merck Spurapur-grade reagent) solution, because the concentration of iron is clarified to be
<0.01 ppm according to the ICPMS measurement. Second, the number of iron atoms coming
from the electrode materials would be negligible judging from the purity of these materials and
their slight solubilities. Hence, the amount of iron atoms actually formed in a gold electrode by
the electrolysis is at least one to two orders of magnitude larger than the values estimated earlier.
Even if all the iron atoms coming from reagents and electrode materials are accumulated on/in
the gold electrode, they would not have any influence on the AES signals of the iron shown in
Fig. 3. From this point of view, most of the 56Fe atoms, which are still the major isotopic
component, are considered to be the product of nuclear transmutation.
The isotopic content of magnesium, silicon, potassium, calcium, titanium, chromium, and
iron obtained from the spectra of the first, second, and third scans are listed in Table III together
with the natural isotopic abundances and ionic intensities. As one can see, the isotopic contents
of the elements other than iron are in agreement with these natural isotopic abundances within
the limits of error. Therefore, these elements can be regarded as the impurities accumulated from
the electrolyte solution.

14
Fig. 10. The profile of the isotopic abundance of the iron atoms produced against the scan number of SIMS; for the
solid lines, the rate of the content of the particles of mass numbers 56, 57, and 54 are designated by open circles,
closed circles, and open squares, respectively, and for the dashed line, the natural isotopic abundance levels of 56Fe,57Fe, and 54Fe are designated by (1), (2), and (3), respectively.
Fig. 11. The signal intensity ratios of mass number 57 to mass number 56 (open circles) and of mass number 73 to
mass number 72 (closed circles).

15
TABLE IIIIsotopic Content of Several Elements by SIMS Analysis
ElementMass
Number
SignalIntensitya
(count)
Atomic Content (%) Scan Number NaturalIsotopic
Abundance(%)1 2 3
Magnesium 24 854 77.1 80.5 80.5 78.70
25 135 12.2 8.9 9.2 10.13
26 119 10.7 10.6 10.3 11.17
Silicon 28 1001 90.8 89.4 89.3 92.21
29 62 5.6 5.9 5.5 4.68
30 40 3.6 4.7 5.2 3.09
Potassium 39 3720 93.9 92.0 94.1 92.21
41 240 6.1 8.0 5.9 6.88
Calcium 40 2746 94.7 95.5 95.9 96.9742 24 0.8 0.8 0.8 0.64
44 131 4.5 3.7 3.3 2.06
Titanium 46 463 14.4 12.6 10.4 7.9347 203 6.3 7.2 7.0 7.28
48 2173 67.6 69.2 73.1 73.94
49 180 5.6 5.3 5.1 5.51
50 197 6.1 5.6 4.4 5.34
Iron 54 163 7.0 4.5 3.6 5.8256 1816 77.4 74.3 73.2 91.66
57 333 14.2 20.1 21.8 2.19
58 33 1.4 b 1.1b 1.4b 0.33
a Data of first scan.b Contains 58Ni.
The transmutation reaction to produce iron atoms remains unknown. Two types of the
transmutation reactions are conceivable. One is a fusion reaction, and the other is a fission
reaction. If the former reaction is accepted, hydrogen atoms would have to be thought of as
starting materials of this reaction. The possibility of a fusion reaction of hydrogen atoms forming
helium atoms and of successive fusion reactions producing carbon atoms or other heavier atoms
would be extremely remote. In addition, as has already been mentioned, we could not find any
elements with an unusual isotopic abundance in elements smaller than the iron present on/in the
gold electrode after the electrolysis. More recently, we found considerable amounts of platinum
and osmium with unusual isotopic abundances produced on/in the gold cathode electrolyzed with
higher current densities.8 This fact suggests that iron atoms are produced by some nuclear fission
via platinum and osmium production starting from gold. To discuss this problem in detail, one
must identify the intermediate elements participating in the iron production and assay these
amounts.

16
REFERENCES
1. R. T. BUSH and R. D. EAGLETON, “Experiments Supporting the Transmission
Resonance Model for Cold Fusion in Light Water: I. Correlation of Isotopic and
Elemental Evidence with Excess Heat,” Proc. 3rd Int. Conf. Cold Fusion, Nagoya,
Japan, 1992, p. 405, Universal Academy Press.
2. R. T. BUSH, “A Light Water Excess Heat Reaction Suggests that ‘Cold Fusion’ May
Be ‘Alkali-Hydrogen’ Fusion,” Fusion Technol., 22, 301 (1992).
3. T. OHMORI and M. ENYO, “Excess Heat Produced During Electrolysis of H2O on
Ni, Au, Ag and Sn Electrodes in Alkaline Media,” Proc. 3rd Int. Conf. Cold Fusion,
Nagoya, Japan, 1992, p. 427, Universal Academy Press.
4. T. OHMORI and M. ENYO, “Excess Heat Evolution During Electrolysis of H2O
with Nickel, Gold, Silver, and Tin Cathodes,” Fusion Technol., 24, 293 (1993).
5. T. OHMORI, “Measurement of the Potential of Zero Charge on Nickel Electrode by
the Galvanostatic Transient Method,” J. Electroanal. Chem., 157, 159 (1983).
6. A. TAKEUCHI, K. TANAKA, I. TOYOSHIMA, and K. MIYAHARA, “Catalysis
and Coordinative Unsaturation of Active Sites on Sulfurated Nickel Catalyst,” J.
Catalysis, 40, 94 (1975).
7. M. KAMINSKY, Atomic and Ionic Impact Phenomena on Metal Surfaces, Springer-
Verlag, Berlin (1965).
8. T. OHMORI, T. MIZUNO, and M. ENYO, “Production of Heavy Metal Elements
and the Anomalous Surface Structure of the Electrode During the Light Water
Electrolysis on Au Electrode,” Proc. 6th Int. Conf. Cold Fusion, Toya, Japan, 1996,
Universal Academy Press (to be published).
Tadayoshi Ohmori (BS, chemistry, Hokkaido University, Japan, 1962; Dr.,
electrochemistry, Hokkaido University, Japan, 1988) is currently a research associate at
the Catalysis Research Center of Hokkaido University. His current research interests are
interfacial energy conversion and fuel cells.
Michio Enyo (BS, chemistry, Hokkaido University, Japan, 1953; PhD,
electrochemistry, University of Pennsylvania, 1961) is currently president of the Ha-
kodate National College of Technology. His current research interests are interfacial
energy conversion and hydrogen electrosorption in metal.
Tadahiko Mizuno (BS, 1968; Msci, 1970; and Dr, 1973, applied physics, Hokkaido
University, Japan) is currently a research associate of the faculty of engineering at
Hokkaido University. His current research interests are hydrogen storage materials and
localized corrosion.

17
Yoshinobu Nodasaka (BS, biology, Hokkaido University, Japan, 1969) is currently a
member of the technical staff at the School of Dentistry of Hokkaido University. His
current research interest is the ultrastructure of materials.
Hideki Minagawa (BS, 1983; Msci, 1985; and Dr, 1988, nuclear technology,
Hokkaido University, Japan) is currently a senior researcher at the Hokkaido National
Industrial Research Institute. His current research interest is crystal production under
microgravity conditions.