the bridge from earthquake geology to earthquake seismologythe bridge from earthquake geology to...
TRANSCRIPT
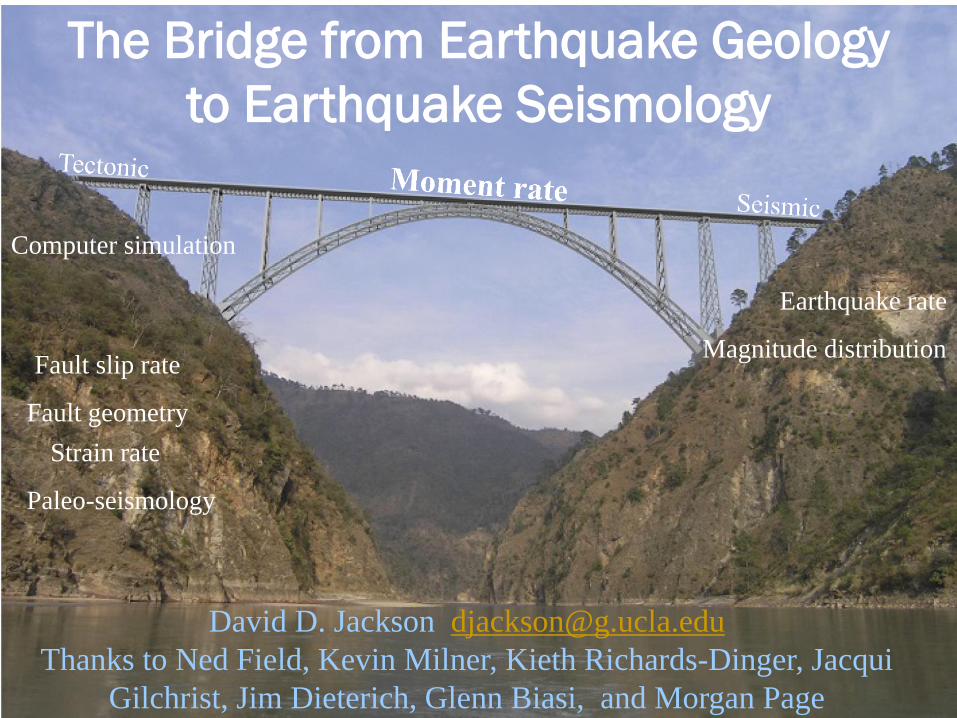
The Bridge from Earthquake Geology
to Earthquake Seismology
David D. Jackson [email protected]
Thanks to Ned Field, Kevin Milner, Kieth Richards-Dinger, Jacqui
Gilchrist, Jim Dieterich, Glenn Biasi, and Morgan Page
Paleo-seismology
Fault slip rate
Fault geometry
Strain rate
Earthquake rate
Magnitude distribution
Computer simulation
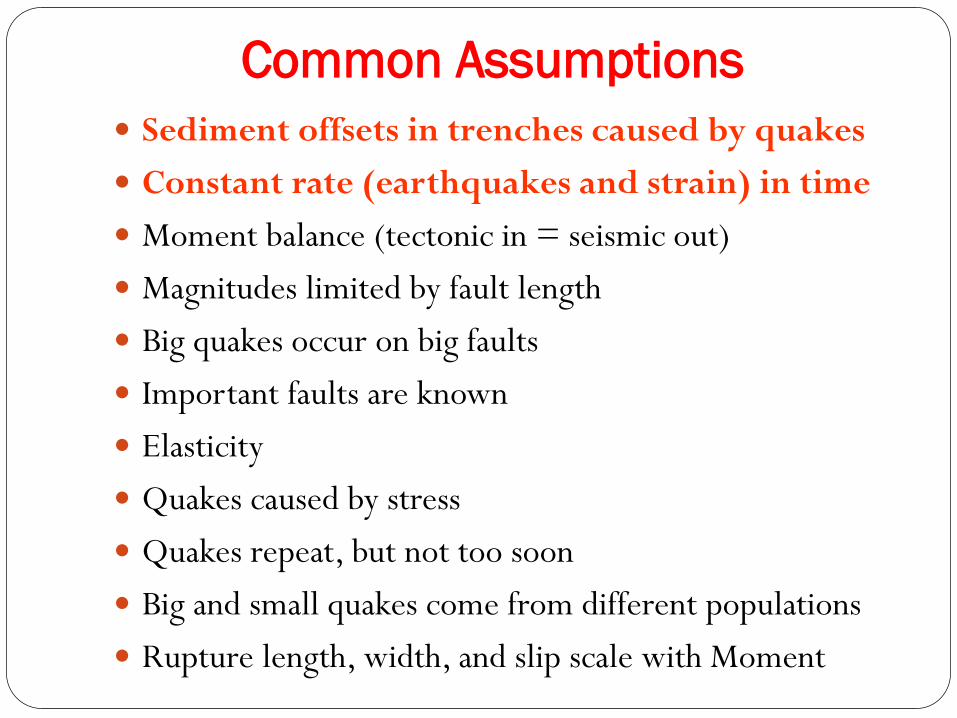
Common Assumptions
Sediment offsets in trenches caused by quakes
Constant rate (earthquakes and strain) in time
Moment balance (tectonic in = seismic out)
Magnitudes limited by fault length
Big quakes occur on big faults
Important faults are known
Elasticity
Quakes caused by stress
Quakes repeat, but not too soon
Big and small quakes come from different populations
Rupture length, width, and slip scale with Moment
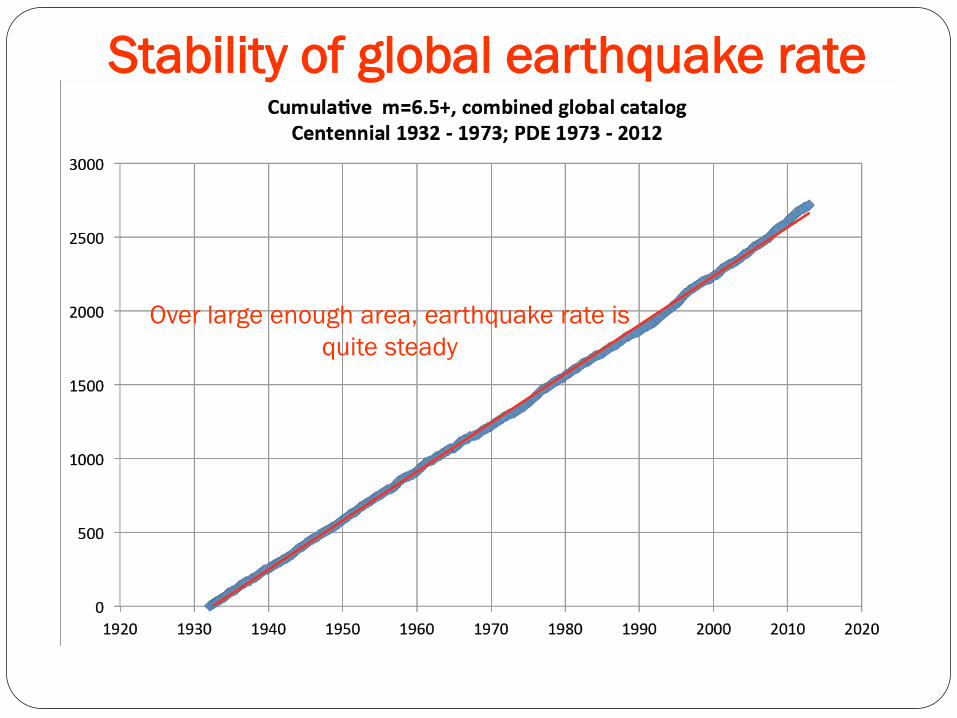
Over large enough area, earthquake rate is
quite steady
Stability of global earthquake rate
0
1
2
3
4
5
6
7
8
9
101901
1904
1907
1910
1913
1916
1919
1922
1925
1928
1931
1934
1937
1940
1943
1946
1949
1952
1955
1958
1961
1964
1967
1970
1973
1976
1979
1982
1985
1988
1991
1994
1997
2000
2003
2006
2009
Cumula
vecount
Date
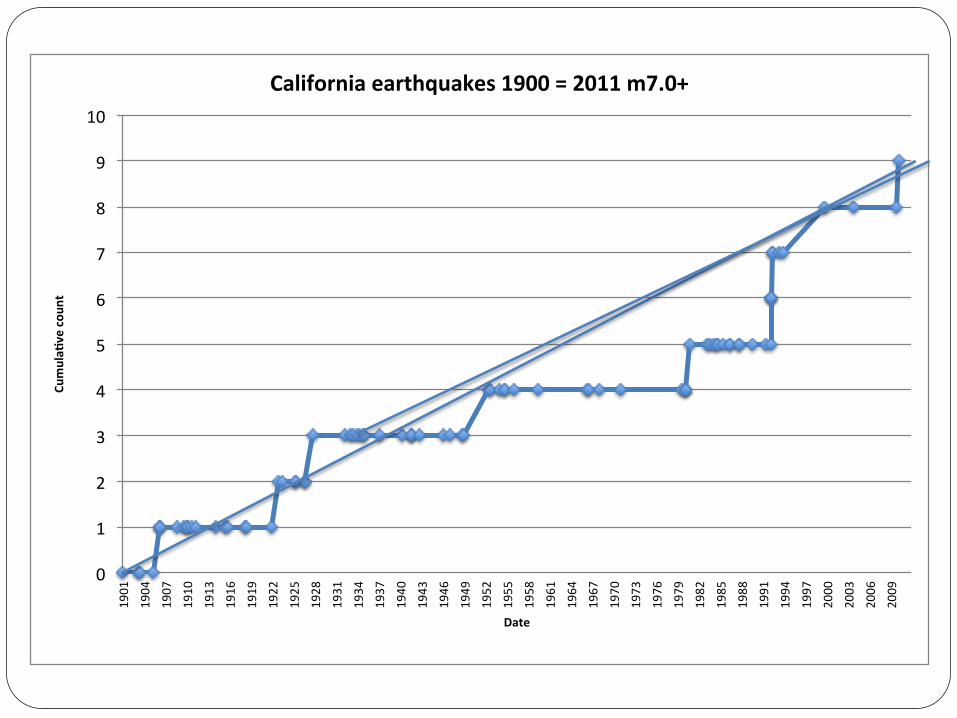
Californiaearthquakes1900=2011m7.0+
Implications of paleo-seismic studies in
California
Paleoseismic data provide the primary support for the
assertion that large earthquake rates were higher before
1900 than after.
Paleoseismic data provide the primary support for the
assertion of quasi-periodic recurrence, that is fairly
regular time intervals between slip events.
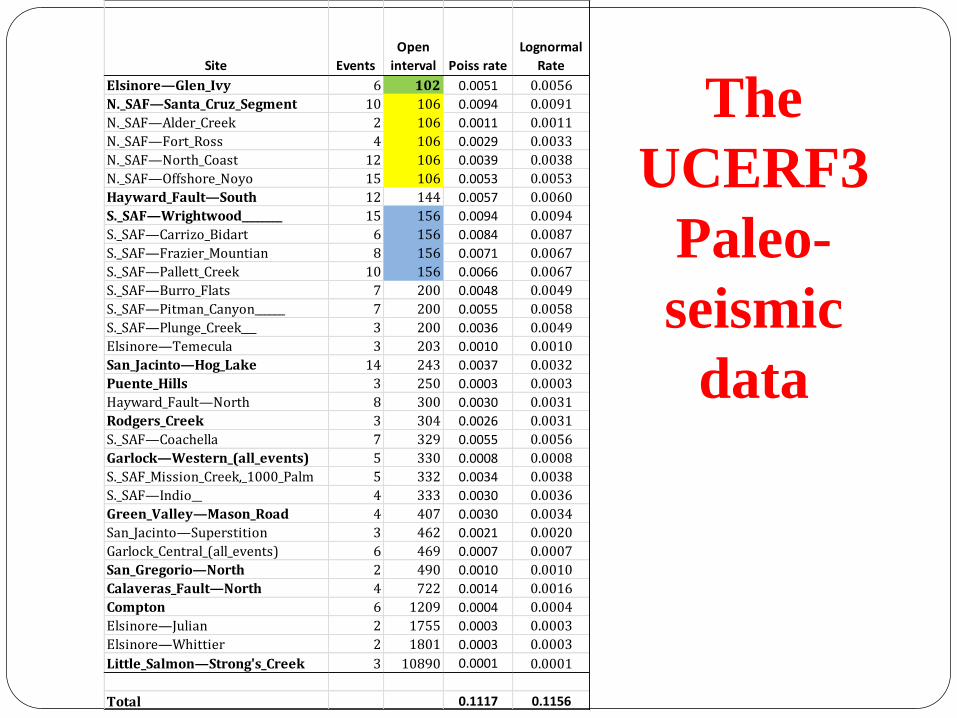
Site Events
Open
interval Poiss rate
Lognormal
Rate
Elsinore—Glen_Ivy 6 102 0.0051 0.0056
N._SAF—Santa_Cruz_Segment 10 106 0.0094 0.0091
N._SAF—Alder_Creek 2 106 0.0011 0.0011
N._SAF—Fort_Ross 4 106 0.0029 0.0033
N._SAF—North_Coast 12 106 0.0039 0.0038
N._SAF—Offshore_Noyo 15 106 0.0053 0.0053
Hayward_Fault—South 12 144 0.0057 0.0060
S._SAF—Wrightwood________ 15 156 0.0094 0.0094
S._SAF—Carrizo_Bidart 6 156 0.0084 0.0087
S._SAF—Frazier_Mountian 8 156 0.0071 0.0067
S._SAF—Pallett_Creek 10 156 0.0066 0.0067
S._SAF—Burro_Flats 7 200 0.0048 0.0049
S._SAF—Pitman_Canyon______ 7 200 0.0055 0.0058
S._SAF—Plunge_Creek___ 3 200 0.0036 0.0049
Elsinore—Temecula 3 203 0.0010 0.0010
San_Jacinto—Hog_Lake 14 243 0.0037 0.0032
Puente_Hills 3 250 0.0003 0.0003
Hayward_Fault—North 8 300 0.0030 0.0031
Rodgers_Creek 3 304 0.0026 0.0031
S._SAF—Coachella 7 329 0.0055 0.0056
Garlock—Western_(all_events) 5 330 0.0008 0.0008
S._SAF_Mission_Creek,_1000_Palm 5 332 0.0034 0.0038
S._SAF—Indio__ 4 333 0.0030 0.0036
Green_Valley—Mason_Road 4 407 0.0030 0.0034
San_Jacinto—Superstition 3 462 0.0021 0.0020
Garlock_Central_(all_events) 6 469 0.0007 0.0007
San_Gregorio—North 2 490 0.0010 0.0010
Calaveras_Fault—North 4 722 0.0014 0.0016
Compton 6 1209 0.0004 0.0004
Elsinore—Julian 2 1755 0.0003 0.0003
Elsinore—Whittier 2 1801 0.0003 0.0003
Little_Salmon—Strong's_Creek 3 10890 0.0001 0.0001
Total 0.1117 0.1156
The
UCERF3
Paleo-
seismic
data
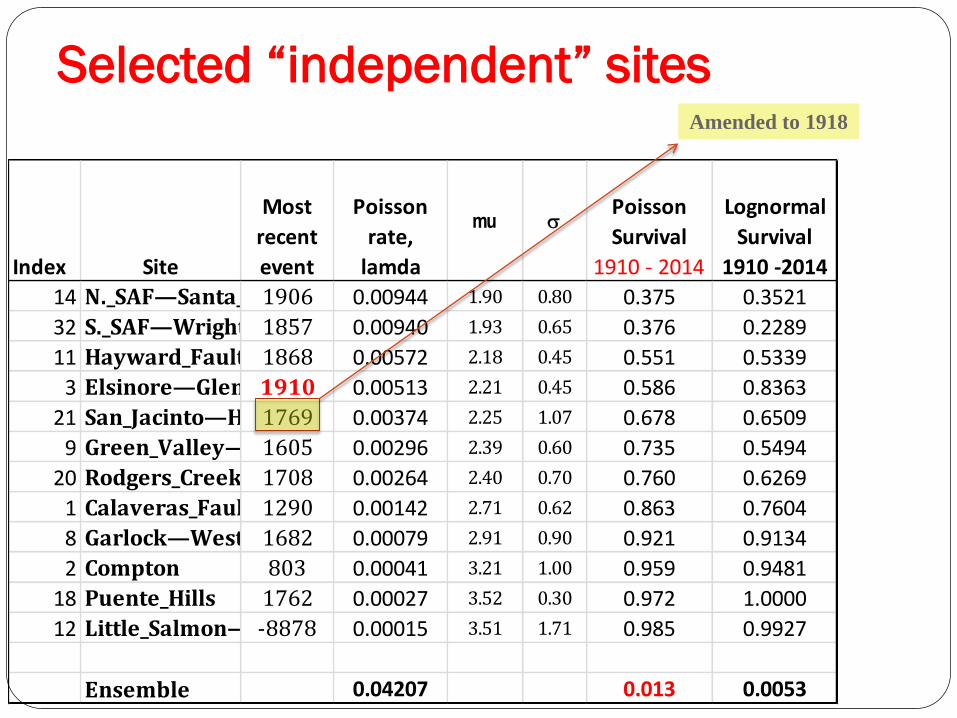
Index Site
Most
recent
event
Poisson
rate,
lamda
mu sPoisson
Survival
1910 - 2014
Lognormal
Survival
1910 -2014
14 N._SAF—Santa_Cruz_Segment1906 0.00944 1.90 0.80 0.375 0.3521
32 S._SAF—Wrightwood________1857 0.00940 1.93 0.65 0.376 0.2289
11 Hayward_Fault—South1868 0.00572 2.18 0.45 0.551 0.5339
3 Elsinore—Glen_Ivy1910 0.00513 2.21 0.45 0.586 0.8363
21 San_Jacinto—Hog_Lake1769 0.00374 2.25 1.07 0.678 0.6509
9 Green_Valley—Mason_Road1605 0.00296 2.39 0.60 0.735 0.5494
20 Rodgers_Creek 1708 0.00264 2.40 0.70 0.760 0.6269
1 Calaveras_Fault—North1290 0.00142 2.71 0.62 0.863 0.7604
8 Garlock—Western_(all_events)1682 0.00079 2.91 0.90 0.921 0.9134
2 Compton 803 0.00041 3.21 1.00 0.959 0.9481
18 Puente_Hills 1762 0.00027 3.52 0.30 0.972 1.0000
12 Little_Salmon—Strong's_Creek-8878 0.00015 3.51 1.71 0.985 0.9927
Ensemble 0.04207 0.013 0.0053
Selected “independent” sites Amended to 1918
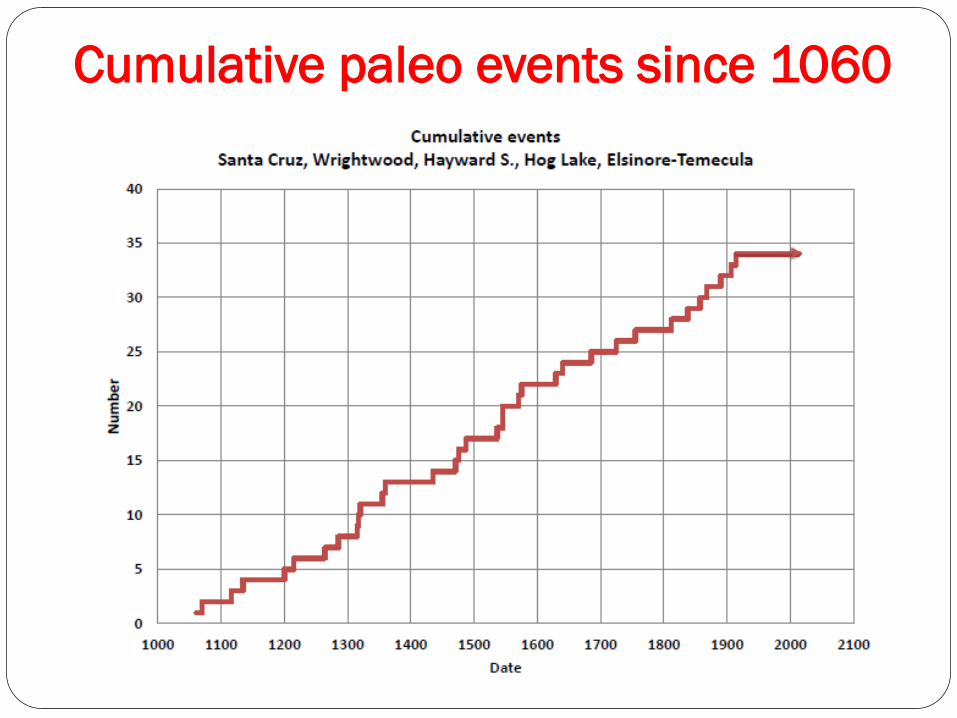
Cumulative paleo events since 1060
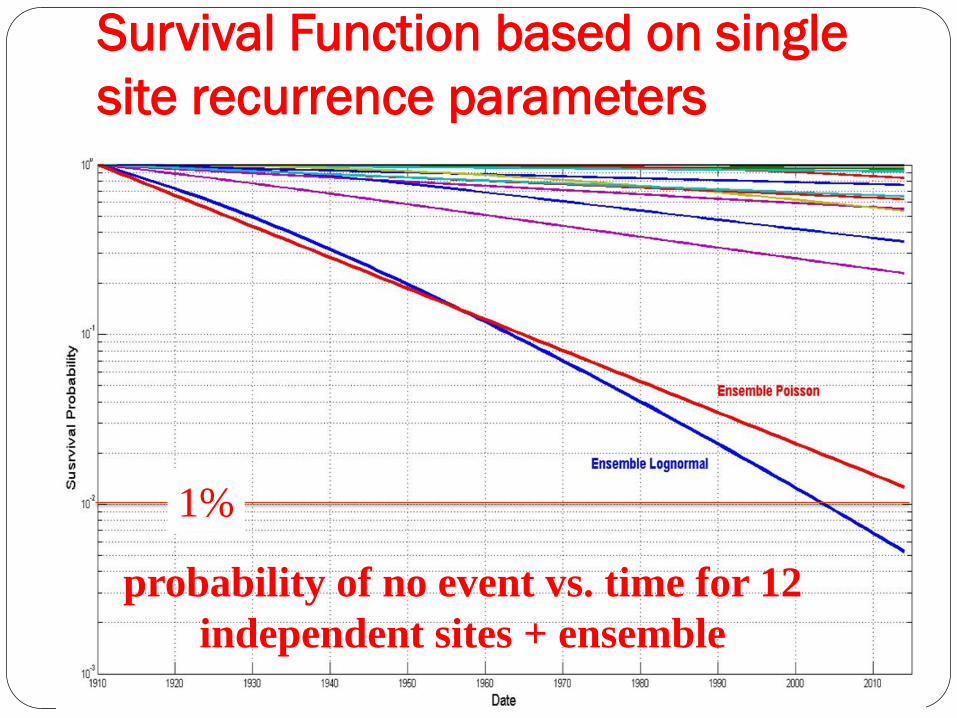
Survival Function based on single
site recurrence parameters
probability of no event vs. time for 12
independent sites + ensemble
1%
Possible explanations
Luck
Physical process that synchronizes faults and produces
occasional long intervals with no paleo-events.
Mis-identification of paleo-events as earthquakes before the
instrumental era, exaggerating the number and rate of
earthquakes that displace sediments at trench sites.
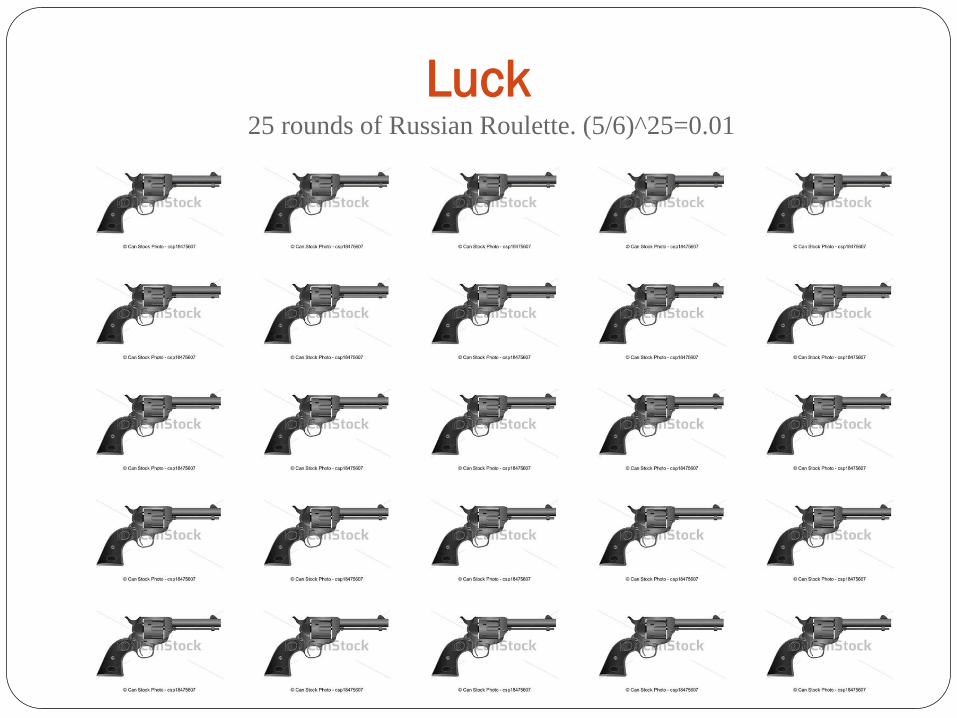
Luck 25 rounds of Russian Roulette. (5/6)^25=0.01
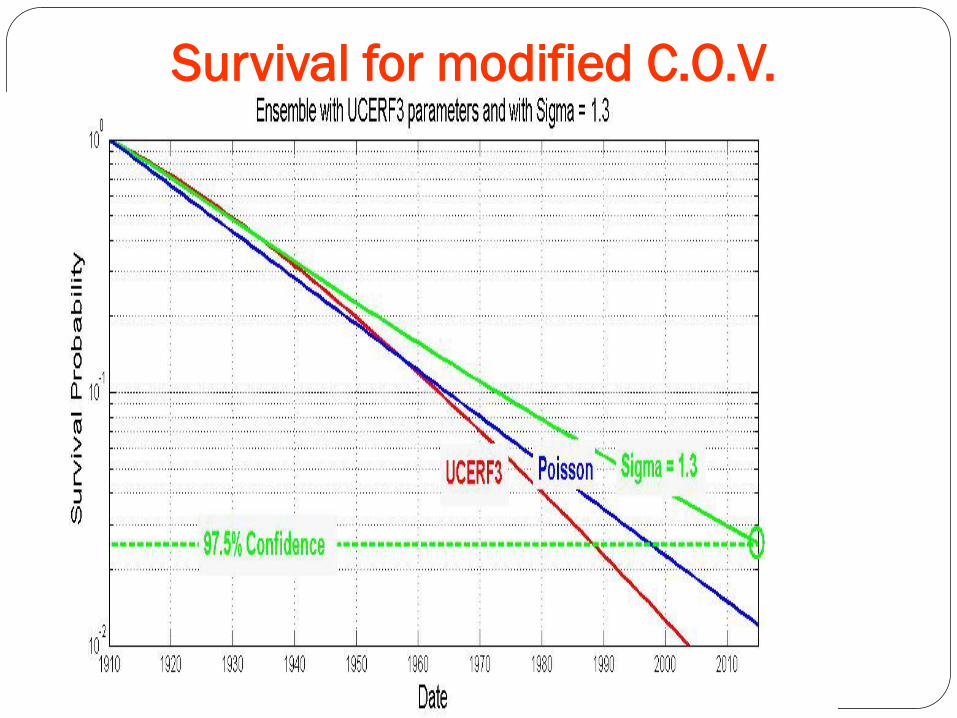
Survival for modified C.O.V.
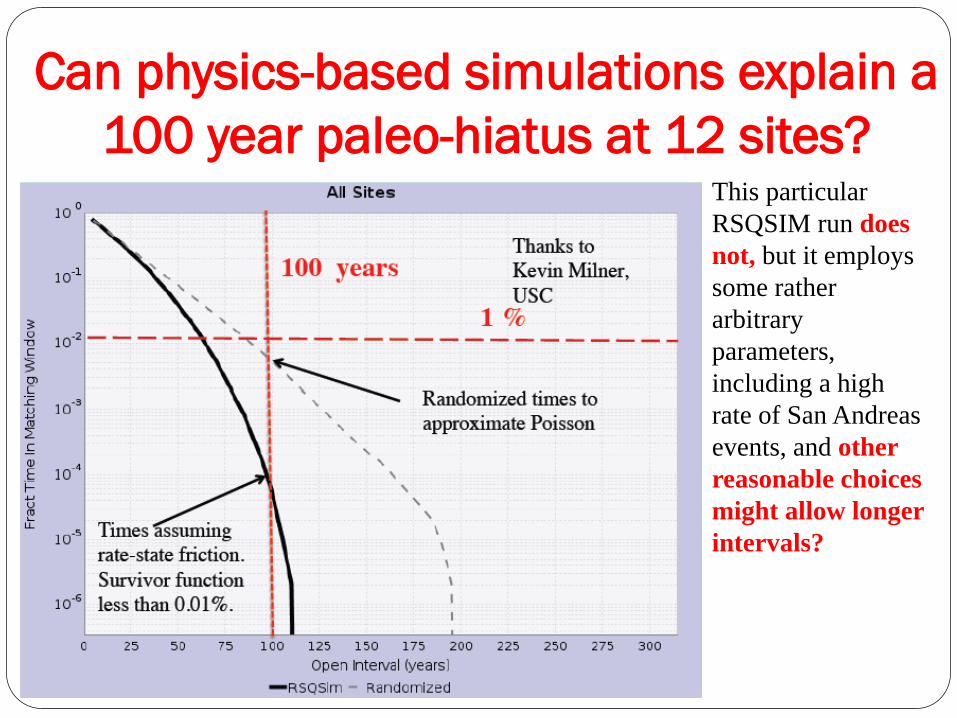
Can physics-based simulations explain a
100 year paleo-hiatus at 12 sites? This particular
RSQSIM run does
not, but it employs
some rather
arbitrary
parameters,
including a high
rate of San Andreas
events, and other
reasonable choices
might allow longer
intervals?
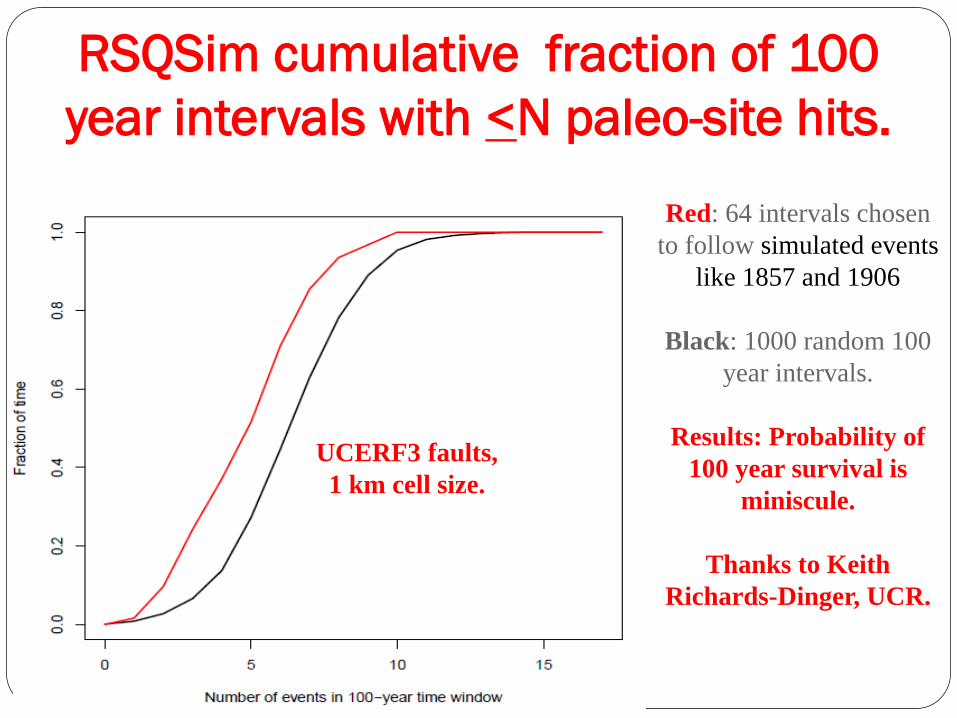
RSQSim cumulative fraction of 100
year intervals with <N paleo-site hits.
Red: 64 intervals chosen
to follow simulated events
like 1857 and 1906
Black: 1000 random 100
year intervals.
Results: Probability of
100 year survival is
miniscule.
Thanks to Keith
Richards-Dinger, UCR.
UCERF3 faults,
1 km cell size.
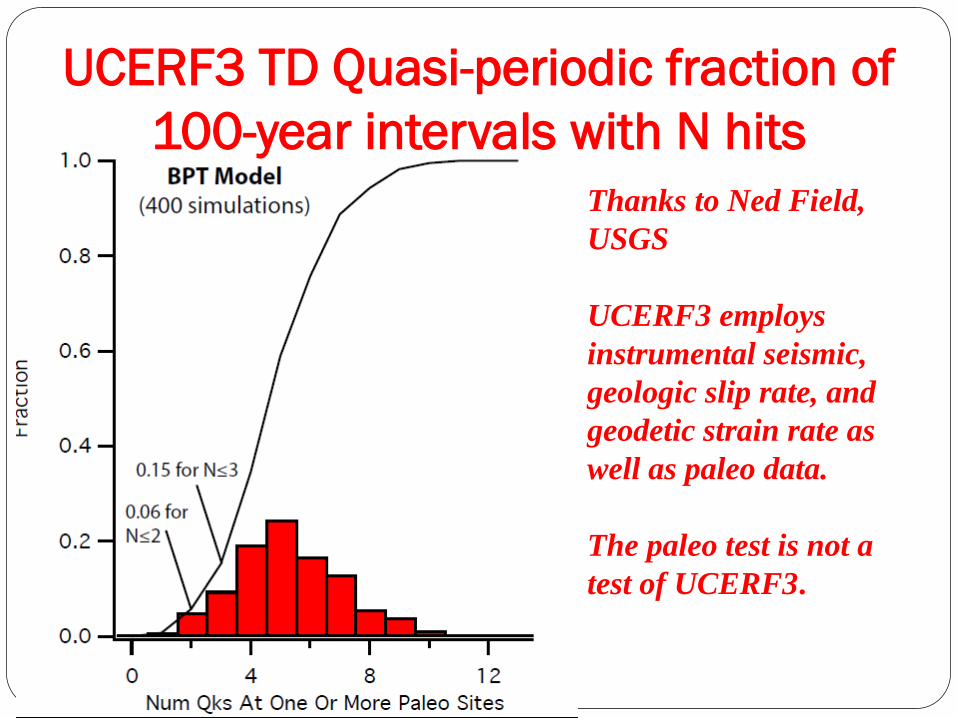
UCERF3 TD Quasi-periodic fraction of
100-year intervals with N hits
Thanks to Ned Field,
USGS
UCERF3 employs
instrumental seismic,
geologic slip rate, and
geodetic strain rate as
well as paleo data.
The paleo test is not a
test of UCERF3.
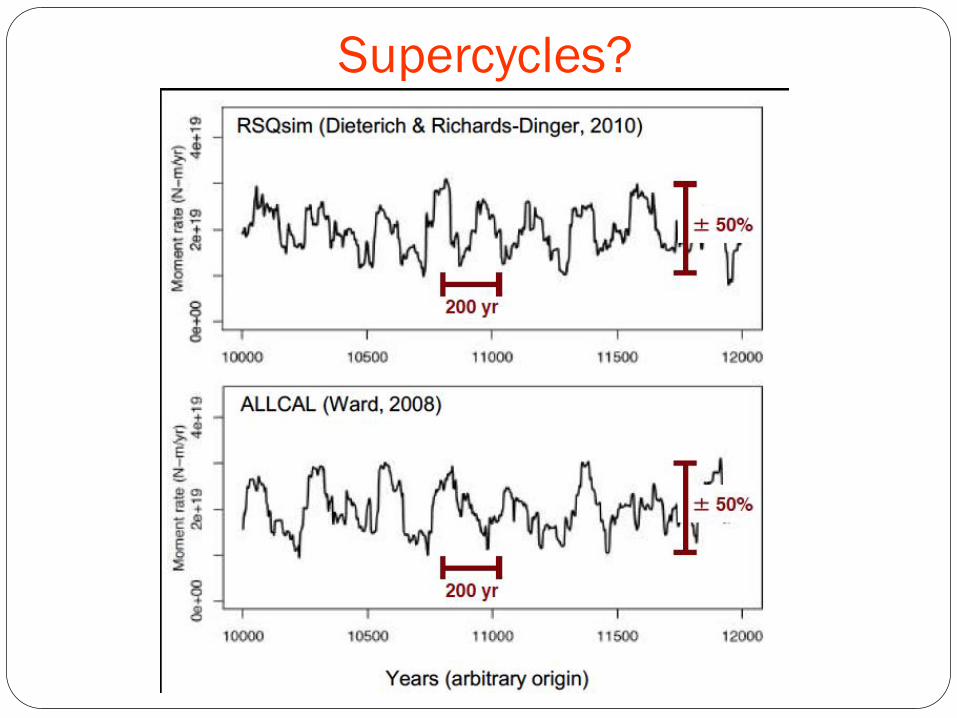
Supercycles?
Supercycles Another word for clustering?
What is cyclic about them?
Can they fit any actual data? e.g, paleo-events?

From Grant and Sieh, J. Geophys. Res., 1994,
Trench wall cross-section, San Andreas Fault in Carrizo Plane
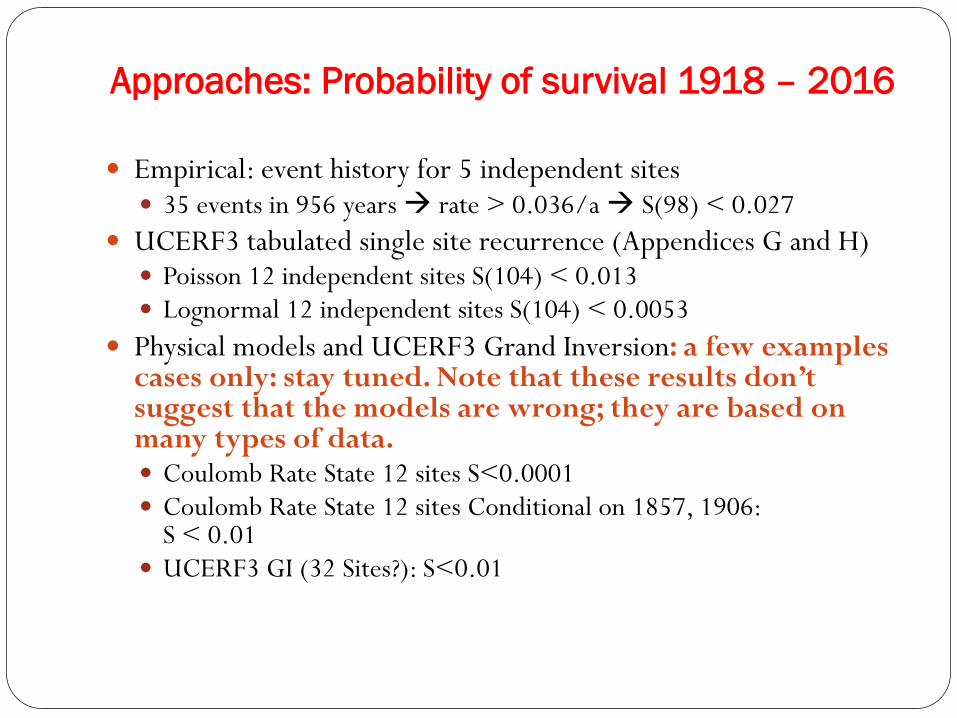
Approaches: Probability of survival 1918 – 2016
Empirical: event history for 5 independent sites 35 events in 956 years rate > 0.036/a S(98) < 0.027
UCERF3 tabulated single site recurrence (Appendices G and H) Poisson 12 independent sites S(104) < 0.013 Lognormal 12 independent sites S(104) < 0.0053
Physical models and UCERF3 Grand Inversion: a few examples cases only: stay tuned. Note that these results don’t suggest that the models are wrong; they are based on many types of data. Coulomb Rate State 12 sites S<0.0001 Coulomb Rate State 12 sites Conditional on 1857, 1906:
S < 0.01 UCERF3 GI (32 Sites?): S<0.01
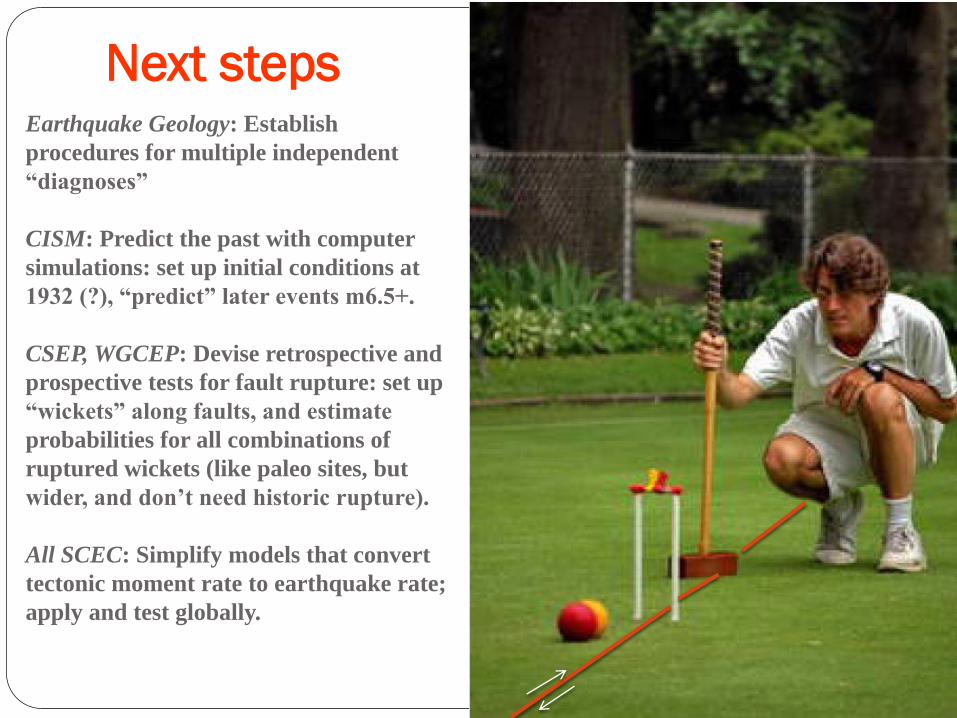
Next steps Earthquake Geology: Establish
procedures for multiple independent
“diagnoses”
CISM: Predict the past with computer
simulations: set up initial conditions at
1932 (?), “predict” later events m6.5+.
CSEP, WGCEP: Devise retrospective and
prospective tests for fault rupture: set up
“wickets” along faults, and estimate
probabilities for all combinations of
ruptured wickets (like paleo sites, but
wider, and don’t need historic rupture).
All SCEC: Simplify models that convert
tectonic moment rate to earthquake rate;
apply and test globally.
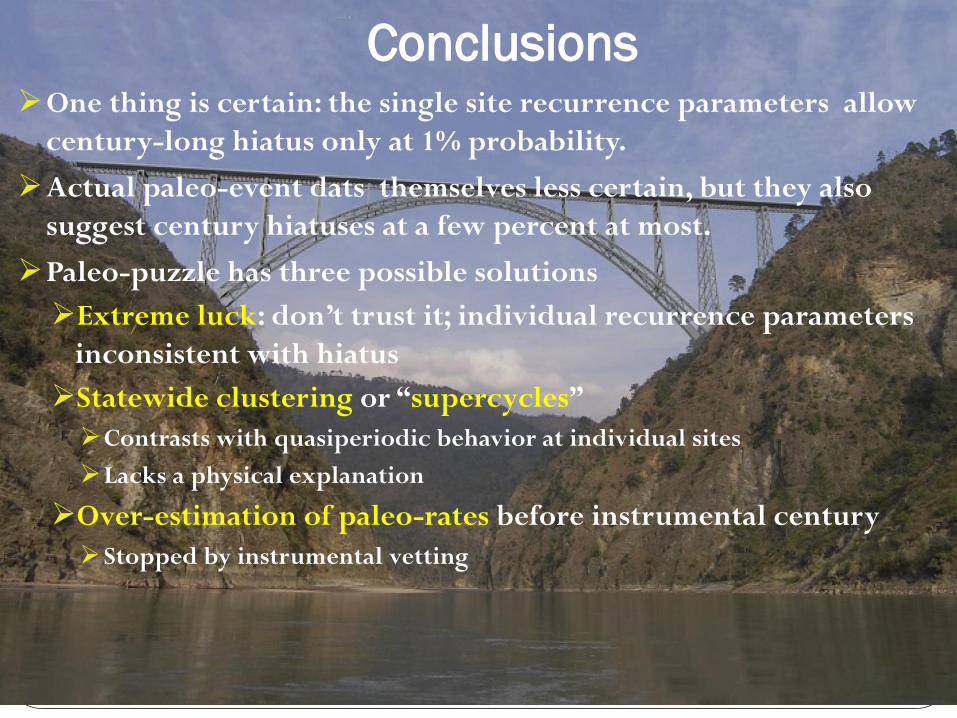
Conclusions One thing is certain: the single site recurrence parameters allow
century-long hiatus only at 1% probability.
Actual paleo-event dats themselves less certain, but they also
suggest century hiatuses at a few percent at most.
Paleo-puzzle has three possible solutions
Extreme luck: don’t trust it; individual recurrence parameters
inconsistent with hiatus
Statewide clustering or “supercycles”
Contrasts with quasiperiodic behavior at individual sites
Lacks a physical explanation
Over-estimation of paleo-rates before instrumental century
Stopped by instrumental vetting