templeton emerging markets investment trust the …€¦ · developed markets emerging markets....
TRANSCRIPT

TEMPLETON EMERGING MARKETS INVESTMENT TRUST
THE CHANGING NATURE OF EMERGING MARKETS
YEARS
EMERGING MARKET PIONEERS
30YOUNG
TEMPLETON EMERGING MARKETS INVESTMENT TRUST

The emerging markets asset class has changed considerably over the last 30 years and the investment opportunity that we invest in on behalf of our clients is currently of a standard we have not seen at any time previously. Yet outdated perceptions about emerging markets still persist and, as a result, we believe that there is a risk that investors may miss out on some of the fastest growing opportunities in the world today.
These are not the emerging markets that the UK first saw in the 1980s and 1990s when the story was very much about producing cheaply and selling abroad. And there are a number of key reasons for the changes we have witnessed over the last 30 years.
The first of these is down to policymakers, who have deliberately changed economic policy to make these economies much more resilient during times of stress. The second driver of change is the nature of economic activity in these markets. These economies have changed materially to be much more driven by consumption and technology. The third, and perhaps most tantalising reason, is that many emerging market companies are not necessarily following the traditional development path set by their cousins in developed markets – often leapfrogging them through the use of innovation and technology.
The shape of emerging market economies, and the companies that do business there, is being transformed. This is why we believe that now is the perfect time to re-think emerging markets.
For UK investors, searching for investment opportunities will be far from risk-free. In an increasingly volatile and unstable world it pays to know which risks are worth taking and which risks should be avoided. Helping investors to navigate around emerging market risks is what Templeton Emerging Markets Investment Trust (TEMIT) has been doing throughout the past three decades. We are delighted to be celebrating TEMIT’s 30th anniversary. We reach this significant milestone at a time when possessing a good understanding of
emerging market opportunities has never been more important.With a turbulent domestic environment, the differences that exist between emerging market countries and the evolving nature of these economies mean that navigating the investment opportunities can be complex. With many years of investment experience in emerging markets, we have helped our investors to prosper through economic highs and lows. We attribute this to the depth of independent company research and local knowledge from our on-the-ground resources, overlaid with a global perspective that helps us assess the best relative opportunities around the world.
We believe that the current opportunity within emerging markets is substantial and this is borne out in the findings of this report. With many emerging market companies not constrained by legacy infrastructures, in the way many developed market companies are, they are also uniquely placed to maximise these opportunities. While consumer sentiment is always slow to move, it is positive to see perceptions changing – particularly among younger people. Allied to our global reach and local networks, we believe that the quality and thoroughness of our proprietary research, combined with our disciplined approach, offer the potential for strong returns across emerging markets for the next 30 years.
FOREWORD
Chetan Sehgal, CFALead Portfolio Manager, TEMIT Senior Managing Director, Franklin Templeton Emerging Markets Equity
Andrew Ness, ASIPPortfolio Manager, TEMIT Portfolio Manager, Franklin Templeton Emerging Markets Equity
The Changing Nature of Emerging Markets | 3

GLOBAL CHANGES OVER THE LAST 30 YEARS
1989The Berlin wall falls
1990
1991
• Hubble telescope launched into space• The World Wide Web is created• Iraq invades Kuwait• Early 1990s Recession
• The EU comes into being with the signing of the Maasctricht Treaty in
the Netherlands
1992
• Operation Desert Storm commences • The 1st apartheid legislation is finally
struck from the books in South Africa• Indian economic crisis
1993• PC technology leaps forward with the
release of the Intel Pentium chip• The World Wide Web goes public • The North American Free Trade
Agreement is passed
1994• US and Russian nuclear missiles are
no longer pointed at each other’s territory
• Economic crisis in Mexico
1995• The WTO is formed• Barings Bank collapses due to
the actions of a single broker• eBay comes into being
1997• Dolly the Sheep is the 1st
cloned complex organism• The Kyoto Protocol is
negotiated in Japan - an environmental agreement meant to combat global warming
• Asian financial crisis
1998• India and Pakistan join the
nuclear superpowers• Google is founded in California• Russian financial crisis
• The Euro currency debuts• The 6 Billionth person
populating the earth was born
1999
• Arrival of the first astronauts to the ISS• 2000 - First draft of human genome
is announced; the finalised version is released three years later
• (1999–2002)- Argentine economic crisis
20002001• AI Qaeda attacks the World Trade
Centre in New York - marking the start of the ‘War on Terror’
• Steve Jobs introduces the 1st iPod• China become a member of the
WTO
2002• The US demands Iraq allow unfettered
access to weapons inspectors• (2000-2002) - Dot-com bubble
2003• The US invades Iraq and topples
Saddam Hussein• The Human Genome project is
completed• Rose Revolution in Ukraine
2004• Enlargement of NATO and the EU to include
most of the former Eastern Bloc• Facebook created by Mark Zuckerberg
2005• The Kyoto
Protocol comes into effect
2006• Twitter is launched• Execution of Saddam Hussein
2007• Spike in food prices and subprime crisis
help trigger global recession• Introduction of the iphone• Scientists discover how to use human
skin cells to create embryonic stem cells• Netflix introduces online streaming to
personal computers
2008
2009
• Stock markets plunge around the world • Barack Obama elected as US president
• Large Hadron Colider is completed• Start of Spanish financial crisis
• Google’s self-driving car project starts
• Bitcoin is launched• Election protests in Iran• Great recession officially ends• Treaty of Lisbon is ratified
2010• Threat of Greece defaulting on
its debts triggers the European Sovereign Debt crisis
• Moscow Metro bombings• The iPad is introduced
2011• 9.0 earthquake in Japan triggers the
meltdown of the Fukushima Nuclear Power Plant
2012• The Higgs Boson is discovered
• US Rover Curiosity takes a selfie on Mars
2013• Second Sight gets approval in to start
marketing it’s Bionic Eye
• ISIS begins its offensive in northern Iraq• The Rosetta spacecraft Philae probe
becomes the 1st to land on a comet• 2014-2017 - Brazilian economic crisis
2014
2015• 5 former Soviet countries form the
Eurasian Economic Union• Heads of China and Taiwan meet for the
1st time• Chinese stock market crash
• US and Cuba resume diplomatic relations
2016• US lifts sanctions on Iran in recognition
of dismantling its nuclear program• The UK votes to leave the EU • Donald Trump is elected US presisdent
2017• Tensions rise as North Korea tests a
hydrogen bomb
2018• The 1st genetically modified human is
reported in China• Macedonia and Greece reach historic
agreement seeing the former renamed as the Republic of North Macedonia
• 1st summit between the US and Norh Korea• Turkish currency and debt crisis
2019• President Trump announces the US
will leave the Intermediate Range Nuclear Forces Treaty of 1987. Russia follows suit the next day
• Amazon rainforest fires reinforce climate change fears
• Argentina imposes currency controls as debt crisis deepens
4 | Franklin Templeton The Changing Nature of Emerging Markets | 5
19861986 to 1995 - Savings and loan crisis in the US

KEY FINDINGS – TIME TO RE-THINK EMERGING MARKETS
1. Since 2001 we have witnessed a significant increase in the trade value of “high-tech” goods being exported by emerging market countries. This includes a range of sectors including aircraft and spacecraft, automotive, electrical production and equipment, computing and data storage and optical, medical tech equipment. We expect continued growth in these types of exports at a compound annual growth rate of 16% for the years 2017-2023.
2. The UK’s exposure to “high-tech” products coming from emerging markets has seen similarly rapid growth over this same timeframe and we can expect this to continue over the coming years. Increasingly, the technology we carry with us in our smartphones, tablets and laptops is being produced in emerging markets.
Domestic Investments
Developed Markets
Emerging Markets
Global Exposure58
18
10
143. But, partly because UK consumers often hold outdated views of emerging markets and the products and services that they export, investment opportunities are being missed. On average, only a small 10% of investor portfolios are explicitly in emerging markets. With over three quarters (76%) in developed markets specifically (and of this 58% specifically in the domestic market) UK investors are far more exposed to such risks than they may realise.
4. In some ways, emerging market weaknesses have also become their strength. Unhindered by sunk costs in legacy technology systems or infrastructure, they have had ample room to devise creative solutions for some of their biggest challenges in a way that is perhaps not possible in developed markets. As such, several emerging market countries have overtaken the US and Japan in terms of patent applications.
5. World Bank’s Ease of Doing Business rankings data demonstrates that there is relatively little separating the UK (ranked 9th globally) and many emerging or frontier markets. For example, while Mauritius ranks in 20th, we can see that the difference in score that this represents is negligible. A quarter of the top 20 economies are from emerging markets – with South Korea placed within the top five.
1990 1995 2000 2005 2010 20150
2016
200000
400000
600000
800000
1000000
1200000
1400000
1600000
China S.Korea
India Russia
Brazil US
Canada Germany
UK
Italy
6. Emerging market countries are playing an integral role in the generation of renewable energy. Renewable electricity generation is being dominated by China – which produces more than 2.5 times the amount of renewable power that the US produces. Furthermore, Brazil, India and Russia are all generating far higher amounts of renewable electricity than the UK, Germany and Italy.
59%
... of UK consumers agree that global technology and innovation
is increasingly happening in emerging markets
53%
... of UK consumers agree there has been an increase in firms with significant potential for growth in emerging markets
48%
... of UK consumers agree that emerging markets are becoming
less of an unknown entity
33%
... of UK consumers agree that they are increasingly interacting
with goods & services coming from emerging markets on a
daily basis
7. Consumer sentiment does, though, seem to be changing. Of the UK consumers who we surveyed, nearly three in five (59%) agreed that innovations in global technology are increasingly happening in emerging markets. Furthermore, over half agreed that there had been an increase in firms with a significant potential for growth (53%) and just under half agreed that emerging markets are becoming less of an unknown entity (48%).
4.5
4.0
3.5
3.0
2.5
2.0
1.5
1.0
0.5
1992
1993
1994
1995
1996
1997
1998
1999
2000
2001
2002
2003
2004
2005
2006
2007
2008
2009
2010
2011
2012
2013
2014
2015
2016
2017
2018
2019
2020
2021
2022
2023
Predicted Growth
0
1992
1993
1994
1995
1996
1997
1998
1999
2000
2001
2002
2003
2004
2005
2006
2007
2008
2009
2010
2011
2012
2013
2014
2015
2016
2017
2018
2019
2020
2021
2022
2023
80
70
60
50
40
30
20
10
0
Predicted Growth
($TRILLION US) VALUE OF GLOBAL HIGH-TECH EXPORTS COMING FROM EMERGING MARKETS
($US BILLION) VALUE OF UK IMPORTS OF HIGH-TECH EXPORTS FROM EMERGING
MARKETS
GEOGRAPHIC ASSET ALLOCATION OF UK INVESTORS
NUMBER OF INTELLECTUAL PROPERTY PATENT APPLICATIONS 1997 – 2017
TOP 20 EASE OF DOING BUSINESS ECONOMY SCORES – 2019
ELECTRICITY GENERATION FROM RENEWABLES OVER TIME IN GWH
% OF UK CONSUMERS AGREEING THAT…
New
Zea
land
Sing
apor
e
Den
mar
k
Hon
g Ko
ng S
AR, C
hina
Kor
ea, R
EP
Geo
rgia
Nor
way
Uni
ted
Stat
es
Uni
ted
King
dom
Mac
edon
ia, F
YR
Uni
ted
Ara
b Em
irate
s
Swed
en
Taiw
an, C
hina
Lith
uani
a
Mal
aysi
a
Esto
nia
Finl
and
Aust
ralia
Lativ
a
Mau
ritiu
s
86.5
9
85.2
4
84.6
4
84.2
2
84.1
4
83.3
8
82.9
5
82.7
5
82.6
5
81.5
5
81.2
8
81.2
7
80.9
80.8
3
80.6
80.5
80.3
5
80.1
3
79.5
9
79.5
8
Emerging Markets United States Japan
1997 1999 2001 2003 2005 2007 2009 2011 2013 2015 2017
0
200,000
400,000
600,000
800,000
1,000,000
1,200,000
1,400,000
1,600,000
1,800,000
2,000,000
Source: Coriolis Technologies
Source: Coriolis Technologies
Source: TEMIT Consumer Survey 2019
Source: TEMIT Consumer Survey 2019
Source: WIPO. As of June 2019, Emerging markets-based on the markets in the MSCI Emerging Markets index.
Source: World Bank
Source: International Energy Agency
The Changing Nature of Emerging Markets | 7 6 | Franklin Templeton

1. EMERGING MARKETS – A VARIETY OF MARKETS LEADING TO VERY DIFFERENT OPPORTUNITIES
It was just over thirty years ago that the MSCI Emerging Markets and MSCI All Country World Indexes were launched. They stood out, then, as a mixed collection of commodity exporters and low-cost manufacturers. First impressions tend to last. For investors, this could lead to an under-representation of emerging markets in their portfolios – which can have serious implications. However, the emerging markets of today tell a very different story to that of thirty years ago. Within this section of the report we put some common myths under the microscope to explore, specifically:
■ The role that emerging markets are playing in driving some of the world’s fastest growing industries and how economies have diversified over the last thirty years;
■ The ways in which governance – both at a country and a company level – has changed in emerging markets over this time;
■ The role that emerging markets companies are playing in terms of global innovation; and
■ The way in which emerging market environmental performance has changed since 1989.
The report contains analysis on countries in the MSCI Emerging Markets Index, but also, in some cases, incorporates a number of wider frontier markets and non-index countries. Please refer to the back of the report for further details.
1. INCREASINGLY DIVERSE: INCREASINGLY HIGH-TECH1
Having a well diversified portfolio is good practice when investing. The same concept applies to countries with regards to their own growth. Back in 1989, the emerging markets roadmap to growth was simple: produce and sell abroad. Countries with large reserves of oil, precious metals or other commodities shipped them to resource-hungry industrialised nations. Others offered large pools of affordable labour to become low-cost manufacturing hubs. This often left the fortunes of these countries vulnerable to the developed markets which they exported to.
What today’s headlines fail to reflect (and, therefore, the public often miss) is that emerging market economies have evolved as they become increasingly developed. In markets such as Egypt, Pakistan, Indonesia and China, domestic revenues far outweigh foreign revenues, a result of rapidly rising domestic consumption. Of course, this is not necessarily the same story across all emerging markets.
FIGURE 1: MSCI EMERGING MARKET DOMESTIC VS.
FOREIGN REVENUE BY COUNTRY (2018)
100%
90%
80%
70%
60%
50%
40%
30%
20%
10%
0%
Egyp
t
Paki
stan
Indo
nesi
a
Chin
a
Thai
land
Czec
h R
epub
lic
Turk
ey
U.A
.E
Phili
ppin
es
Pola
nd
Bra
zil
Gre
ece
Peru
Mal
aysi
a
Indi
a
Qat
ar
Mex
ico
Chile
Colo
mbi
a
Rus
sia
Sout
h Af
rica
Kore
a
Taiw
an
Hun
gary
Domestic (%)
Foreign (%)
FIGURE 2: % SHARE OF GLOBAL HIGH VALUE-ADD EXPORTS2 (1990-2018)
China Germany US Japan South Korea
Source: Franklin Templeton Capital Market Insights Group, MSCI, and FactSet, as of December 2017.
Technological transformation and relative economic and political stability in many emerging markets have driven a sharp rise in the proportion of high value-add exports. Some emerging markets in the 1980s and 1990s produced cheap home appliances and electrical parts (notably China and South Korea). Today, these same economies are taking an increasingly significant stake of global high value-added exports. What was true thirty years ago may no longer apply today.
We can see this growth in technology exports more clearly when we consider the increase in the monetary value of emerging market “high-tech” global exports. Throughout the 1990s we saw only modest growth in “high-tech” exports from emerging markets, before an explosion of growth from 2001. While we might not quite see the levels of growth of the previous 20 years, that upward trajectory should continue.
FIGURE 3: ($TRILLION US) VALUE OF GLOBAL HIGH-TECH EXPORTS COMING FROM
EMERGING MARKETS3
4.5
4.0
3.5
3.0
2.5
2.0
1.5
1.0
0.5
019
9219
9319
9419
9519
9619
9719
9819
9920
0020
0120
0220
0320
0420
0520
0620
0720
0820
0920
1020
1120
1220
1320
1420
1520
1620
1720
1820
1920
2020
2120
2220
23
Predicted Growth
2 Source: Intracen; As of August 2019. High Value Exports includes electrical machinery and equipment and parts thereof; sound recorders and reproducers, television, machinery, mechanical appliances, nuclear reactors, boilers; parts thereof, optical, photographic, cinematographic, measuring, checking, precision, medical or surgical, plastics and articles thereof, vehicles other than railway or tramway rolling stock, and parts and accessories thereof, aircraft, spacecraft,. and parts thereof.3 Please refer to the back of the report for details on the countries included within this analysis
Source: Franklin Templeton Capital Market Insight Group, MSCI, FactSet, as of August 2018.
20%
15%
10%
5%
0%
1990 1992 1994 1996 1998 2000 2002 2004 2006 2008 2010 2012 2014 2016 2018
Source: Coriolis Technologies
1 High-tech refers to a variable created via a combination of the following: aircraft and spacecraft, arms, automotive, clocks and watches, electrical production and equipment, machinery and components (includes computing and data storage) and optical, medical tech equipment, Pharma and photographic plates and film.
8 | Franklin Templeton The Changing Nature of Emerging Markets | 9

FIGURE 4: (%) 2017-2023 PROJECTED COMPOUND ANNUAL GROWTH RATE OF
GLOBAL HIGH-TECH EXPORTS BY COUNTRY4
Czec
h R
epub
lic
Pola
nd
Indi
a
Chin
a
Hun
gary
Mal
aysi
a
Egyp
t
Thai
land
Rep
. of K
orea
Mau
ritiu
s
Iran
Qat
ar
Rus
sian
Fed
erat
ion
Peru
Viet
nam
94.9
3
Om
an53
.82
Kuw
ait
41.8
9
Rom
ania
36.1
4
Mex
ico
29.8
0
Phili
ppin
es29
.72
21.7
3
21.4
9
14.3
8
13.4
9
12.9
6
12.2
4
11.3
4
10.3
6
8.95
Turk
ey25
.66
5.97
4.86
4.65
2.39
1.81
Our analysis suggests significant growth in Vietnam until 2023, though we would urge caution when interpreting these numbers – particularly in light of Samsung’s rapid expansion in that country, inflating recent growth from what was a comparatively low base. However, Mexico, Philippines and Turkey also show strong growth forecasts over the coming years. Mexico, particularly in the technology sector, has developed rapidly over recent years, due to the following factors:
1 - Mexico was the first country in Latin America to pass a law to regulate fintech.
2 - Mexican start-ups received the second highest level of investment in Latin America, after Brazil, in 2017, making Mexico the second biggest player in the region. Most of those deals were in fintech (Konfio), edtech (Yogome), or e-commerce (Cornershop).
3 - Since 2014, the Mexican government has distributed up to US$658M (approximately £539.6M) to over 620,000 entrepreneurs to try to jumpstart the entrepreneurial ecosystem. According to Instituto Nacional del Emprendedor (INADEM) data, 6,000 companies and 73,000 jobs have been created as a result of these efforts.
Our forecasting shows that other, arguably more high-profile emerging markets are also set to grow their “high-tech” exports. India (14.38%), China (13.49%) and South Korea (8.95%) all look set to deliver growth in this area.
South Korea is an interesting example. A notable market for innovation, with considerable focus on the Internet of Things, there is increasingly a focus on the application of technology to cater to the needs of Korean citizens.
The table opposite provides an overview of the policy agenda driving innovation in India, China and South Korea.
India identified innovation as a priority. Its national strategy “Decade of Innovations 2010-20” committed to strengthening science, technology and innovation capacities, with an objective to increase gross expenditure on R&D to 2% of GDP by 2020. The commitment to innovation was reflected in India’s “Make in India” initiative, which aimed to strengthen manufacturing.
Infosys Limited is an Indian multinational corporation that provides business consulting, information technology and outsourcing services. It has its headquarters in Bangalore, Karnataka, India. Infosys provides software development, maintenance and independent validation services to companies in finance, insurance, manufacturing and other domains – including 177 of the Fortune 500 companies. In 2016 it crossed the US$10bn (approximately £8.2bn) revenue threshold.
The Chinese government’s strategy has most recently been laid out in the “13th Five-Year Plan for Science and Technology” and the “Made in China 2025 Strategy”. The aim of “Made in China 2025” is to turn the country into a global leader in manufacturing of high-tech industries such as automotive, aviation, robotics, medical devices and information technology. The Chinese government aims to improve the competitiveness of its enterprises on domestic markets and fuel global expansion.
Sunny Optical Technology (Group) Company Limited is an investment holding company principally engaged in the design, research and development, manufacture and sale of optical and optical related products and scientific instruments. The company operates its business through three segments: optical components, optoelectronic products and optical instruments. Through its subsidiaries, the company is also engaged in the research and development of infrared technologies. The company distributes its products in the domestic market and to overseas markets.
Since the election of the Moon Jae-in administration in May 2017, South Korea has laid out plans toward a different approach to science and technology, the pillars of its economy. While the public may focus on the next Samsung smartphone or the new LG television, Korea's big tech move might not necessarily be a product at all.
Now called a "people-centred economy," South Korea's government says its strategy consists of three elements: increasing the number of jobs and income, growing innovation, and creating a "fair economy." While the country's investments in technology will continue to focus on major directions led by concepts such as networks of devices connecting to each other and exchanging data – the Internet of Things – big data and 5G, the president stressed the importance of catering to actual citizen needs.
LG Corporation is a South Korean multinationalconglomerate corporation. It is the fourth-largestchaebol in South Korea.
LG makes electronics, chemicals, and telecom products and operates subsidiaries such as LG Electronics, Zenith, LG Display, LG Uplus, LG Innotek and LG Chem in over 80 countries.
LG Electronics remains the world’s second largest LCD television manufacturer. The company has 128 operations worldwide and employs 83,000 people.
The company continues to push the boundaries of innovation. In 2016, exclusively in India, the Indian arm of South Korea’s LG Electronics Inc started selling a TV that would repel mosquitoes. The technology was also used in air conditioners and washing machines. The TV is aimed for lower-income consumers living in conditions that would make them susceptible to mosquitoes.
INDIA
CHINA
SOUTH KOREA
MARKET POLICY BACKGROUND NOTABLE COMPANIES INCLUDE
Source: Coriolis Technologies
HOW IMPROVING POLICIES IN EMERGING MARKETS ARE CREATING ATTRACTIVE INVESTMENT OPPORTUNITIES
4 Please refer to the back of the report for details on the countries included within this analysis
The Changing Nature of Emerging Markets | 11 10 | Franklin Templeton

TEMIT – SUPPORTING INNOVATION IN EMERGING MARKETS CASE STUDY #1
Naver is the leading search engine in Korea and was an attractive proposition for TEMIT for a number of reasons.
By establishing itself as an early pioneer in the use of user-generated content, the company demonstrated that it had been (and could again be) nimble and early to adapt to the changing online advertisement dynamics.
It also demonstrates strength, by integrating search with commerce and content in order to maintain its market leadership position. Because of this, Naver now handles 20% of all e-commerce traffic in Korea.
The business has also shown an aptitude for innovation by moving into, among other areas, streaming, broadcast television and AI and has also moved into wider markets. Naver is now also one of the leading payment companies in Korea (Naver Pay) and Japan (Line Pay).
Indeed, Forbes ranked Naver 9th on their most innovative companies list in 2018.
NAME OF BUSINESS Naver Corporation
COUNTRY South Korea
SECTOR Communication Services
YEAR ESTABLISHED 1999
NATURE OF
BUSINESS
The dominant internet search portal in Korea
The companies and case studies shown herein are used solely for illustrative purposes; the investment may or may not be currently held by any portfolio advised by Franklin Templeton Emerging Markets Equity (aka Templeton Emerging Markets Group). The manager's opinions are intended solely to provide insight into how the manager analyzes securities. The information provided is not a recommendation or individual investment advice for any particular security, strategy, or investment product. and is not an indication of the trading intent of any Franklin Templeton managed portfolio.
The Changing Nature of Emerging Markets | 13 12 | Franklin Templeton

FIGURE 6: ($US BILLION) VALUE OF UK IMPORTS OF HIGH-TECH EXPORTS FROM
EMERGING MARKETS5
POLAND: $6.2bn (approximately £5.0bn)
CZECH REPUBLIC: $5.9bn (approximately £4.7bn)
TURKEY: $4.7bn (approximately £3.7bn)
FIGURE 5: ($) VALUE OF UK IMPORTS OF HIGH-
TECH EXPORTS FROM EMERGING MARKETS –
TOP 4 COUNTRIES (2018)
CHINA: $24.3bn (approximately £19.5bn)
Ultimately, it is hard to support the notion that today’s emerging markets are the ‘stack it high, sell it cheap’ nations of three decades ago. Emerging markets are moving increasingly towards high value-add exports. They also have an increasingly important stake in the global technology sector.
Bringing this commentary back closer to home in the UK, we can see how the value of “high-tech” goods that the UK imports from emerging markets has increased significantly since 1992. There is no doubt that China dominates the other emerging market countries in imports of high tech goods to the UK – accounting for nearly two-fifths of such imports – but the UK is still importing “high-tech” goods from all emerging markets to some degree.
This demonstrates that UK consumers are far more exposed to “high-tech” and value-add products and services coming out of some emerging markets than they perhaps otherwise realise. But as we will see, UK consumer perceptions are slow to change.
2. UK EXPOSURE TO EMERGING MARKET EXPORTS19
92
1993
1994
1995
1996
1997
1998
1999
2000
2001
2002
2003
2004
2005
2006
2007
2008
2009
2010
2011
2012
2013
2014
2015
2016
2017
2018
2019
2020
2021
2022
2023
80
70
60
50
40
30
20
10
0
Predicted Growth
5 Please refer to the back of the report for details on the countries included within this analysis
Source: Coriolis Technologies
Source: Coriolis Technologies
14 | Franklin Templeton The Changing Nature of Emerging Markets | 15

Investing for the future is like anything else in life. It is subject to human biases and value judgements, not all of which are well-informed. Many of these biases are learned opinions, typically passed down by our parents and grandparents, that we go on to adopt as our own. We should always recognise the need to challenge these biases as, while they can serve to protect us if accurate, when inaccurate they can often either do us harm or result in missed opportunities. We would argue that this is particularly the case when it comes to making investment decisions.
Earlier this year we conducted a nationally representative survey of 2,000 UK adults and it laid bare many of the biases that consumers in the country hold towards emerging markets6. The term ‘developed market’ is, by association, something we naturally perceive as better than ‘developing market’ – with the latter something that is striving to achieve the level of the former. Simply as a result of the language we employ, it is perhaps no surprise that UK consumers view “developed” markets positively and “emerging” markets broadly negatively. This impacts on our perceptions of emerging market economies in the following ways:
■ The quality of goods and services that these countries produce; ■ The range and breadth of activity taking place in emerging
market countries; ■ The extent to which these countries can innovate through the
high-growth technologies of the future; ■ The ethical nature of emerging market countries across
environmental and governance factors.
Our research shows that UK consumers take a broad-brush approach to how they think about emerging markets. Typically, this is based on outdated perceptions of the world, which means that investors can sometimes miss some of the nuances on just how rapidly some of these countries are evolving. Some gaps in understanding are, perhaps, not unexpected. For example, it appears that the movement in perception towards high-value and technology focused goods may only exist when considering Asian markets - such as China – a well-advertised export-led economy, with a large international technology brand acting as a focal point. Even in China where there has been much high-profile activity around technology, infrastructure and aerospace over recent years, views remain generally outdated. UK consumers appear to have even less of a clear picture of the products coming from some of the other major emerging market countries – Russia and Brazil in particular. But, as our report highlights, what might have rung true thirty years ago does not necessarily carry the same weight today. Increasingly, the technology we carry with us in our smartphones, tablets and laptops is being produced in emerging markets.
3. ARE UK CONSUMERS MISSING THE POINT? FIGURE 7: TOP 3 ASSOCIATIONS OF UK CONSUMERS WITH PRODUCTS AND SERVICES COMING OUT OF:
FIGURE 8: % OF UK CONSUMERS ASSOCIATING SECTORS WITH EMERGING MARKET COUNTRIES
INDIA
CHINA
BRAZIL
RUSSIA
TAIWAN
Low quality
Cheap
Poorly regulated
Low quality
Cheap
Poorly regulated
Cheap
Poorly regulated
Low quality
Low quality
Cheap
Poorly regulated
Poorly regulated
Unreliable
Unethical
AEROSPACE INFRASTRUCTURE / PROPERTY DEVELOPMENT
RENEWABLE ENERGY AI & ROBOTICSHEALTHCARE / HEALTH & BIO TECH
China
Russia
India
Taiwan
Brazil
KEY
11
9
77 7
12
7
9
7
5
30
1414 13
7
26
15
11
75
19
13
10 9 8
Only a small minority of UK consumers identify leading emerging market economies with technology-intensive industries
6 Please refer to the back of the report for a more detailed description of the survey methodology
Source: TEMIT Consumer Survey 2019 The Changing Nature of Emerging Markets | 17 16 | Franklin Templeton

FIGURE 9: GEOGRAPHIC ASSET ALLOCATION OF UK
INVESTORS
Domestic Investments
Developed Markets
Emerging Markets
Global Exposure
5818
10
14
FALSE PERCEPTIONS ARE LEADING TO UNNECESSARY RISK EXPOSURE IN UK INVESTMENT PORTFOLIOS
The increasingly volatile political situation globally is impacting on markets with greater frequency than ever before – and developed markets are themselves no longer immune. These shifting political winds are putting more and more pressure on investors, who are having to assess where the opportunities and risks lie. Brexit and the increasing polarisation of politics in the UK (and across Europe), Donald Trump’s 2016 presidential win in the US and the emergence of far-right presidential candidates across Europe, have brought the idea of political uncertainty closer to home than ever before. It is becoming harder than ever to predict what will happen anywhere in the world as the old ‘safe havens’ hit troubled waters. Less diversified investment portfolios are more ‘at risk’ as a consequence.
Returning to the subject of our biases, UK consumer attitudes to emerging markets are clearly impacting how and where those investing choose to do so. On average, only a small 10% of investor portfolios are explicitly in emerging markets. With over three quarters (76%) in developed markets specifically (and 58% domestic) UK investors are far more exposed to such risks than they may realise.
Of course, those who are willing to invest amid uncertainty can also benefit. Political risk can create investment opportunities, particularly in light of the inevitable noise coming from investors when it rears its head. Not every piece of negative political news leads to a market setback, and not every market setback is a crisis. Knowing warning signs can help determine if a market fall represents a crisis or a shorter-term setback. In the right circumstances, low valuations resulting from political risk can create opportunities. Ultimately, this is why we place such importance on our portfolio management teams expertise, risk management process and active approach to investments.
Language can lead us in one direction or mislead us in the other. It is perfectly reasonable to assume that emerging or developing countries are budding versions of their developed or emerged cousins. It is also perfectly understandable that people might think that there is only one path for emerging countries to take in order to become developed. This is by no means the case. In the same way that companies moving into a new market early obtain first mover advantage, it is also the case that companies arriving later benefit from having both learned from the mistakes of those coming before and are able to leapfrog previous generations of innovation. We are seeing a similar phenomenon with emerging market countries today.
In some ways, emerging market weaknesses have also become their strength. Unhindered by sunk investments in legacy technology systems or infrastructure, they have had ample room to devise creative solutions for some of their biggest challenges in a way that is perhaps not possible in developed markets.
For example, the pages of many developed market bank annual reports detail the efforts (and associated costs running into billions) associated with digital transformation and addressing legacy issues. As a case in point, prior to its IT overhaul, HSBC held data across more than 70 different IT platforms in multiple jurisdictions resulting in difficulties in assessing business-wide compliance and legal
risks. This resulted in three-quarters of its £5bn spend on digital transformation being spent on addressing legacy issues.
Conversely, some countries in Africa are quickly embracing mobile payment systems without ever building brick-and-mortar bank branches. Elsewhere, today Poland is considered a leader in online banking technology, with one bank there offering features such as 30-second loan approval via mobile phone as well as alerts offering custom advice and discounts based on a user’s behaviour and location. A Turkish bank won a global innovation award in 2017 for its agricultural smartphone app, which helps farmers share data and information and get advice in real time, and even acts as a platform for equipment rentals.
With legacy investments in past technologies, developed markets may find themselves becoming less nimble and responsive to future innovation.
As a result (and as shown in Figure 10), several emerging market countries have seized the lead in innovation and are leapfrogging the West in areas such as e-commerce, digital payments, mobile banking and electronic vehicles. They have also overtaken the US and Japan in terms of patent applications.
FIGURE 10: INTELLECTUAL PROPERTY PATENT APPLICATIONS (1997 – 2018)
4. EMERGING MARKETS LEAPFROGGING ESTABLISHED MODELS
Source: WIPO. As of June 2019, Emerging Markets-based on the markets in the MSCI Emerging Markets index.
1997 1999 2001 2003 2005 2007 2009 2011 2013 2015 20170
200,000
400,000
600,000
800,000
1,000,000
1,200,000
1,400,000
1,600,000
1,800,000
Emerging Markets United States Japan
2,000,000
Source: TEMIT Consumer Survey 2019
The Changing Nature of Emerging Markets | 19 18 | Franklin Templeton

For the end consumer this can result in a much different and improved user experience. A good example of this comes from Chinese financial services group Ping An. Able to approach a consumer problem from a completely fresh perspective they have revolutionised the car insurance claims process by introducing a service allowing drivers to send them photographs of their damaged car via their smartphone. Their AI technology can automatically assess the damage and check records of the customer’s driving history to offer a quote to settle the claim there and then.
E-commerce sales are a further indicator of the drivers of innovation within emerging markets and demonstrate that countries like China and South Korea are not relying solely on overseas trade. Thinking
about China specifically, a convergence of factors, economic, social and technological in nature, created conditions ripe for quick growth. Without the retail infrastructure of many developed nations, a new generation of affluent (and digitally savvy) consumers turned to the internet and their smartphones to fill the void.
Such sales in China and South Korea now dwarf those within the US and Japan. Alibaba Group has emerged as a clear winner in China’s competitive e-commerce industry. The company, which did not exist until 1999, has become one of the world’s largest players and reaped an annual revenue in 2018 of $51.9 billion USD (approximately £42.6bn). Not content with its success at home, it has ventured into regions such as Asia and is shaking up retail models abroad.
FIGURE 11: E-COMMERCE % OF RETAIL SALES (SOURCE: CLSA, NIELSON AND GOLDMAN SACHS
INVESTMENT RESEARCH, AS OF DECEMBER 2018)
2008 2010 2012 2014 2016 2018
0%
5%
10%
15%
20%
25%
China United States South Korea
Source: CLSA, Nielson, and Goldman Sachs Investment Research, as of December 2018.
Ultimately, emerging markets enjoy three distinct advantages for adopting new technological innovations compared with developed economies:
1. They will not have to rip up existing blueprints or decommission existing infrastructure or embedded legacy systems;
2. They have an abundance of young, digitally engaged consumers keen to embrace change, and skilled workers who are capable of delivering that change; and,
3. A willingness at government level to support entrepreneurial efforts. We see examples of this in both India and China – through the Small Industries Development Bank of India Startup Mitra in the former and the $5bn (approximately £4.1bn) fund to support the AI industry set up by the government of Tianjin in the latter. Collaboration between public and private sectors is giving innovative and entrepreneurial businesses room to experiment and grow.
TEMIT – LEAPFROGGING ESTABLISHED MODELS CASE STUDY #2
In recent years the bank has transformed itself from a corporate sector term lending business to a multi-faceted company combining products and services for corporates with granular retail lending through a variety of different channels. All of this being built on the foundation of a solid low cost liability business.
At the same time, an improved risk culture and digital leadership within the business has enhanced the customer experience, ensuring that the organisation is far better prepared for the future than they would otherwise have been.
By adopting this approach and prioritising the quality and longevity of growth over market share, the bank now has a robust business model that should stand it in good stead for the coming years. Key successes in redrawing operating models include:
■ ICICI Bank secured the top spot in the report – ‘The Forrester Banking Wave™: Indian Mobile Apps, Q2 2019’ with a combined score of 77, 13 points ahead of the next highest scoring bank.
■ ICICI Bank was declared as the winner in the ‘Data Centers’ and ‘Analytics’ categories at this year’s Technology Senate Awards. The Bank was also conferred with a special ‘Digital Leadership’ award recognising work done in the domain of Blockchain.
■ ICICI Bank won a total of five awards at the Asian Banking & Finance Retail Banking Awards 2019.
■ ICICI Bank emerged as the winner among Large Banks in the ‘End Users: Companies’ group at the Indian Merchants’ Chamber (IMC) Digital Technology Awards 2018. The Bank won this award for its Insta Banking application.
The companies and case studies shown herein are used solely for illustrative purposes; the investment may or may not be currently held by any portfolio advised by Franklin Templeton Emerging Markets Equity (aka Templeton Emerging Markets Group). The manager's opinions are intended solely to provide insight into how the manager analyzes securities. The information provided is not a recommendation or individual investment advice for any particular security, strategy, or investment product. and is not an indication of the trading intent of any Franklin Templeton managed portfolio.
The Changing Nature of Emerging Markets | 21 20 | Franklin Templeton
NAME OF BUSINESS ICICI Bank
COUNTRY India
SECTOR Financials
YEAR ESTABLISHED 1994
NATURE OF BUSINESS Leading Indian private sector bank

One of the frequent assumptions held by UK consumers is that goods and services from emerging markets are often unethical and poorly regulated – leading to concerns about quality and reliability. This viewpoint might contain an element of truth for some markets, but certainly not all markets. And, as we have outlined, using individual emerging market examples to create a shortcut response for all emerging markets is certainly misleading and potentially dangerous.
This is something we can see clearly when we look at the World Bank’s Ease of Doing Business rankings data. This dataset ranks
economies on their ease of doing business, from 1–190. A high ease of doing business ranking means the regulatory environment is more conducive to the starting and operation of a local firm. The rankings are determined by sorting the aggregate scores on 10 topics7, each consisting of several indicators, giving equal weight to each topic. The rankings for all economies are benchmarked to May 2018. The analysis demonstrates that while Venezuela, Bangladesh and Nigeria all rank within the bottom quartile of economies on these measures, a quarter of the top 20 economies are from the emerging markets – with South Korea placed within the top five.
FIGURE 12: EASE OF DOING BUSINESS ECONOMY RANKINGS – 2018
Rank Market Rank Market Rank Market
1 New Zealand 21 Iceland 41 Armenia
2 Singapore 22 Canada 42 Slovak Republic
3 Denmark 23 Ireland 43 Turkey
4 Hong Kong SAR, China 24 Germany 44 Kosovo
5 Korea, Rep. 25 Azerbaijan 45 Belgium
6 Georgia 26 Austria 46 China
7 Norway 27 Thailand 47 Moldova
8 United States 28 Kazakhstan 48 Serbia
9 United Kingdom 29 Rwanda 49 Israel
10 Macedonia, FYR 30 Spain 50 Montenegro
11 United Arab Emirates 31 Russian Federation 51 Italy
12 Sweden 32 France 52 Romania
13 Taiwan, China 33 Poland 53 Hungary
14 Lithuania 34 Portugal 54 Mexico
15 Malaysia 35 Czech Republic 55 Brunei Darussalam
16 Estonia 36 Netherlands 56 Chile
17 Finland 37 Belarus 57 Cyprus
18 Australia 38 Switzerland 58 Croatia
19 Latvia 39 Japan 59 Bulgaria
20 Mauritius 40 Slovenia 60 Morocco
Delving into the data a little further reveals that:
■ Malaysia, India and Saudi Arabia rank inside the top 10 economies on the issue of protecting minority investors;
■ UAE, Qatar, Mauritius and Kuwait rank inside the top 10 economies on the issue of paying taxes;
■ Czech Republic, Romania, Poland and Hungary rank inside the top 10 economies on the issue of trading across border;
■ South Korea, China and UAE rank inside the top 10 economies on the issue of enforcing contracts.
However, it is the Ease of Doing Business scores that demonstrate most clearly that there is relatively little separating the UK (ranked 9th globally) and many emerging markets. For example, while Mauritius ranks in 20th, we can see that the difference in score that this represents is negligible. To use another example, the overall difference in score between Russia (77.37/100) ranked in 31st place and the UK (82.65/100) is only marginally higher than the difference between New Zealand (86.59) ranked in first place and the UK.
Returning to our message of identifying the local opportunities and local risks, we can see that across both developed and a number of emerging markets there is very little difference with regards to governance and ease of doing business. Furthermore, across all markets, while certain markets may perform less positively in terms
of ease of doing business, this does not mean that all businesses operating in that market will have poor governance. Strong investment opportunities will exist in a wide range of markets and it is the role of our team to identify the right opportunities, supported by the robust ethos of the fund.
New
Zea
land
Sing
apor
e
Den
mar
k
Hon
g Ko
ng S
AR, C
hina
Kor
ea, R
EP
Geo
rgia
Nor
way
Uni
ted
Stat
es
Uni
ted
King
dom
Mac
edon
ia, F
YR
Uni
ted
Ara
b Em
irate
s
Swed
en
Taiw
an, C
hina
Lith
uani
a
Mal
aysi
a
Esto
nia
Finl
and
Aust
ralia
Lativ
a
Mau
ritiu
s
86.5
9
85.2
4
84.6
4
84.2
2
84.1
4
83.3
8
82.9
5
82.7
5
82.6
5
81.5
5
81.2
8
81.2
7
80.9
80.8
3
80.6
80.5
80.3
5
80.1
3
79.5
9
79.5
8
FIGURE 13: TOP 20 EASE OF DOING BUSINESS ECONOMY SCORES – 2019
5. GOVERNANCE: STABILITY AND OVERSIGHT
7 Starting a business; dealing with construction permits; Getting electricity; Registering property; Getting credit; Protecting minority investors; Paying taxes; Trading across borders; Enforcing contracts; Resolving insolvency
Source: World Bank
Source: World Bank
The Changing Nature of Emerging Markets | 23 22 | Franklin Templeton

TEMIT – SUPPORTING GOOD GOVERNANCE IN EMERGING MARKETS CASE STUDY #3
Lukoil is a Russian multinational energy corporation headquartered in Moscow, specialising in the business of extraction, production, transport, and sale of petroleum, natural gas, and petroleum products.
Over recent years we have worked with the business with regards to governance factors. As such, the company has increased its focus on shareholder returns through:
■ Introducing a new progressive dividend policy; ■ Ensuring any excess of free cash flow is now spent on share
buybacks; and ■ Giving minority investors a seat on the Board of Directors.
Furthermore, over the last three years the company has showed clear progress on both cost optimisation and capital expenditure rationalisation.
As a result, Lukoil’s return on equity (ROE) was higher in 2018 than it was in 2011-12 when oil prices were an inflated >100$/bbl.
NAME OF BUSINESS Lukoil
COUNTRY Russia
SECTOR Energy
YEAR ESTABLISHED 1991
NATURE OF
BUSINESS
The second largest vertically integrated oil company in Russia
The companies and case studies shown herein are used solely for illustrative purposes; the investment may or may not be currently held by any portfolio advised by Franklin Templeton Emerging Markets Equity (aka Templeton Emerging Markets Group). The manager's opinions are intended solely to provide insight into how the manager analyzes securities. The information provided is not a recommendation or individual investment advice for any particular security, strategy, or investment product. and is not an indication of the trading intent of any Franklin Templeton managed portfolio.
24 | Franklin Templeton The Changing Nature of Emerging Markets | 25

There is often the view among UK consumers that emerging markets represent environmentally and socially unfriendly investments – which is likely to be a legacy of the former reliance of many emerging markets on fossil fuel industries and primary industries. Developed markets, on the other hand, are often seen to reflect environmentally and socially sound and highly regulated investments.
However, our analysis demonstrates that there are two sides to this coin.
Indeed, data from the International Energy Agency shows how emerging market countries are playing an integral role in the generation of renewable energy. Renewable electricity generation is being dominated by China – which produces more than 2.5 times the amount of renewable power than the US produces. Furthermore, Brazil, India and Russia are all generating far higher amounts of renewable electricity than the UK, Germany and Italy.
FIGURE 14: ELECTRICITY GENERATION FROM RENEWABLES OVER TIME IN GWH
1990 1995 2000 2005 2010 20150
2016
200000
400000
600000
800000
1000000
1200000
1400000
1600000
China S.Korea
India Russia
Brazil US
Canada Germany
UK Italy
6. SECTORS AND MARKETS TO WATCH
KUWAIT: 11.3%
CHILE: 14.9%
THAILAND: 13.4%
MAURITIUS 13.1%
VIETNAM: 16.8%
FIGURE 15:TRADE VALUE FORECASTED 2018-2023 COMPOUND ANNUAL GROWTH RATE OF RENEWABLE AND
SUSTAINABLE SECTORS8 - TOP 5 EMERGING MARKETS
Our research suggests that Vietnam can expect to experience a boom in trade in the sustainable energy sector up to the year 2023 – with a forecasted CAGR of 16.8%. Renewable energy in Vietnam is dominated by hydroelectricity, which supplied over 38% of the country’s electricity in 2016. However, other sources, such as wind and solar are only in an early development stage and the potential is high and largely untapped9. This growth is being driven by a projected 8% annual increase until 2025 in demand for electricity in Vietnam. To meet this need, the Vietnamese government approved a revised National Power Development Master Plan (“PDP VII”) for the 2011- 2020 Period, with a vision for 2030. The plan aims to increase the share of renewable energy (excluding hydroelectricity) to above 10% by 2030, though this will not be without its challenges, most notably in a lack of capital funding for the required infrastructure.
Chile is also a very recent story with regards to renewable energy. In 2013, Chile generated only 5% of its electricity from renewable energy sources, but this has more than tripled in the last five years, reaching 18% in May 201810. This growth can be attributed to both a fall in installation costs alongside the significant potential of solar and wind energy in the country. In addition, the Chilean government has developed a long-term energy public policy, the Energy Agenda 2050 that included goals, a new role for the public sector, a CO2 tax, and a full legislative agenda.
Ultimately, the focus from an investment point of view must also fall on individual companies. As stewards of our clients’ capital it is our responsibility, as shareholders, to hold companies to account and encourage best practice in the businesses we invest in.
1
2
3
4
5
It is clear, then, that there are pockets of emerging market countries driving the generation of renewable energy. This is reflected in the levels of trade in renewable energy technologies. Our research suggests China far outweighs all other countries in current levels of trade in renewable energy technologies, producing over two and a
half times the trade volumes of the next highest country. In fact, the top seven markets are all Asian. It would, however, appear that there are a number of other emerging markets, intent on playing catch-up.
8 Renewable energy sector variable created through a combination of photovoltaic panels, wind turbines and biomass.9 Vietnam Renewable Energy Report 201810 Is an energy revolution underway in Chile? Maximiliano Proaño
Source: International Energy Agency
Source: Coriolis Technologies
The Changing Nature of Emerging Markets | 27 26 | Franklin Templeton

TEMIT – SUPPORTING ENVIRONMENTAL CONSIDERATIONS IN EMERGING MARKETS CASE STUDY #4
Mahle Metal Leve SA is a Brazil-based company primarily engaged in the automotive engine parts manufacture. The Company’s activities are divided into two business segments: Engine components and Filter.
The business has made considerable progress over recent years in the extent to which business decisions are influenced by environmental considerations.
The company has worked to significantly reduce its CO2 emissions through the introduction of alternative biofuels (ethanol) in their internal combustion engines.
The Mahle Technology Centre has taken this a step further by developing a solution to improve ethanol productivity at their sugar cane mills. This will further improve the use of renewable fuels in Brazilian cars which are already mostly flex fuel cars.
NAME OF BUSINESS Mahle-Metal Leve
COUNTRY Brazil
SECTOR Consumer Discretionary
YEAR ESTABLISHED 1951
NATURE OF
BUSINESS
Manufactures auto parts for internal combustion engines.
Flex fuel (or dual fuel) is an alternative fuel vehicle with an internal combustion engine designed to run on more than one fuel, usually gasoline blended with either ethanol or methanol fuel, with both fuels being stored in the same common tank.
This activity also contributes from a sustainability perspective, because it does not require an increase in the planted area.
The companies and case studies shown herein are used solely for illustrative purposes; the investment may or may not be currently held by any portfolio advised by Franklin Templeton Emerging Markets Equity (aka Templeton Emerging Markets Group). The manager's opinions are intended solely to provide insight into how the manager analyzes securities. The information provided is not a recommendation or individual investment advice for any particular security, strategy, or investment product. and is not an indication of the trading intent of any Franklin Templeton managed portfolio.
28 | Franklin Templeton The Changing Nature of Emerging Markets | 29
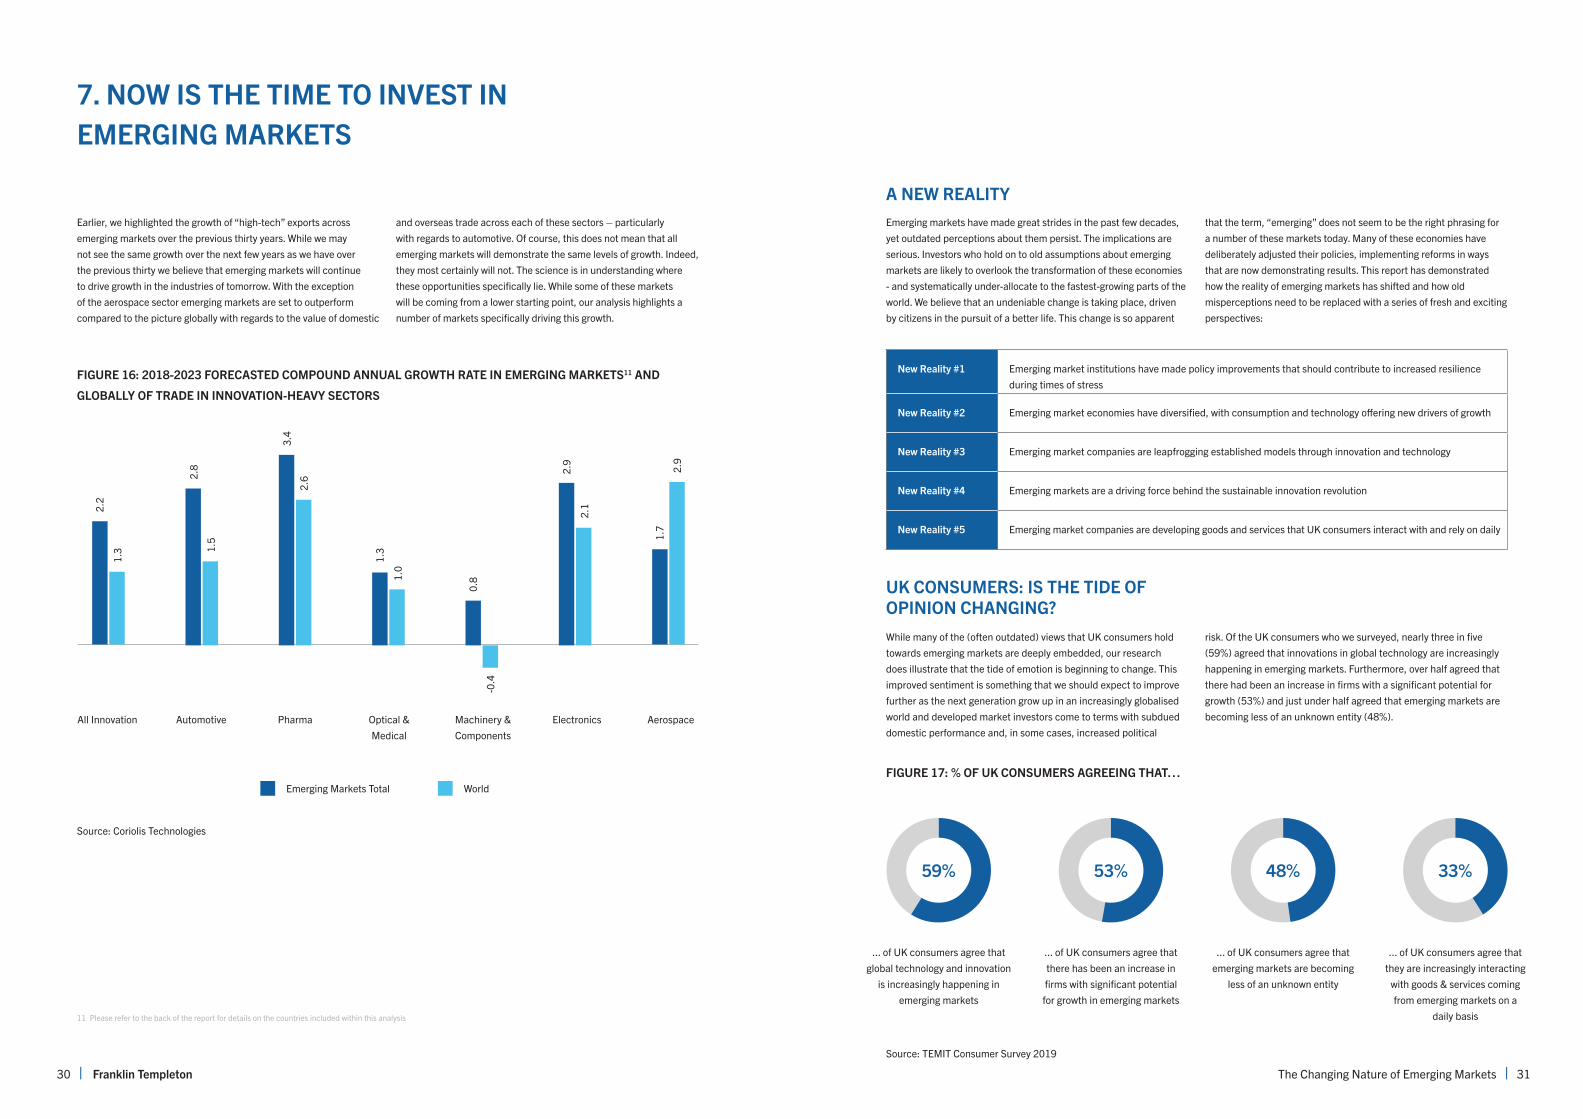
Emerging markets have made great strides in the past few decades, yet outdated perceptions about them persist. The implications are serious. Investors who hold on to old assumptions about emerging markets are likely to overlook the transformation of these economies - and systematically under-allocate to the fastest-growing parts of the world. We believe that an undeniable change is taking place, driven by citizens in the pursuit of a better life. This change is so apparent
that the term, “emerging” does not seem to be the right phrasing for a number of these markets today. Many of these economies have deliberately adjusted their policies, implementing reforms in ways that are now demonstrating results. This report has demonstrated how the reality of emerging markets has shifted and how old misperceptions need to be replaced with a series of fresh and exciting perspectives:
While many of the (often outdated) views that UK consumers hold towards emerging markets are deeply embedded, our research does illustrate that the tide of emotion is beginning to change. This improved sentiment is something that we should expect to improve further as the next generation grow up in an increasingly globalised world and developed market investors come to terms with subdued domestic performance and, in some cases, increased political
risk. Of the UK consumers who we surveyed, nearly three in five (59%) agreed that innovations in global technology are increasingly happening in emerging markets. Furthermore, over half agreed that there had been an increase in firms with a significant potential for growth (53%) and just under half agreed that emerging markets are becoming less of an unknown entity (48%).
FIGURE 17: % OF UK CONSUMERS AGREEING THAT…
59%
... of UK consumers agree that global technology and innovation
is increasingly happening in emerging markets
53%
... of UK consumers agree that there has been an increase in firms with significant potential for growth in emerging markets
48%
... of UK consumers agree that emerging markets are becoming
less of an unknown entity
33%
... of UK consumers agree that they are increasingly interacting
with goods & services coming from emerging markets on a
daily basis
New Reality #1 Emerging market institutions have made policy improvements that should contribute to increased resilience during times of stress
New Reality #2 Emerging market economies have diversified, with consumption and technology offering new drivers of growth
New Reality #3 Emerging market companies are leapfrogging established models through innovation and technology
New Reality #4 Emerging markets are a driving force behind the sustainable innovation revolution
New Reality #5 Emerging market companies are developing goods and services that UK consumers interact with and rely on daily
A NEW REALITY
UK CONSUMERS: IS THE TIDE OF OPINION CHANGING?
Source: TEMIT Consumer Survey 2019
7. NOW IS THE TIME TO INVEST IN EMERGING MARKETS
Earlier, we highlighted the growth of “high-tech” exports across emerging markets over the previous thirty years. While we may not see the same growth over the next few years as we have over the previous thirty we believe that emerging markets will continue to drive growth in the industries of tomorrow. With the exception of the aerospace sector emerging markets are set to outperform compared to the picture globally with regards to the value of domestic
and overseas trade across each of these sectors – particularly with regards to automotive. Of course, this does not mean that all emerging markets will demonstrate the same levels of growth. Indeed, they most certainly will not. The science is in understanding where these opportunities specifically lie. While some of these markets will be coming from a lower starting point, our analysis highlights a number of markets specifically driving this growth.
11 Please refer to the back of the report for details on the countries included within this analysis
FIGURE 16: 2018-2023 FORECASTED COMPOUND ANNUAL GROWTH RATE IN EMERGING MARKETS11 AND
GLOBALLY OF TRADE IN INNOVATION-HEAVY SECTORS
All Innovation Automotive Pharma Optical & Medical
Machinery & Components
Electronics Aerospace
2.2
1.3
2.8
1.5
3.4
2.6
1.3
1.0
0.8
-0.4
2.9
2.1
1.7
2.9
Emerging Markets Total World
Source: Coriolis Technologies
The Changing Nature of Emerging Markets | 31 30 | Franklin Templeton

Illustrating how this change may continue into the future, the results of our survey show that it is younger consumers (who are often more outward looking, receptive to new ideas and with less deeply embedded internal biases) who recognise emerging markets in these more positive terms:
■ 61% of 18-39-year olds agree there has been an increase in firms with significant potential for growth in emerging markets (53% among all UK consumers);
■ 53% of 18-39-year olds agree emerging markets are becoming less of an unknown entity (48% among all UK consumers);
■ 50% of 18-39-year olds agree they are increasingly interacting with goods and services coming from emerging markets on a daily basis (33% among all UK consumers).
While, of course, investment performance will continue to have a strong influence on the decision-making of UK investors (and that of intermediaries and investment managers working on their behalf), our findings do suggest that some of those legacy biases with regards to emerging markets will, as time passes, become less of a barrier. Similarly, while many UK consumers default to the opinion that emerging market companies have poorer governance, are less transparent and are less environmentally-friendly, our research does indicate that these perceptions are changing. There is a strong swathe of people recognising that practices and principles within emerging markets are beginning to more closely mirror the more familiar practices and principles of developed markets.
Once more, it is younger people who are more likely to acknowledge some of the governmental and political progress taking place in emerging markets.
■ 52% of 18-39-year olds agree that emerging markets governments have become increasingly progressive over the last decade (38% among all UK consumers);
■ 48% of 18-39-year olds agree that emerging markets have become more robust over the last decade (32% among all UK consumers);
■ 45% of 18-39-year olds agree there are greater levels of political transparency in emerging markets over the last decade (29% among all investors);
Whether this truly reflects changing attitudes or simply less inherent caution with regards to the political landscape in emerging markets is unclear, but it does suggest less distrust and suspicion among the younger investors than is true of their parents and grandparents.
FIGURE 18: % OF 18-39-YEAR OLDsUK CONSUMERS
AGREEING THAT…
...of 18-39-year olds agree that emerging markets governments have become increasingly progressive over the last decade
52%
...of 18-39-year olds agree that emerging markets civil rights have become more robust over the last decade
48%
...of 18-39-year olds agree that there are greater levels of political transparency in emerging markets over the last decade
45%
Source: TEMIT Consumer Survey 2019
THE PERSPECTIVES OF THE YOUNGER GENERATION
32 | Franklin Templeton The Changing Nature of Emerging Markets | 33

CONCLUSION
The emerging markets of today bear little resemblance to the emerging markets of 1989. Since that time, emerging markets have become far more outward looking, while also developing stronger trading relationships between each other. For example, we have seen an increase in intra-Asian trade as domestic consumption becomes more important to balance sheets - reflecting the growth of a highly educated middle class that is becoming increasingly confident in its newfound wealth and global outlook.
At the same time they have diversified the range of goods and services that they specialise in, becoming less reliant on commodities and basic manufactured goods. Alongside these developments, we see within the World Bank data, many emerging markets rivalling the UK in terms of governance and political risk.
While the opportunities in emerging markets are there for all to witness, by the same token the challenges within many markets have not gone away. This is why we strongly advocate taking an active investment approach that provides access to emerging markets experts who can find the companies best positioned to capitalise on growth and seek to reduce risk - increasing the value of investment
over time. While we believe that a long-term narrative shift is continuing to take place in emerging markets, this will not take place in all sectors and all economies at the same speed. Investors need to look in the right places to find the best investment opportunities.
It is positive to see UK consumer sentiment towards emerging markets begin to become more positive, led by the younger generations of our society. However, we continue to urge investors to revisit their approach to emerging markets in light of the positive transformation that we have seen over the past 30 years. We know that UK investors remain highly exposed to UK assets from a risk perspective. However, the double-edged sword of this approach is to also miss out on the potential investment opportunities for growth. While emerging markets may be a novel concept to many, they may best place investors to take advantage of today’s investment landscape.
ABOUT TEMIT
Launched thirty years ago in June 1989, Templeton Emerging Markets Investment Trust PLC (“TEMIT” or the “Company”) is an investment trust that invests principally in emerging markets companies with the aim of delivering capital growth to shareholders over the long term. TEMIT’s research-driven investment approach and strong long-term performance has helped it to grow to be the largest emerging markets investment trust in the UK, with £2.26bn of assets as of July, 31 2019.
ABOUT FRANKLIN TEMPLETON
Franklin Resources, Inc. [NYSE:BEN] is a global investment management organization operating as Franklin Templeton. Franklin Templeton’s goal is to deliver better outcomes by providing global and domestic investment management to retail, institutional and sovereign wealth clients in over 170 countries. Through specialized teams, the company has expertise across all asset classes, including equity, fixed income, alternatives and custom multi-asset solutions. The company’s more than 600 investment professionals are supported by its integrated, worldwide team of risk management professionals and global trading desk network. With employees in over 30 countries, the California-based company has more than 70 years of investment experience and over $709 billion in assets under management as of July 31, 2019. For more information, please visit: www.franklintempleton.co.uk
ABOUT CICERO GROUP
Cicero Group is a full-service communications and market research agency. They design and deliver award-winning corporate, brand, political and regulatory campaigns across all major business sectors from offices in London, Brussels and Dublin.cicero-group.com
ABOUT THIS REPORT
Consumer survey source: Based on a nationally representative survey of 2,000 UK adults (referred to, in the report, as “consumers”) (including 1,379 UK individuals holding investments - referred to, in the report, as “investors”) conducted by Cicero Group on behalf of Templeton Emerging Markets Investment Trust during February 2019.
All “emerging markets” analysis conducted by Coriolis Technologies is based on the following set of countries: Argentina, Bangladesh, Brazil, Bulgaria, Chile, China, Columbia, Czech Republic, Egypt, Greece, Hungary, India, Indonesia, Iran, Kuwait, Malaysia, Mauritius, Mexico, Nigeria, Oman, Pakistan, Peru, Philippines, Poland, Qatar, Romania, Russia, Saudi Arabia, South Africa, South Korea, Taiwan, Thailand, Turkey, Ukraine, UAE, Venezuela, Vietnam.
TEMIT - IMPORTANT INFORMATION
This document is intended to be of general interest only and does not constitute legal or tax advice nor is it an offer for shares or invitation to apply for shares of Templeton Emerging Markets Investment Trust (“TEMIT”). Nothing in this document should be construed as investment advice. Opinions expressed are the author’s at publication date and they are subject to change without prior notice. Subscriptions to shares in TEMIT can only be made on the basis of the Key Information Document, accompanied by the latest available audited annual report and the latest semi-annual report if published thereafter. The value of shares in, or the income received from, TEMIT can go down as well as up, and investors may not get back the full amount invested. Past performance is not an indicator or a guarantee of future performance. Currency fluctuations may affect the value of overseas investments. When investing in a fund denominated in a foreign currency, your performance may also be affected by currency fluctuations. An investment in TEMIT entails risks. For more details of all the risks applicable to TEMIT, please refer to the Key Information Document, Investor Disclosure Document and the risk section in TEMIT’s Annual Report. In emerging markets, the risks can be greater than in developed markets. US Persons (as more fully defined in the latest Fund prospectus) are not eligible to invest in TEMIT. Shares of TEMIT are available for sale and distribution in the UK. Any research and analysis contained in this document has been procured by Franklin Templeton for its own purposes and is provided to you only incidentally. References to particular industries, sectors or companies are for general information and are not necessarily indicative of TEMIT’s holdings at any one time. References to indices are made for comparative purposes only and are provided to represent the investment environment existing during the time periods shown. An index is unmanaged and one cannot invest directly in an index. The performance of the index does not include the deduction of expenses and does not represent the performance of any Franklin Templeton fund.
There is no guarantee that TEMIT will achieve its objective. A copy of the latest TEMIT annual report and semi-annual report, if published thereafter can be found on our website: https://www.temit.co.uk/or can be obtained, free of charge, from Franklin Templeton, Cannon Place, 78 Cannon Street, London EC4N 6HL. Issued by Franklin Templeton Investment Management Limited, Cannon Place, 78 Cannon Street, London, EC4N 6HL. Authorised and regulated by the Financial Conduct Authority.
CFA® and Chartered Financial Analyst® are trademarks owned by CFA Institute
The Changing Nature of Emerging Markets | 35 34 | Franklin Templeton

© 2019 Franklin Templeton. All rights reserved. TEMIT 09/19