syngas production by water electrolysis: preliminary tests on
TRANSCRIPT
ÁREA DEPARTAMENTAL DE ENGENHARIA QUÍMICA
Syngas production by water electrolysis: preliminary
tests on methane production
SIRIA ROSSI
(Graduated in Chemical Engineering)
Master thesis to obtain the Master degree in Chemical Engineering – Branch Chemical
Processes
Supervisors:
João Carlos Moura Bordado, PhD
João Fernando Pereira Gomes, PhD
Jury:
President: Rita Isabel Dias Pacheco, PhD
Members:
Jaime Filipe Borges Puna, PhD
João Fernando Pereira Gomes, PhD
February 2016


i
Acknowledgements
When I thought for the first time about writing the “acknowledgements” on my
master thesis, I thought “you didn’t write them in your bachelor, but you need to, now,
for people around you: they deserve it! It won’t be difficult!”, and I really believed in
my words. But then, here I am, and I find it more difficult than expected, not because I
don’t know what to write, but because I have so many people to thank and so many
things to say that I find it difficult to properly organize my thoughts.
Firstly, I need to thank my supervisors, professor João Bordado and professor João
Gomes, for this nice and very special experience they allowed me to do, with a
particular thank to professor João Gomes, for being so helpful, patient and reassuring in
every step of this work, and for his total availability.
A special thank to Engineer Campos Rodrigues, first of all for having invented the
innovative process objective of this work, which is an important step for the future of
the environment and allowed me to join this interesting work and experience a
formative activity in a research laboratory, but also for his niceness, his help and his
patience, for his dedication to work, which has been an inspiration to do better.
Thank to my family, from the bottom of my heart, for the total support in every step
of this work (as in every step of my life), from the decision to develop the thesis away
from home to the emotional support during the stay.
Thank to my boyfriend, Matteo Eresia, for his unconditional support, in this
experience as in whatever choice I make. Thanks for being patient, caring, reassuring,
and I could continue indefinitely, but, simply, thank you for being the way you are, your
presence in my life is more than precious.
Thank to my friends, the ones that are in Italy and with whom I have continued to
share despite the distance. Thank you for your presence in my life, and thanks for being
such good friends. However, I need also to thank my new important friends from
Lisbon, without whom I could not say I experienced one of the best experiences of my
life. Thank you Beatriz Terra, Adriana Sousa, Marilia Gagliardi, Marta Ramos, André
Gregório, Marta Mendes, Tânia Santos, and Luís Guerra, for sharing with me these
amazing five months, for our laughs, our tragedies, your help, your kind presence.

ii
A special thank goes to Luís Guerra, a key figure in this work, patient, totally
available, reliable, kind. The person who taught me how to move in a laboratory, the
person with which I spent most of my days in Lisbon, but, above all, a special friend.
Thank you for supporting and standing me, from the bottom of my heart.
I would like to thank more people, to tell better, to everyone, how important is
his/her presence in my life and in this wonderful experience. Alone we are nothing, and,
alone, I could not have achieved all of this.
Thank you very much, to everyone.
iii
ABSTRACT
Since the Second Industrial Revolution, the world energy demand has been always
increasing, leading humanity to gradually focus on the sustainability of its activities.
This trend is proved by the increased primary energy sources consumption registered in
the last decades, combined with an interesting increase in the renewable energy
consumption.
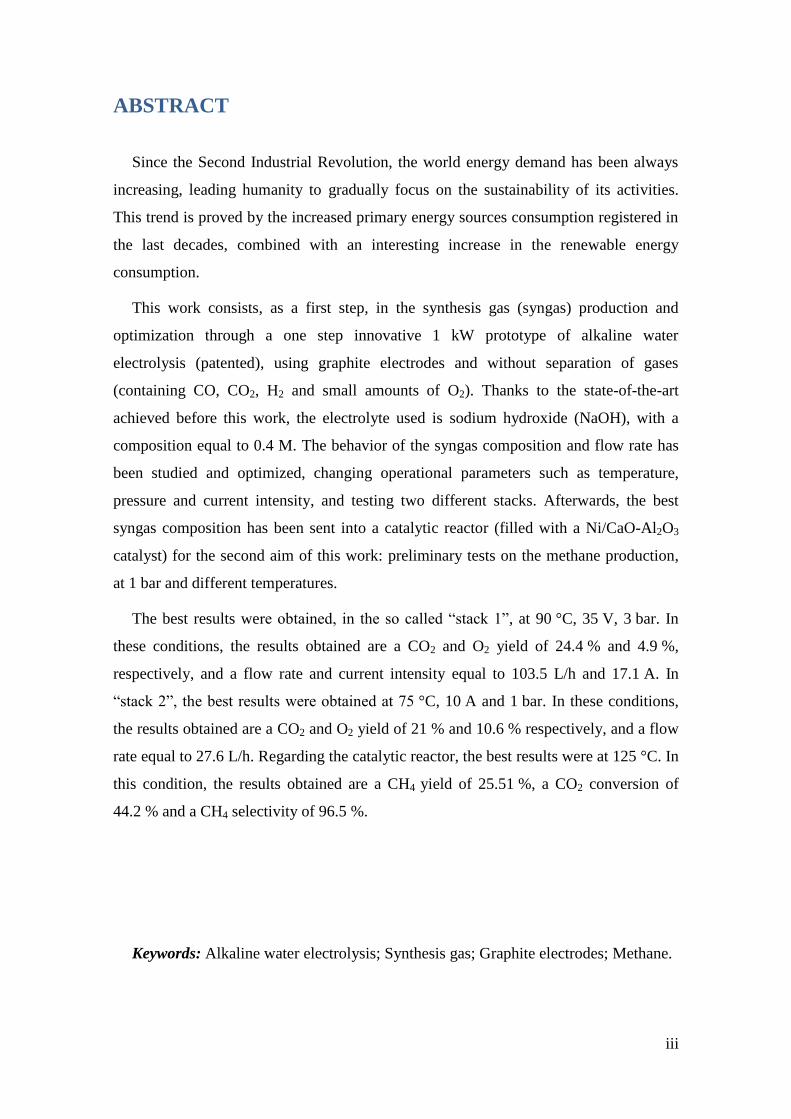
This work consists, as a first step, in the synthesis gas (syngas) production and
optimization through a one step innovative 1 kW prototype of alkaline water
electrolysis (patented), using graphite electrodes and without separation of gases
(containing CO, CO2, H2 and small amounts of O2). Thanks to the state-of-the-art
achieved before this work, the electrolyte used is sodium hydroxide (NaOH), with a
composition equal to 0.4 M. The behavior of the syngas composition and flow rate has
been studied and optimized, changing operational parameters such as temperature,
pressure and current intensity, and testing two different stacks. Afterwards, the best
syngas composition has been sent into a catalytic reactor (filled with a Ni/CaO-Al2O3
catalyst) for the second aim of this work: preliminary tests on the methane production,
at 1 bar and different temperatures.
The best results were obtained, in the so called “stack 1”, at 90 °C, 35 V, 3 bar. In
these conditions, the results obtained are a CO2 and O2 yield of 24.4 % and 4.9 %,
respectively, and a flow rate and current intensity equal to 103.5 L/h and 17.1 A. In
“stack 2”, the best results were obtained at 75 °C, 10 A and 1 bar. In these conditions,
the results obtained are a CO2 and O2 yield of 21 % and 10.6 % respectively, and a flow
rate equal to 27.6 L/h. Regarding the catalytic reactor, the best results were at 125 °C. In
this condition, the results obtained are a CH4 yield of 25.51 %, a CO2 conversion of
44.2 % and a CH4 selectivity of 96.5 %.
Keywords: Alkaline water electrolysis; Synthesis gas; Graphite electrodes; Methane.

iv
v
RESUMO
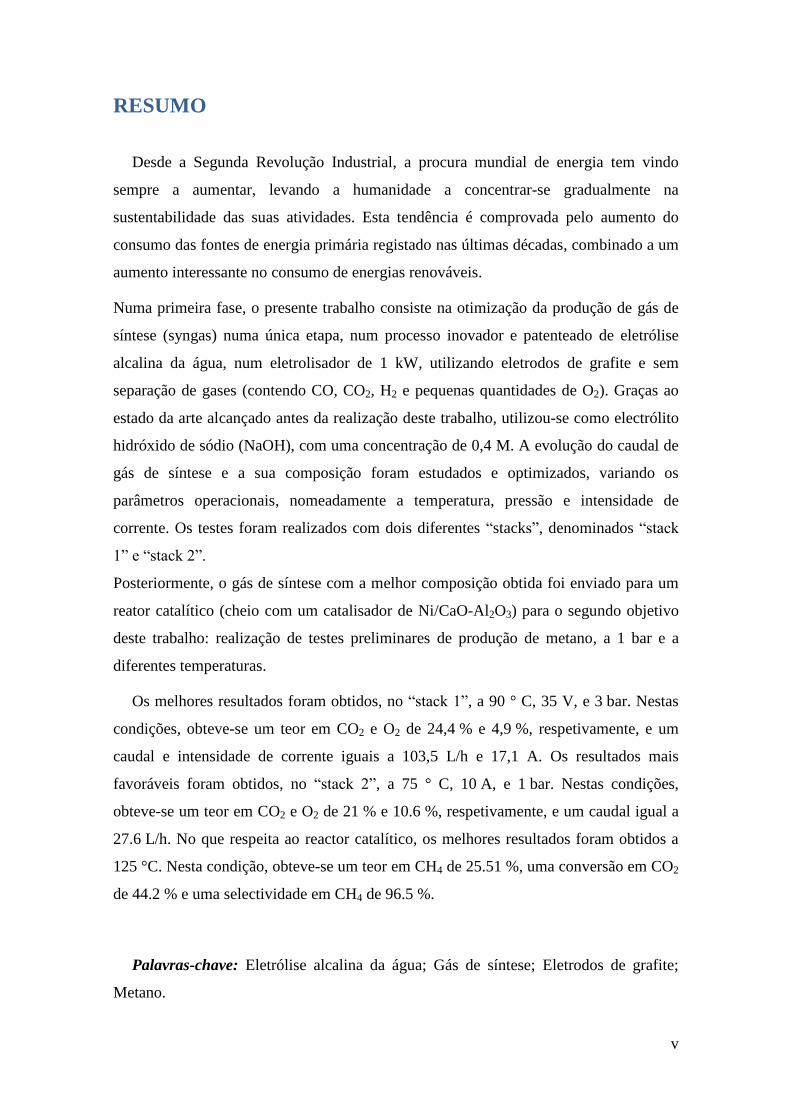
Desde a Segunda Revolução Industrial, a procura mundial de energia tem vindo
sempre a aumentar, levando a humanidade a concentrar-se gradualmente na
sustentabilidade das suas atividades. Esta tendência é comprovada pelo aumento do
consumo das fontes de energia primária registado nas últimas décadas, combinado a um
aumento interessante no consumo de energias renováveis.
Numa primeira fase, o presente trabalho consiste na otimização da produção de gás de
síntese (syngas) numa única etapa, num processo inovador e patenteado de eletrólise
alcalina da água, num eletrolisador de 1 kW, utilizando eletrodos de grafite e sem
separação de gases (contendo CO, CO2, H2 e pequenas quantidades de O2). Graças ao
estado da arte alcançado antes da realização deste trabalho, utilizou-se como electrólito
hidróxido de sódio (NaOH), com uma concentração de 0,4 M. A evolução do caudal de
gás de síntese e a sua composição foram estudados e optimizados, variando os
parâmetros operacionais, nomeadamente a temperatura, pressão e intensidade de
corrente. Os testes foram realizados com dois diferentes “stacks”, denominados “stack
1” e “stack 2”.
Posteriormente, o gás de síntese com a melhor composição obtida foi enviado para um
reator catalítico (cheio com um catalisador de Ni/CaO-Al2O3) para o segundo objetivo
deste trabalho: realização de testes preliminares de produção de metano, a 1 bar e a
diferentes temperaturas.
Os melhores resultados foram obtidos, no “stack 1”, a 90 ° C, 35 V, e 3 bar. Nestas
condições, obteve-se um teor em CO2 e O2 de 24,4 % e 4,9 %, respetivamente, e um
caudal e intensidade de corrente iguais a 103,5 L/h e 17,1 A. Os resultados mais
favoráveis foram obtidos, no “stack 2”, a 75 ° C, 10 A, e 1 bar. Nestas condições,
obteve-se um teor em CO2 e O2 de 21 % e 10.6 %, respetivamente, e um caudal igual a
27.6 L/h. No que respeita ao reactor catalítico, os melhores resultados foram obtidos a
125 °C. Nesta condição, obteve-se um teor em CH4 de 25.51 %, uma conversão em CO2
de 44.2 % e uma selectividade em CH4 de 96.5 %.
Palavras-chave: Eletrólise alcalina da água; Gás de síntese; Eletrodos de grafite;
Metano.

vi
vii
TABLE OF CONTENTS
1. INTRODUCTION ........................................................................................... 1
2. LITERATURE REVIEW................................................................................ 5
2.1 The world energy production and demand – General overview ....................... 5
2.2 Water electrolysis ............................................................................................ 15
2.2.1 Historical background ........................................................................................... 15
2.2.2 The importance of water electrolysis and hydrogen .............................................. 16
2.2.3 Theory of water electrolysis and today’s technologies.......................................... 17
Alkaline water electrolysis ........................................................................................................... 18
PEM electrolysis .......................................................................................................................... 19
SOEC electrolysis ........................................................................................................................ 20
2.3 Synthesis gas ................................................................................................... 21
2.3.1 Technologies of production of synthesis gas ......................................................... 21
Reforming of natural gas .............................................................................................................. 21
Partial oxidation of hydrocarbons ................................................................................................ 22
Gasification of coal or biomass .................................................................................................... 22
Co-electrolysis of water ............................................................................................................... 23
2.3.2 Uses of synthesis gas ............................................................................................. 24
2.4 Production of synthetic fuels from syngas ...................................................... 26
2.4.1 Methanol production and applications .................................................................. 28
2.4.2 DME production and applications ......................................................................... 30
2.4.3 Methane production and applications .................................................................... 33
The Sabatier process .................................................................................................................... 35
2.5 GreenSynFuel – The value of energetic sustainability .................................... 37
2.5.1 State-of-the-art ....................................................................................................... 39
3. EXPERIMENTAL WORK ........................................................................... 43
3.1 Reagents used .................................................................................................. 43
3.2 Equipments used .............................................................................................. 44
3.3 Experimental procedure ................................................................................... 52
viii
TABLE OF CONTENTS (cont.)
4. RESULTS AND DISCUSSION ................................................................... 57
4.1 Collection of experimental results ................................................................... 57
4.1.1 Alkaline water electrolysis-stack 1 ........................................................................ 57
4.1.2 Methane production ............................................................................................... 60
4.1.3 Alkaline water electrolysis-stack 2 ........................................................................ 61
4.2 Treatment of results ......................................................................................... 63
4.2.1 Alkaline water electrolysis-stack 1 ........................................................................ 63
4.2.2 Oxygen removal .................................................................................................... 79
4.2.3 Methane production ............................................................................................... 80
4.2.4 Alkaline water electrolysis-stack 2 ........................................................................ 86
4.2.5 Comparison between the two stacks ...................................................................... 89
5. CONCLUSIONS AND PERSPECTIVES FOR FUTURE WORK ............. 93
BIBLIOGRAPHY .......................................................................................... B.101
ANNEXES.......................................................................................................... A.1
ix
INDEX OF FIGURES
Figure 2.1.1: World primary energy consumption in the last 25 years, in million tonnes
oil equivalent (Mtoe) (adapted from BP Statistical Review of World Energy, 2015) ...... 6
Figure 2.1.2: Total annual anthropogenic GHG emissions from 1970 to 2010 (adapted
from IPCC, 2014) ............................................................................................................. 7
Figure 2.1.3: Energy accumulation in the Earth layers in years (IPCC, 2014) ............... 8
Figure 2.1.4: Global observed change in surface temperature from 1901 to 2012 (IPCC,
2014) ................................................................................................................................. 9
Figure 2.1.5: Regional world primary energy consumption in 2014, in percentage
(adapted from BP Statistical Review of World Energy, 2015) ....................................... 11
Figure 2.1.6: Distribution of coal proved reserves in 1994, 2004 and 2014 (adapted
from BP Statistical Review of World Energy, 2015) ...................................................... 12
Figure 2.1.7: Oil production and consumption by region in the last 25 years until 2014
(adapted from BP Statistical Review of World Energy, 2015) ....................................... 13
Figure 2.1.8: Global renewables consumption and use in power generation by region, in
Mtoe and percentage (adapted from BP Statistical Review of World Energy, 2015) ..... 14
Figure 2.2.1: Example of an electrochemical cell (adapted from Electrolysis) ............ 17
Figure 2.2.2: Alkaline electrochemical cell (Adapted from Free energy: the secret they
can’t kill) ........................................................................................................................ 19
Figure 2.2.3: PEM electrolysis (adapted from Guerra, 2015) ...................................... 19
Figure 2.2.4: Schematic representation of operation of a SOEC electrolyzer (from
Gondolini A., 2013) ........................................................................................................ 20
Figure 2.3.1: Overall pattern for the electrochemical process production (Redissi &
Bouallou, 2013) .............................................................................................................. 24
Figure 2.3.2: Scheme of the most important uses of syngas (adapted from Clean Coal
Syngas) ........................................................................................................................... 25
Figure 2.4.1: Scheme of the steps to produce liquid synthetic fuels (Synthetic fuel,
2015) ............................................................................................................................... 26
x
INDEX OF FIGURES (cont.)
Figure 2.4.2: Scheme of the C1 chemistry reagents and products (Keim, 1986) ........... 33
Figure 2.5.1: Steps of the GSYF technology (adapted from Guerra, 2015) ................. 38
Figure 2.5.2: Steps of growth of the GSYF technology (adapted from Guerra, 2015) 39
Figure 3.2.1: Pilot plant for the alkaline water electrolysis process .............................. 44
Figure 3.2.2: Control panel of the alkaline water electrolysis system........................... 46
Figure 3.2.3: Pressure controller in the alkaline electrolyzer ........................................ 47
Figure 3.2.4: Firewall device, connection between the syngas produced and the
methane production systems ........................................................................................... 47
Figure 3.2.5: System for the methane production ......................................................... 48
Figure 3.3.1: Scheme of production of the Ni/CaO-Al2O3 catalyst .............................. 53
Figure 3.3.2: Ni(NO3)2·6H2O and the two supports mixing and heating on the magnetic
stirring device ................................................................................................................. 54
Figure 3.3.3: Catalyst ready to be used, after calcination ............................................. 54
Figure 4.2.1: CO2 behavior with voltage and temperature at 1 bar ............................... 65
Figure 4.2.2: CO2 behavior with voltage and temperature at 2 bar ............................... 68
Figure 4.2.3: CO2 behavior with voltage and temperature at 3 bar ............................... 70
Figure 4.2.4: CO2 behavior with temperature at 4 bar .................................................. 71
Figure 4.2.5: Current intensity trend with pressure, at fixed temperature and voltage . 72
Figure 4.2.6: Energy consumption trend with voltage, at fixed temperature and pressure
........................................................................................................................................ 73
Figure 4.2.7: Flow rate trend with current intensity ...................................................... 74
Figure 4.2.8: CO2 % with voltage at fixed temperature and pressure ........................... 74
Figure 4.2.9: CO2 % with temperature at fixed voltage and pressure ........................... 75
Figure 4.2.10: CO2 % with pressure at fixed voltage and temperature ......................... 76
Figure 4.2.11: CO2 % with pressure at fixed voltage and temperature ......................... 76
xi
INDEX OF FIGURES (cont.)
Figure 4.2.12: CH4 yield with temperature ................................................................... 83
Figure 4.2.13: Selectivity and conversion yield with temperature for the catalytic
reactor ............................................................................................................................. 84
Figure 4.2.14: Flow rate trend with temperature after the catalytic reactor .................. 85
Figure 4.2.15: CO2 behavior with current intensity and temperature at 1 bar .............. 87
Figure 4.2.16: Flow rate trend with temperature, at 1 bar and different intensity values
........................................................................................................................................ 88
Figure 4.2.17: Flow rate trend with current intensity, stack 2 ....................................... 88
Figure 4.2.18: CO2 trend with intensity, comparison between stack 1 and stack 2 ...... 89
Figure 4.2.19: CO2 trend with temperature, comparison between stack 1 and stack 2 . 90
Figure 4.2.20: Flow rate trend with current at 1 bar, comparison between stack 1 and
stack 2 ............................................................................................................................. 91

xii
xiii
INDEX OF TABLES
Table 2.2.1: Historical events in the water electrolysis evolution (Zoulias et al.) ........ 16
Table 2.3.1: Reactions that occur in the reforming of natural gas (Moulijn et al., 2013)
........................................................................................................................................ 21
Table 2.3.2: Reactions that occur in the partial oxidation of hydrocarbons (Moulijn et
al., 2013) ......................................................................................................................... 22
Table 2.3.3: Reactions that occur in the gasification of coal (Moulijn et al., 2013) ..... 23
Table 2.4.1: Comparison of cobalt and iron catalysts in the FT synthesis (adapted from
Khodakov et al., 2007) .................................................................................................... 27
Table 2.4.2: List of some of the heterogeneous processes for CH3OH manufacture (Lee,
1990) ............................................................................................................................... 29
Table 2.4.3: Main reactions that occur in the methanol production from syngas (Lee,
1990) ............................................................................................................................... 29
Table 2.4.4: Main reactions that occur in the DME production from syngas (adapted
from ChemSystems, 2008) .............................................................................................. 32
Table 2.4.5: Sabatier reactions (Zhang et al., 2013) ...................................................... 35
Table 4.1.1: Parameters set and results obtained from stack 1 ...................................... 58
Table 4.1.2: Results obtained from the catalytic reactor for the methane production ... 60
Table 4.1.3: Parameters set and results obtained from stack 2 ...................................... 62
Table 4.2.1: Results at 1 bar, stack 1 ............................................................................. 64
Table 4.2.2: Results at 2 bar, stack 1 ............................................................................. 67
Table 4.2.3: Results at 3 bar, stack 1 ............................................................................. 69
Table 4.2.4: Results at 4 bar, stack 1 ............................................................................. 70
Table 4.2.5: Parameters range for each pressure-Summary .......................................... 72
Table 4.2.6: Parameters and results for the optimum test performed ............................ 78
Table 4.2.7: Results from the catalytic reactor to produce methane ............................. 82
Table 4.2.8: Parameters set and results obtained from stack 2 ...................................... 86

xiv
xv
LIST OF ACRONYMS
% CH4 Percentage of methane in the analyzed gas
% CH4f Percentage of methane in the analyzed gas, after the catalytic reactor
% CO Percentage of carbon monoxide in the analyzed gas
% COf Percentage of carbon monoxide in the analyzed gas, after the catalytic reactor
% CO2 Percentage of carbon dioxide in the analyzed gas
% CO2f Percentage of carbon dioxide in the analyzed gas, after the catalytic reactor
% comp Percentage of a component in the gaseous mixture
Percentage of the CO2 conversion
% H2 Percentage of hydrogen in the analyzed gas
% H2f Percentage of hydrogen in the analyzed gas, after the catalytic reactor
% O2 Percentage of oxygen in the analyzed gas
% O2f Percentage of oxygen in the analyzed gas, after the catalytic reactor
Percentage of the selectivity towards CH4
AISI American Iron and Steel Institute
AMF Alternative Motor Fuel
API American Petroleum Institute
ARM Atmospheric Radiation Measurement
BASF Badische Anilin und Soda Fabrik
CCS Carbon capture and storage
cNaOH Molar concentration of NaOH
CRES Centre for Renewable Energy Sources
ΔrH0
298 Standard Enthalpy of reaction at 298 K
ΔrH0
800 Standard Enthalpy of reaction at 800 K
DME Dimethyl ether
DMFCs Direct Methanol Fuel Cells
Econs Consumed energy
EDF Environmental Defense Fund
ENEA Ente Nazionale per l’Energia e l’Ambiente
ENI Ente Nazionale Idrocarburi
EU European Union
FEUP Faculdade de Engenharia da Universidade do Porto
FOLU Forestry and Other Land Use
FRC Frederick Research Center
FT Fischer-Tropsch
xvi
LIST OF ACRONYMS (cont.)
GHG Greenhouse Gases
GSYF GreenSynFuel
GTL Gas to Liquids
HFCs Hydrofluorocarbons
I Current Intensity
IDA International DME Association
IEA International Energy Agency
IPCC Intergovernmental Panel on Climate Change
IST Instituto Superior Técnico
LNEG Laboratório Nacional de Energia e Geologia
LPDME TM
Liquid-Phase DME
LPG Liquefied Petroleum Gas
LPM Low Pressure Methanol process
LPMeOH TM
Liquid-Phase Methanol
Lsol Liters of solution
LV Low-Voltage
M Molar
MNaOH Molar mass of NaOH
mNaOH Mass of NaOH
MTBE Methyl tert-butyl ether
MTO Methanol-to-Olefin
Mtoe Million tones oil equivalent
ncells Number of cells
Number of moles of CH4
nCO Number of moles of CO
Number of moles of CO2
Number of moles of CO2 reacted to produce methane (principal reaction)
Number of moles of CO2 reacted to produce carbon monoxide (side reaction)
Number of moles of CO2 unreacted
ncomp Number of moles of a component in the gaseous mixture
NG Natural gas
nNaOH Number of moles of NaOH
NOx Nitrogen oxides
xvii
LIST OF ACRONYMS (cont.)
ntot Total number of moles
P Pressure
PEM Polymer Electrolyte Membrane
PFCs Perfluorocarbons
PTFE Polytetrafluoroethylene
Q Flow rate
Q/cell Flow rate per cell
Qf Flow rate after the catalytic reactor
R Gas constant
RWGS Reverse Water-Gas Shift
SIRI Società Italiana Ricerche Industriali
SMR Steam Methane Reforming
SNG Synthetic natural gas
SOEC Solid Oxide Electrolyser Cell
SPE Solid Polymer Electrolyte
T Temperature
T Time
Tr Reactor temperature
UGP Unique Global Possibilities
UK United Kingdom
UNCED United Nations Conference on Environment and Development
UNCHE United Nations Conference on the Human Environment
U.S. United States
V Voltage
Vol Volume
WGSR Water-Gas Shift Reaction

xviii
1
1. INTRODUCTION
The energy demand in the world has been always increasing in its history.
The primary energy sources are divided in two big classes: exhaustible sources (oil,
natural gas, coal, uranium and plutonium – to produce nuclear energy) and renewable
sources (solar, hydroelectric, geothermal, biomass and wind energy) (Guerra, 2015).
Even if the exhaustible sources are far more used then the renewable ones, it seems that
this trend should change drastically, in part because of the characteristic “exhaustibility”
of exhaustible sources, and also because fossil fuels are responsible for the greenhouse
effect, a problem that every year seems to affect the world increasingly (BP Statistical
Review of World Energy, 2015).
If, on one hand, the BP Statistical Review of World Energy points out an interesting
increase in the use of renewable energy in 2014, reaching a record of 3.0 % of global
energy consumption, up from 0.9 % a decade ago, on the other hand, the
Intergovernmental Panel on Climate Change (IPCC) says in a stark report that most of
the world’s electricity must be produced from low-carbon sources by 2050 to avoid the
world to face “[…] severe, pervasive and irreversible […]” damage, and that fossil fuel
power generation without carbon capture and storage (CCS) technology would need to
be “[…] phased out almost entirely by 2100” (IPCC, 2014, a). Furthermore, the report
suggests renewables will have to grow from their current 30 % share to 80 % of the
power sector by 2050.
The project described in this master thesis is called SYM – Methanol production from
water electrolysis, using graphite electrodes, and stems from a company (GSYF -
GreenSynFuel) founded in 2013 with the aim to study and develop a new technology
that is a positive contribution in reducing the dependence on fossil fuels. The project
consists of an innovative (patented) system to produce a mixture of gases that do not
need to be separated, namely H2, CO, CO2, from alkaline electrolysis of water (instead
of producing just oxygen and hydrogen as in a common alkaline electrolysis process),
thanks to graphite electrodes, using as activation energy electricity derived from a
renewable source (solar or wind energy) (Rodrigues, 2013, a).
2
The alkaline electrolysis of water is just one of the ways used nowadays to obtain
hydrogen. On the contrary, it is the least used, because it is not economically
competitive if compared to the production by fossil fuels (Natural gas-NG, carbon).
What makes this innovative system competitive, is, as already said, the possibility to
produce not only hydrogen, but a mixture of gases which does not need to be separated,
starting from renewable energy (even if the current stage of the work does not provide
for the use of renewable energy as primary power source, one assumption of the project
is to use as activation energy electricity derived from a renewable source). Furthermore,
syngas is a really versatile mixture, and, depending on the catalyst used in the specific
process, and on the temperature at which it works, a lot of different compounds can be
produced. This makes feasible (starting from syngas), the further production of an entire
chain of synthetic fuels at a price that can compete with fossil-made ones (Rodrigues,
2013, a).
One of these fuels is methane, the main component of natural gas, which is easy to
find in nature. It is one of the most important greenhouse gas (GHG), together with
CO2, but it is a really important fuel as well. The synthetic production of methane is
gaining more and more importance (since it is considered a “cleaner” fuel, when
compared to fossil fuels and coal), and will be studied in a preliminary way in this
work, using the gases produced from the step of alkaline electrolysis of water as
reagents, and making them react in a catalytic reactor in which the Sabatier reaction
occurs (Sterner, 2009).
The synthetic production of methane is gaining more importance also because of the
possibility to use it as an energy carrier in one of the most promising systems to produce
electric energy: fuel cells. Methane is not the only fuel that can be used with this
purpose: also coal and hydrogen, for example, can be used as energy carriers in fuel
cells, as well as another important compound, considered a “cleaner fuel” like methane,
which is methanol (FuelCellToday, 2012).
In effect, methanol is basically used nowadays as an intermediate product in
chemical industry (to produce acetic acid, resins, MTBE – Methyl tert-butyl ether – and
other chemicals) or to produce olefins (thanks to the MTO – Methane to Olefins –
process).

3
Recently, anyway, it is gaining more importance also as an energetic product, thanks
to its good features as automotive fuel, or to produce DME – dimethyl ether – (a
derivative of methanol, excellent as synthetic fuel), or, as already said, as an energy
carrier in fuel cells (ENI, 2011).
The main aim of this project is the production of electric energy, to be used in places
in which the energy supply is difficult, through fuel cells. Even if these systems are still
under study, to optimize their performance, to reduce the costs per kW, to improve the
safety (because of the use of hydrogen in these systems), the reliability, the maintenance
and management costs, etc., they are one of the most promising systems to produce
electric energy, both for their positive characteristics in terms of energy and
environment and for a high number of possible applications (FuelCellToday, 2012).
The objective of this work is, primarily, the study and optimization of water
electrolysis starting from the state-of-the-art technique achieved by previous research
works, in order to find the best process variables combination to obtain the best results.
Then, a second step is the characterization of the process to produce one of the fuels of
greatest interest in fuel cells, methane (selecting the best operating pressure and
temperature, the best catalyst and the best H2:CO2 ratio) from the mixture of gases
previously produced.
It is also important to point out that the pilot plant used for this work was built with
the intent of allowing the production of different fuels (such as methanol), the
optimization of which will be studied in future works.
Lastly, an abstract (shown in Annexes) about this work has been produced, with title
Methane production from water electrolysis using graphite electrodes, and was
approved to participate in the Fuel Cells Science and Technology 2016 conference held
in Glasgow (UK) on the 13th
- 14th
of April 2016.

4
5
2. LITERATURE REVIEW
2.1 The world energy production and demand – General
overview
“Energy is the capacity of a system to do work. […] Every living organism does
work, and needs energy from food or photosynthesis. Humans also create machines that
do work for them, and that derive energy from fuels.” (API, 2015).
These sentences from API show well the importance of energy in our daily life.
Energy is something without which our existence would be impossible.
Energy sources can be divided in three classes: primary energy, secondary energy
and final energy. Primary energy is the type of energy that can be found in nature, that
is not derived from the conversion of any other form of energy, and that allows the
production of secondary energy. Lastly, the final energy is the one that can be produced
from the secondary energy (Puna, 2014). Below there is a short list of the three energy
sources described:
1. Primary sources: oil, natural gas, coal, solar, hydroelectric, geothermal, biomass
and wind energy;
2. Secondary sources: petroleum products (such as liquefied petroleum gas – LPG,
kerosene, diesel fuel, etc.);
3. Final sources: electricity, heat, etc.
Primary energy can be further divided in two important classes (Puna, 2014):
1. Exhaustible sources: oil, natural gas, coal, uranium and plutonium (to produce
nuclear energy);
2. Renewable sources: solar, hydroelectric, geothermal, biomass and wind energy.
The basis of this classification is human life time; which means that an energy source
is considered as exhaustible if it takes a long time to be available again. Some sources
not only take a long time to be available again, but decrease by smaller quantities each
time they are available again (Puna, 2014).
6
Starting from the Industrial Revolution, more precisely from the 19th
century, the
energy demand in the world has been always increasing in its history (Guerra, 2015).
Since exhaustible sources are easier to use, and cheaper than the renewable ones,
they have been the most used energy sources for centuries, and they still are.
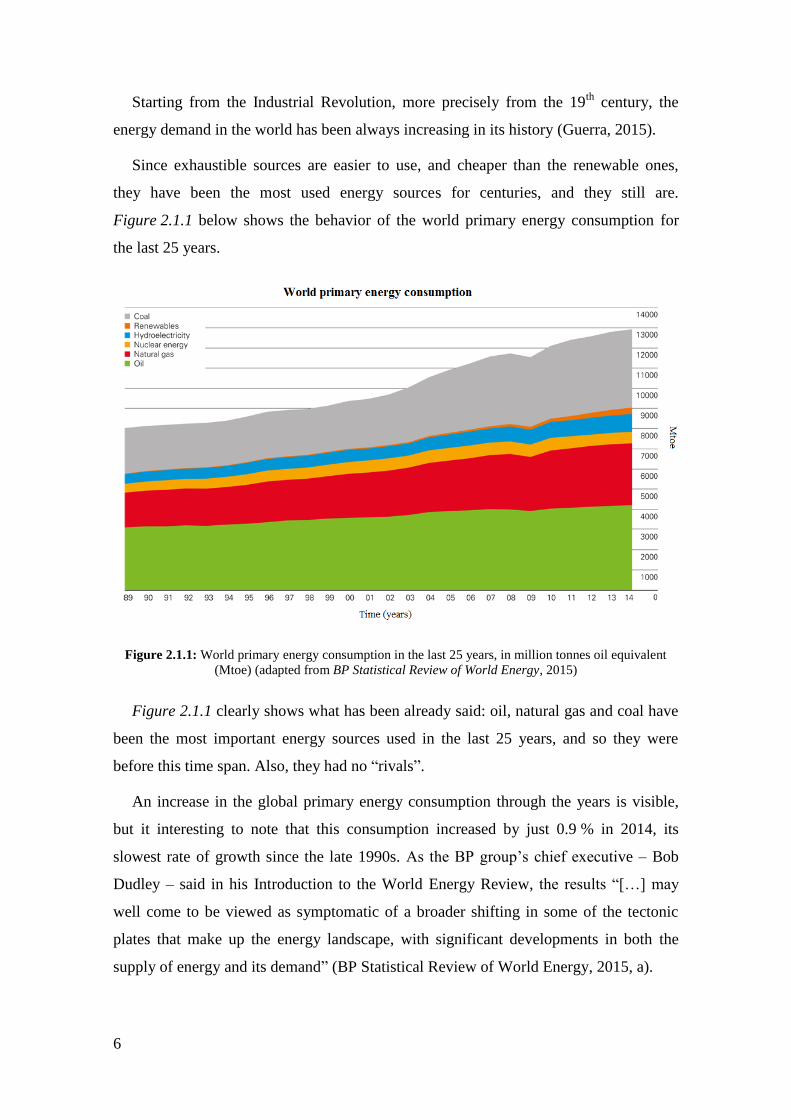
Figure 2.1.1 below shows the behavior of the world primary energy consumption for
the last 25 years.
Figure 2.1.1: World primary energy consumption in the last 25 years, in million tonnes oil equivalent
(Mtoe) (adapted from BP Statistical Review of World Energy, 2015)
Figure 2.1.1 clearly shows what has been already said: oil, natural gas and coal have
been the most important energy sources used in the last 25 years, and so they were
before this time span. Also, they had no “rivals”.
An increase in the global primary energy consumption through the years is visible,
but it interesting to note that this consumption increased by just 0.9 % in 2014, its
slowest rate of growth since the late 1990s. As the BP group’s chief executive – Bob
Dudley – said in his Introduction to the World Energy Review, the results “[…] may
well come to be viewed as symptomatic of a broader shifting in some of the tectonic
plates that make up the energy landscape, with significant developments in both the
supply of energy and its demand” (BP Statistical Review of World Energy, 2015, a).
7
This means that, probably, some years will be needed to fully understand the reasons
behind this behavior and in which direction the world is going. What is well known is
the intention to improve the environmental conditions of the world as quickly as
possible, in accordance with the world’s energy needs (IEA, 2014).
In effect, even if exhaustible sources are far more used than the renewable ones, it
seems that this trend should change drastically, in part because of the characteristic
“exhaustibility” of exhaustible sources, and also because fossil fuels are responsible for
the greenhouse effect, a problem that, every year, seems to affect the world increasingly
(BP Statistical Review of World Energy, 2015).
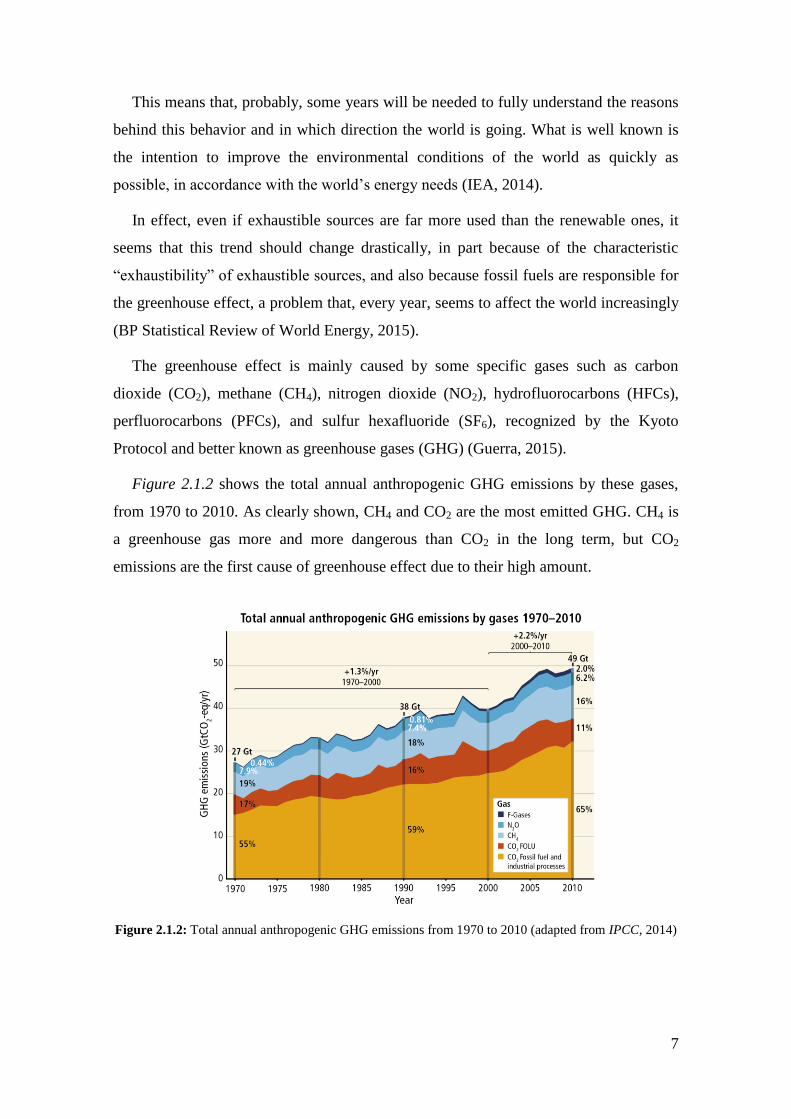
The greenhouse effect is mainly caused by some specific gases such as carbon
dioxide (CO2), methane (CH4), nitrogen dioxide (NO2), hydrofluorocarbons (HFCs),
perfluorocarbons (PFCs), and sulfur hexafluoride (SF6), recognized by the Kyoto
Protocol and better known as greenhouse gases (GHG) (Guerra, 2015).
Figure 2.1.2 shows the total annual anthropogenic GHG emissions by these gases,
from 1970 to 2010. As clearly shown, CH4 and CO2 are the most emitted GHG. CH4 is
a greenhouse gas more and more dangerous than CO2 in the long term, but CO2
emissions are the first cause of greenhouse effect due to their high amount.
Figure 2.1.2: Total annual anthropogenic GHG emissions from 1970 to 2010 (adapted from IPCC, 2014)
8
Since 1970, cumulative anthropogenic CO2 emissions from fossil fuel combustion,
cement production and flaring have tripled, and cumulative CO2 emissions from
forestry and other land use (FOLU) have increased by about 40 %. Again, about 40 %
of the anthropogenic CO2 emissions have remained in the atmosphere since 1750. The
remaining part was removed from the atmosphere by means of CO2 sink and stored in
the natural carbon cycle reservoirs (IPCC, 2014).
The problem connected with the greenhouse effect is the global warming (or climate
change). Over the last century, global average temperature has increased by more than
0.7 °C. In particular, the 2001-2010 decade was the warmest since 1880 — the earliest
year for which comprehensive global temperature records are available.
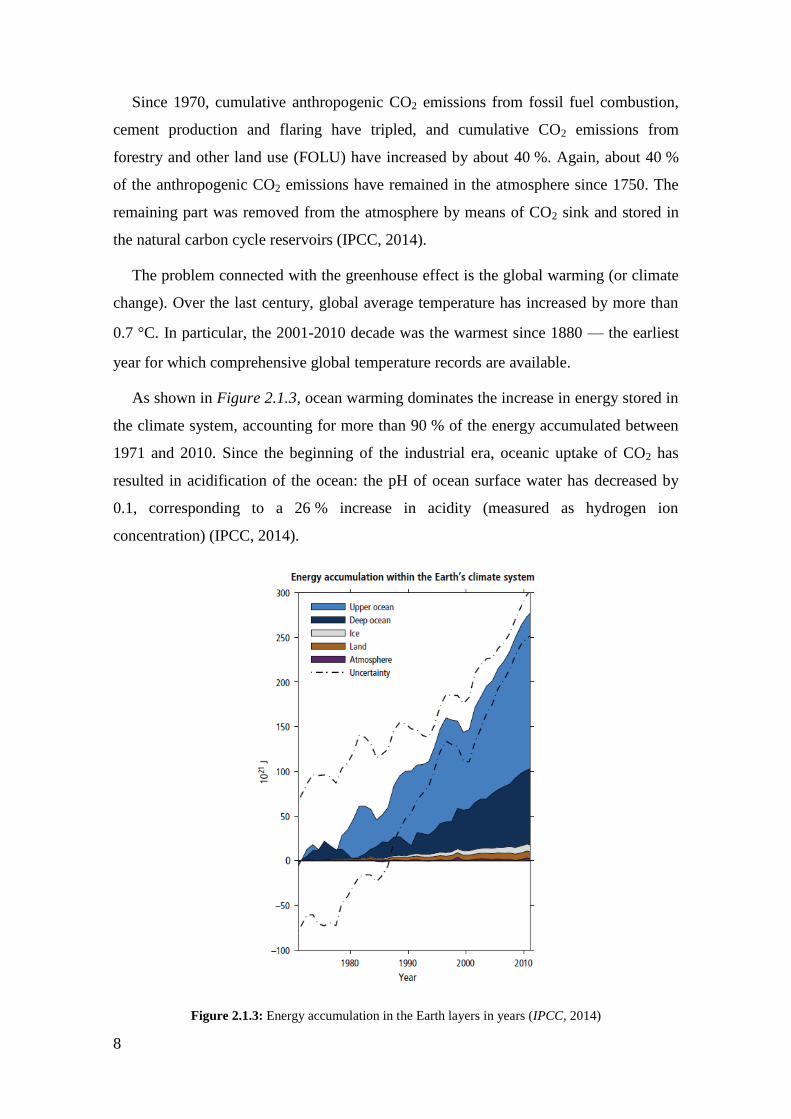
As shown in Figure 2.1.3, ocean warming dominates the increase in energy stored in
the climate system, accounting for more than 90 % of the energy accumulated between
1971 and 2010. Since the beginning of the industrial era, oceanic uptake of CO2 has
resulted in acidification of the ocean: the pH of ocean surface water has decreased by
0.1, corresponding to a 26 % increase in acidity (measured as hydrogen ion
concentration) (IPCC, 2014).
Figure 2.1.3: Energy accumulation in the Earth layers in years (IPCC, 2014)
9
Only about 1 % of the energy has been stored in the atmosphere. This atmosphere
warming has been accompanied by a decrease in very cold days and nights and an
increase in extremely hot days and warm nights (IPCC, 2014).
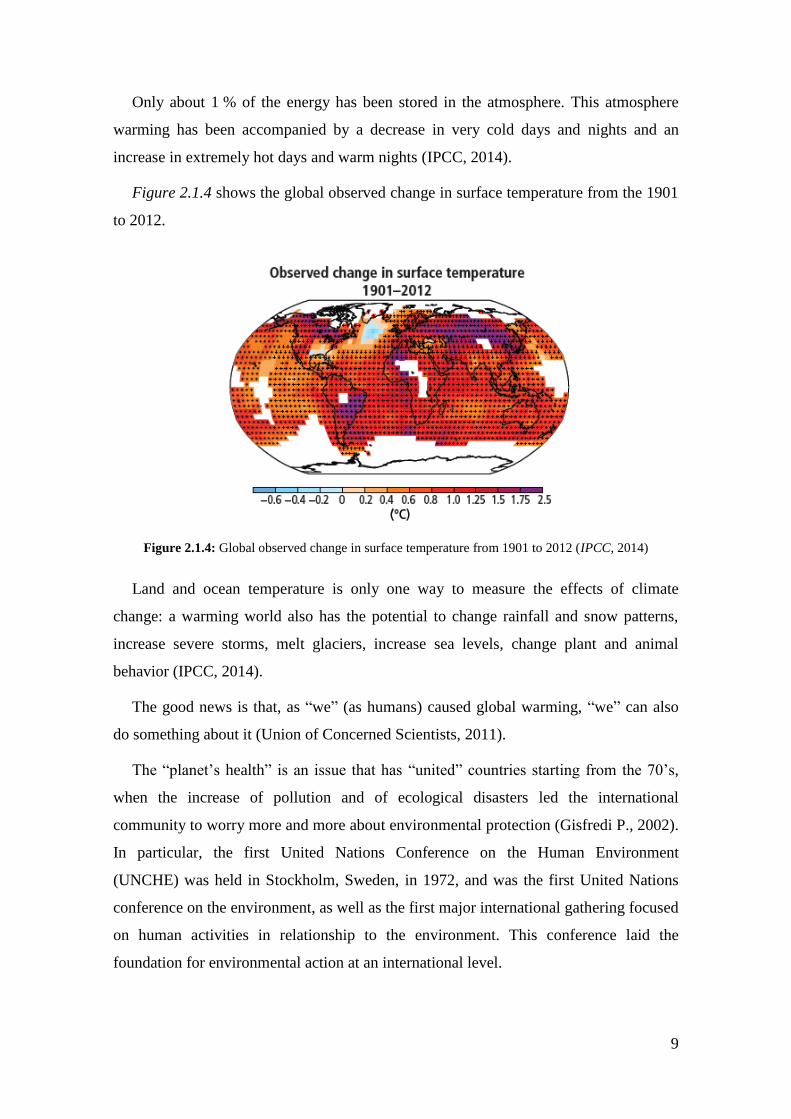
Figure 2.1.4 shows the global observed change in surface temperature from the 1901
to 2012.
Figure 2.1.4: Global observed change in surface temperature from 1901 to 2012 (IPCC, 2014)
Land and ocean temperature is only one way to measure the effects of climate
change: a warming world also has the potential to change rainfall and snow patterns,
increase severe storms, melt glaciers, increase sea levels, change plant and animal
behavior (IPCC, 2014).
The good news is that, as “we” (as humans) caused global warming, “we” can also
do something about it (Union of Concerned Scientists, 2011).
The “planet’s health” is an issue that has “united” countries starting from the 70’s,
when the increase of pollution and of ecological disasters led the international
community to worry more and more about environmental protection (Gisfredi P., 2002).
In particular, the first United Nations Conference on the Human Environment
(UNCHE) was held in Stockholm, Sweden, in 1972, and was the first United Nations
conference on the environment, as well as the first major international gathering focused
on human activities in relationship to the environment. This conference laid the
foundation for environmental action at an international level.
10
Nevertheless, until 80’s, the environmental approach has had a connotation mainly
sectorial and restorative, aimed mainly to remedy the harm caused.
Only since the early 90’s, a new perspective, geared to the prevention and reduction
of eco-disasters, has made its way: during the United Nations Conference on
Environment and Development (UNCED) held in Rio de Janeiro in 1992, solutions,
more sensitive to the social dimension, have taken shape, as well as the need to create
new tools to start a process of sustainable development, aware of the close link between
the environment and development (Federico Antich).
The profile of the world primary energy consumption showed in Figure 2.1.1 is,
probably, partly explained by this constant research of a compromise between the
energy needs and the environmental protection. Another statistical projection shows a
movement in the same direction: the world energy demand is expected to increase by
37 % by 2040, but the development path for a growing world population and economy
is less energy – intensive than it used to be. In IEA’s central scenario, growth in global
demand slows markedly, from above 2 % per year over the last two decades to 1 % per
year after 2025, as a result both “[…] of policy effects, and a structural shift in the
global economy towards services and lighter industrial sectors” (IEA, 2014, a).
Although this is a global behavior, one of the countries that is making the biggest
change towards this direction is China. The BP group’s chief executive considers this as
a “[…] rebalancing of the Chinese economy away from energy intensive sectors [which
is] causing the growth of energy consumption in China to slow to its lowest rate since
1998” (BP Statistical Review of World Energy, 2015, a).
To understand why, it should be considered that, in the last 35 years, this Asian
country has experienced an extraordinary development, focusing on production exports
rather than on domestic consumption. This way, China has managed to grow at an
annual rate of 9.7 %, bringing about 600 million of its citizens out of poverty. At the
outbreak of the global crisis, in 2008, the exports and production in China dropped, as a
result of the decrease in goods demand from the rest of the world, especially United
States and Europe. Beijing authorities have realized that the time had come to abandon
the model of growth based on exports and investment to move to an economy in which
domestic consumption count much more, especially towards services and lighter
industrial sectors (Internazionale, 2015).
11
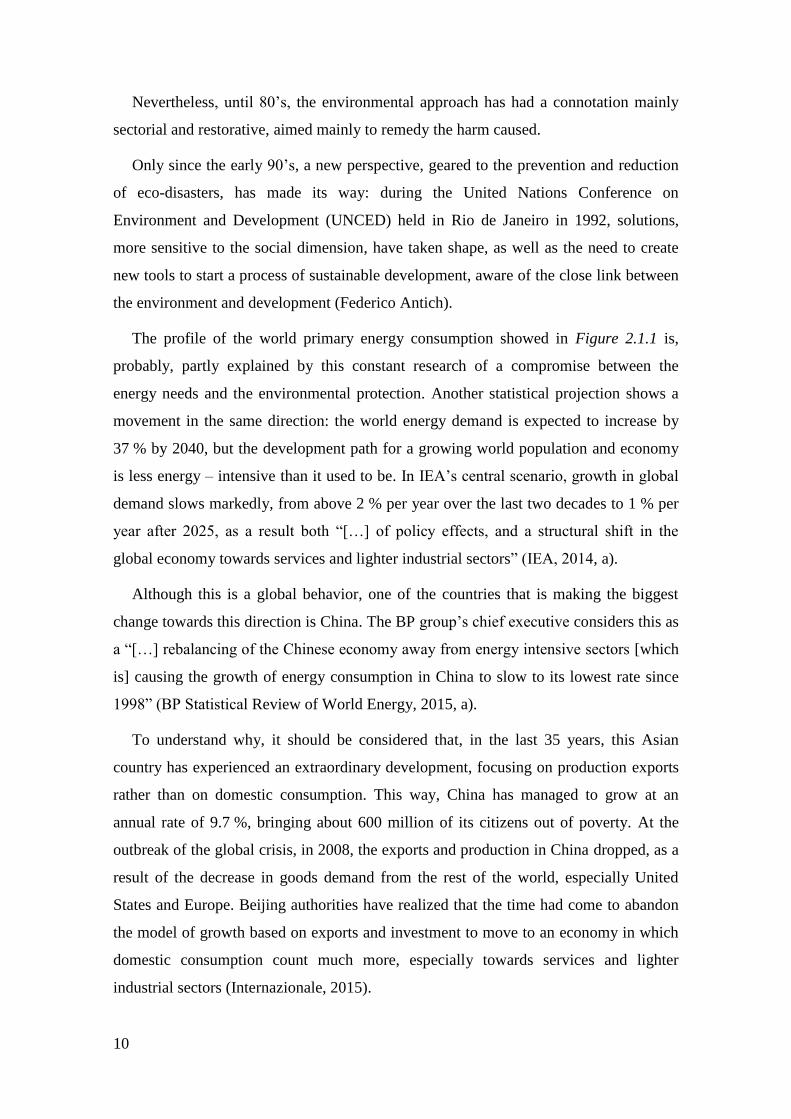
Talking about what happened in 2014 in particular, Figure 2.1.5 shows the regional
world primary energy consumption in 2014.
Figure 2.1.5: Regional world primary energy consumption in 2014, in percentage (adapted from BP
Statistical Review of World Energy, 2015)
Gas is the dominant fuel in Europe & Eurasia and the Middle East, while oil is the
largest source of energy in the America and Africa. The Asia Pacific region accounted
for the largest increment to global primary energy consumption, and for over the 71 %
of global coal consumption for the first time in 2014. Coal still remains the region’s
dominant fuel, due to high exploration of coal mines (BP Statistical Review of World
Energy, 2015).
12
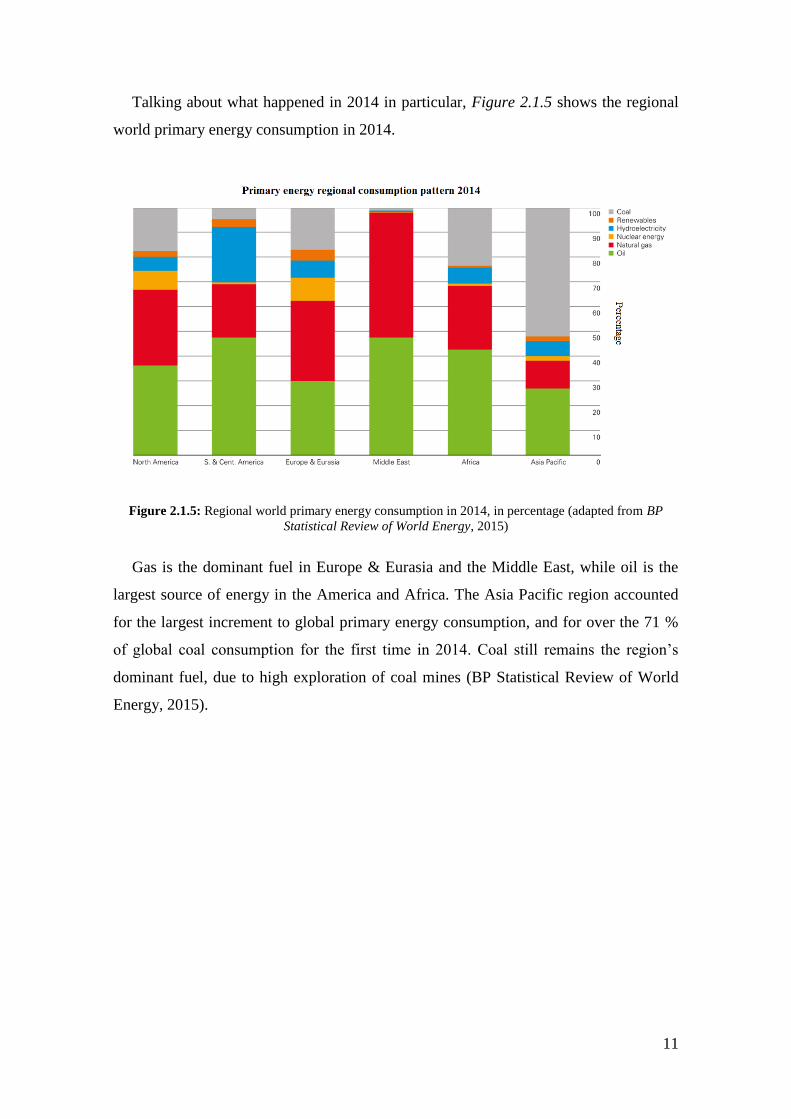
Indeed, as it is shown in Figure 2.1.6, in 2014 Asia Pacific was just the second
region in terms of proved coal reserves, right after Europe & Eurasia.
Figure 2.1.6: Distribution of coal proved reserves in 1994, 2004 and 2014 (adapted from BP Statistical
Review of World Energy, 2015)
Even with this big amount of consumed coal, China recorded the largest increment to
global oil consumption (+ 390.000 b/d), but its consumption growth was still below
average. Therefore, it is clear that China is the world’s largest growth market for
energy, even if, as has already been said, its consumption growth was the slowest since
1998 (BP Statistical Review of World Energy, 2015).
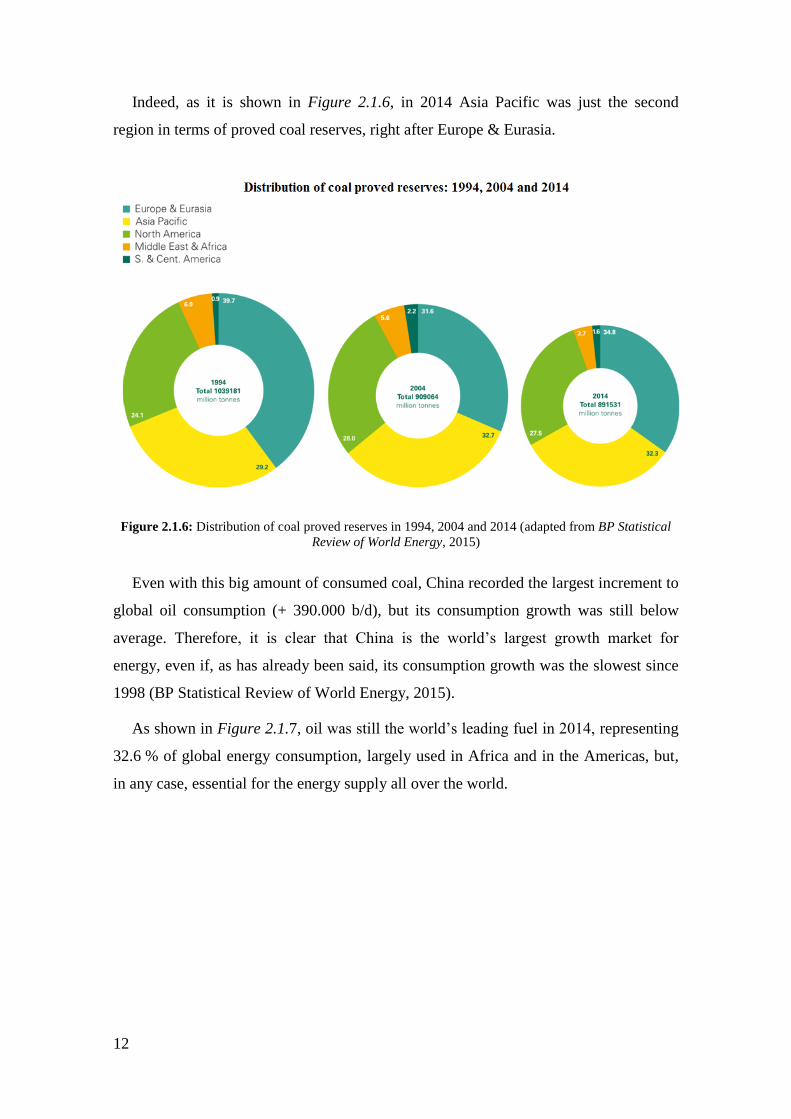
As shown in Figure 2.1.7, oil was still the world’s leading fuel in 2014, representing
32.6 % of global energy consumption, largely used in Africa and in the Americas, but,
in any case, essential for the energy supply all over the world.
13
Figure 2.1.7: Oil production and consumption by region in the last 25 years until 2014 (adapted from BP
Statistical Review of World Energy, 2015)
Oil consumption increased in 2014, but still, its production has increased more than
the consumption: in particular, global oil production growth was more than the double
of the global consumption. In this scenario, the US recorded the largest increase in oil
production in the world, becoming the first country ever to increase average annual
production by at least 1 million barrels per day for three consecutive years. The US
replaced Saudi Arabia as the world’s largest oil producer, and, if this is not enough, the
US growth shale gas production, in the last years, has been also increasing, with the US
surpassing Russia as the world’s largest producer of oil and gas.
As it is clearly visible, fossil fuels are still the most important energy source all over
the world. Anyway, 2014 was an important year for renewables, which were again the
fastest growing form of energy, and accounted for one-third of the increase in total
primary energy use (BP Statistical Review of World Energy, 2015).
14
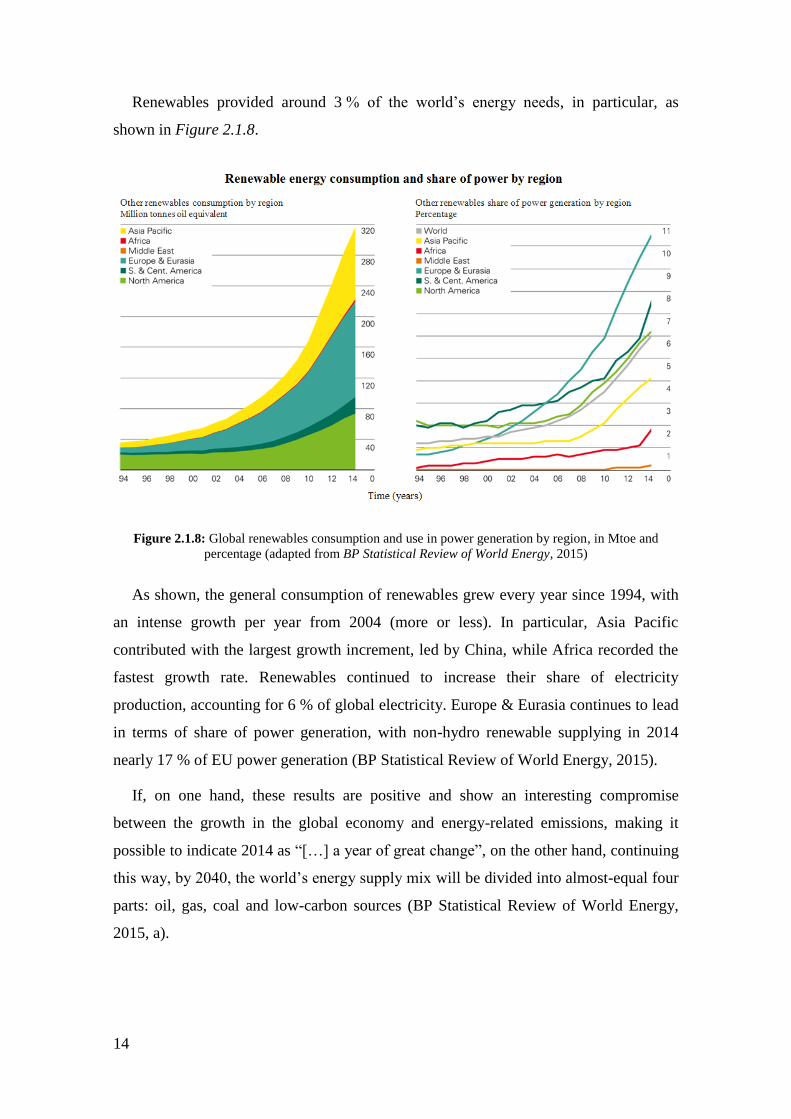
Renewables provided around 3 % of the world’s energy needs, in particular, as
shown in Figure 2.1.8.
Figure 2.1.8: Global renewables consumption and use in power generation by region, in Mtoe and
percentage (adapted from BP Statistical Review of World Energy, 2015)
As shown, the general consumption of renewables grew every year since 1994, with
an intense growth per year from 2004 (more or less). In particular, Asia Pacific
contributed with the largest growth increment, led by China, while Africa recorded the
fastest growth rate. Renewables continued to increase their share of electricity
production, accounting for 6 % of global electricity. Europe & Eurasia continues to lead
in terms of share of power generation, with non-hydro renewable supplying in 2014
nearly 17 % of EU power generation (BP Statistical Review of World Energy, 2015).
If, on one hand, these results are positive and show an interesting compromise
between the growth in the global economy and energy-related emissions, making it
possible to indicate 2014 as “[…] a year of great change”, on the other hand, continuing
this way, by 2040, the world’s energy supply mix will be divided into almost-equal four
parts: oil, gas, coal and low-carbon sources (BP Statistical Review of World Energy,
2015, a).
15
This puts the world on a path consistent with a long-term global average temperature
increase of 3.6 °C, far from the 2 °C temperature increase limit, a goal that has been
internationally agreed to avert the most severe and widespread implications of climate
change. To reach the goal, IPCC declared that the world cannot emit more than around
1000 Gigatonnes of CO2 from 2014 onwards. So, this objective requires urgent action to
steer the energy system on to a safer path (IPCC, 2014).
2.2 Water electrolysis
Electrolysis of water consists in the dissociation of water (H2O) into two components
in gaseous state, which are oxygen (O2) and hydrogen (H2). This dissociation is possible
due to an electric current that passes through the water (Guerra, 2015).
2.2.1 Historical background
The history of water electrolysis started in the year 1800, in the middle of the first
industrial revolution, when Nicholson and Carlisle discovered the ability of
decomposing electrolytical water. Since that year, a lot of technological progresses were
made and several ways were discovered to use the produced hydrogen.
16
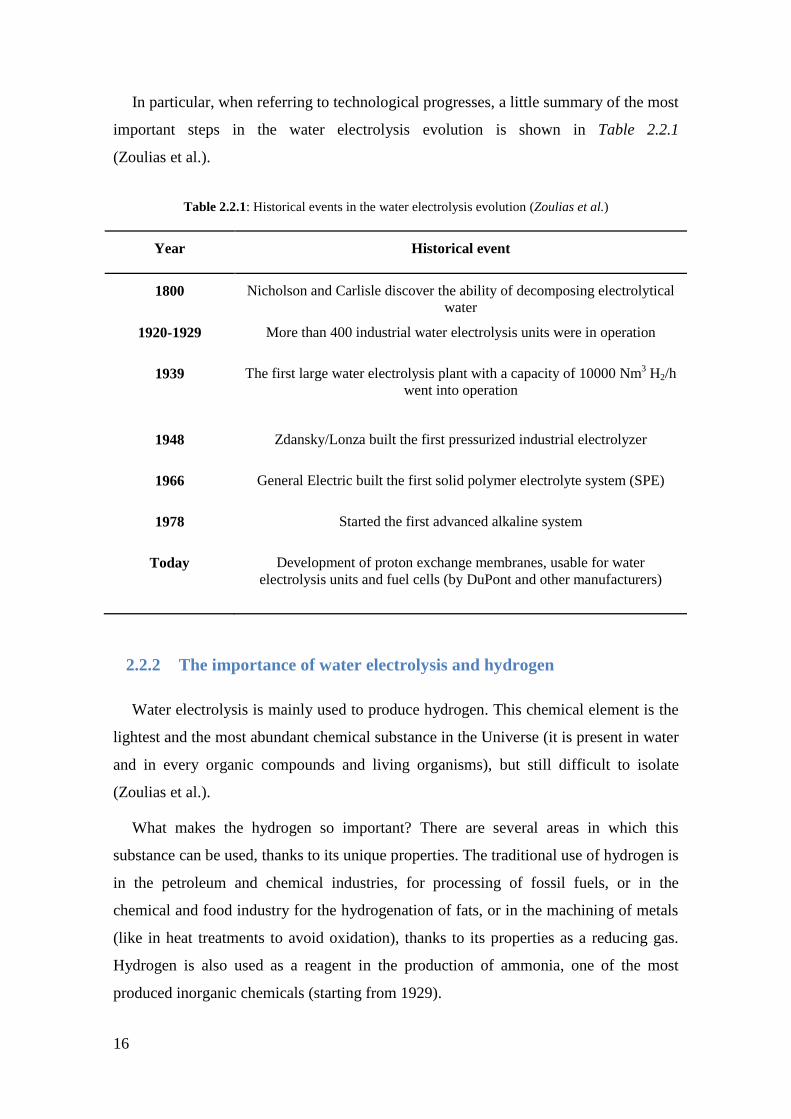
In particular, when referring to technological progresses, a little summary of the most
important steps in the water electrolysis evolution is shown in Table 2.2.1
(Zoulias et al.).
Table 2.2.1: Historical events in the water electrolysis evolution (Zoulias et al.)
Year Historical event
1800 Nicholson and Carlisle discover the ability of decomposing electrolytical
water
1920-1929 More than 400 industrial water electrolysis units were in operation
1939 The first large water electrolysis plant with a capacity of 10000 Nm3 H2/h
went into operation
1948 Zdansky/Lonza built the first pressurized industrial electrolyzer
1966 General Electric built the first solid polymer electrolyte system (SPE)
1978 Started the first advanced alkaline system
Today Development of proton exchange membranes, usable for water
electrolysis units and fuel cells (by DuPont and other manufacturers)
2.2.2 The importance of water electrolysis and hydrogen
Water electrolysis is mainly used to produce hydrogen. This chemical element is the
lightest and the most abundant chemical substance in the Universe (it is present in water
and in every organic compounds and living organisms), but still difficult to isolate
(Zoulias et al.).
What makes the hydrogen so important? There are several areas in which this
substance can be used, thanks to its unique properties. The traditional use of hydrogen is
in the petroleum and chemical industries, for processing of fossil fuels, or in the
chemical and food industry for the hydrogenation of fats, or in the machining of metals
(like in heat treatments to avoid oxidation), thanks to its properties as a reducing gas.
Hydrogen is also used as a reagent in the production of ammonia, one of the most
produced inorganic chemicals (starting from 1929).
17
More recently, hydrogen has been used as an energy carrier in fuel cells, which are
devices able to convert hydrogen and oxygen directly into electricity in a more efficient
way, if compared to internal combustion engines. This recent innovation is useful to
distribute energy in places difficult to reach (Guerra, 2015).
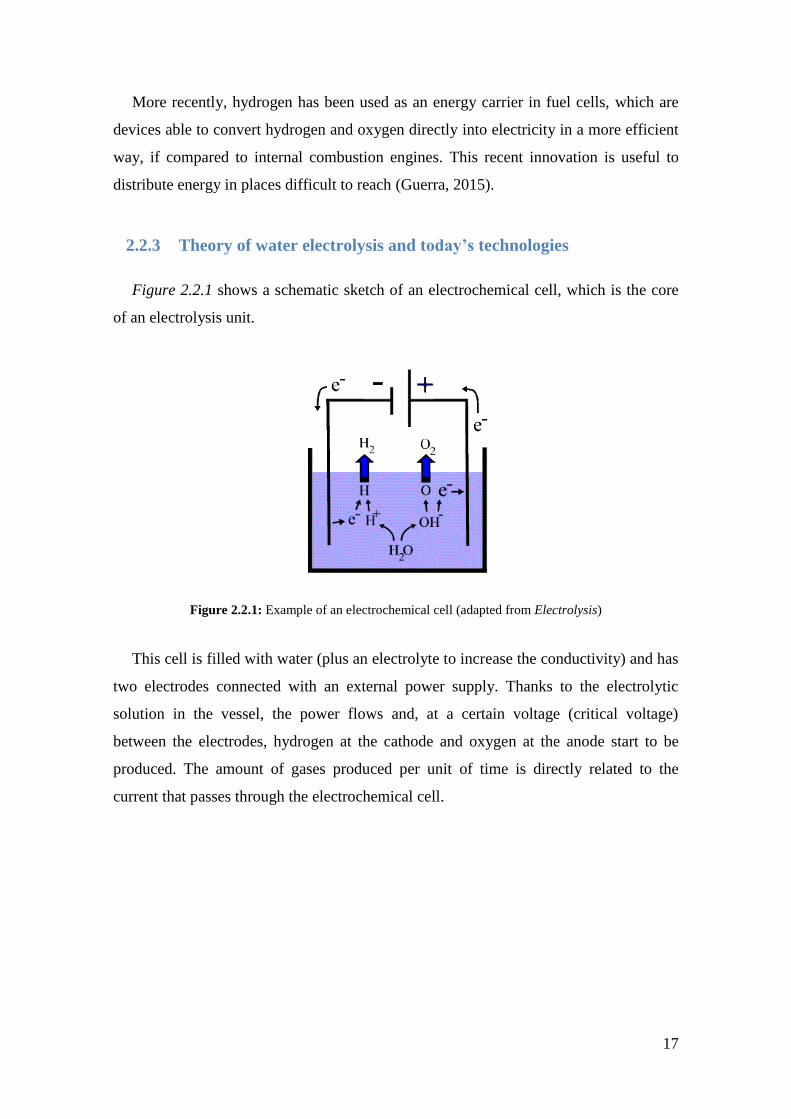
2.2.3 Theory of water electrolysis and today’s technologies
Figure 2.2.1 shows a schematic sketch of an electrochemical cell, which is the core
of an electrolysis unit.
Figure 2.2.1: Example of an electrochemical cell (adapted from Electrolysis)
This cell is filled with water (plus an electrolyte to increase the conductivity) and has
two electrodes connected with an external power supply. Thanks to the electrolytic
solution in the vessel, the power flows and, at a certain voltage (critical voltage)
between the electrodes, hydrogen at the cathode and oxygen at the anode start to be
produced. The amount of gases produced per unit of time is directly related to the
current that passes through the electrochemical cell.
18
The reactions that occur in the vessel are:
H2O (l) H+ (aq) + OH
- (aq) Reaction that automatically occurs in a certain
extension in water, and is increased by the power
flowing
(2.1)
4OH- 2H2O + O2 + 4e
- Reaction that occurs at the positive electrode (anode) (2.2)
2H+ + 2e
- H2 Reaction that occurs at the negative electrode
(cathode)
(2.3)
In water electrolysis there are no side reactions, which may result in byproducts, so
the net balance is (Zoulias et al.):
2H2O O2 + 2H2 (2.4)
Nowadays, there are three main water electrolysis technologies: alkaline electrolysis,
proton exchange membrane (PEM) electrolysis and solid oxide electrolysis cell (SOEC)
electrolysis (Guerra, 2015).
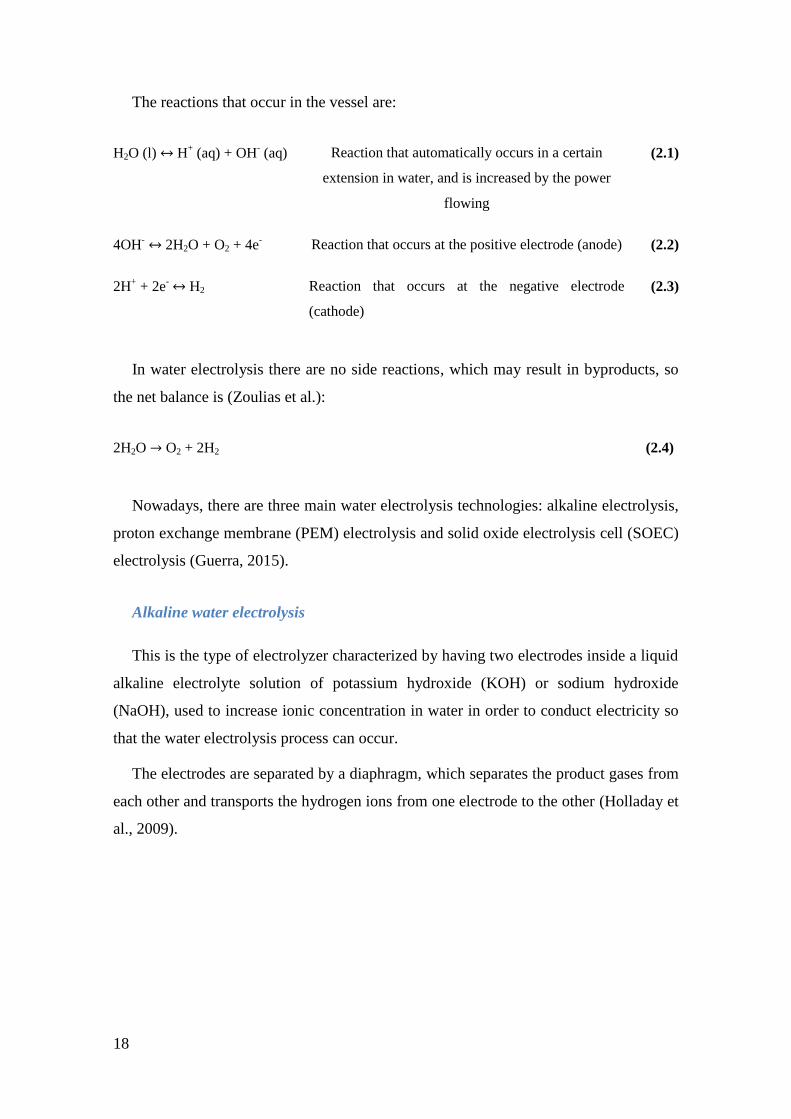
Alkaline water electrolysis
This is the type of electrolyzer characterized by having two electrodes inside a liquid
alkaline electrolyte solution of potassium hydroxide (KOH) or sodium hydroxide
(NaOH), used to increase ionic concentration in water in order to conduct electricity so
that the water electrolysis process can occur.
The electrodes are separated by a diaphragm, which separates the product gases from
each other and transports the hydrogen ions from one electrode to the other (Holladay et
al., 2009).
19
Figure 2.2.2 represents a schematic sketch of an alkaline electrochemical cell.
Figure 2.2.2: Alkaline electrochemical cell (Adapted from Free energy: the secret they can’t kill)
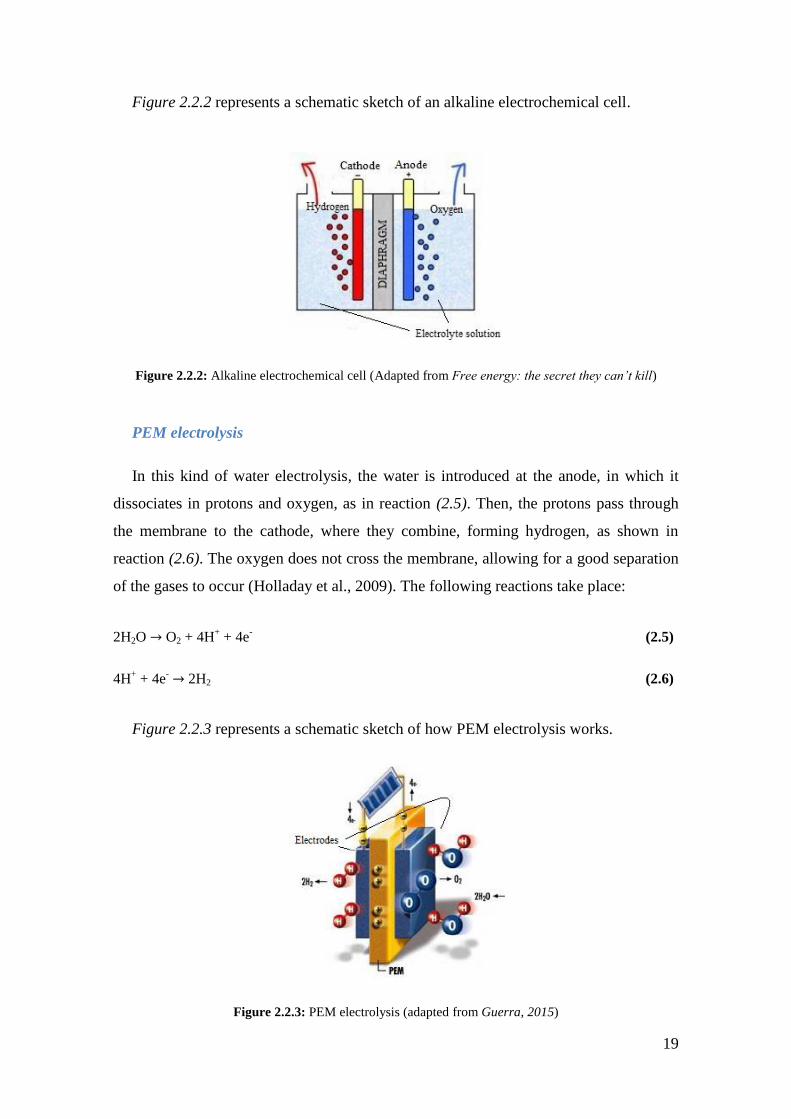
PEM electrolysis
In this kind of water electrolysis, the water is introduced at the anode, in which it
dissociates in protons and oxygen, as in reaction (2.5). Then, the protons pass through
the membrane to the cathode, where they combine, forming hydrogen, as shown in
reaction (2.6). The oxygen does not cross the membrane, allowing for a good separation
of the gases to occur (Holladay et al., 2009). The following reactions take place:
2H2O O2 + 4H+ + 4e
- (2.5)
4H+ + 4e
- 2H2 (2.6)
Figure 2.2.3 represents a schematic sketch of how PEM electrolysis works.
Figure 2.2.3: PEM electrolysis (adapted from Guerra, 2015)
20
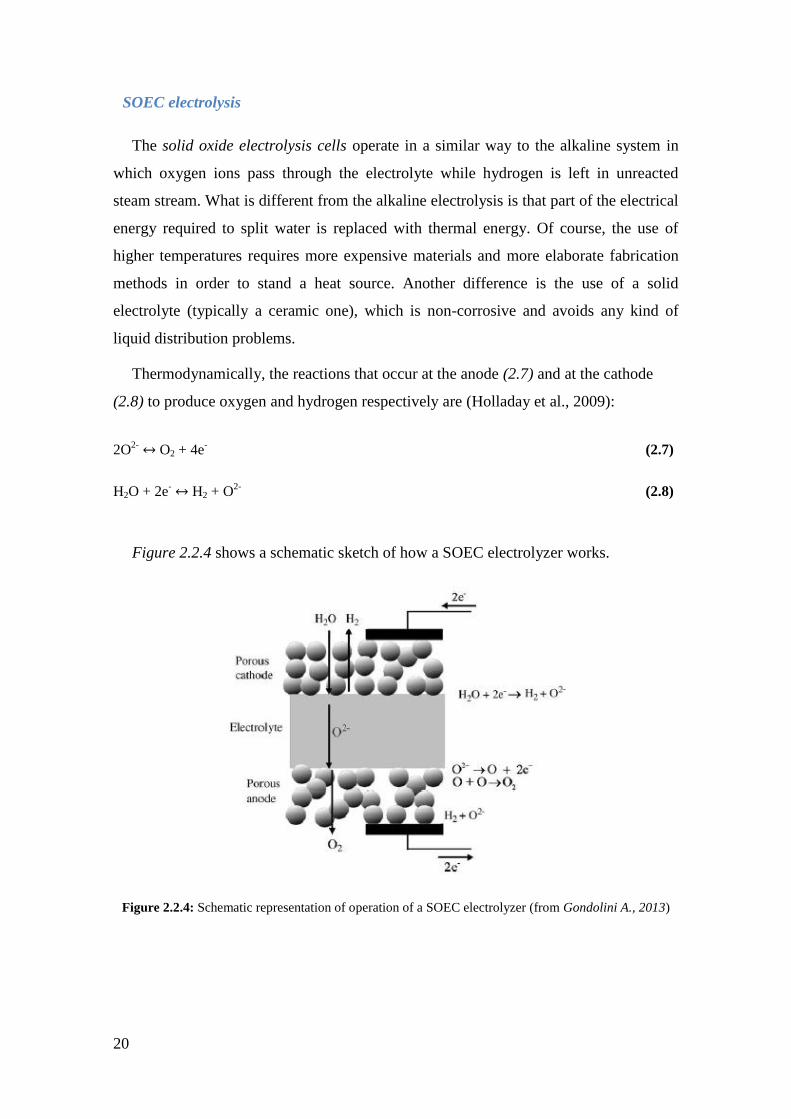
SOEC electrolysis
The solid oxide electrolysis cells operate in a similar way to the alkaline system in
which oxygen ions pass through the electrolyte while hydrogen is left in unreacted
steam stream. What is different from the alkaline electrolysis is that part of the electrical
energy required to split water is replaced with thermal energy. Of course, the use of
higher temperatures requires more expensive materials and more elaborate fabrication
methods in order to stand a heat source. Another difference is the use of a solid
electrolyte (typically a ceramic one), which is non-corrosive and avoids any kind of
liquid distribution problems.
Thermodynamically, the reactions that occur at the anode (2.7) and at the cathode
(2.8) to produce oxygen and hydrogen respectively are (Holladay et al., 2009):
2O2-
O2 + 4e-
(2.7)
H2O + 2e- H2 + O
2- (2.8)
Figure 2.2.4 shows a schematic sketch of how a SOEC electrolyzer works.
Figure 2.2.4: Schematic representation of operation of a SOEC electrolyzer (from Gondolini A., 2013)
21
2.3 Synthesis gas
“Synthesis gas” (syngas) refers to a mixture of hydrogen, carbon monoxide and
carbon dioxide in variable percentage. It is a mixture that cannot be burnt directly, but is
used as a fuel source or as an intermediate to produce other chemicals. Syngas is known
since 1792, when William Murdoch used it to light his house in Redruth, and then, in
1820, it was used to illuminate Paris.
When electricity and fossil fuels were discovered, syngas started to lose economic
interest. This trend changed again with the Second World War (1939-1945), when it
became important as direct fuel or as a raw material to produce liquid fuels for countries
with access to coal and hydrocarbons stocks (Rodrigues, 2013, a).
2.3.1 Technologies of production of synthesis gas
The technologies to produce synthesis gas from substances containing carbon are:
- Reforming of natural gas, known as Steam Methane Reforming (SMR);
- Partial oxidation of hydrocarbons;
- Gasification of coal or biomass;
- Co-electrolysis of water.
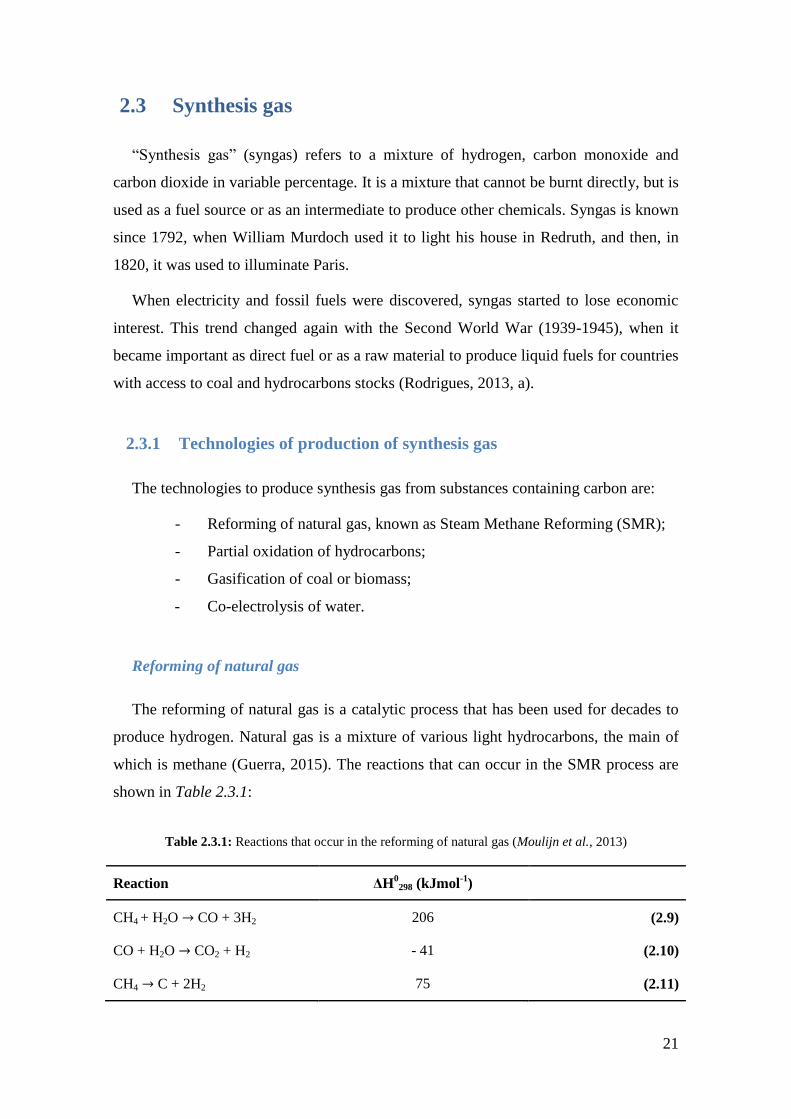
Reforming of natural gas
The reforming of natural gas is a catalytic process that has been used for decades to
produce hydrogen. Natural gas is a mixture of various light hydrocarbons, the main of
which is methane (Guerra, 2015). The reactions that can occur in the SMR process are
shown in Table 2.3.1:
Table 2.3.1: Reactions that occur in the reforming of natural gas (Moulijn et al., 2013)
Reaction ΔH0
298 (kJmol-1
)
CH4 + H2O CO + 3H2 206 (2.9)
CO + H2O CO2 + H2 - 41 (2.10)
CH4 C + 2H2 75 (2.11)
22
The first reaction that takes place is (2.9), at T 700-1100 °C, P 27 bar, and on a
Nickel based catalyst, with production of syngas. Reaction (2.10), called water-gas shift
reaction (WGSR), can occur as well, starting from the CO produced in reaction (2.9),
promoted with a catalyst of iron oxide. Reaction (2.11) is an undesired reaction, which
leads to the production of coke and can be avoided by using an excess of hydrogen in
the SMR reaction (Moulijn et al., 2013).
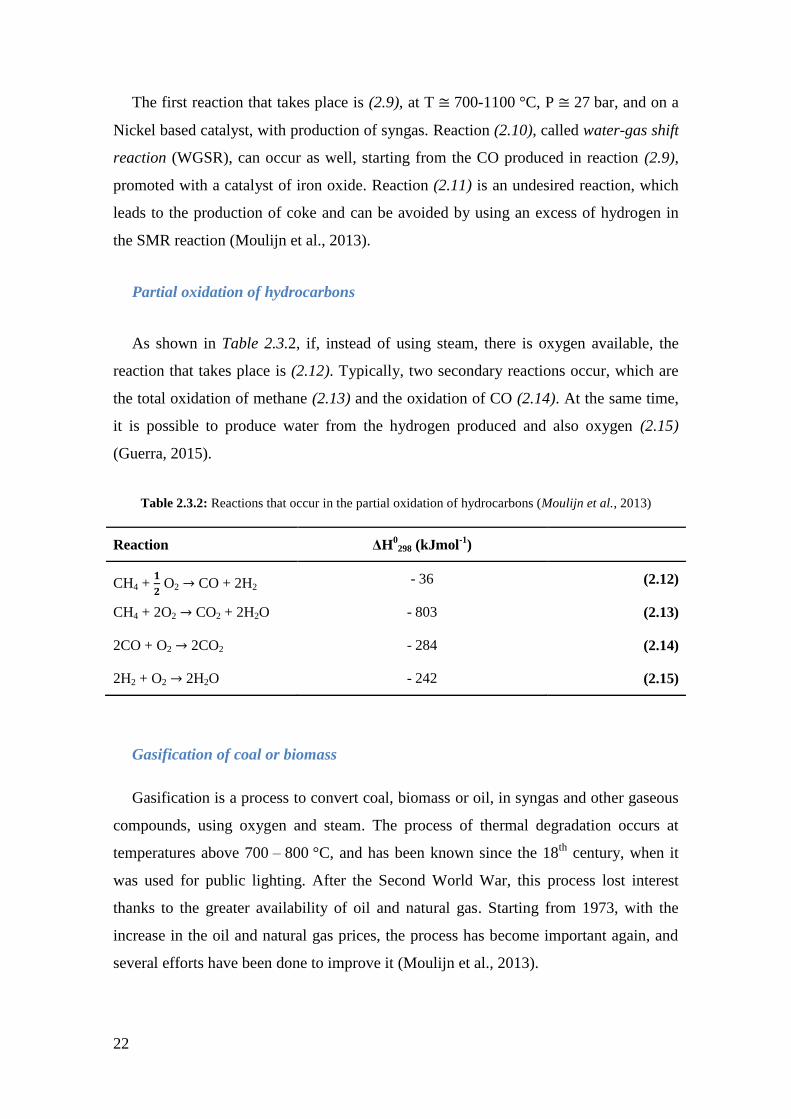
Partial oxidation of hydrocarbons
As shown in Table 2.3.2, if, instead of using steam, there is oxygen available, the
reaction that takes place is (2.12). Typically, two secondary reactions occur, which are
the total oxidation of methane (2.13) and the oxidation of CO (2.14). At the same time,
it is possible to produce water from the hydrogen produced and also oxygen (2.15)
(Guerra, 2015).
Table 2.3.2: Reactions that occur in the partial oxidation of hydrocarbons (Moulijn et al., 2013)
Reaction ΔH0
298 (kJmol-1
)
CH4 +
O2 CO + 2H2 - 36 (2.12)
CH4 + 2O2 CO2 + 2H2O - 803 (2.13)
2CO + O2 2CO2 - 284 (2.14)
2H2 + O2 2H2O - 242 (2.15)
Gasification of coal or biomass
Gasification is a process to convert coal, biomass or oil, in syngas and other gaseous
compounds, using oxygen and steam. The process of thermal degradation occurs at
temperatures above 700 – 800 °C, and has been known since the 18th
century, when it
was used for public lighting. After the Second World War, this process lost interest
thanks to the greater availability of oil and natural gas. Starting from 1973, with the
increase in the oil and natural gas prices, the process has become important again, and
several efforts have been done to improve it (Moulijn et al., 2013).
23
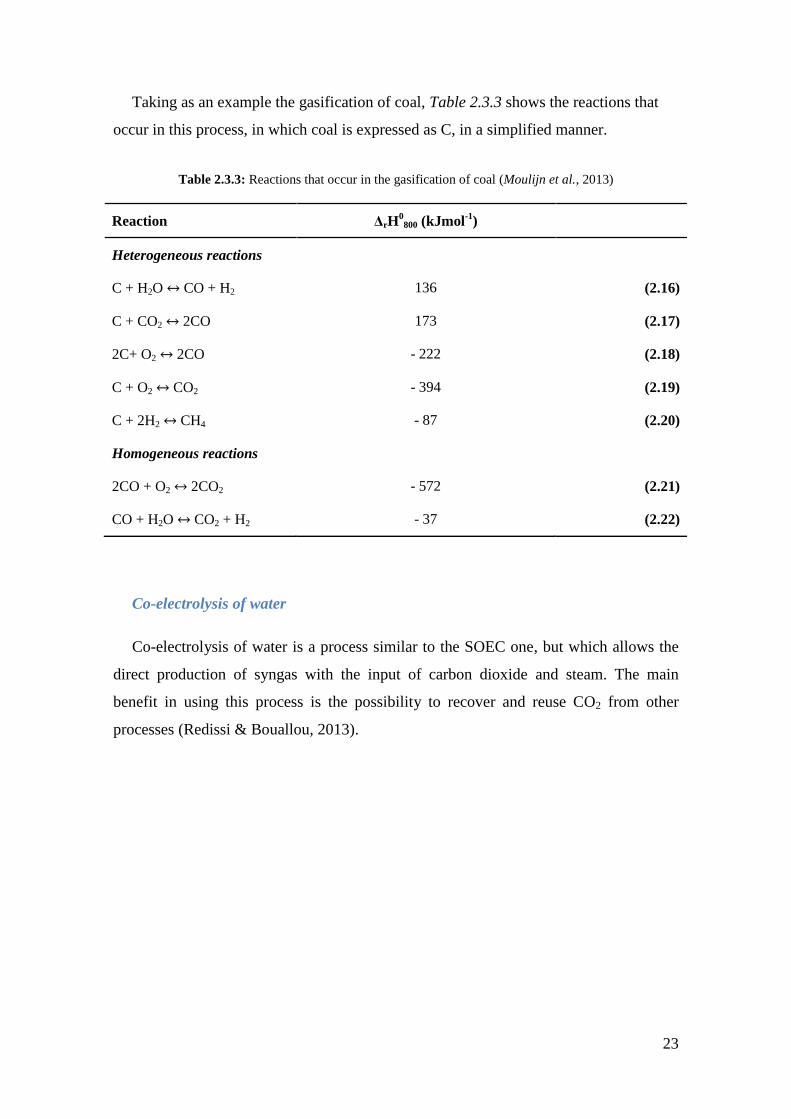
Taking as an example the gasification of coal, Table 2.3.3 shows the reactions that
occur in this process, in which coal is expressed as C, in a simplified manner.
Table 2.3.3: Reactions that occur in the gasification of coal (Moulijn et al., 2013)
Reaction ΔrH0800 (kJmol
-1)
Heterogeneous reactions
C + H2O CO + H2 136 (2.16)
C + CO2 2CO 173 (2.17)
2C+ O2 2CO - 222 (2.18)
C + O2 CO2 - 394 (2.19)
C + 2H2 CH4 - 87 (2.20)
Homogeneous reactions
2CO + O2 2CO2 - 572 (2.21)
CO + H2O CO2 + H2 - 37 (2.22)
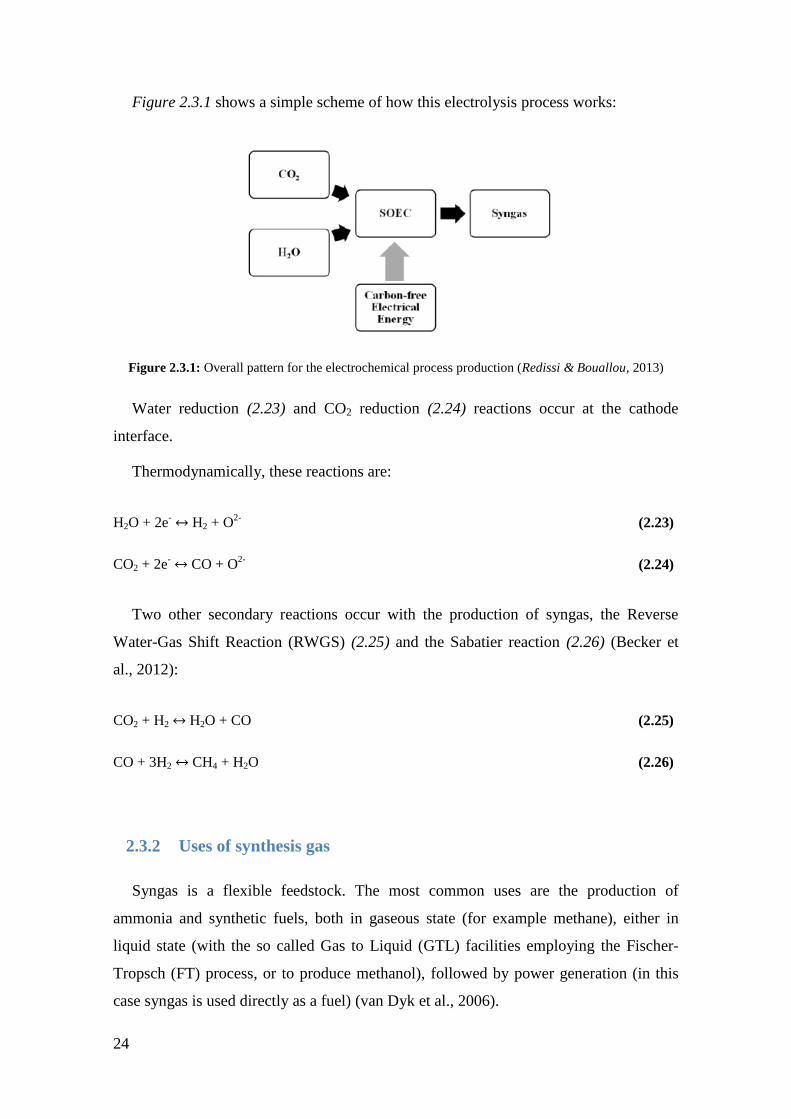
Co-electrolysis of water
Co-electrolysis of water is a process similar to the SOEC one, but which allows the
direct production of syngas with the input of carbon dioxide and steam. The main
benefit in using this process is the possibility to recover and reuse CO2 from other
processes (Redissi & Bouallou, 2013).
24
Figure 2.3.1 shows a simple scheme of how this electrolysis process works:
Figure 2.3.1: Overall pattern for the electrochemical process production (Redissi & Bouallou, 2013)
Water reduction (2.23) and CO2 reduction (2.24) reactions occur at the cathode
interface.
Thermodynamically, these reactions are:
H2O + 2e- H2 + O
2- (2.23)
CO2 + 2e- CO + O
2- (2.24)
Two other secondary reactions occur with the production of syngas, the Reverse
Water-Gas Shift Reaction (RWGS) (2.25) and the Sabatier reaction (2.26) (Becker et
al., 2012):
CO2 + H2 H2O + CO (2.25)
CO + 3H2 CH4 + H2O (2.26)
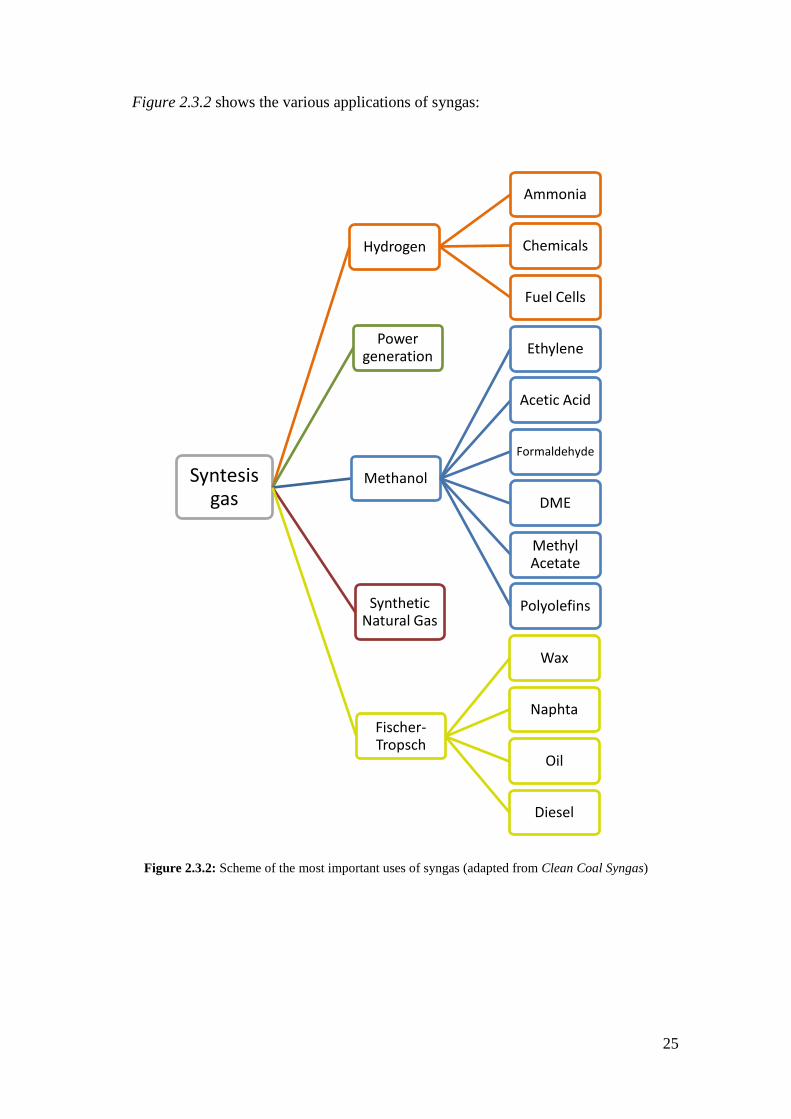
2.3.2 Uses of synthesis gas
Syngas is a flexible feedstock. The most common uses are the production of
ammonia and synthetic fuels, both in gaseous state (for example methane), either in
liquid state (with the so called Gas to Liquid (GTL) facilities employing the Fischer-
Tropsch (FT) process, or to produce methanol), followed by power generation (in this
case syngas is used directly as a fuel) (van Dyk et al., 2006).
25
Figure 2.3.2 shows the various applications of syngas:
Figure 2.3.2: Scheme of the most important uses of syngas (adapted from Clean Coal Syngas)
Syntesis gas
Hydrogen
Ammonia
Chemicals
Fuel Cells
Power generation
Methanol
Ethylene
Acetic Acid
Formaldehyde
DME
Methyl Acetate
Polyolefins Synthetic Natural Gas
Fischer-Tropsch
Wax
Naphta
Oil
Diesel
26
2.4 Production of synthetic fuels from syngas
Synthetic fuels are liquid or gaseous fuels obtained from gasification of solid
feedstocks such as biomass or coal or by reforming of natural gas. The conversion can
happen in a direct way, where the fuel is produced directly from the feedstocks, or in an
indirect way, in which, in an intermediate step, syngas is produced (Wikipedia, 2016).
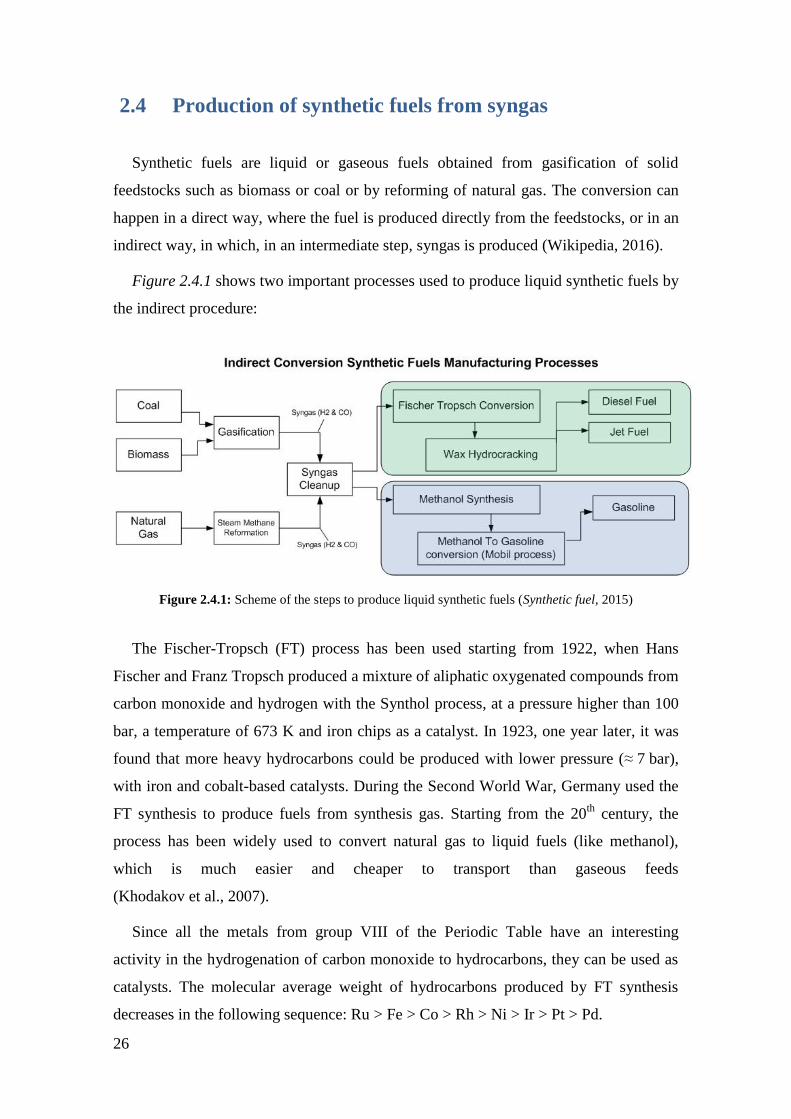
Figure 2.4.1 shows two important processes used to produce liquid synthetic fuels by
the indirect procedure:
Figure 2.4.1: Scheme of the steps to produce liquid synthetic fuels (Synthetic fuel, 2015)
The Fischer-Tropsch (FT) process has been used starting from 1922, when Hans
Fischer and Franz Tropsch produced a mixture of aliphatic oxygenated compounds from
carbon monoxide and hydrogen with the Synthol process, at a pressure higher than 100
bar, a temperature of 673 K and iron chips as a catalyst. In 1923, one year later, it was
found that more heavy hydrocarbons could be produced with lower pressure (≈ 7 bar),
with iron and cobalt-based catalysts. During the Second World War, Germany used the
FT synthesis to produce fuels from synthesis gas. Starting from the 20th
century, the
process has been widely used to convert natural gas to liquid fuels (like methanol),
which is much easier and cheaper to transport than gaseous feeds
(Khodakov et al., 2007).
Since all the metals from group VIII of the Periodic Table have an interesting
activity in the hydrogenation of carbon monoxide to hydrocarbons, they can be used as
catalysts. The molecular average weight of hydrocarbons produced by FT synthesis
decreases in the following sequence: Ru > Fe > Co > Rh > Ni > Ir > Pt > Pd.
27
Only ruthenium, iron, cobalt and nickel have catalytic characteristics which allow
considering them for commercial production. Since nickel catalysts produce too much
methane, ruthenium is too expensive and there are not enough worldwide reserves for
large-scale industry, cobalt and iron are the metals proposed by Fischer and Tropsch for
the syngas conversion (Khodakov et al., 2007).
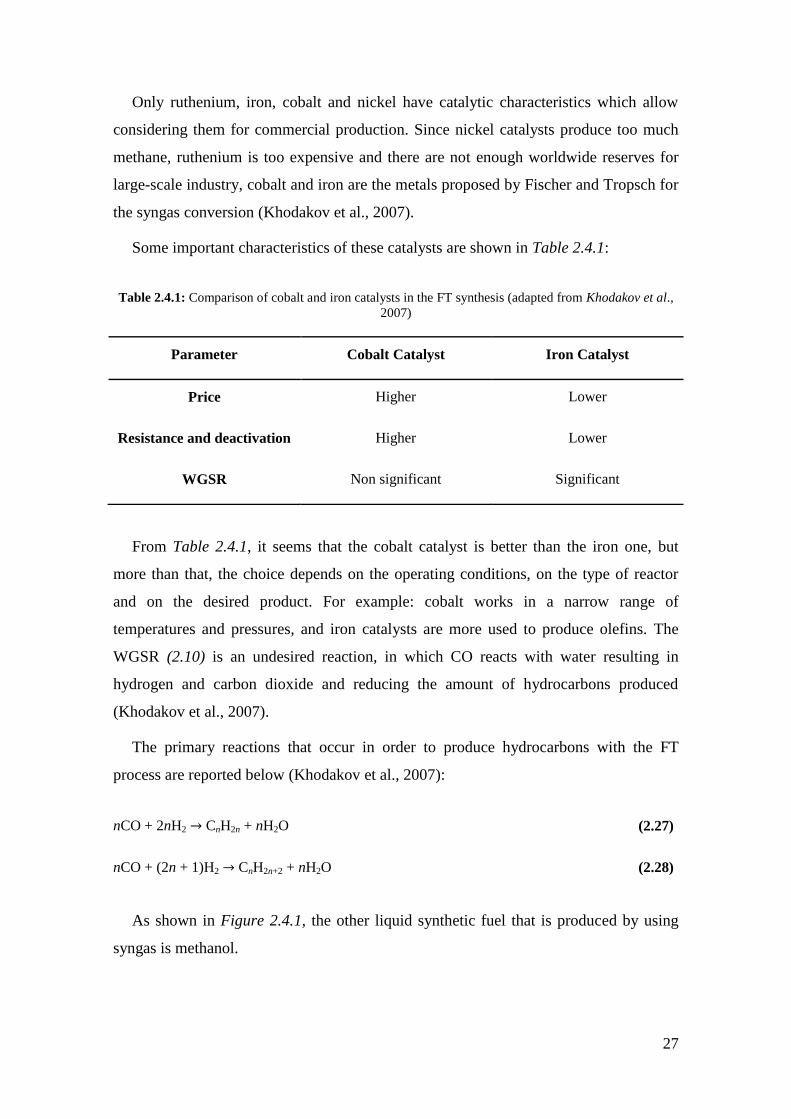
Some important characteristics of these catalysts are shown in Table 2.4.1:
Table 2.4.1: Comparison of cobalt and iron catalysts in the FT synthesis (adapted from Khodakov et al.,
2007)
Parameter Cobalt Catalyst Iron Catalyst
Price Higher Lower
Resistance and deactivation Higher Lower
WGSR Non significant Significant
From Table 2.4.1, it seems that the cobalt catalyst is better than the iron one, but
more than that, the choice depends on the operating conditions, on the type of reactor
and on the desired product. For example: cobalt works in a narrow range of
temperatures and pressures, and iron catalysts are more used to produce olefins. The
WGSR (2.10) is an undesired reaction, in which CO reacts with water resulting in
hydrogen and carbon dioxide and reducing the amount of hydrocarbons produced
(Khodakov et al., 2007).
The primary reactions that occur in order to produce hydrocarbons with the FT
process are reported below (Khodakov et al., 2007):
nCO + 2nH2 CnH2n + nH2O (2.27)
nCO + (2n + 1)H2 CnH2n+2 + nH2O (2.28)
As shown in Figure 2.4.1, the other liquid synthetic fuel that is produced by using
syngas is methanol.
28
2.4.1 Methanol production and applications
Also called methyl alcohol, it is a light, volatile, colorless, toxic and flammable
liquid with an odor very similar to the one of ethanol. It is used as an antifreeze agent, a
solvent, a denaturant for ethanol, as raw material to produce several chemical products
like MTBE (Methyl Tert-Butyl Ether), formaldehyde, acetic acid, dimethyl
terephthalate, DME (Dimethyl-Ether) etc., in addition to its quite new role of being a
fuel. In effect, starting from the 1970s energy crisis and environmental considerations,
clean fuels like methanol have started to be taken into serious consideration. Economic
factors are also important, with methanol providing more efficient combustion and
being able to compete with gasoline and other synthetic fuels in predicted costs and
conversion efficiency. It does not produce undesirable emissions and does not
contribute in generating nitrogen oxides (NOx) in exhaust gases. It burns cleaner and at
lower temperatures than most oil derived fuels. These characteristics make methanol
suitable as a turbine fuel for distributed electricity generation as well as for automotive
(ENEA, 2011).
Methanol is believed to have been discovered by Robert Boyle in 1661, but there is
nothing to substantiate its use before the 19th
century. Its molecular structure was first
established by Dumas and Peligot in 1834. It was first synthesized by Berthelot in 1857,
and since then it has been called “wood spirit”, because it was then produced by the dry
distillation of wood. This process was used industrially, since the German industry
BASF (Badische Anilin und Soda Fabrik), patented the process to produce methanol at
300-400°C and 100-250 atm over the zinc/chromium oxide catalyst in 1923: it was the
first plant to produce methanol from synthesis gas, and it totally superseded the
previous way of production. At the same time, some Italian patents were registered,
from Luigi Casale (1882-1927), for SIRI (Società Italiana Ricerche Industriali) (ENEA,
2011).
Since the end of the Second World War, a lot of new efforts have been made to
improve the process, like the realization, in England, of the first low pressure plants
(LPM, Low Pressure Methanol process), with considerable energy savings and less
production of by-products, with a change in the catalysts used in the process, both
homogeneous and heterogeneous (Lee, 1990).
29
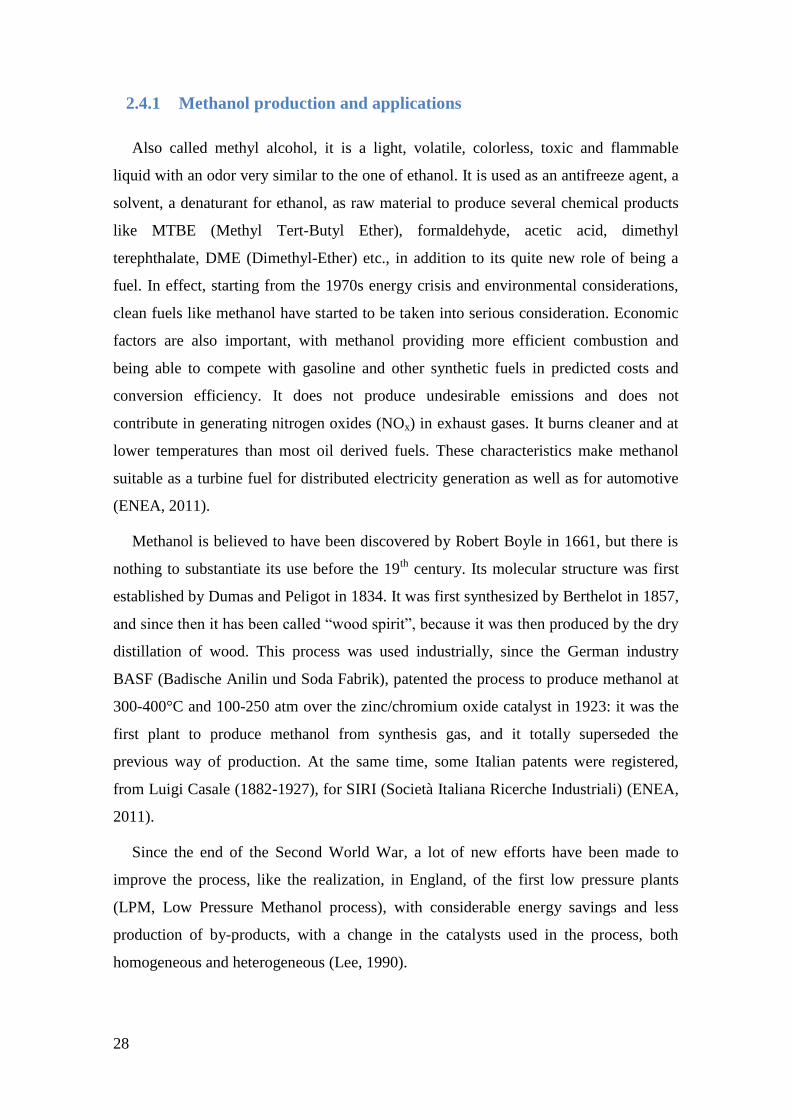
Some heterogeneous processes and their reaction conditions are listed in Table 2.4.2:
Table 2.4.2: List of some of the heterogeneous processes for CH3OH manufacture (Lee, 1990)
Process Catalyst T (°C) P (atm)
Nissui-Topsoe CuO-ZnO-Cr2O3 230-260 100-150
BASF CuO-ZnO-Al2O3 200-350 50-250
ICI CuO-ZnO-Al2O3 220-280 50-100
Lurgi CuO-ZnO 230-250 40-50
Chem. Systems CuO-ZnO-Al2O3 250-275 50-120
Note: The catalyst compositions are given in the oxidized forms. To activatethe catalyst,
proper reduction must be carried out.
Today the commercial synthesis of methanol is exclusively based on heterogeneous
systems. Recently, to improve the refrigeration of the reactor, the catalyst has been
pulverized and mixed with an inert mineral oil that promotes the thermal exchange. This
new liquid phase methanol synthesis process, called LPMeOH TM
(Liquid-Phase
Methanol), is still under development, but the technology can now be considered
commercial (ENEA, 2011).
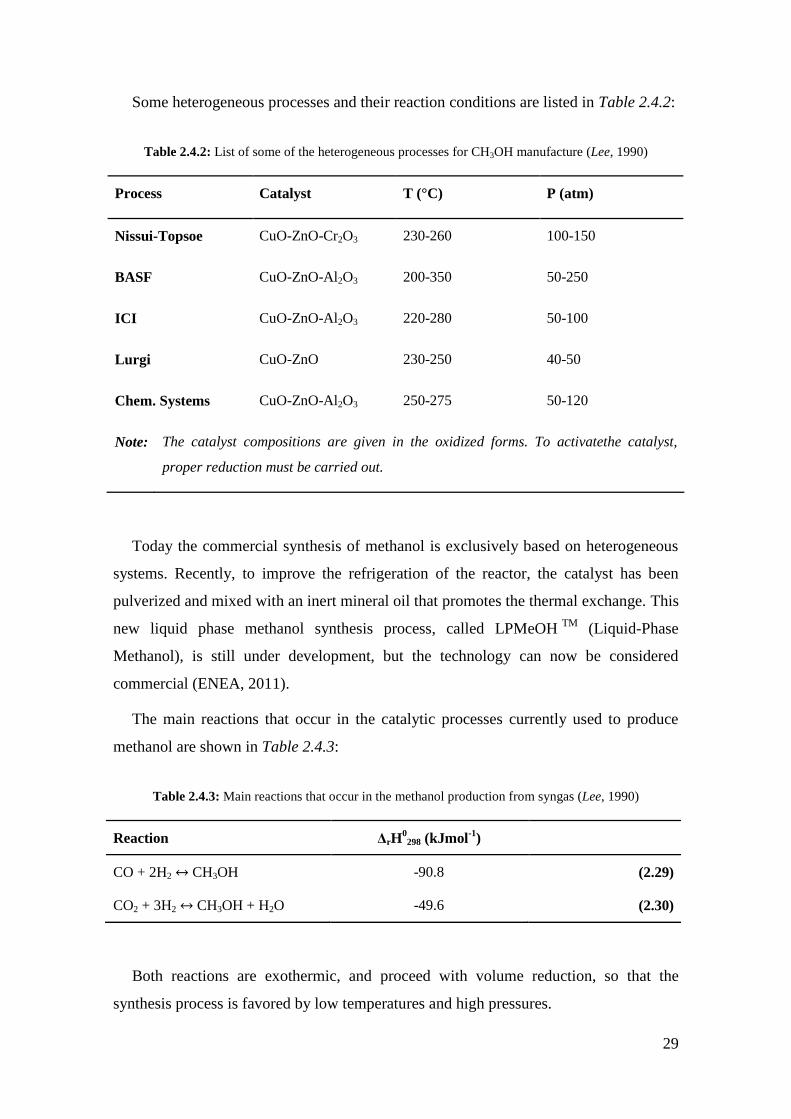
The main reactions that occur in the catalytic processes currently used to produce
methanol are shown in Table 2.4.3:
Table 2.4.3: Main reactions that occur in the methanol production from syngas (Lee, 1990)
Reaction ΔrH0
298 (kJmol-1
)
CO + 2H2 CH3OH -90.8 (2.29)
CO2 + 3H2 CH3OH + H2O -49.6 (2.30)
Both reactions are exothermic, and proceed with volume reduction, so that the
synthesis process is favored by low temperatures and high pressures.
30
More precisely, reaction (2.30) is considered a secondary reaction. In fact, the
presence of CO2 in the reagent mixture is positive in order to increase the activity of the
catalyst. However, if the amount of CO2 is higher than 3 %, the conversion is reduced.
Actually, the more used catalysts (copper-based) promote better reaction (2.29) than
(2.30). A ratio H2:CO equal to 2.02-2.04 is the best in terms of syngas conversion. If the
ratio is far from the one suggested, it is possible to modify the gas composition
installing a reactor before the synthesis process, in which the WGSR (2.10) occurs,
decreasing the CO amount (Moulijn et al., 2013).
The presence of inert gases in the reagent mixture inhibits the synthesis and promotes
the formation of by-products, often undesired (ENEA, 2011 and Lee, 1990).
As already mentioned, methanol can be used as raw material to produce chemical
products, such as DME.
2.4.2 DME production and applications
Dimethyl ether, also known as wood ether, dimethyl oxide or methyl ether, is the
simplest ether. It is a colorless, slightly narcotic, non-toxic, highly flammable gas at
ambient conditions, but can be handled as a liquid when lightly pressurized (around 5
atm). It is degradable in the atmosphere and is not a greenhouse gas (PubChem, 2016).
DME is commonly used in organic synthesis as a reaction solvent for systems
requiring volatile polar solvents. It is also a refrigerant, an aerosol propellant and a
blowing agent in consumer products, namely hairspray, shaving creams, automotive,
household products, insect control, and other related applications. Lately, it is gaining
more importance, since its potentially major use is as substitute for propane in LPG
used as fuel in household and industry, since its properties are similar to those of
Liquefied Petroleum Gas (LPG) (IDA, 2010).
It is also a promising fuel for diesel engines, petrol engines
(30 % DME / 70 % LPG), and gas turbines (power generation). DME can be used in
diesel engines as a substitute for conventional diesel fuel, due to its good ignition
quality, with a high cetane number (of 60, compared to the one of diesel fuel derived
from oil, which is 40–53). DME is stored in the liquid state under relatively low
pressure to help limiting the number of modifications required to the diesel engine to
burn dimethyl ether.
31
Still, some slight modifications are necessary, primarily relating to the injection
pump and the installation of a pressure tank, similar to that for LPG. The IEA
(International Energy Agency) is co-coordinating research as part of the Implementing
Agreement on Alternative Motor Fuels (IEA/AMF). Volvo has developed a DME
fuelled engine for buses. In Japan, a number of demonstration vehicles and small scale
filling stations have already been built. The simplicity of this short carbon chain
compound leads during combustion to very low emissions of particulate matter, NOx,
and CO. For these reasons as well as being sulfur-free, dimethyl ether meets even the
most stringent emission regulations in Europe (EURO5), U.S. (U.S. 2010), and Japan
(2009 Japan) (ChemSystems, 2008).
Although direct liquid methanol fuel cells (DMFCs) are becoming more developed
and are indeed promising for portable applications, some major drawbacks still remain,
including the mild toxicity of methanol vapor. Several alternative fuels have been
proposed in order to overcome various drawbacks associated with either hydrogen or
methanol, but few have been thoroughly studied to date. Dimethyl-ether is a promising
fuel alternative for several reasons: like methanol, DME lacks carbon-carbon bonds,
enabling nearly complete oxidization in low-temperature PEM fuel cells. In addition,
DME is less toxic than methanol (Muller et al., 2000).
Dimethyl ether is produced in a minimum of two steps. In a first step, hydrocarbons
(predominant feedstock for DME production is natural gas, but organic waste or
biomass can also be used) are converted into synthesis gas. The syngas is then
converted into DME via a two-step process (conventional process) that leads, firstly, to
the production of methanol in the presence of catalyst (usually copper-based), and, then,
to the DME synthesis by methanol dehydration in the presence of a different catalyst
(for example, silica-alumina and γ-alumina catalytic activity have been investigated
more thoroughly than others). Alternatively, DME can be produced through a single-
step (direct) process (Haldor Topsoe or JFE Holdings), using a dual-catalyst system
(e.g., in the 1990s, Air Products and Chemicals discussed the use of Cu/ZnO/γ-Al2O3
shift catalyst for the single-process), which allows both methanol synthesis and
dehydration in the same process unit, with no intermediate methanol separation, a
procedure that, by eliminating the intermediate methanol synthesis stage, the licensors
claim promises efficiency advantages and cost benefits as well (ChemSystems, 2008).
32
Without considering the several reactions that can occur to produce syngas
(depending on the feedstock used), Table 2.4.4 exhibits the reactions to produce DME
by the one-step or two-steps process.
Table 2.4.4: Main reactions that occur in the DME production from syngas (adapted from ChemSystems,
2008)
Reaction ΔrH0298 (kJmol
-1)
2CH3OH CH3OCH3 + H2O -23.3 (2.31)
4H2 + 2CO CH3OCH3 + H2O - (2.32)
Reaction (2.31) represents the methanol dehydration, which is the second step of the
conventional process. The first step (methanol production) has been already described in
the previous sub-chapter, and proceeds by reactions (2.29) and (2.30). Reaction (2.32)
describes the single-step process.
Both the one-step and two-step processes above are commercially available.
Currently, there is more widespread application of the two-step process since it is
relatively simple and start-up costs are relatively low.
Another process, with the same basic technology used to develop the already
described LPMeOH TM
process (for methanol), is under development. It is a one-step
liquid phase DME from syngas process, called LPDME TM
(ChemSystems, 2008).
The DME production can be connected to an area which is gaining more and more
importance: the C1 chemistry.
The C1 chemistry refers to the conversion of simple carbon-containing materials, that
only contain one carbon atom per molecule, into valuable products. Today, this is an
important area as it presents the possibility to produce cleaner burning fuels and
chemical products from feedstocks other than oil (like natural gas, carbon dioxide,
methanol and carbon monoxide) (Keim, 1986).
33
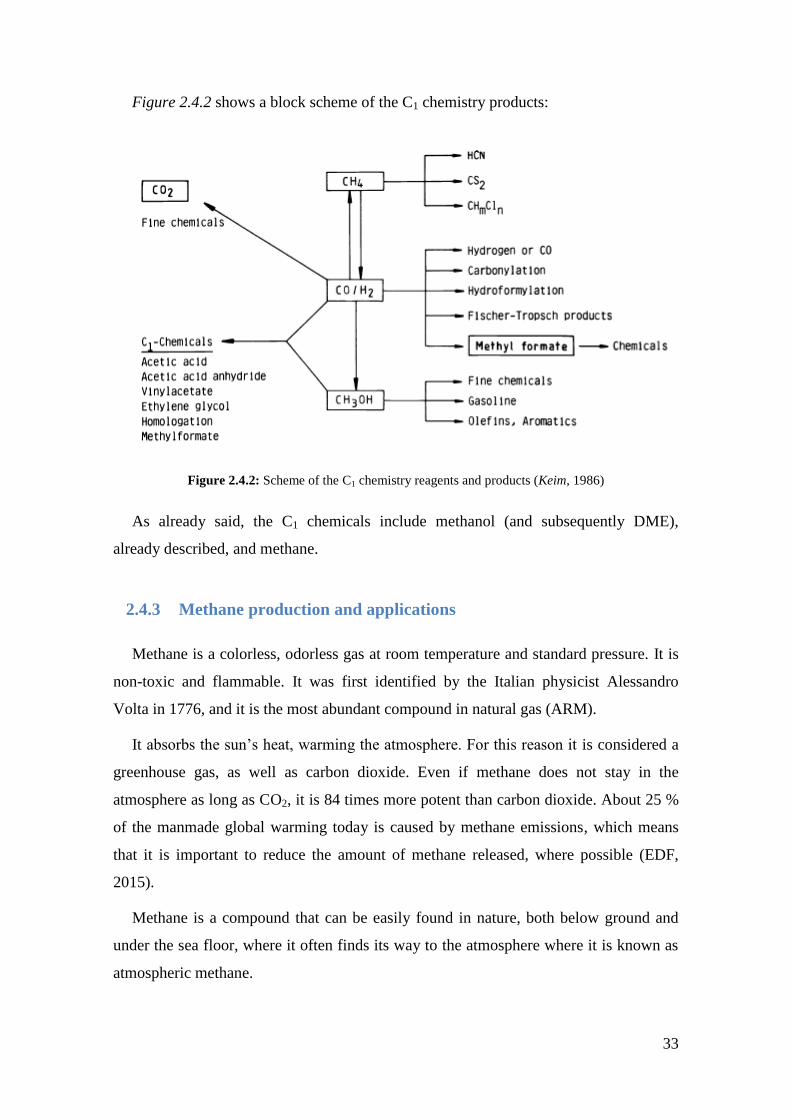
Figure 2.4.2 shows a block scheme of the C1 chemistry products:
Figure 2.4.2: Scheme of the C1 chemistry reagents and products (Keim, 1986)
As already said, the C1 chemicals include methanol (and subsequently DME),
already described, and methane.
2.4.3 Methane production and applications
Methane is a colorless, odorless gas at room temperature and standard pressure. It is
non-toxic and flammable. It was first identified by the Italian physicist Alessandro
Volta in 1776, and it is the most abundant compound in natural gas (ARM).
It absorbs the sun’s heat, warming the atmosphere. For this reason it is considered a
greenhouse gas, as well as carbon dioxide. Even if methane does not stay in the
atmosphere as long as CO2, it is 84 times more potent than carbon dioxide. About 25 %
of the manmade global warming today is caused by methane emissions, which means
that it is important to reduce the amount of methane released, where possible (EDF,
2015).
Methane is a compound that can be easily found in nature, both below ground and
under the sea floor, where it often finds its way to the atmosphere where it is known as
atmospheric methane.
34
In particular, methane can be found in (ARM):
- Areas where natural gas and oil are found;
- Livestock. Cows, sheep, goats, buffalo and camels have anaerobic bacteria in
their digestive systems that produce large amounts of methane. Methane is also
produced in the decomposition of livestock manure by anaerobic bacteria
(which digest organic material and produce natural gas as waste product);
- Termites. Global methane emission from this source is estimated to be about 20
million tones each year;
- Landfills and dumps. Methane is produced in the decomposition of waste down
in the piles of trash, where there is no oxygen;
- Wetlands. All the places in which the soil is water soaked produce methane
because they provide ideal conditions for anaerobic bacteria. The ideal
condition, in these cases, is the organic matter that they usually digest, in
anaerobic conditions;
- Oceans. Deep in the ocean, as well as on the solid ground, anaerobic bacteria
produce methane.
Methane is used for different purposes, as follows (Sterner, 2009):
- as chemical feedstock, to be converted into useful or more easily liquefied
compounds like methanol, chloromethane etc.;
- to produce syngas by the steam reforming;
- as a fuel for domestic and industrial purposes.
The increasing demand and high prices of natural gas, in recent years, has led
researchers to consider alternative methods to produce natural gas. Synthetic Natural
Gas or Substitute Natural Gas (SNG) is an artificially produced version of natural gas.
Actually, what is really produced is methane, the major component of natural gas. As
well as for methanol, the efforts in producing synthetic methane are done as it burns
cleaner (producing less carbon dioxide for each unit of heat released), at lower
temperatures than other hydrocarbon fuels. For these reasons, it is used in electrical
generation in gas turbines or steam generators, or, in the form of compressed natural
gas, it can be used as fuel in vehicles, more environmentally friendly than other fossil
fuels currently used.
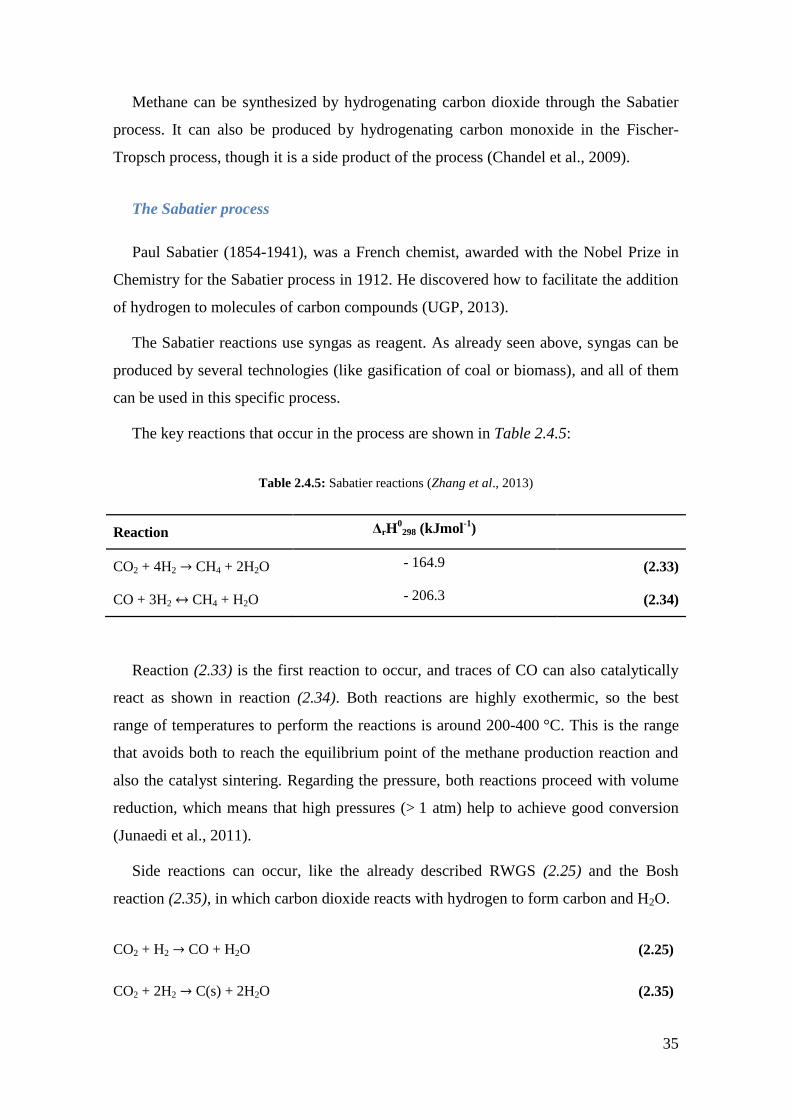
35
Methane can be synthesized by hydrogenating carbon dioxide through the Sabatier
process. It can also be produced by hydrogenating carbon monoxide in the Fischer-
Tropsch process, though it is a side product of the process (Chandel et al., 2009).
The Sabatier process
Paul Sabatier (1854-1941), was a French chemist, awarded with the Nobel Prize in
Chemistry for the Sabatier process in 1912. He discovered how to facilitate the addition
of hydrogen to molecules of carbon compounds (UGP, 2013).
The Sabatier reactions use syngas as reagent. As already seen above, syngas can be
produced by several technologies (like gasification of coal or biomass), and all of them
can be used in this specific process.
The key reactions that occur in the process are shown in Table 2.4.5:
Table 2.4.5: Sabatier reactions (Zhang et al., 2013)
Reaction ΔrH0
298 (kJmol-1
)
CO2 + 4H2 CH4 + 2H2O - 164.9 (2.33)
CO + 3H2 CH4 + H2O - 206.3 (2.34)
Reaction (2.33) is the first reaction to occur, and traces of CO can also catalytically
react as shown in reaction (2.34). Both reactions are highly exothermic, so the best
range of temperatures to perform the reactions is around 200-400 °C. This is the range
that avoids both to reach the equilibrium point of the methane production reaction and
also the catalyst sintering. Regarding the pressure, both reactions proceed with volume
reduction, which means that high pressures (> 1 atm) help to achieve good conversion
(Junaedi et al., 2011).
Side reactions can occur, like the already described RWGS (2.25) and the Bosh
reaction (2.35), in which carbon dioxide reacts with hydrogen to form carbon and H2O.
CO2 + H2 CO + H2O (2.25)
CO2 + 2H2 C(s) + 2H2O (2.35)
36
Both reactions reduce the selectivity towards methane formation. Furthermore, the
Bosh reaction is undesirable for this system, since the carbon produced can deposit on
the catalyst surface, both reducing the catalyst activity and performance and increasing
the pressure drop (Junaedi et al., 2011).
Hydrogenation of CO2 towards methane has been investigated using catalytic
systems based on VIIIB metals (e.g., Ru, Rh, Ni), supported on various oxides (e.g.,
SiO2, TiO2, Al2O3, ZrO2 and CeO2). Supported nickel catalysts remain the most widely
studied materials, even if ruthenium was reported to be the most active catalyst with the
highest selectivity towards methane, but it still is too expensive. The support nature
plays a crucial role in the interaction between nickel and support, and determines
catalytic performances toward activity and selectivity for CO2 methanation (Wang et al.,
2011).
All over the world, scientists are studying the activity and selectivity of bimetallic
Ni-Fe catalysts for the hydrogenation of CO, CO2, and even CO/CO2 mixtures. It seems
that the CO2 conversion in CH4 is better achieved with Ni-Fe alloys than with simple
Ni, and the same happens for CO/CO2 mixtures. Activity and selectivity for methane
seem to reach a maximum with a total metal (Ni-Fe) amount of 20 % wt, and a
MgAl2O4 support (ENEA, 2012).
37
2.5 GreenSynFuel – The value of energetic sustainability
The target of the GreenSynFuel (GSYF) project is the production of synthesis gas in
one step, thanks to an innovative process of alkaline water electrolysis, which uses
electricity and electrodes made of graphite. The result of the presence of these new
electrodes is the direct oxidation of carbon, with production of both carbon monoxide
and dioxide, in the same stack, together with hydrogen. In particular, as shown below,
the production of oxygen occurs at the anode, as already described for simple
electrolysis, by reaction (2.2); the oxygen then reacts with carbon, producing CO, in
reaction (2.18), and CO2, by reaction (2.14). The hydrogen production occurs at the
cathode, by reaction (2.36) (Guerra, 2015).
4OH- O2 + 2H2O + 4e
- (2.2)
2C + O2 2CO (2.18)
2CO + O2 2CO2 (2.14)
2H2O + 2e- H2 + 2OH
- (2.36)
This project is based on a patent by José João Santana Campos Rodrigues, entitled
“Obtenção de gás de síntese por eletrólise alcalina da água”, Portuguese patent coded
106779 T.
Besides the graphite electrodes, another innovation in this process is the design of the
electrolyzer, as there is no membrane inside it to separate the gases produced. This kind
of electrolyzer greatly helps to reduce the costs, when compared to traditional
electrolyzers (alkaline, PEM and SOEC) (Rodrigues, 2013, b).
Even if hydrogen is an interesting energy carrier, syngas is more versatile, and
several synthetic fuels can be produced from it, cleaner than fossil fuels, which form an
interesting alternative to secondary and tertiary generation biofuels. The sustainability
of these synthetic fuels is even greater if the primary power source (electricity) is
obtained from a renewable source (Guerra, 2015).
Synthetic fuels that are obtained from electric energy are called Electrofuels. The
GSYF technology fits on this classification (Rodrigues, 2013, b).
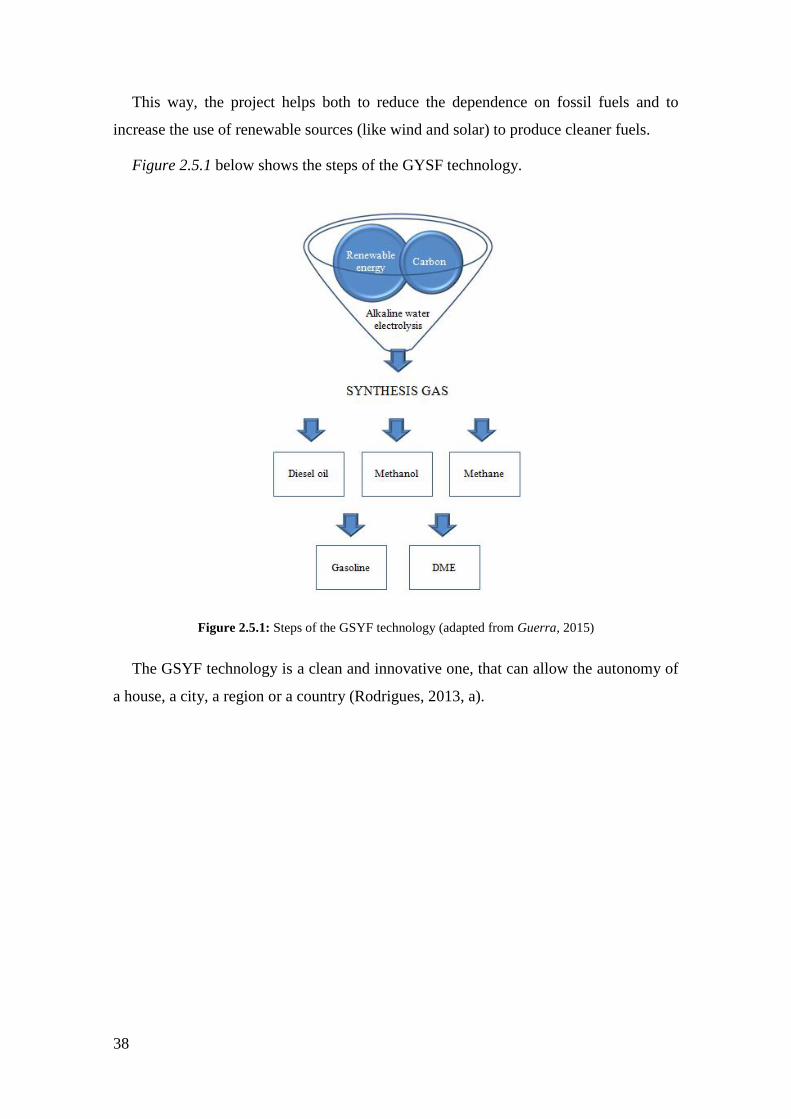
38
This way, the project helps both to reduce the dependence on fossil fuels and to
increase the use of renewable sources (like wind and solar) to produce cleaner fuels.
Figure 2.5.1 below shows the steps of the GYSF technology.
Figure 2.5.1: Steps of the GSYF technology (adapted from Guerra, 2015)
The GSYF technology is a clean and innovative one, that can allow the autonomy of
a house, a city, a region or a country (Rodrigues, 2013, a).
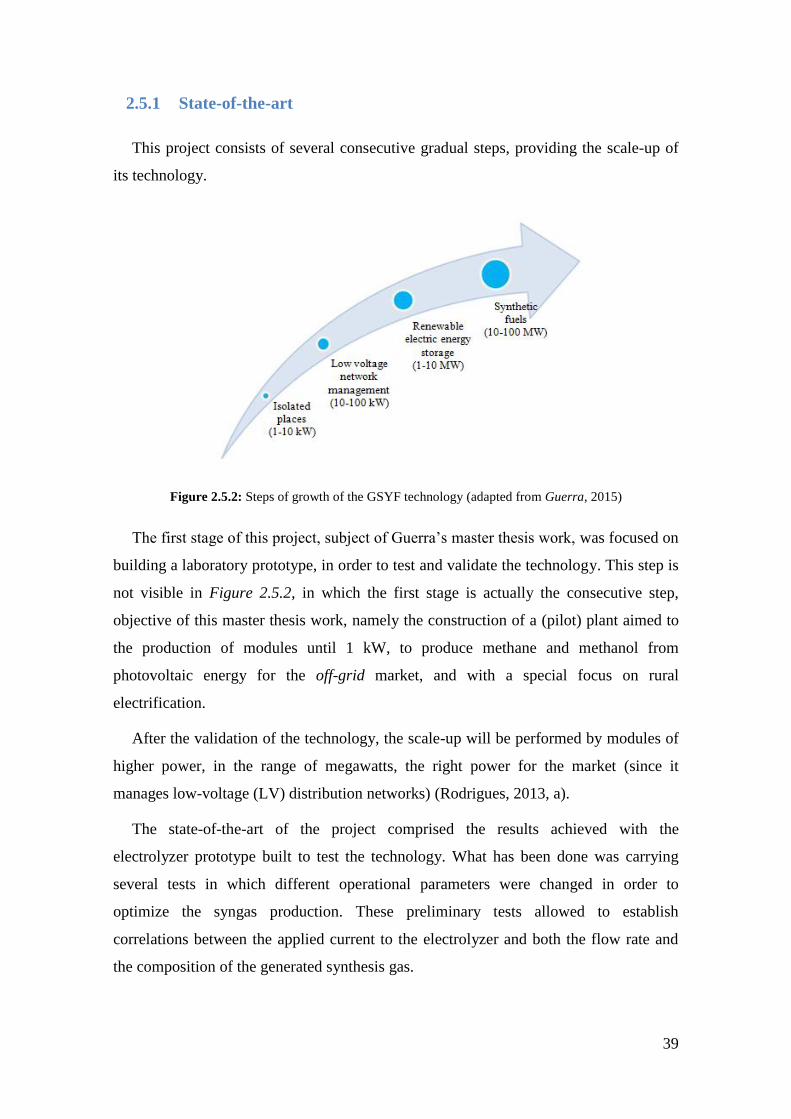
39
2.5.1 State-of-the-art
This project consists of several consecutive gradual steps, providing the scale-up of
its technology.
Figure 2.5.2: Steps of growth of the GSYF technology (adapted from Guerra, 2015)
The first stage of this project, subject of Guerra’s master thesis work, was focused on
building a laboratory prototype, in order to test and validate the technology. This step is
not visible in Figure 2.5.2, in which the first stage is actually the consecutive step,
objective of this master thesis work, namely the construction of a (pilot) plant aimed to
the production of modules until 1 kW, to produce methane and methanol from
photovoltaic energy for the off-grid market, and with a special focus on rural
electrification.
After the validation of the technology, the scale-up will be performed by modules of
higher power, in the range of megawatts, the right power for the market (since it
manages low-voltage (LV) distribution networks) (Rodrigues, 2013, a).
The state-of-the-art of the project comprised the results achieved with the
electrolyzer prototype built to test the technology. What has been done was carrying
several tests in which different operational parameters were changed in order to
optimize the syngas production. These preliminary tests allowed to establish
correlations between the applied current to the electrolyzer and both the flow rate and
the composition of the generated synthesis gas.
40
The electrolyte chosen for the tests was sodium hydroxide, and the first test
concerned the behavior of the applied current and the flow rate with the electrolyte
concentration.
What has been noticed is that these two variables increase with the increase of
sodium hydroxide concentration until 0.4 M, and then they start to decrease for higher
concentrations. The same behavior has been detected on carbon monoxide content (an
increase of its yield with the increase of the electrolyte concentration until 0.4 M and a
following decrease for higher concentrations). A continue increase of the consumed
energy has been detected with the increase of the sodium hydroxide concentration. In
what concerns the yield of oxygen and the H2:CO ratio, they present an opposite
behavior, decreasing until an electrolyte concentration of 0.4 M and then increasing.
The best condition is, of course, to have a lower concentration of oxygen and a higher
concentration of CO.
The increase of the electrolyte concentration implies, until 0.4 M, a higher carbon
consumption in the electrodes, which is not the ideal if we consider that it will decrease
the lapse of time in which it will be needed to replace the graphite disks (as an increase
in the space between the disks decreases the flow rate and the syngas production).
Anyway, these losses are the reason for optimizing all the variables described above,
including the minimization of oxygen content in the gas, which is one of the goals, since
its presence deactivates the catalysts that can be used in the next step of production of
methane or/and methanol. All these results suggest that the best electrolyte
concentration is 0.4 M. Once this parameter was set, other parameters were chosen and
changed in order to achieve the best conditions for the process. These parameters are the
temperature and the voltage applied to the electrolyzer. The same behavior, of all
variables described above, has also been observed with both temperature and voltage,
showing that the best values for these parameters are respectively 35 °C and 5 V
(Guerra et al., 2015).
Once all the parameters were set, a new cycle of tests of 2 h each was done to
optimize the process, varying the electrolyte concentration from 0.3 to 0.5 M, while
keeping the temperature and the voltage fixed at, respectively, 35 °C and 5 V.
41
The new results show that all the variables still exhibit the best behavior at a NaOH
concentration of 0.4 M, which confirms that the best optimization is the one already
performed.
The yield of the compounds achieved with the preliminary tests (after a 2 h reaction)
are:
- Maximum carbon monoxide yield of 7.7 ( 1.0) %;
- Maximum carbon dioxide yield of 2.0 ( 1.0) %;
- Minimum oxygen yield of 8.9 ( 1.0) %.
The same tests were then made with potassium hydroxide (KOH), in order to check
which electrolyte is more convenient to use. KOH is chemically similar to NaOH, so the
tests done were similar, and the first step was to experiment the conditions considered
as the best for NaOH, varying first the temperature in a range of 5 °C. After the
optimization, the best results were obtained at a KOH concentration of 0.5 M, a
temperature of 30 °C and a voltage of 5 V. Even with this, the comparison of the results
obtained with the two electrolytes showed that the best values are achieved with the use
of the sodium hydroxide electrolyte.
A third stage of the work was to dissolve the potassium metavanadate (KVO3)
catalyst in water with the NaOH electrolyte, to observe its behavior towards the
described variables. The obtained results were: an increase in the applied current along
with the increase of the KVO3 percentage, as well as an increase in the flow rate in the
same conditions, but the most important result was a decrease in the yield of CO, an
increase in the yield of CO2 and an increase in the yield of O2 in accordance with the
increase of the KVO3 percentage. Since one of the variables that must be kept under
control is the oxygen, that has to be minimized, this catalyst is not useful in order to
obtain optimal results. The reason for the observed increase in the amount of oxygen in
the mixture of gases is supposed to be the decomposition of the KVO3 catalyst and the
consequent release of oxygen, which was combined to the amount already present in gas
mixture (Guerra, 2015).

42
The subject of this experimental work is the study and optimization of the synthesis
gas production in a new pilot plant – a module that can reach power around 1 kW, that
corresponds to the first stage represented in Figure 2.5.2. – by changing different
operational parameters, namely temperature, pressure and applied voltage (and,
consequently, the current intensity), in two stacks with different types of graphite
electrodes each. Subsequently, the production of methane in a catalytic reactor at
different temperature conditions and with a catalyst produced in the laboratory, using
the gases previously obtained by the electrolyzers, will be studied as a first approach.
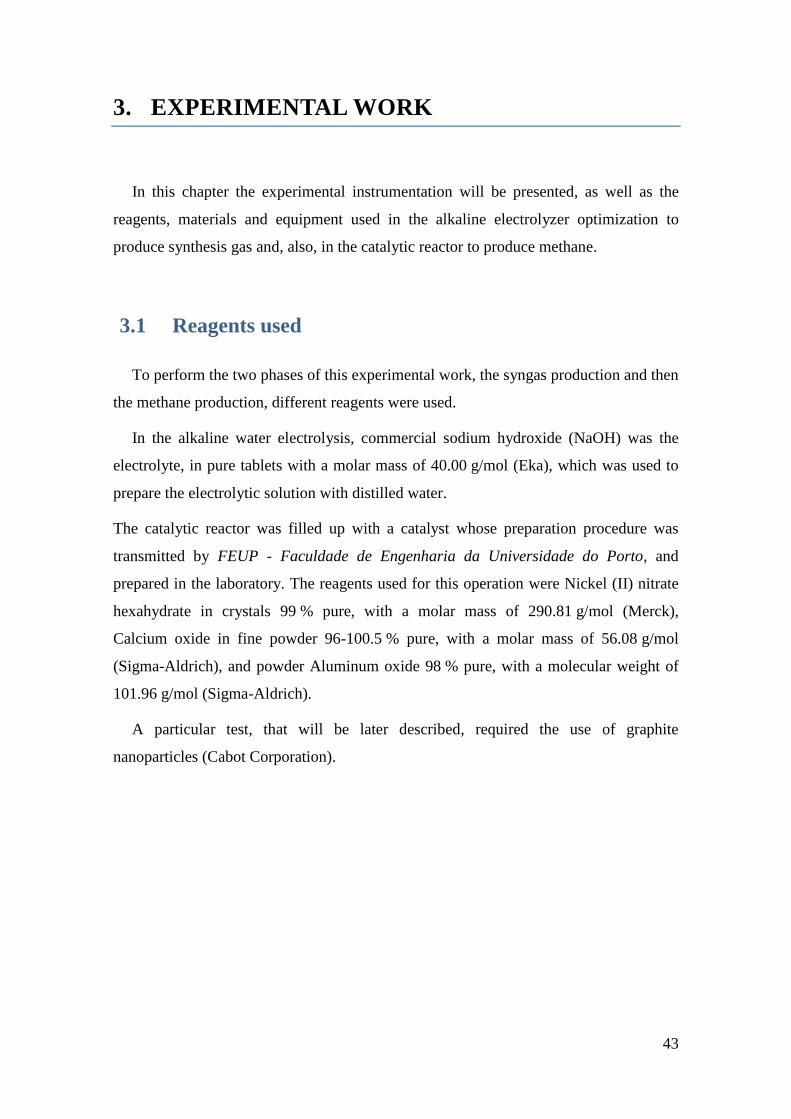
43
3. EXPERIMENTAL WORK
In this chapter the experimental instrumentation will be presented, as well as the
reagents, materials and equipment used in the alkaline electrolyzer optimization to
produce synthesis gas and, also, in the catalytic reactor to produce methane.
3.1 Reagents used
To perform the two phases of this experimental work, the syngas production and then
the methane production, different reagents were used.
In the alkaline water electrolysis, commercial sodium hydroxide (NaOH) was the
electrolyte, in pure tablets with a molar mass of 40.00 g/mol (Eka), which was used to
prepare the electrolytic solution with distilled water.
The catalytic reactor was filled up with a catalyst whose preparation procedure was
transmitted by FEUP - Faculdade de Engenharia da Universidade do Porto, and
prepared in the laboratory. The reagents used for this operation were Nickel (II) nitrate
hexahydrate in crystals 99 % pure, with a molar mass of 290.81 g/mol (Merck),
Calcium oxide in fine powder 96-100.5 % pure, with a molar mass of 56.08 g/mol
(Sigma-Aldrich), and powder Aluminum oxide 98 % pure, with a molecular weight of
101.96 g/mol (Sigma-Aldrich).
A particular test, that will be later described, required the use of graphite
nanoparticles (Cabot Corporation).
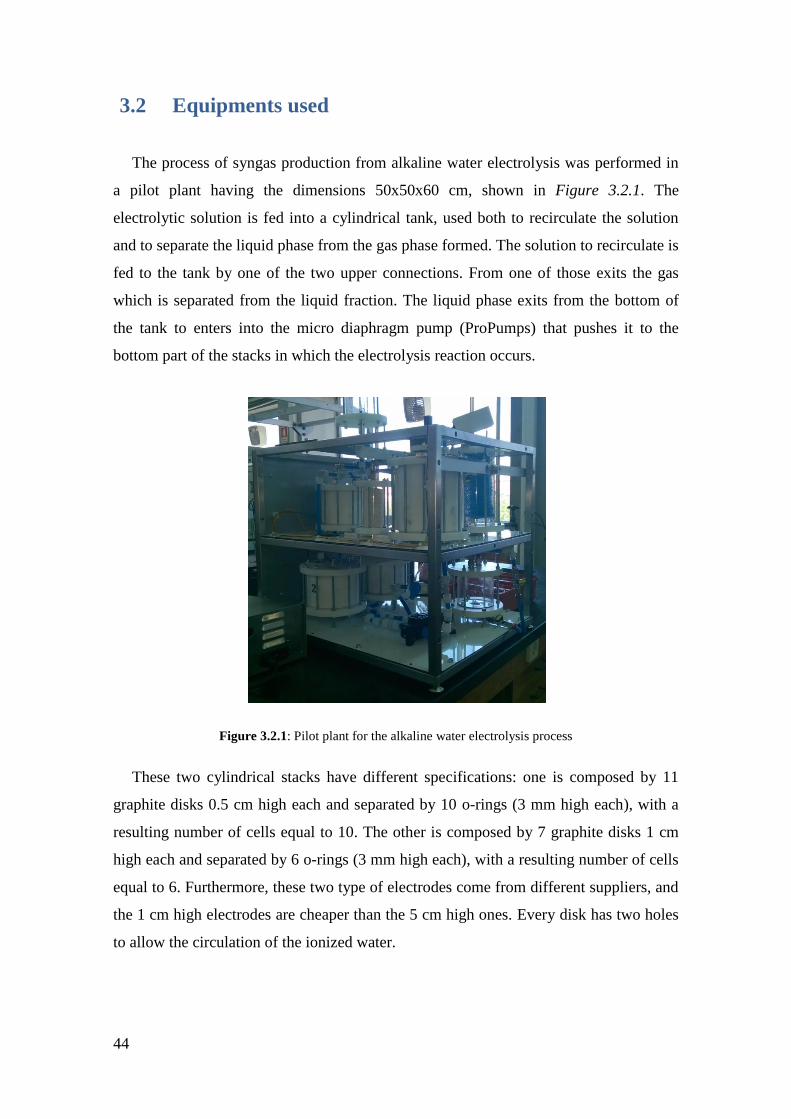
44
3.2 Equipments used
The process of syngas production from alkaline water electrolysis was performed in
a pilot plant having the dimensions 50x50x60 cm, shown in Figure 3.2.1. The
electrolytic solution is fed into a cylindrical tank, used both to recirculate the solution
and to separate the liquid phase from the gas phase formed. The solution to recirculate is
fed to the tank by one of the two upper connections. From one of those exits the gas
which is separated from the liquid fraction. The liquid phase exits from the bottom of
the tank to enters into the micro diaphragm pump (ProPumps) that pushes it to the
bottom part of the stacks in which the electrolysis reaction occurs.
Figure 3.2.1: Pilot plant for the alkaline water electrolysis process
These two cylindrical stacks have different specifications: one is composed by 11
graphite disks 0.5 cm high each and separated by 10 o-rings (3 mm high each), with a
resulting number of cells equal to 10. The other is composed by 7 graphite disks 1 cm
high each and separated by 6 o-rings (3 mm high each), with a resulting number of cells
equal to 6. Furthermore, these two type of electrodes come from different suppliers, and
the 1 cm high electrodes are cheaper than the 5 cm high ones. Every disk has two holes
to allow the circulation of the ionized water.
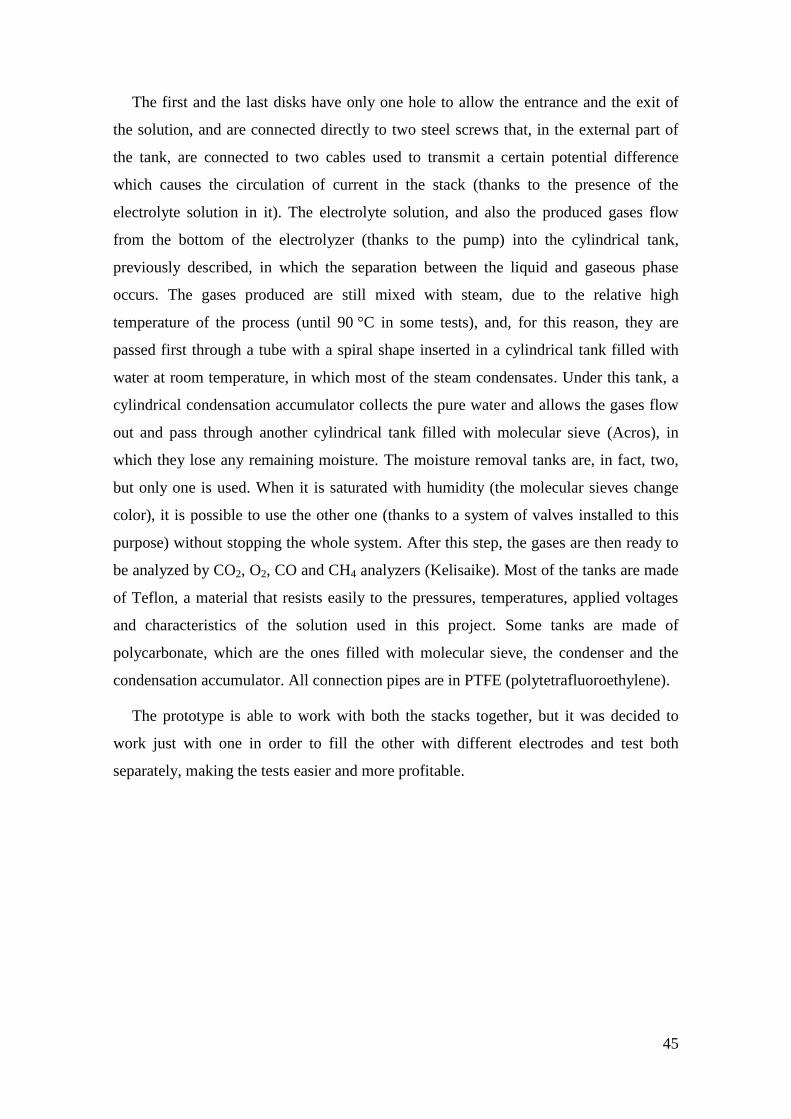
45
The first and the last disks have only one hole to allow the entrance and the exit of
the solution, and are connected directly to two steel screws that, in the external part of
the tank, are connected to two cables used to transmit a certain potential difference
which causes the circulation of current in the stack (thanks to the presence of the
electrolyte solution in it). The electrolyte solution, and also the produced gases flow
from the bottom of the electrolyzer (thanks to the pump) into the cylindrical tank,
previously described, in which the separation between the liquid and gaseous phase
occurs. The gases produced are still mixed with steam, due to the relative high
temperature of the process (until 90 °C in some tests), and, for this reason, they are
passed first through a tube with a spiral shape inserted in a cylindrical tank filled with
water at room temperature, in which most of the steam condensates. Under this tank, a
cylindrical condensation accumulator collects the pure water and allows the gases flow
out and pass through another cylindrical tank filled with molecular sieve (Acros), in
which they lose any remaining moisture. The moisture removal tanks are, in fact, two,
but only one is used. When it is saturated with humidity (the molecular sieves change
color), it is possible to use the other one (thanks to a system of valves installed to this
purpose) without stopping the whole system. After this step, the gases are then ready to
be analyzed by CO2, O2, CO and CH4 analyzers (Kelisaike). Most of the tanks are made
of Teflon, a material that resists easily to the pressures, temperatures, applied voltages
and characteristics of the solution used in this project. Some tanks are made of
polycarbonate, which are the ones filled with molecular sieve, the condenser and the
condensation accumulator. All connection pipes are in PTFE (polytetrafluoroethylene).
The prototype is able to work with both the stacks together, but it was decided to
work just with one in order to fill the other with different electrodes and test both
separately, making the tests easier and more profitable.
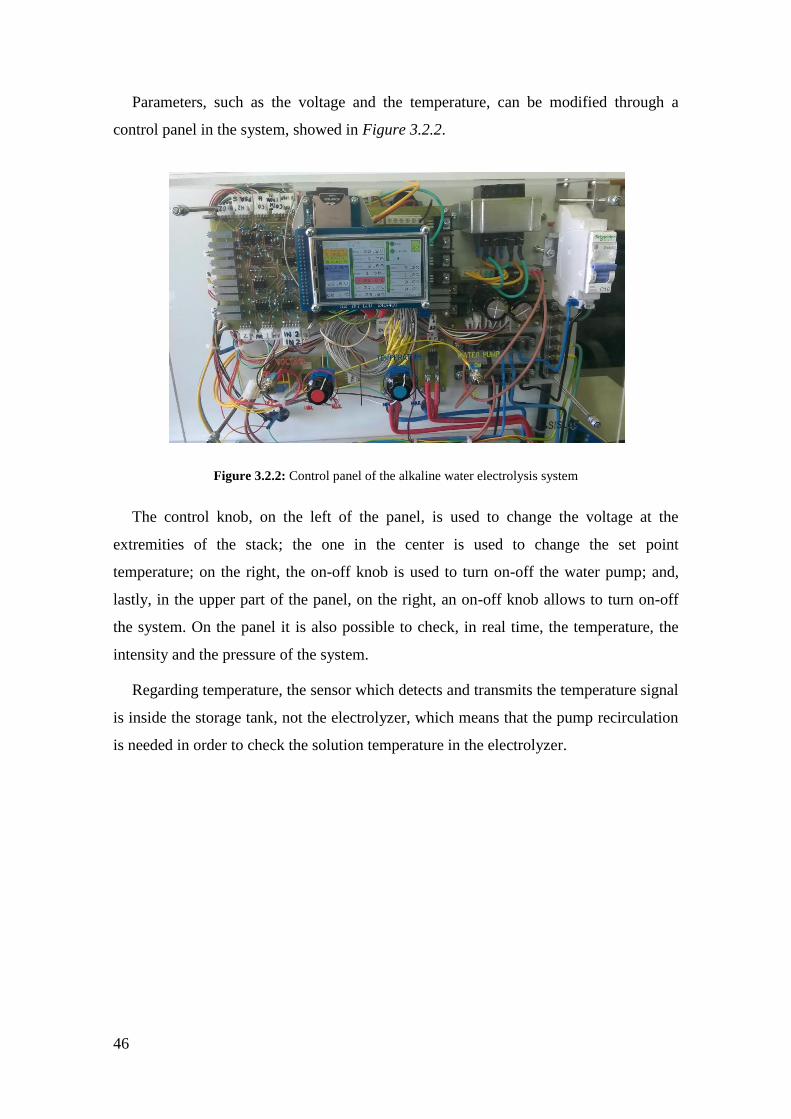
46
Parameters, such as the voltage and the temperature, can be modified through a
control panel in the system, showed in Figure 3.2.2.
Figure 3.2.2: Control panel of the alkaline water electrolysis system
The control knob, on the left of the panel, is used to change the voltage at the
extremities of the stack; the one in the center is used to change the set point
temperature; on the right, the on-off knob is used to turn on-off the water pump; and,
lastly, in the upper part of the panel, on the right, an on-off knob allows to turn on-off
the system. On the panel it is also possible to check, in real time, the temperature, the
intensity and the pressure of the system.
Regarding temperature, the sensor which detects and transmits the temperature signal
is inside the storage tank, not the electrolyzer, which means that the pump recirculation
is needed in order to check the solution temperature in the electrolyzer.
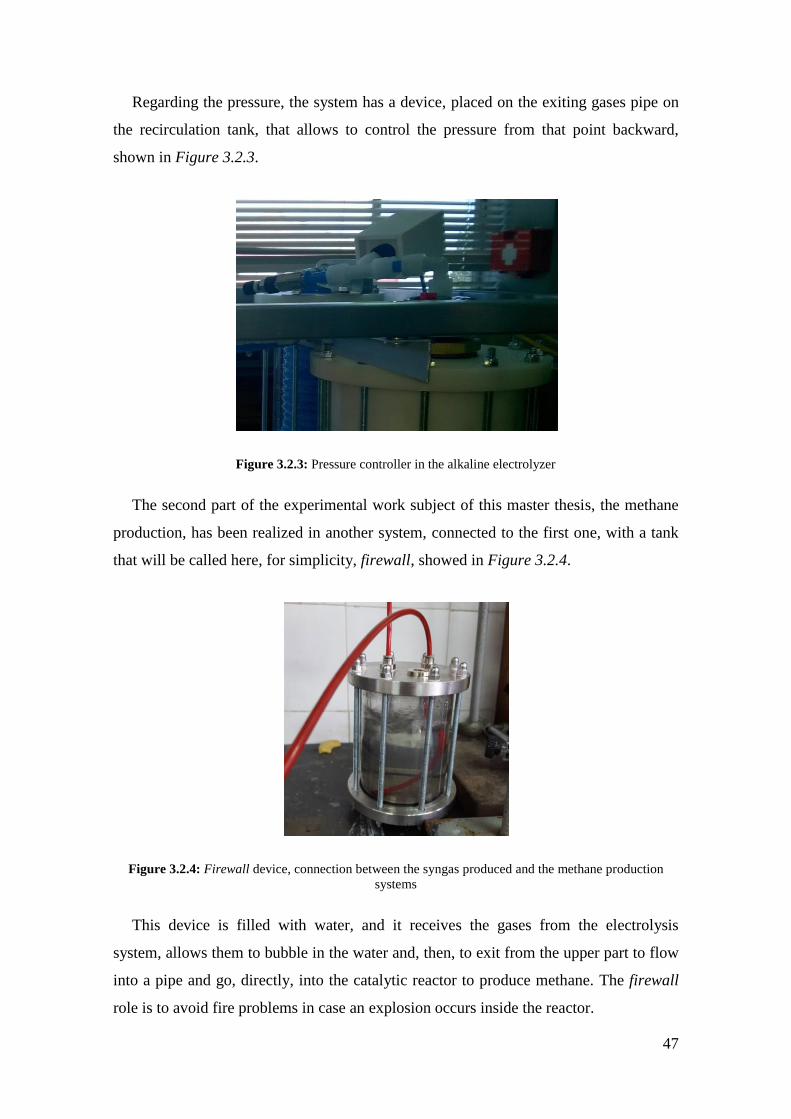
47
Regarding the pressure, the system has a device, placed on the exiting gases pipe on
the recirculation tank, that allows to control the pressure from that point backward,
shown in Figure 3.2.3.
Figure 3.2.3: Pressure controller in the alkaline electrolyzer
The second part of the experimental work subject of this master thesis, the methane
production, has been realized in another system, connected to the first one, with a tank
that will be called here, for simplicity, firewall, showed in Figure 3.2.4.
Figure 3.2.4: Firewall device, connection between the syngas produced and the methane production
systems
This device is filled with water, and it receives the gases from the electrolysis
system, allows them to bubble in the water and, then, to exit from the upper part to flow
into a pipe and go, directly, into the catalytic reactor to produce methane. The firewall
role is to avoid fire problems in case an explosion occurs inside the reactor.
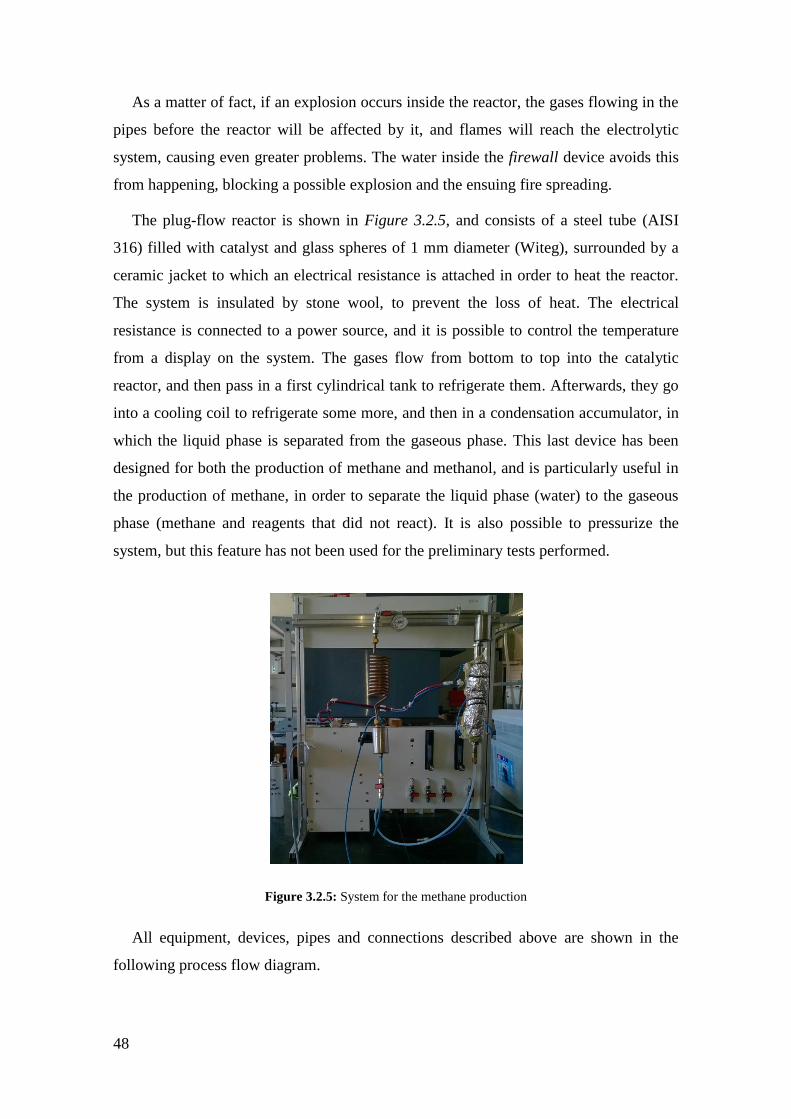
48
As a matter of fact, if an explosion occurs inside the reactor, the gases flowing in the
pipes before the reactor will be affected by it, and flames will reach the electrolytic
system, causing even greater problems. The water inside the firewall device avoids this
from happening, blocking a possible explosion and the ensuing fire spreading.
The plug-flow reactor is shown in Figure 3.2.5, and consists of a steel tube (AISI
316) filled with catalyst and glass spheres of 1 mm diameter (Witeg), surrounded by a
ceramic jacket to which an electrical resistance is attached in order to heat the reactor.
The system is insulated by stone wool, to prevent the loss of heat. The electrical
resistance is connected to a power source, and it is possible to control the temperature
from a display on the system. The gases flow from bottom to top into the catalytic
reactor, and then pass in a first cylindrical tank to refrigerate them. Afterwards, they go
into a cooling coil to refrigerate some more, and then in a condensation accumulator, in
which the liquid phase is separated from the gaseous phase. This last device has been
designed for both the production of methane and methanol, and is particularly useful in
the production of methane, in order to separate the liquid phase (water) to the gaseous
phase (methane and reagents that did not react). It is also possible to pressurize the
system, but this feature has not been used for the preliminary tests performed.
Figure 3.2.5: System for the methane production
All equipment, devices, pipes and connections described above are shown in the
following process flow diagram.
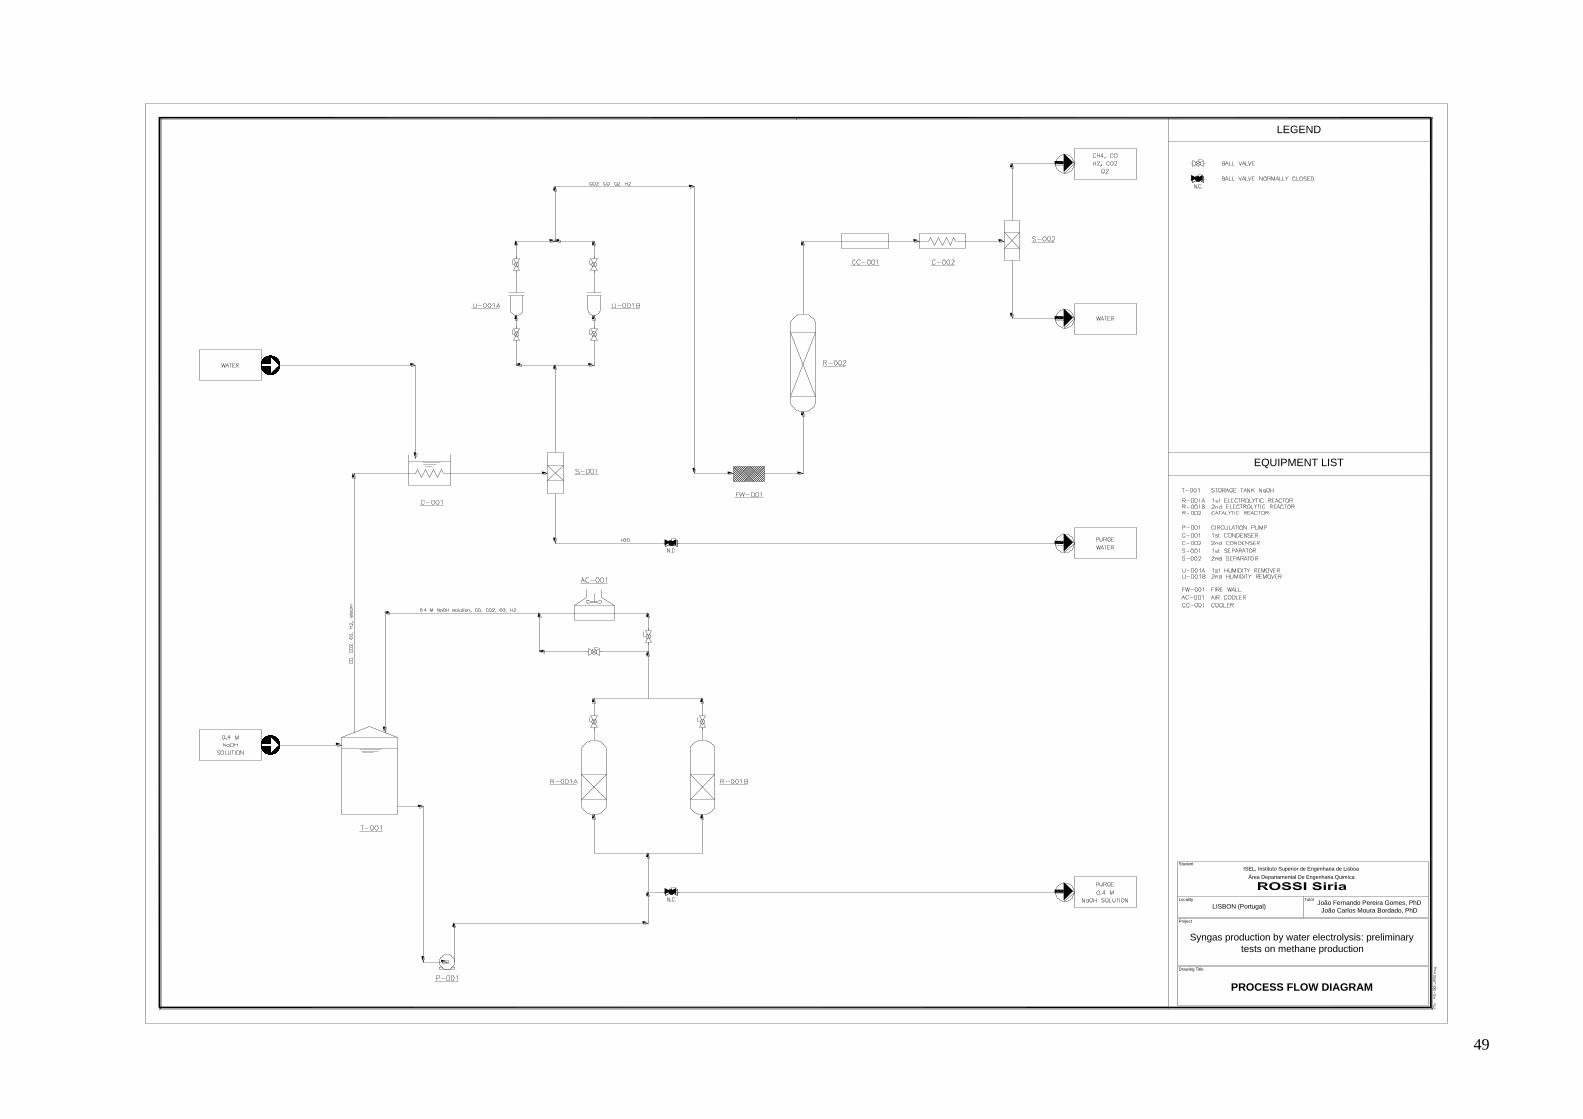
49
João Fernando Pereira Gomes, PhD
João Carlos Moura Bordado, PhD
Project
Student
Drawing Title
PROCESS FLOW DIAGRAM
Locality Tutor
Syngas production by water electrolysis: preliminary
tests on methane production
LISBON (Portugal)
LEGEND
ISEL, Instituto Superior de Engenharia de Lisboa
Área Departamental De Engenharia Quimíca
EQUIPMENT LIST

50
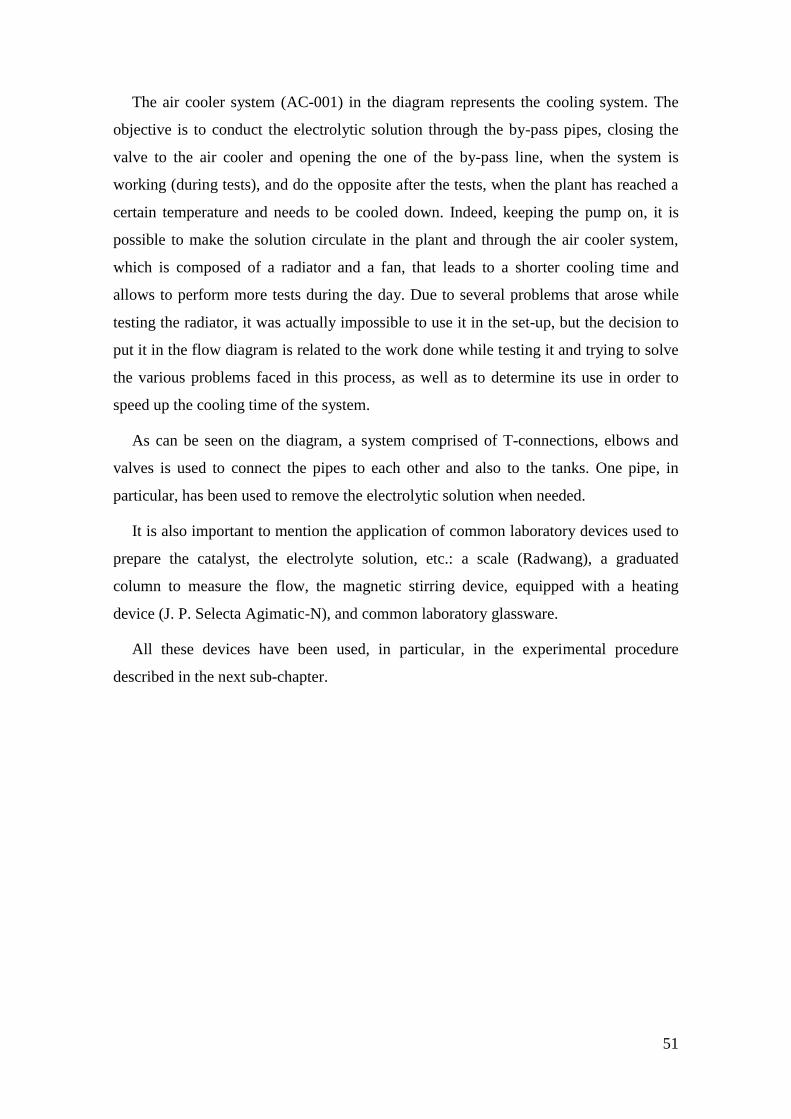
51
The air cooler system (AC-001) in the diagram represents the cooling system. The
objective is to conduct the electrolytic solution through the by-pass pipes, closing the
valve to the air cooler and opening the one of the by-pass line, when the system is
working (during tests), and do the opposite after the tests, when the plant has reached a
certain temperature and needs to be cooled down. Indeed, keeping the pump on, it is
possible to make the solution circulate in the plant and through the air cooler system,
which is composed of a radiator and a fan, that leads to a shorter cooling time and
allows to perform more tests during the day. Due to several problems that arose while
testing the radiator, it was actually impossible to use it in the set-up, but the decision to
put it in the flow diagram is related to the work done while testing it and trying to solve
the various problems faced in this process, as well as to determine its use in order to
speed up the cooling time of the system.
As can be seen on the diagram, a system comprised of T-connections, elbows and
valves is used to connect the pipes to each other and also to the tanks. One pipe, in
particular, has been used to remove the electrolytic solution when needed.
It is also important to mention the application of common laboratory devices used to
prepare the catalyst, the electrolyte solution, etc.: a scale (Radwang), a graduated
column to measure the flow, the magnetic stirring device, equipped with a heating
device (J. P. Selecta Agimatic-N), and common laboratory glassware.
All these devices have been used, in particular, in the experimental procedure
described in the next sub-chapter.
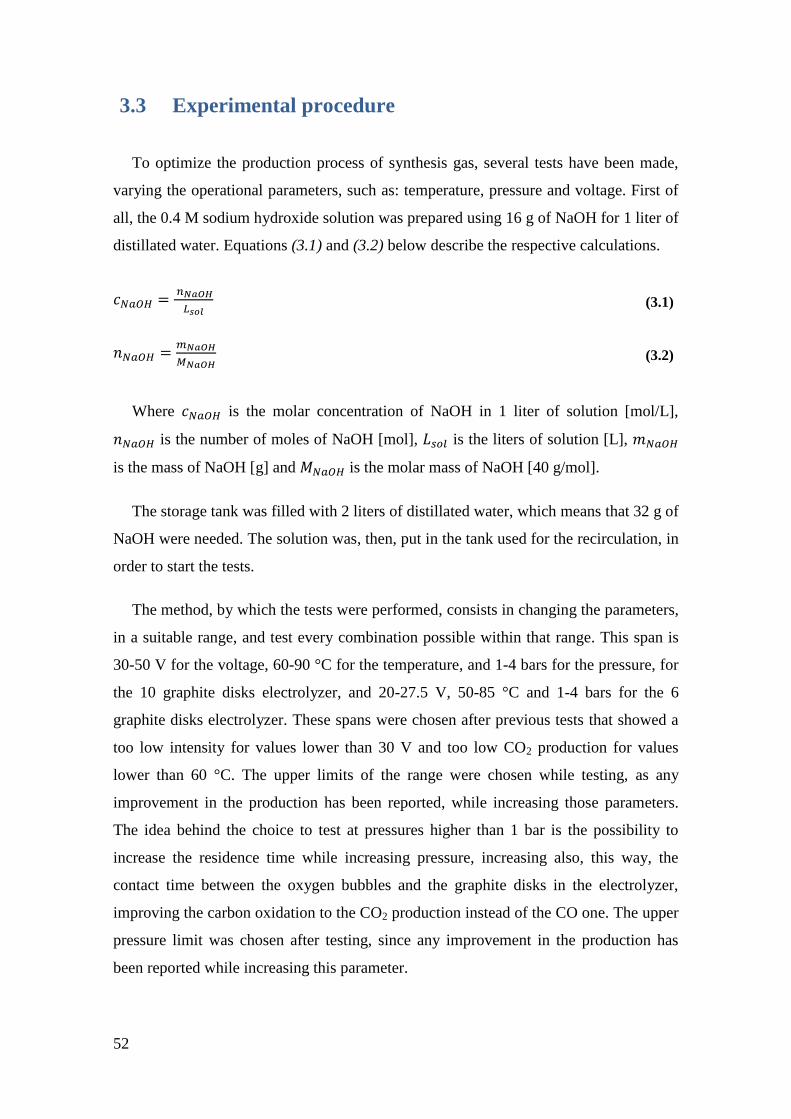
52
3.3 Experimental procedure
To optimize the production process of synthesis gas, several tests have been made,
varying the operational parameters, such as: temperature, pressure and voltage. First of
all, the 0.4 M sodium hydroxide solution was prepared using 16 g of NaOH for 1 liter of
distillated water. Equations (3.1) and (3.2) below describe the respective calculations.
(3.1)
(3.2)
Where is the molar concentration of NaOH in 1 liter of solution [mol/L],
is the number of moles of NaOH [mol], is the liters of solution [L],
is the mass of NaOH [g] and is the molar mass of NaOH [40 g/mol].
The storage tank was filled with 2 liters of distillated water, which means that 32 g of
NaOH were needed. The solution was, then, put in the tank used for the recirculation, in
order to start the tests.
The method, by which the tests were performed, consists in changing the parameters,
in a suitable range, and test every combination possible within that range. This span is
30-50 V for the voltage, 60-90 °C for the temperature, and 1-4 bars for the pressure, for
the 10 graphite disks electrolyzer, and 20-27.5 V, 50-85 °C and 1-4 bars for the 6
graphite disks electrolyzer. These spans were chosen after previous tests that showed a
too low intensity for values lower than 30 V and too low CO2 production for values
lower than 60 °C. The upper limits of the range were chosen while testing, as any
improvement in the production has been reported, while increasing those parameters.
The idea behind the choice to test at pressures higher than 1 bar is the possibility to
increase the residence time while increasing pressure, increasing also, this way, the
contact time between the oxygen bubbles and the graphite disks in the electrolyzer,
improving the carbon oxidation to the CO2 production instead of the CO one. The upper
pressure limit was chosen after testing, since any improvement in the production has
been reported while increasing this parameter.
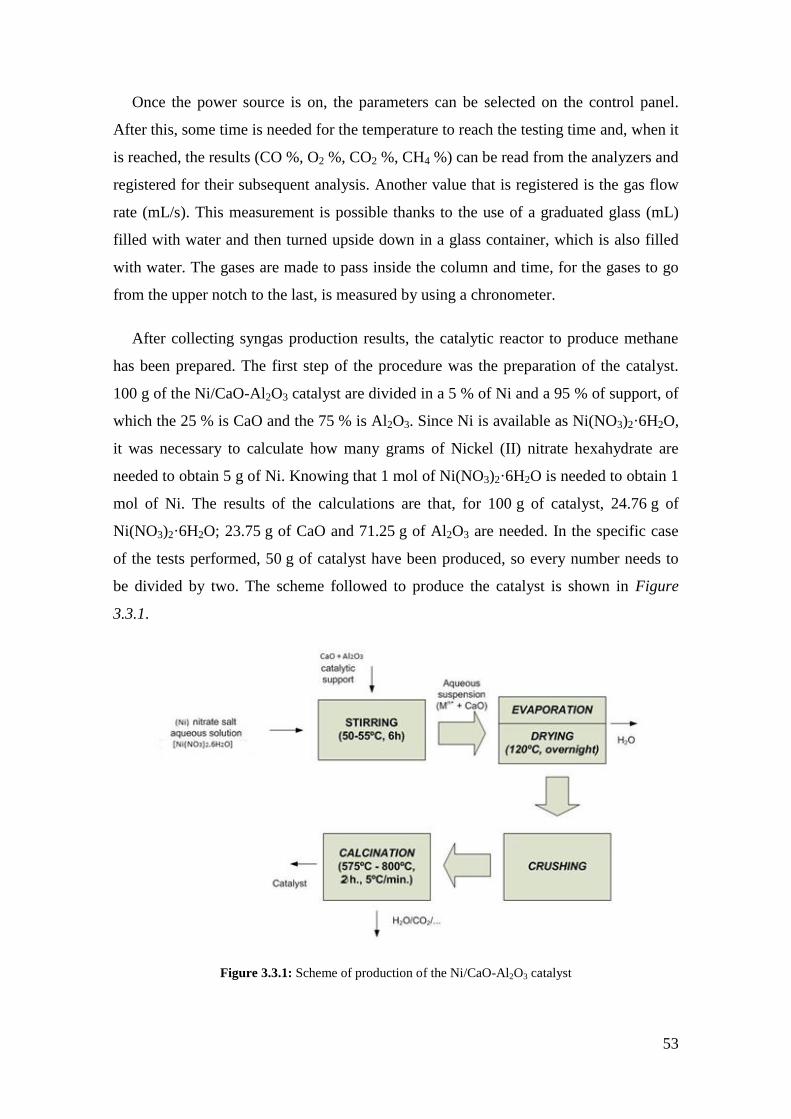
53
Once the power source is on, the parameters can be selected on the control panel.
After this, some time is needed for the temperature to reach the testing time and, when it
is reached, the results (CO %, O2 %, CO2 %, CH4 %) can be read from the analyzers and
registered for their subsequent analysis. Another value that is registered is the gas flow
rate (mL/s). This measurement is possible thanks to the use of a graduated glass (mL)
filled with water and then turned upside down in a glass container, which is also filled
with water. The gases are made to pass inside the column and time, for the gases to go
from the upper notch to the last, is measured by using a chronometer.
After collecting syngas production results, the catalytic reactor to produce methane
has been prepared. The first step of the procedure was the preparation of the catalyst.
100 g of the Ni/CaO-Al2O3 catalyst are divided in a 5 % of Ni and a 95 % of support, of
which the 25 % is CaO and the 75 % is Al2O3. Since Ni is available as Ni(NO3)2·6H2O,
it was necessary to calculate how many grams of Nickel (II) nitrate hexahydrate are
needed to obtain 5 g of Ni. Knowing that 1 mol of Ni(NO3)2·6H2O is needed to obtain 1
mol of Ni. The results of the calculations are that, for 100 g of catalyst, 24.76 g of
Ni(NO3)2·6H2O; 23.75 g of CaO and 71.25 g of Al2O3 are needed. In the specific case
of the tests performed, 50 g of catalyst have been produced, so every number needs to
be divided by two. The scheme followed to produce the catalyst is shown in Figure
3.3.1.
Figure 3.3.1: Scheme of production of the Ni/CaO-Al2O3 catalyst
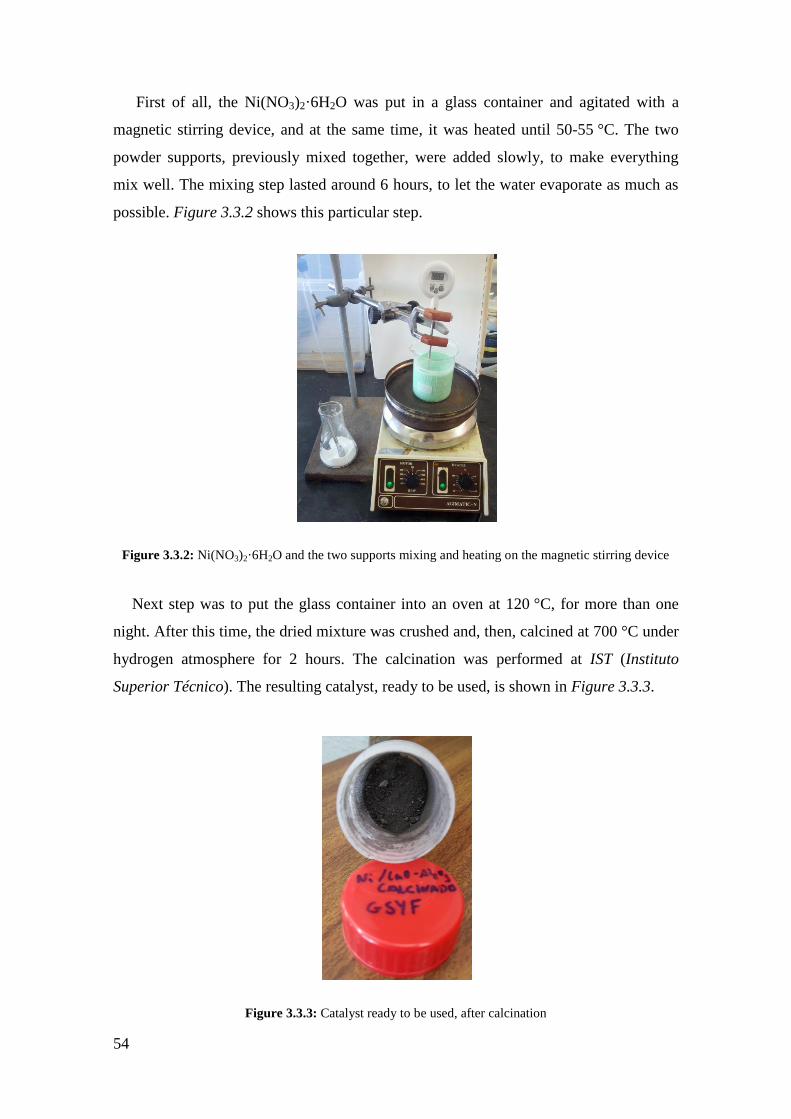
54
First of all, the Ni(NO3)2·6H2O was put in a glass container and agitated with a
magnetic stirring device, and at the same time, it was heated until 50-55 °C. The two
powder supports, previously mixed together, were added slowly, to make everything
mix well. The mixing step lasted around 6 hours, to let the water evaporate as much as
possible. Figure 3.3.2 shows this particular step.
Figure 3.3.2: Ni(NO3)2·6H2O and the two supports mixing and heating on the magnetic stirring device
Next step was to put the glass container into an oven at 120 °C, for more than one
night. After this time, the dried mixture was crushed and, then, calcined at 700 °C under
hydrogen atmosphere for 2 hours. The calcination was performed at IST (Instituto
Superior Técnico). The resulting catalyst, ready to be used, is shown in Figure 3.3.3.
Figure 3.3.3: Catalyst ready to be used, after calcination
55
Once the catalyst was ready, the following step has been understanding the amount
of catalyst needed for the methanation of syngas. The internal volume of the reactor has
been measured, and is 42 cm3. It has been decided to fill 1/3 with the catalyst (13.09 g),
and the rest with glass spheres (46.42 g). Since the first test has been made without
filling totally the reactor with the catalyst, the spheres have been put in the bottom and
in the upper part of the reactor, with the catalyst in the middle, to prevent the catalyst
from moving inside the reactor while the gases are flowing. A disk of porous material
between the layers of spheres and catalyst prevents them from mixing up. The tests have
been performed at different temperature, from room temperature to 200 °C. Even if the
system allows working at higher pressures than 1 bar, in this particular case, they were
performed only at atmospheric pressure. Again, the results were registered by the
analyzers and then collected for further analysis.
One of the tests that have been made was filling the catalytic reactor with graphite
nanoparticles. As shown in Table 4.1.1 in the next chapter, none of the tests performed
with the electrolyzer leads to the total removal of oxygen by reacting with the graphite
electrodes to produce more CO and CO2. The complete removal of oxygen is needed for
two reasons:
- the catalyst deactivates with oxygen;
- hydrogen is an extremely explosive compound in oxygen atmosphere.
The objective was to remove the oxygen before feeding the gas mixture into the
catalytic reactor for the methanation process, by making it react with the graphite
nanoparticles. The tests were performed considering, as a sample, the potentially most
reactive gas mixture, which is the one with the highest oxygen content.
Firstly, the reactor was filled completely with graphite nanoparticles and then tested
at 50 °C and 100 °C.

56
For reasons that will be better explained in the chapter describing the discussion of
results, it was then decided to fill only half of the reactor with graphite nanoparticles,
and also to check the flow rate and pressure behavior. The tests were performed at
different temperatures, starting from room temperature (23 °C in the testing day), and
increasing slowly to 50 °C, 100 °C and 200 °C.
The composition of the gases from some of the tests has been also analyzed with a
gas chromatrograph, typically used for this purpose, from LNEG (Laboratório Nacional
de Energia e Geologia), in order to validate the obtained results.
57
4. RESULTS AND DISCUSSION
4.1 Collection of experimental results
4.1.1 Alkaline water electrolysis-stack 1
As mentioned before, the first step of the work was the production of synthesis gas
by alkaline water electrolysis. The pilot prototype is provided with two different
electrolyzers, which will be hereafter indicated as “stack 1” and “stack 2”. In a first
stage, stack 1 was used. It is composed by 11 graphite disks 0.5 cm high each, separated
by 10 o-rings (33 mm high each), with a resulting number of cells equal to 10. The
prototype allows to set parameters such as pressure, thanks to the device described in
Figure 3.2.3, and voltage and temperature from the control panel, which shows in
response the current intensity related to the applied voltage. At the same time, the
analyzers show the product gas composition. To complete the methodology of test
execution, every possible combination of the three parameters has been analyzed. In
particular, the temperature was changed in a range of 60-90 °C, with a variation of 5 °C
in each test, while keeping voltage and pressure fixed. Once the temperature span was
completely analyzed, the voltage was changed, and new tests were realized in the same
range of temperature as before, keeping the new voltage and the same pressure as fixed
before. In particular, this procedure was followed until every voltage value in the range
30-50 V (with a variation of 5 V in each test) was analyzed, and then the same
procedure was repeated again at a different pressure. In particular, the pressure range
analyzed was 1-4 bar.
As previously reported, the testing ranges for pressure, voltage and temperature were
chosen after previous tests that showed a too low current intensity for voltage values
lower than 30 V and also a too low CO2 production for temperature values lower than
60 °C. The upper limits of the range were chosen instead while testing, since increasing
those parameters does not produce any improvement in the production. In what
concerns temperature, the upper limit was chosen also because the higher the
temperature, the higher the steam production and a decrease in conductivity was
observed.
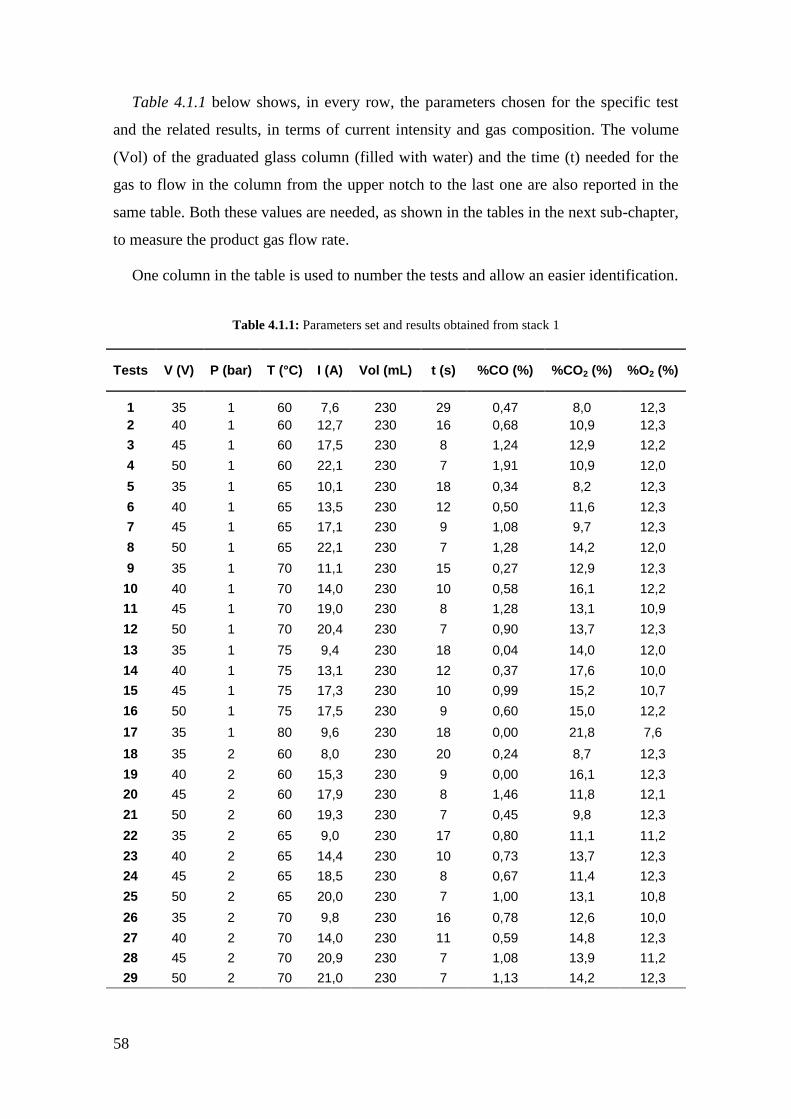
58
Table 4.1.1 below shows, in every row, the parameters chosen for the specific test
and the related results, in terms of current intensity and gas composition. The volume
(Vol) of the graduated glass column (filled with water) and the time (t) needed for the
gas to flow in the column from the upper notch to the last one are also reported in the
same table. Both these values are needed, as shown in the tables in the next sub-chapter,
to measure the product gas flow rate.
One column in the table is used to number the tests and allow an easier identification.
Table 4.1.1: Parameters set and results obtained from stack 1
Tests V (V) P (bar) T (°C) I (A) Vol (mL) t (s) %CO (%) %CO2 (%) %O2 (%)
1 35 1 60 7,6 230 29 0,47 8,0 12,3
2 40 1 60 12,7 230 16 0,68 10,9 12,3
3 45 1 60 17,5 230 8 1,24 12,9 12,2
4 50 1 60 22,1 230 7 1,91 10,9 12,0
5 35 1 65 10,1 230 18 0,34 8,2 12,3
6 40 1 65 13,5 230 12 0,50 11,6 12,3
7 45 1 65 17,1 230 9 1,08 9,7 12,3
8 50 1 65 22,1 230 7 1,28 14,2 12,0
9 35 1 70 11,1 230 15 0,27 12,9 12,3
10 40 1 70 14,0 230 10 0,58 16,1 12,2
11 45 1 70 19,0 230 8 1,28 13,1 10,9
12 50 1 70 20,4 230 7 0,90 13,7 12,3
13 35 1 75 9,4 230 18 0,04 14,0 12,0
14 40 1 75 13,1 230 12 0,37 17,6 10,0
15 45 1 75 17,3 230 10 0,99 15,2 10,7
16 50 1 75 17,5 230 9 0,60 15,0 12,2
17 35 1 80 9,6 230 18 0,00 21,8 7,6
18 35 2 60 8,0 230 20 0,24 8,7 12,3
19 40 2 60 15,3 230 9 0,00 16,1 12,3
20 45 2 60 17,9 230 8 1,46 11,8 12,1
21 50 2 60 19,3 230 7 0,45 9,8 12,3
22 35 2 65 9,0 230 17 0,80 11,1 11,2
23 40 2 65 14,4 230 10 0,73 13,7 12,3
24 45 2 65 18,5 230 8 0,67 11,4 12,3
25 50 2 65 20,0 230 7 1,00 13,1 10,8
26 35 2 70 9,8 230 16 0,78 12,6 10,0
27 40 2 70 14,0 230 11 0,59 14,8 12,3
28 45 2 70 20,9 230 7 1,08 13,9 11,2
29 50 2 70 21,0 230 7 1,13 14,2 12,3
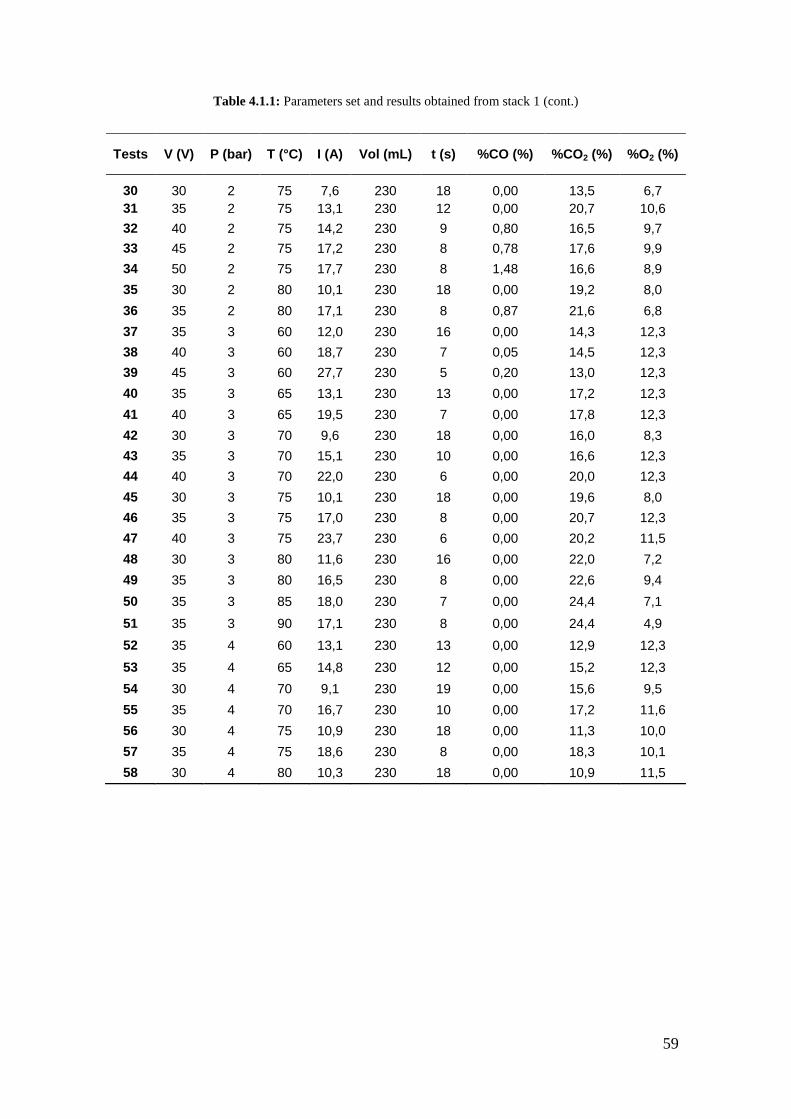
59
Table 4.1.1: Parameters set and results obtained from stack 1 (cont.)
Tests V (V) P (bar) T (°C) I (A) Vol (mL) t (s) %CO (%) %CO2 (%) %O2 (%)
30 30 2 75 7,6 230 18 0,00 13,5 6,7
31 35 2 75 13,1 230 12 0,00 20,7 10,6
32 40 2 75 14,2 230 9 0,80 16,5 9,7
33 45 2 75 17,2 230 8 0,78 17,6 9,9
34 50 2 75 17,7 230 8 1,48 16,6 8,9
35 30 2 80 10,1 230 18 0,00 19,2 8,0
36 35 2 80 17,1 230 8 0,87 21,6 6,8
37 35 3 60 12,0 230 16 0,00 14,3 12,3
38 40 3 60 18,7 230 7 0,05 14,5 12,3
39 45 3 60 27,7 230 5 0,20 13,0 12,3
40 35 3 65 13,1 230 13 0,00 17,2 12,3
41 40 3 65 19,5 230 7 0,00 17,8 12,3
42 30 3 70 9,6 230 18 0,00 16,0 8,3
43 35 3 70 15,1 230 10 0,00 16,6 12,3
44 40 3 70 22,0 230 6 0,00 20,0 12,3
45 30 3 75 10,1 230 18 0,00 19,6 8,0
46 35 3 75 17,0 230 8 0,00 20,7 12,3
47 40 3 75 23,7 230 6 0,00 20,2 11,5
48 30 3 80 11,6 230 16 0,00 22,0 7,2
49 35 3 80 16,5 230 8 0,00 22,6 9,4
50 35 3 85 18,0 230 7 0,00 24,4 7,1
51 35 3 90 17,1 230 8 0,00 24,4 4,9
52 35 4 60 13,1 230 13 0,00 12,9 12,3
53 35 4 65 14,8 230 12 0,00 15,2 12,3
54 30 4 70 9,1 230 19 0,00 15,6 9,5
55 35 4 70 16,7 230 10 0,00 17,2 11,6
56 30 4 75 10,9 230 18 0,00 11,3 10,0
57 35 4 75 18,6 230 8 0,00 18,3 10,1
58 30 4 80 10,3 230 18 0,00 10,9 11,5
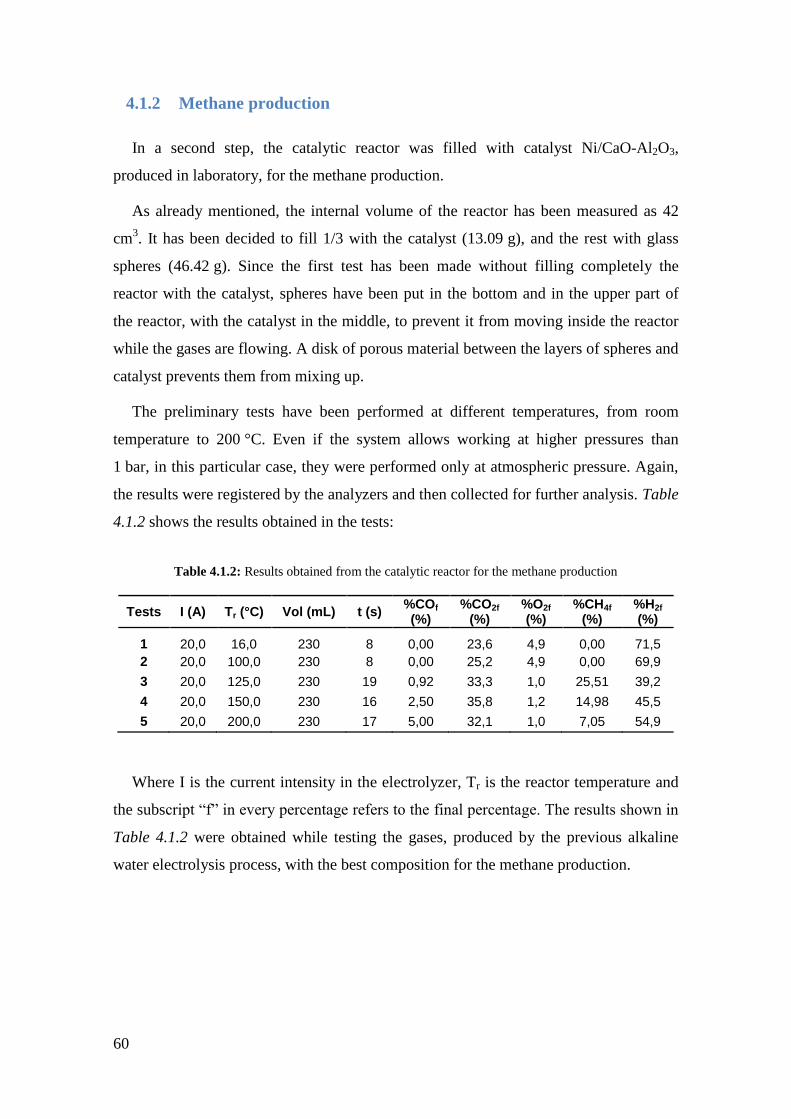
60
4.1.2 Methane production
In a second step, the catalytic reactor was filled with catalyst Ni/CaO-Al2O3,
produced in laboratory, for the methane production.
As already mentioned, the internal volume of the reactor has been measured as 42
cm3. It has been decided to fill 1/3 with the catalyst (13.09 g), and the rest with glass
spheres (46.42 g). Since the first test has been made without filling completely the
reactor with the catalyst, spheres have been put in the bottom and in the upper part of
the reactor, with the catalyst in the middle, to prevent it from moving inside the reactor
while the gases are flowing. A disk of porous material between the layers of spheres and
catalyst prevents them from mixing up.
The preliminary tests have been performed at different temperatures, from room
temperature to 200 °C. Even if the system allows working at higher pressures than
1 bar, in this particular case, they were performed only at atmospheric pressure. Again,
the results were registered by the analyzers and then collected for further analysis. Table
4.1.2 shows the results obtained in the tests:
Table 4.1.2: Results obtained from the catalytic reactor for the methane production
Tests I (A) Tr (°C) Vol (mL) t (s) %COf (%)
%CO2f (%)
%O2f (%)
%CH4f (%)
%H2f (%)
1 20,0 16,0 230 8 0,00 23,6 4,9 0,00 71,5
2 20,0 100,0 230 8 0,00 25,2 4,9 0,00 69,9
3 20,0 125,0 230 19 0,92 33,3 1,0 25,51 39,2
4 20,0 150,0 230 16 2,50 35,8 1,2 14,98 45,5
5 20,0 200,0 230 17 5,00 32,1 1,0 7,05 54,9
Where I is the current intensity in the electrolyzer, Tr is the reactor temperature and
the subscript “f” in every percentage refers to the final percentage. The results shown in
Table 4.1.2 were obtained while testing the gases, produced by the previous alkaline
water electrolysis process, with the best composition for the methane production.
61
4.1.3 Alkaline water electrolysis-stack 2
In a third step, stack 2 was used. Every disk in this stack is 1 cm high, the double of
the height of the disks in stack 1. Consequently, this stack has less graphite disks (7
instead of 11) separated by 6 o-rings (33 mm high each), with a resulting number of
cells equal to 6. As already mentioned, the electrodes that fill this stack are cheaper than
the ones in stack 1.
The three parameters fixed while studying stack 2 were pressure, current intensity
and temperature (respectively, by using the device described in Figure 3.2.3 and the
control panel). The current intensity was changed in a range of 8-20 A (which
corresponds to a voltage range of 20-27.5 V), the temperature was changed in a range of
45-85 °C and the pressure was kept at 1 bar. The decision of fixing the current instead
of voltage resulted from knowledge achieved while testing, first with the laboratory
prototype and then with the 1 kW pilot plant. What has been noticed is that the current
intensity affects the increase of temperature, the flow rate and the conductivity (which
means the production itself), and voltage is just a mean to obtain the desired current.
The testing ranges for pressure, current and temperature were chosen after previous
tests that showed too low CO2 production for current intensities lower than 8 A and
temperature values lower than 45 °C. The number of tests made to check these limits
were fewer than the ones made for stack 1, thanks to the previous experience obtained
with it. The upper limits of the range were chosen, instead, while testing, since no
improvement in the production has been noticed while increasing those parameters. A
different reasoning has to be done in what regards pressure, since higher pressures were
not explored due to the lack of time (since this is a time-limited and preliminary work).
The methodology used for this stack is the same used for the first one, in order to
make the tests execution complete: every possible combination of the three parameters
has been tested. In particular, the temperature was changed in a range of 45-85 °C, with
a variation of 5 °C in each test, while keeping current intensity (and then voltage) and
pressure fixed. Once the temperature span was completely tested, the current intensity
was changed, and new tests were performed in the same range of temperature as before,
keeping the new intensity and the same pressure as before fixed. In particular, this
procedure was followed until every intensity value in the range 8-20 A (with a variation
of 5 A in each test) was tested, at 1 bar.
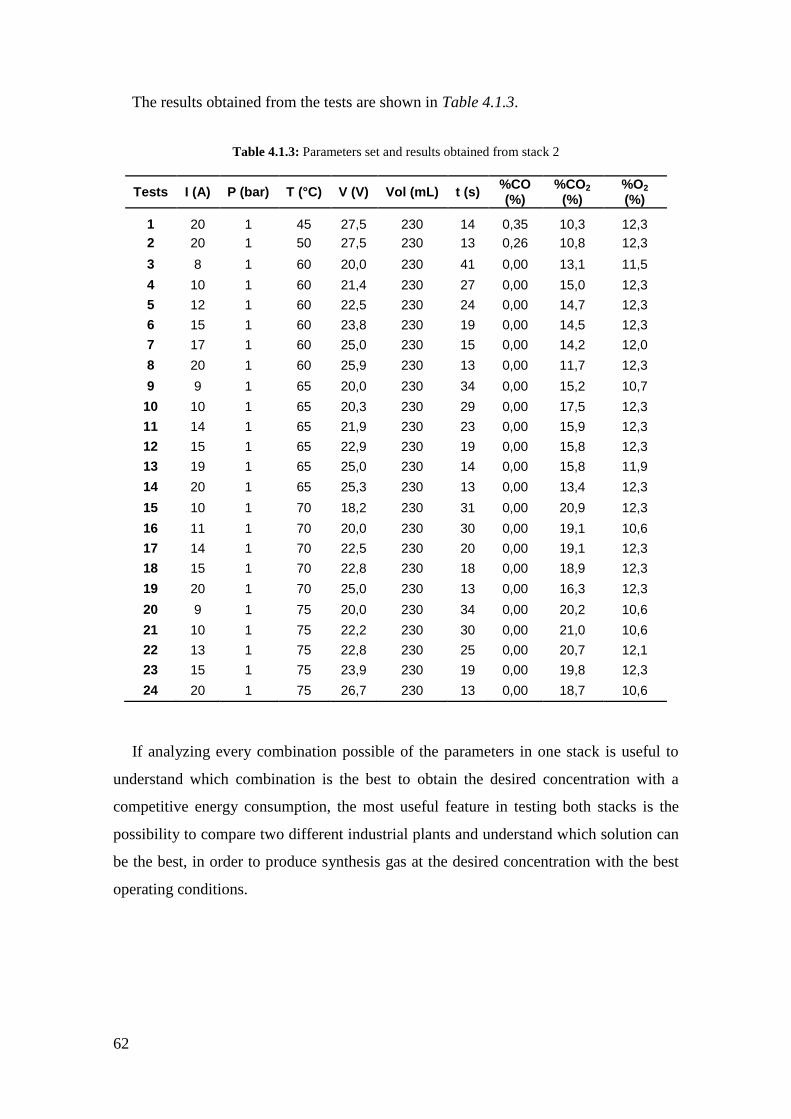
62
The results obtained from the tests are shown in Table 4.1.3.
Table 4.1.3: Parameters set and results obtained from stack 2
Tests I (A) P (bar) T (°C) V (V) Vol (mL) t (s) %CO (%)
%CO2
(%) %O2 (%)
1 20 1 45 27,5 230 14 0,35 10,3 12,3
2 20 1 50 27,5 230 13 0,26 10,8 12,3
3 8 1 60 20,0 230 41 0,00 13,1 11,5
4 10 1 60 21,4 230 27 0,00 15,0 12,3
5 12 1 60 22,5 230 24 0,00 14,7 12,3
6 15 1 60 23,8 230 19 0,00 14,5 12,3
7 17 1 60 25,0 230 15 0,00 14,2 12,0
8 20 1 60 25,9 230 13 0,00 11,7 12,3
9 9 1 65 20,0 230 34 0,00 15,2 10,7
10 10 1 65 20,3 230 29 0,00 17,5 12,3
11 14 1 65 21,9 230 23 0,00 15,9 12,3
12 15 1 65 22,9 230 19 0,00 15,8 12,3
13 19 1 65 25,0 230 14 0,00 15,8 11,9
14 20 1 65 25,3 230 13 0,00 13,4 12,3
15 10 1 70 18,2 230 31 0,00 20,9 12,3
16 11 1 70 20,0 230 30 0,00 19,1 10,6
17 14 1 70 22,5 230 20 0,00 19,1 12,3
18 15 1 70 22,8 230 18 0,00 18,9 12,3
19 20 1 70 25,0 230 13 0,00 16,3 12,3
20 9 1 75 20,0 230 34 0,00 20,2 10,6
21 10 1 75 22,2 230 30 0,00 21,0 10,6
22 13 1 75 22,8 230 25 0,00 20,7 12,1
23 15 1 75 23,9 230 19 0,00 19,8 12,3
24 20 1 75 26,7 230 13 0,00 18,7 10,6
If analyzing every combination possible of the parameters in one stack is useful to
understand which combination is the best to obtain the desired concentration with a
competitive energy consumption, the most useful feature in testing both stacks is the
possibility to compare two different industrial plants and understand which solution can
be the best, in order to produce synthesis gas at the desired concentration with the best
operating conditions.
63
4.2 Treatment of results
In this sub-chapter the results obtained in the tests, and divided into different sections
depending on the testing purpose, will be completely explained and discussed. First of
all, before every table and the respective following discussion, each section will report
the calculations made from the results previously shown, in order to obtain some
relevant values.
4.2.1 Alkaline water electrolysis-stack 1
Regarding the alkaline water electrolysis, the product gas flow rate has been
calculated as follows:
(4.1)
Where is the flow rate [L/h], is the volume [L] and is time [h].
To convert from flow rate to flow rate per cell ( in [L/(h cell)]), the following
simple calculation has been done:
(4.2)
This value will be needed for further comparison between stack 1 and stack 2
performances in the electrolyzer.
(4.3)
Where is the consumed energy [Wh/L], is the voltage [V] and is the
electrical current [A].
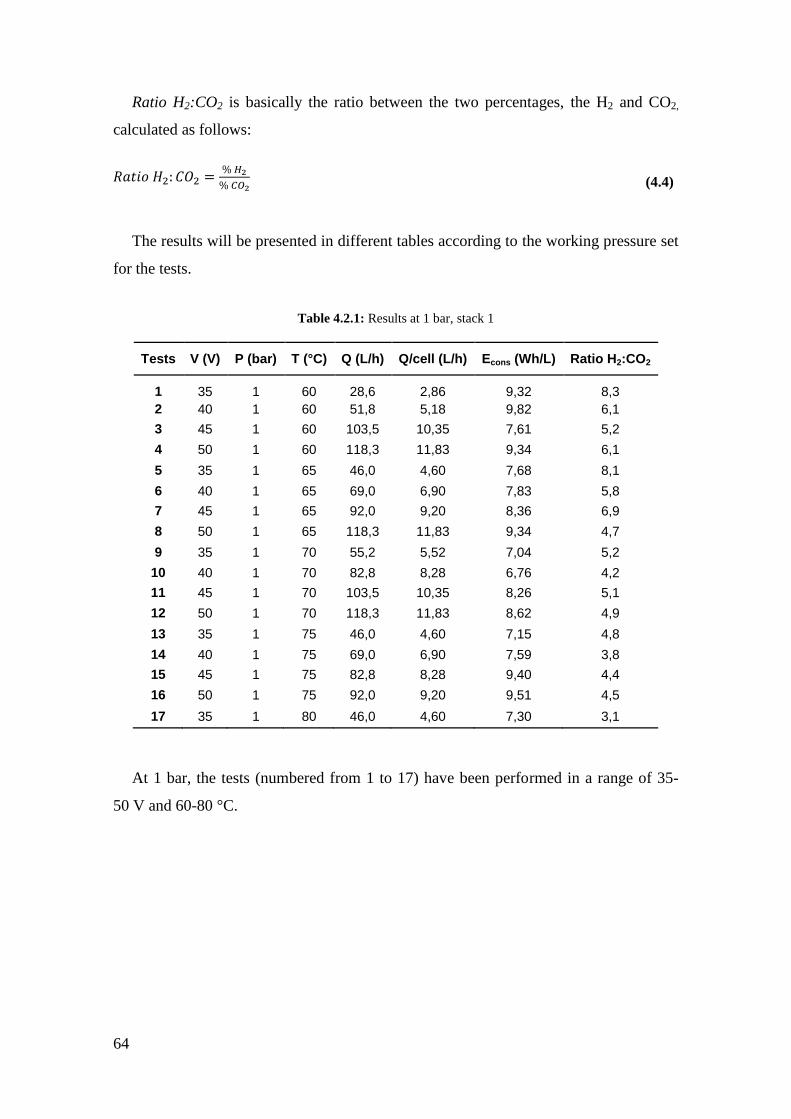
64
Ratio H2:CO2 is basically the ratio between the two percentages, the H2 and CO2,
calculated as follows:
(4.4)
The results will be presented in different tables according to the working pressure set
for the tests.
Table 4.2.1: Results at 1 bar, stack 1
Tests V (V) P (bar) T (°C) Q (L/h) Q/cell (L/h) Econs (Wh/L) Ratio H2:CO2
1 35 1 60 28,6 2,86 9,32 8,3
2 40 1 60 51,8 5,18 9,82 6,1
3 45 1 60 103,5 10,35 7,61 5,2
4 50 1 60 118,3 11,83 9,34 6,1
5 35 1 65 46,0 4,60 7,68 8,1
6 40 1 65 69,0 6,90 7,83 5,8
7 45 1 65 92,0 9,20 8,36 6,9
8 50 1 65 118,3 11,83 9,34 4,7
9 35 1 70 55,2 5,52 7,04 5,2
10 40 1 70 82,8 8,28 6,76 4,2
11 45 1 70 103,5 10,35 8,26 5,1
12 50 1 70 118,3 11,83 8,62 4,9
13 35 1 75 46,0 4,60 7,15 4,8
14 40 1 75 69,0 6,90 7,59 3,8
15 45 1 75 82,8 8,28 9,40 4,4
16 50 1 75 92,0 9,20 9,51 4,5
17 35 1 80 46,0 4,60 7,30 3,1
At 1 bar, the tests (numbered from 1 to 17) have been performed in a range of 35-
50 V and 60-80 °C.
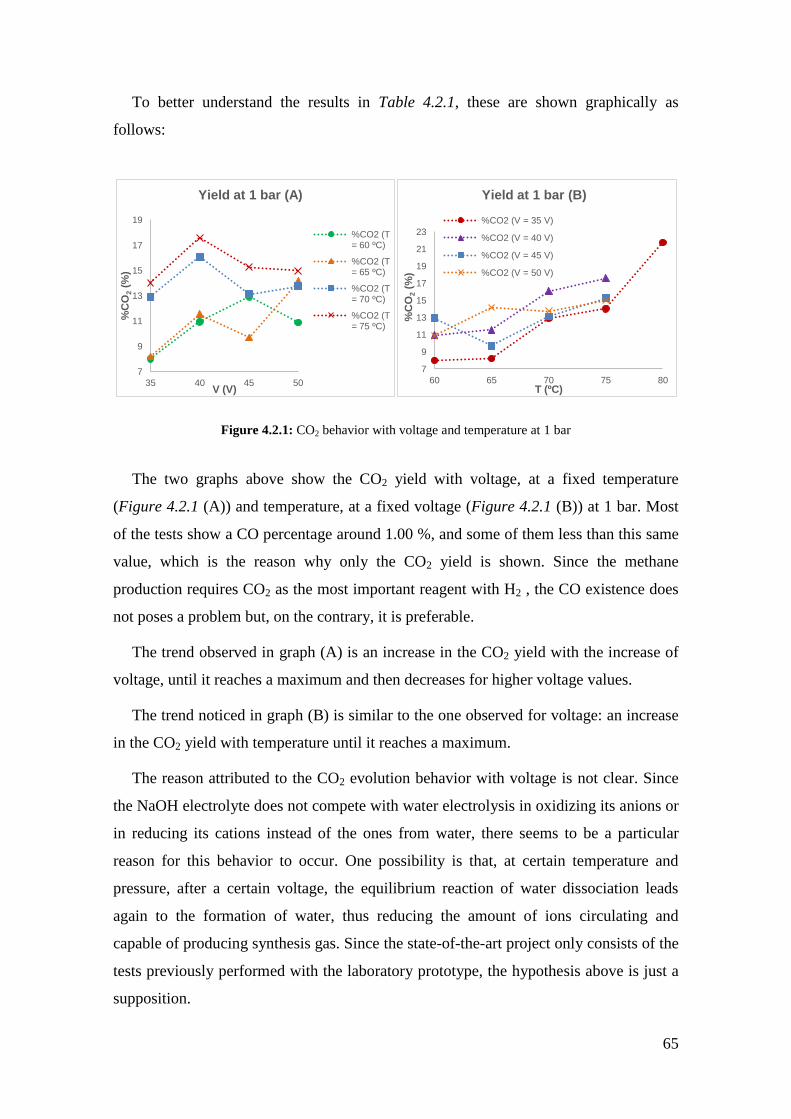
65
To better understand the results in Table 4.2.1, these are shown graphically as
follows:
Figure 4.2.1: CO2 behavior with voltage and temperature at 1 bar
The two graphs above show the CO2 yield with voltage, at a fixed temperature
(Figure 4.2.1 (A)) and temperature, at a fixed voltage (Figure 4.2.1 (B)) at 1 bar. Most
of the tests show a CO percentage around 1.00 %, and some of them less than this same
value, which is the reason why only the CO2 yield is shown. Since the methane
production requires CO2 as the most important reagent with H2 , the CO existence does
not poses a problem but, on the contrary, it is preferable.
The trend observed in graph (A) is an increase in the CO2 yield with the increase of
voltage, until it reaches a maximum and then decreases for higher voltage values.
The trend noticed in graph (B) is similar to the one observed for voltage: an increase
in the CO2 yield with temperature until it reaches a maximum.
The reason attributed to the CO2 evolution behavior with voltage is not clear. Since
the NaOH electrolyte does not compete with water electrolysis in oxidizing its anions or
in reducing its cations instead of the ones from water, there seems to be a particular
reason for this behavior to occur. One possibility is that, at certain temperature and
pressure, after a certain voltage, the equilibrium reaction of water dissociation leads
again to the formation of water, thus reducing the amount of ions circulating and
capable of producing synthesis gas. Since the state-of-the-art project only consists of the
tests previously performed with the laboratory prototype, the hypothesis above is just a
supposition.
7
9
11
13
15
17
19
35 40 45 50
%C
O2 (
%)
V (V)
Yield at 1 bar (A)
%CO2 (T = 60 ºC)
%CO2 (T = 65 ºC)
%CO2 (T = 70 ºC)
%CO2 (T = 75 ºC)
7
9
11
13
15
17
19
21
23
60 65 70 75 80
%C
O2 (
%)
T (ºC)
Yield at 1 bar (B)
%CO2 (V = 35 V)
%CO2 (V = 40 V)
%CO2 (V = 45 V)
%CO2 (V = 50 V)
66
In fact, the results of these previous tests support the present observed behavior,
since the composition trend with voltage registered then was the same as now.
Regarding temperature, its increase favors the dissociation of the electrolytic
solution, and, as a consequence, the increase of the electric conductivity.
Some results shown in the graphs do not conform with this pattern, and one plausible
reason is related with the uncertainty of the gas analyzers’ measurements. Another
possible cause can be related with the fact that, on the electrolytic system (the pilot
plant), it is not possible to control the temperature increase, as the reaction easily
reaches temperatures (due to the Joule effect) which were not foreseen with the previous
prototype. Considering this, it is not easy to stabilize the results on the analyzers, and
sometimes it is possible to register false values. An additional reason can be that, after
some time using the same electrolyte it was needed to replace it with a new one, since
there were losses due to evolved steam produced while working at high temperature
(and which is then purged as condensation). Since the electrolyte ability to conduct is
not the same during all the working period, tests performed with different electrolyte or
in distant time frames can be somewhat different and show an apparently strange result.
One interesting aspect has been detected right after changing the electrolytic
solution: for about one or two days, even if the electrolyzer is working, no CO2
production is registered. The reason for this behavior is believed to be the solubility of
CO2 in water (as visible in sparkling water) until the gas reaches the saturation
concentration. Probably, in this case, the lapse of time needed until CO2 reaches
saturation in the electrolyte corresponds to the elapsed time needed for the analyzers to
measure the CO2 percentage. Another reason, together with the previous one, can be
that NaOH reacts with CO2 to produce sodium carbonate (Na2CO3), by the following
reaction (4.5):
2NaOH + CO2 Na2CO3 + H2O (4.5)
This means that some time is needed for sodium hydroxide to react with CO2 and
produce sodium carbonate. When this reaction is completed, then the carbon dioxide
production starts and can be measured on the analyzers. Another reason can be (together
with the others), that graphite partially detaches from the electrodes and circulates with
the electrolytic solution while the system is running.
67
This has been considered as, probably, another significant way O2 can react
producing CO2 (more significant than the reaction of the graphite attached to the disks
itself). If this hypothesis is true, a change in the electrolytic solution means that some
time is required for the graphite “powder” to circulate and react, producing CO2 again.
A test has been done in order to verify the supposition. It was conducted in a laboratory
prototype, using steel electrodes in the electrolyzer, instead of the graphite ones. The
prototype was filled with the electrolytic solution already used in the 1 kW plant, and it
was let to circulate in the system to produce gas. The resulting gas was then passed
through the analyzers. The test did not result in any CO2 production, but the test had
several problems, like difficulties in recirculating the solution and completely feeding
the electrolyzer, and a too low gas flow rate which could not be enough for the
analyzers to correctly measure it. Therefore, this test was not conclusive, which
recommends that similar tests should be performed in the near future.
The following Table 4.2.2 shows parameters and results obtained at 2 bar, with
stack 1.
Table 4.2.2: Results at 2 bar, stack 1
Tests V (V) P (bar) T (°C) Q (L/h) Q/cell (L/h) Econs (Wh/L) Ratio H2:CO2
18 35 2 60 41,4 4,14 6,76 7,6
19 40 2 60 92,0 9,20 6,65 4,2
20 45 2 60 103,5 10,35 7,78 5,6
21 50 2 60 118,3 11,83 8,16 6,8
22 35 2 65 48,7 4,87 6,47 6,0
23 40 2 65 82,8 8,28 6,96 4,9
24 45 2 65 103,5 10,35 8,04 5,8
25 50 2 65 118,3 11,83 8,45 5,1
26 35 2 70 51,8 5,18 6,63 5,3
27 40 2 70 75,3 7,53 7,44 4,5
28 45 2 70 118,3 11,83 7,95 4,8
29 50 2 70 118,3 11,83 8,88 4,7
30 30 2 75 46,0 4,60 4,96 5,0
31 35 2 75 69,0 6,90 6,64 3,2
32 40 2 75 92,0 9,20 6,17 4,0
33 45 2 75 103,5 10,35 7,48 3,8
34 50 2 75 103,5 10,35 8,55 4,0
35 30 2 80 46,0 4,60 6,59 3,5
36 35 2 80 103,5 10,35 5,78 3,1
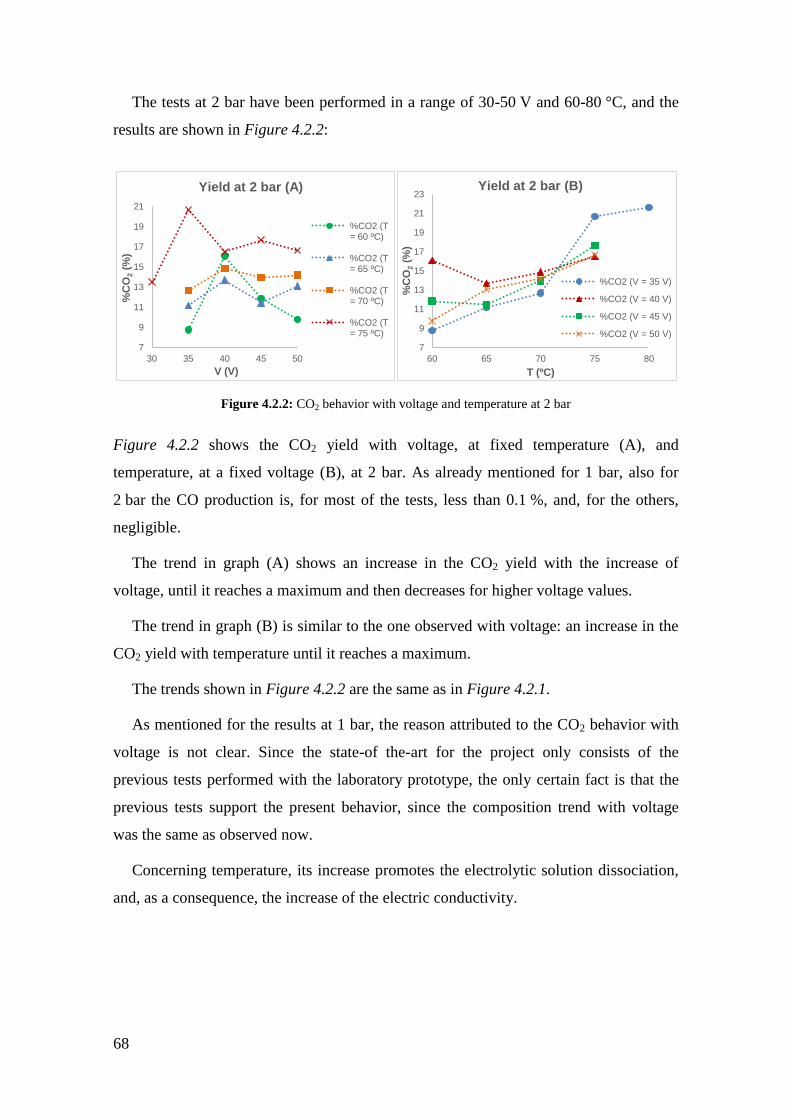
68
The tests at 2 bar have been performed in a range of 30-50 V and 60-80 °C, and the
results are shown in Figure 4.2.2:
Figure 4.2.2: CO2 behavior with voltage and temperature at 2 bar
Figure 4.2.2 shows the CO2 yield with voltage, at fixed temperature (A), and
temperature, at a fixed voltage (B), at 2 bar. As already mentioned for 1 bar, also for
2 bar the CO production is, for most of the tests, less than 0.1 %, and, for the others,
negligible.
The trend in graph (A) shows an increase in the CO2 yield with the increase of
voltage, until it reaches a maximum and then decreases for higher voltage values.
The trend in graph (B) is similar to the one observed with voltage: an increase in the
CO2 yield with temperature until it reaches a maximum.
The trends shown in Figure 4.2.2 are the same as in Figure 4.2.1.
As mentioned for the results at 1 bar, the reason attributed to the CO2 behavior with
voltage is not clear. Since the state-of the-art for the project only consists of the
previous tests performed with the laboratory prototype, the only certain fact is that the
previous tests support the present behavior, since the composition trend with voltage
was the same as observed now.
Concerning temperature, its increase promotes the electrolytic solution dissociation,
and, as a consequence, the increase of the electric conductivity.
7
9
11
13
15
17
19
21
30 35 40 45 50
%C
O2 (
%)
V (V)
Yield at 2 bar (A)
%CO2 (T = 60 ºC)
%CO2 (T = 65 ºC)
%CO2 (T = 70 ºC)
%CO2 (T = 75 ºC)
7
9
11
13
15
17
19
21
23
60 65 70 75 80
%C
O2 (
%)
T (ºC)
Yield at 2 bar (B)
%CO2 (V = 35 V)
%CO2 (V = 40 V)
%CO2 (V = 45 V)
%CO2 (V = 50 V)
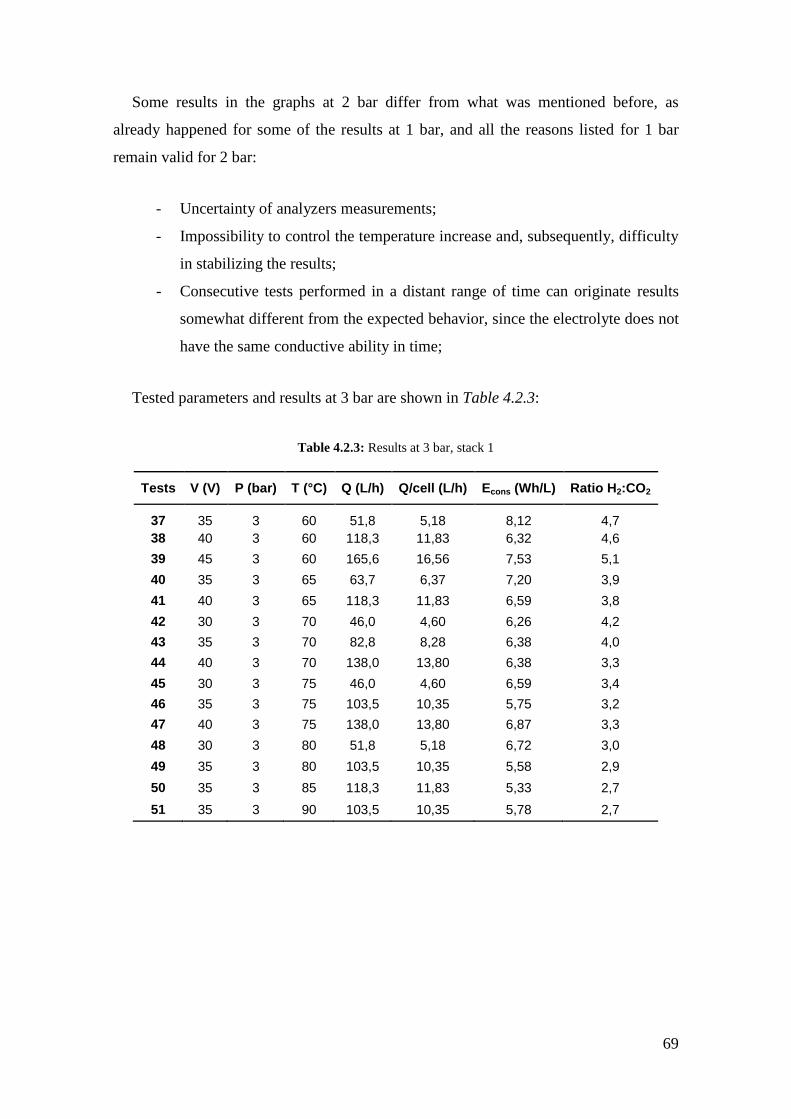
69
Some results in the graphs at 2 bar differ from what was mentioned before, as
already happened for some of the results at 1 bar, and all the reasons listed for 1 bar
remain valid for 2 bar:
- Uncertainty of analyzers measurements;
- Impossibility to control the temperature increase and, subsequently, difficulty
in stabilizing the results;
- Consecutive tests performed in a distant range of time can originate results
somewhat different from the expected behavior, since the electrolyte does not
have the same conductive ability in time;
Tested parameters and results at 3 bar are shown in Table 4.2.3:
Table 4.2.3: Results at 3 bar, stack 1
Tests V (V) P (bar) T (°C) Q (L/h) Q/cell (L/h) Econs (Wh/L) Ratio H2:CO2
37 35 3 60 51,8 5,18 8,12 4,7
38 40 3 60 118,3 11,83 6,32 4,6
39 45 3 60 165,6 16,56 7,53 5,1
40 35 3 65 63,7 6,37 7,20 3,9
41 40 3 65 118,3 11,83 6,59 3,8
42 30 3 70 46,0 4,60 6,26 4,2
43 35 3 70 82,8 8,28 6,38 4,0
44 40 3 70 138,0 13,80 6,38 3,3
45 30 3 75 46,0 4,60 6,59 3,4
46 35 3 75 103,5 10,35 5,75 3,2
47 40 3 75 138,0 13,80 6,87 3,3
48 30 3 80 51,8 5,18 6,72 3,0
49 35 3 80 103,5 10,35 5,58 2,9
50 35 3 85 118,3 11,83 5,33 2,7
51 35 3 90 103,5 10,35 5,78 2,7
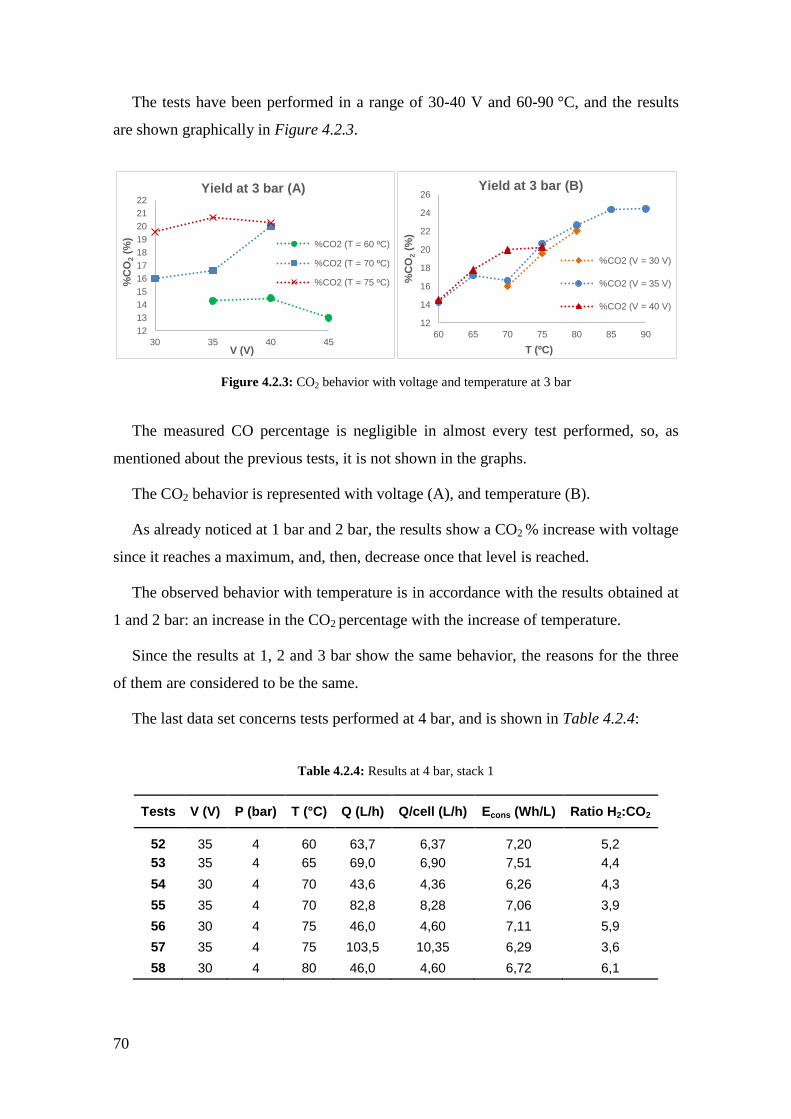
70
The tests have been performed in a range of 30-40 V and 60-90 °C, and the results
are shown graphically in Figure 4.2.3.
Figure 4.2.3: CO2 behavior with voltage and temperature at 3 bar
The measured CO percentage is negligible in almost every test performed, so, as
mentioned about the previous tests, it is not shown in the graphs.
The CO2 behavior is represented with voltage (A), and temperature (B).
As already noticed at 1 bar and 2 bar, the results show a CO2 % increase with voltage
since it reaches a maximum, and, then, decrease once that level is reached.
The observed behavior with temperature is in accordance with the results obtained at
1 and 2 bar: an increase in the CO2 percentage with the increase of temperature.
Since the results at 1, 2 and 3 bar show the same behavior, the reasons for the three
of them are considered to be the same.
The last data set concerns tests performed at 4 bar, and is shown in Table 4.2.4:
Table 4.2.4: Results at 4 bar, stack 1
Tests V (V) P (bar) T (°C) Q (L/h) Q/cell (L/h) Econs (Wh/L) Ratio H2:CO2
52 35 4 60 63,7 6,37 7,20 5,2
53 35 4 65 69,0 6,90 7,51 4,4
54 30 4 70 43,6 4,36 6,26 4,3
55 35 4 70 82,8 8,28 7,06 3,9
56 30 4 75 46,0 4,60 7,11 5,9
57 35 4 75 103,5 10,35 6,29 3,6
58 30 4 80 46,0 4,60 6,72 6,1
12
13
14
15
16
17
18
19
20
21
22
30 35 40 45
%C
O2 (
%)
V (V)
Yield at 3 bar (A)
%CO2 (T = 60 ºC)
%CO2 (T = 70 ºC)
%CO2 (T = 75 ºC)
12
14
16
18
20
22
24
26
60 65 70 75 80 85 90
%C
O2 (
%)
T (ºC)
Yield at 3 bar (B)
%CO2 (V = 30 V)
%CO2 (V = 35 V)
%CO2 (V = 40 V)
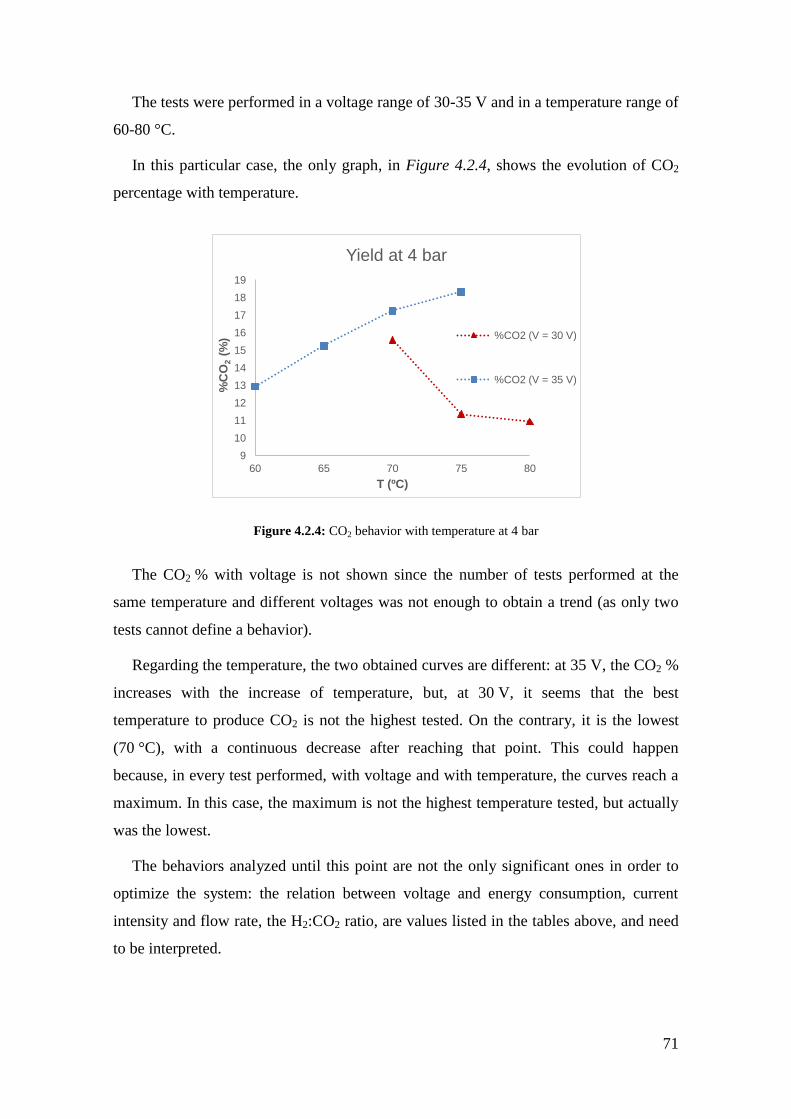
71
The tests were performed in a voltage range of 30-35 V and in a temperature range of
60-80 °C.
In this particular case, the only graph, in Figure 4.2.4, shows the evolution of CO2
percentage with temperature.
Figure 4.2.4: CO2 behavior with temperature at 4 bar
The CO2 % with voltage is not shown since the number of tests performed at the
same temperature and different voltages was not enough to obtain a trend (as only two
tests cannot define a behavior).
Regarding the temperature, the two obtained curves are different: at 35 V, the CO2 %
increases with the increase of temperature, but, at 30 V, it seems that the best
temperature to produce CO2 is not the highest tested. On the contrary, it is the lowest
(70 °C), with a continuous decrease after reaching that point. This could happen
because, in every test performed, with voltage and with temperature, the curves reach a
maximum. In this case, the maximum is not the highest temperature tested, but actually
was the lowest.
The behaviors analyzed until this point are not the only significant ones in order to
optimize the system: the relation between voltage and energy consumption, current
intensity and flow rate, the H2:CO2 ratio, are values listed in the tables above, and need
to be interpreted.
9
10
11
12
13
14
15
16
17
18
19
60 65 70 75 80
%C
O2 (
%)
T (ºC)
Yield at 4 bar
%CO2 (V = 30 V)
%CO2 (V = 35 V)
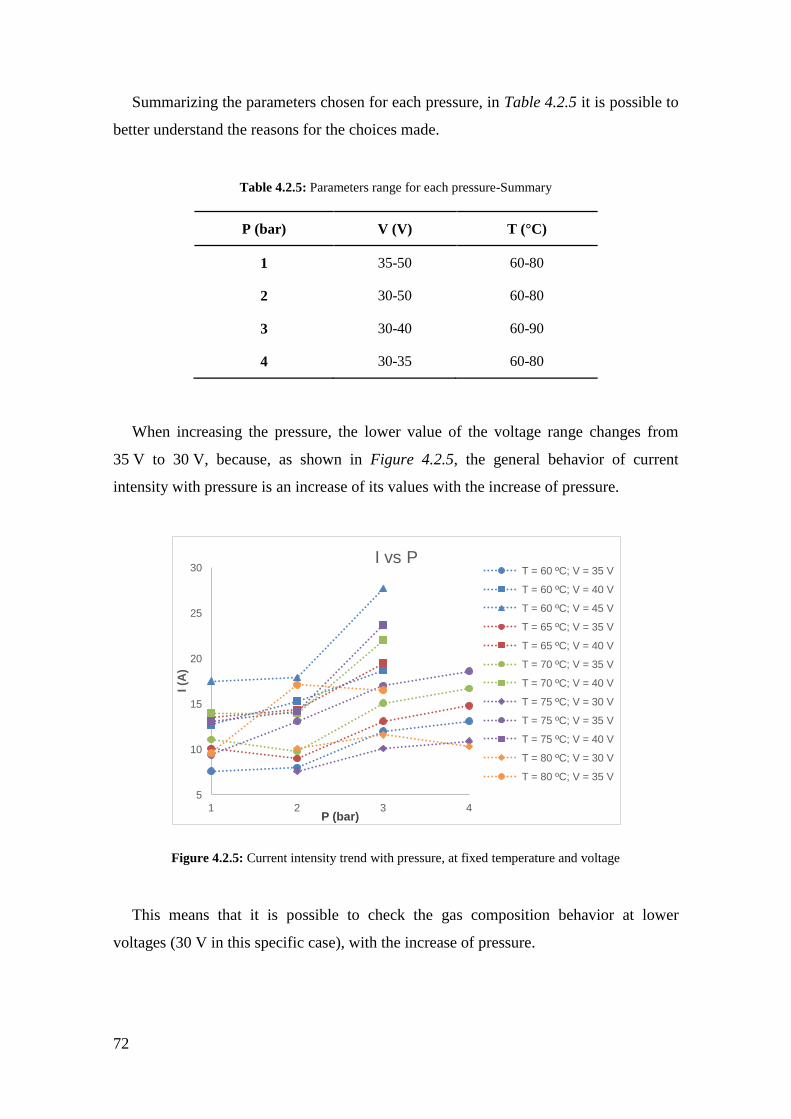
72
Summarizing the parameters chosen for each pressure, in Table 4.2.5 it is possible to
better understand the reasons for the choices made.
Table 4.2.5: Parameters range for each pressure-Summary
P (bar) V (V) T (°C)
1 35-50 60-80
2 30-50 60-80
3 30-40 60-90
4 30-35 60-80
When increasing the pressure, the lower value of the voltage range changes from
35 V to 30 V, because, as shown in Figure 4.2.5, the general behavior of current
intensity with pressure is an increase of its values with the increase of pressure.
Figure 4.2.5: Current intensity trend with pressure, at fixed temperature and voltage
This means that it is possible to check the gas composition behavior at lower
voltages (30 V in this specific case), with the increase of pressure.
5
10
15
20
25
30
1 2 3 4
I (A
)
P (bar)
I vs P T = 60 ºC; V = 35 V
T = 60 ºC; V = 40 V
T = 60 ºC; V = 45 V
T = 65 ºC; V = 35 V
T = 65 ºC; V = 40 V
T = 70 ºC; V = 35 V
T = 70 ºC; V = 40 V
T = 75 ºC; V = 30 V
T = 75 ºC; V = 35 V
T = 75 ºC; V = 40 V
T = 80 ºC; V = 30 V
T = 80 ºC; V = 35 V
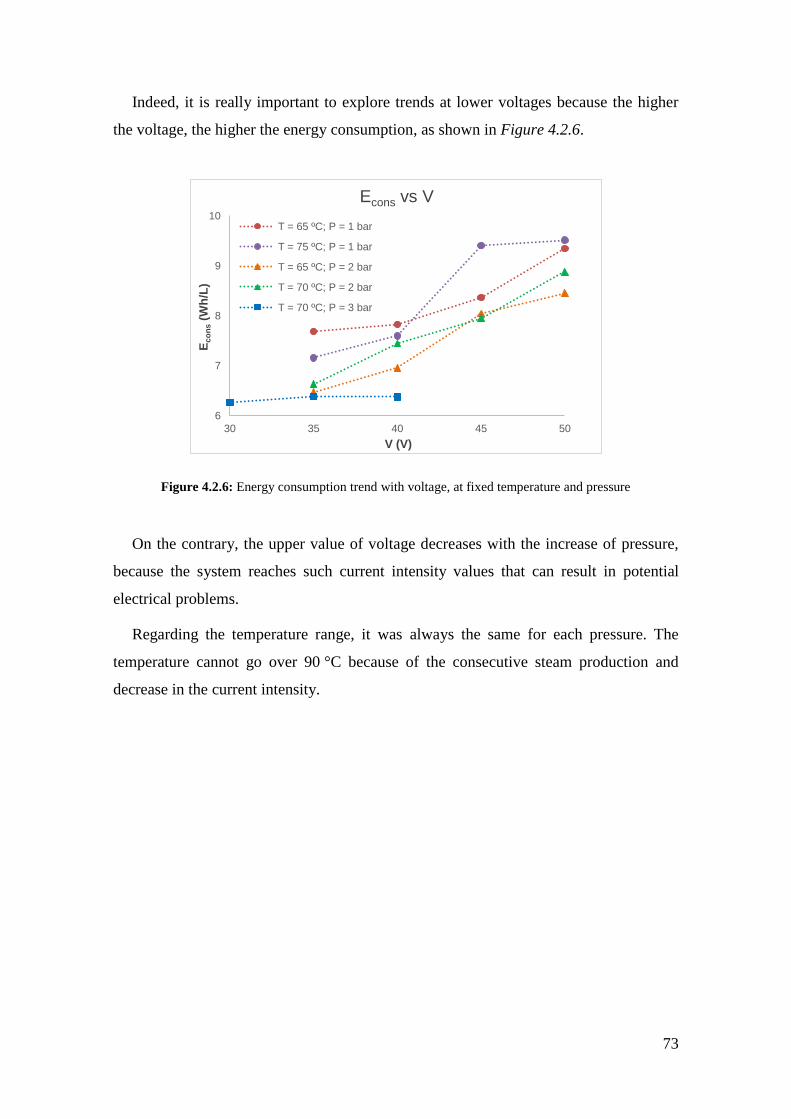
73
Indeed, it is really important to explore trends at lower voltages because the higher
the voltage, the higher the energy consumption, as shown in Figure 4.2.6.
Figure 4.2.6: Energy consumption trend with voltage, at fixed temperature and pressure
On the contrary, the upper value of voltage decreases with the increase of pressure,
because the system reaches such current intensity values that can result in potential
electrical problems.
Regarding the temperature range, it was always the same for each pressure. The
temperature cannot go over 90 °C because of the consecutive steam production and
decrease in the current intensity.
6
7
8
9
10
30 35 40 45 50
Ec
on
s (
Wh
/L)
V (V)
Econs vs V
T = 65 ºC; P = 1 bar
T = 75 ºC; P = 1 bar
T = 65 ºC; P = 2 bar
T = 70 ºC; P = 2 bar
T = 70 ºC; P = 3 bar
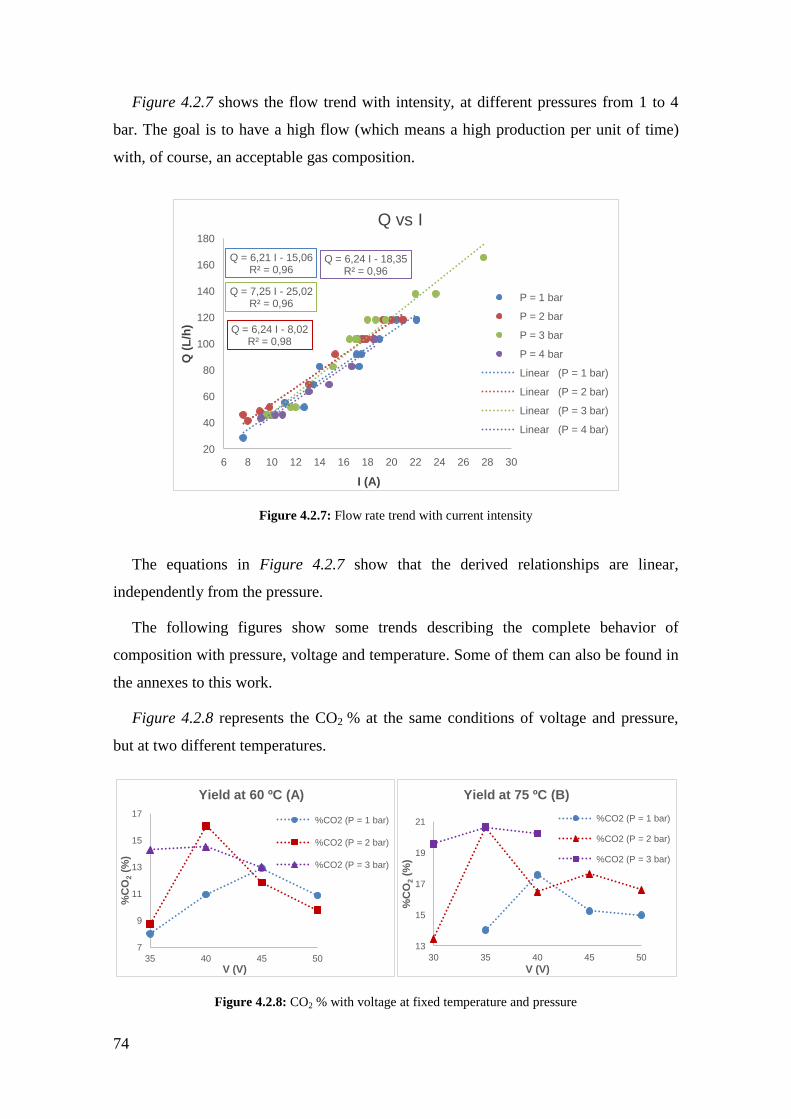
74
Figure 4.2.7 shows the flow trend with intensity, at different pressures from 1 to 4
bar. The goal is to have a high flow (which means a high production per unit of time)
with, of course, an acceptable gas composition.
Figure 4.2.7: Flow rate trend with current intensity
The equations in Figure 4.2.7 show that the derived relationships are linear,
independently from the pressure.
The following figures show some trends describing the complete behavior of
composition with pressure, voltage and temperature. Some of them can also be found in
the annexes to this work.
Figure 4.2.8 represents the CO2 % at the same conditions of voltage and pressure,
but at two different temperatures.
Figure 4.2.8: CO2 % with voltage at fixed temperature and pressure
Q = 6,21 I - 15,06 R² = 0,96
Q = 6,24 I - 8,02 R² = 0,98
Q = 7,25 I - 25,02 R² = 0,96
Q = 6,24 I - 18,35 R² = 0,96
20
40
60
80
100
120
140
160
180
6 8 10 12 14 16 18 20 22 24 26 28 30
Q (
L/h
)
I (A)
Q vs I
P = 1 bar
P = 2 bar
P = 3 bar
P = 4 bar
Lineare (P = 1 bar)
Lineare (P = 2 bar)
Lineare (P = 3 bar)
Lineare (P = 4 bar)
7
9
11
13
15
17
35 40 45 50
%C
O2 (
%)
V (V)
Yield at 60 ºC (A)
%CO2 (P = 1 bar)
%CO2 (P = 2 bar)
%CO2 (P = 3 bar)
13
15
17
19
21
30 35 40 45 50
%C
O2 (
%)
V (V)
Yield at 75 ºC (B)
%CO2 (P = 1 bar)
%CO2 (P = 2 bar)
%CO2 (P = 3 bar)
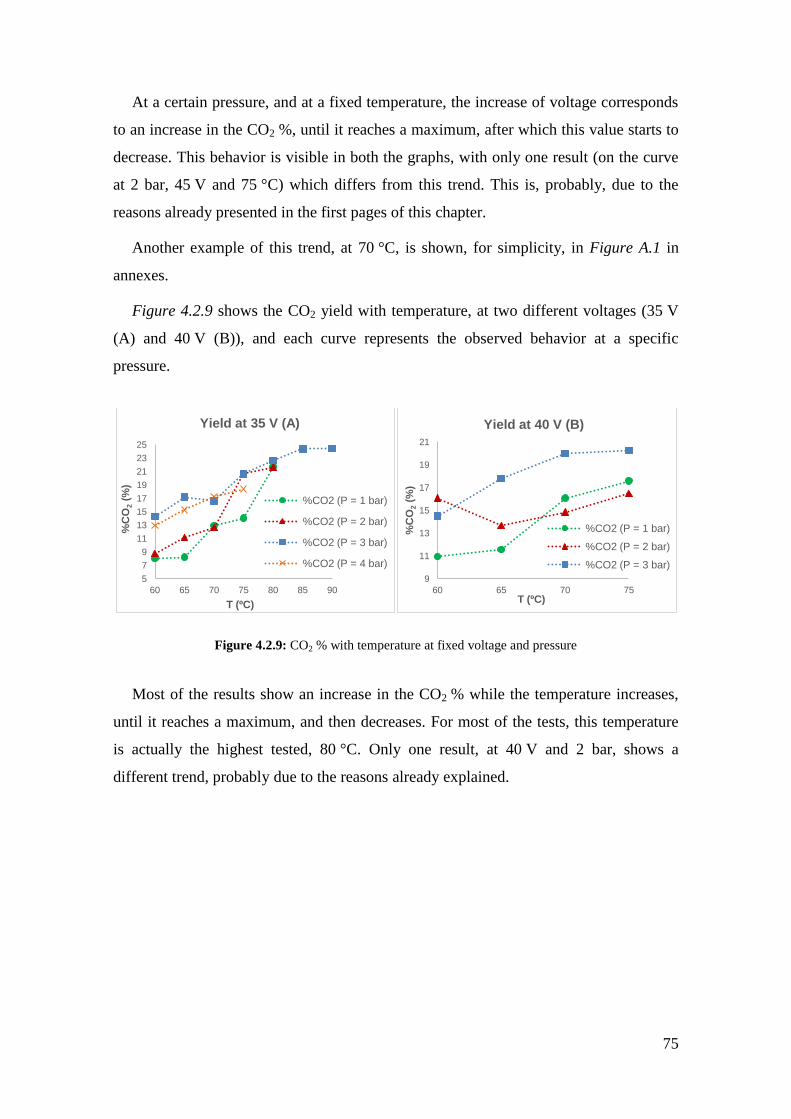
75
At a certain pressure, and at a fixed temperature, the increase of voltage corresponds
to an increase in the CO2 %, until it reaches a maximum, after which this value starts to
decrease. This behavior is visible in both the graphs, with only one result (on the curve
at 2 bar, 45 V and 75 °C) which differs from this trend. This is, probably, due to the
reasons already presented in the first pages of this chapter.
Another example of this trend, at 70 °C, is shown, for simplicity, in Figure A.1 in
annexes.
Figure 4.2.9 shows the CO2 yield with temperature, at two different voltages (35 V
(A) and 40 V (B)), and each curve represents the observed behavior at a specific
pressure.
Figure 4.2.9: CO2 % with temperature at fixed voltage and pressure
Most of the results show an increase in the CO2 % while the temperature increases,
until it reaches a maximum, and then decreases. For most of the tests, this temperature
is actually the highest tested, 80 °C. Only one result, at 40 V and 2 bar, shows a
different trend, probably due to the reasons already explained.
5
7
9
11
13
15
17
19
21
23
25
60 65 70 75 80 85 90
%C
O2 (
%)
T (ºC)
Yield at 35 V (A)
%CO2 (P = 1 bar)
%CO2 (P = 2 bar)
%CO2 (P = 3 bar)
%CO2 (P = 4 bar)
9
11
13
15
17
19
21
60 65 70 75
%C
O2 (
%)
T (ºC)
Yield at 40 V (B)
%CO2 (P = 1 bar)
%CO2 (P = 2 bar)
%CO2 (P = 3 bar)
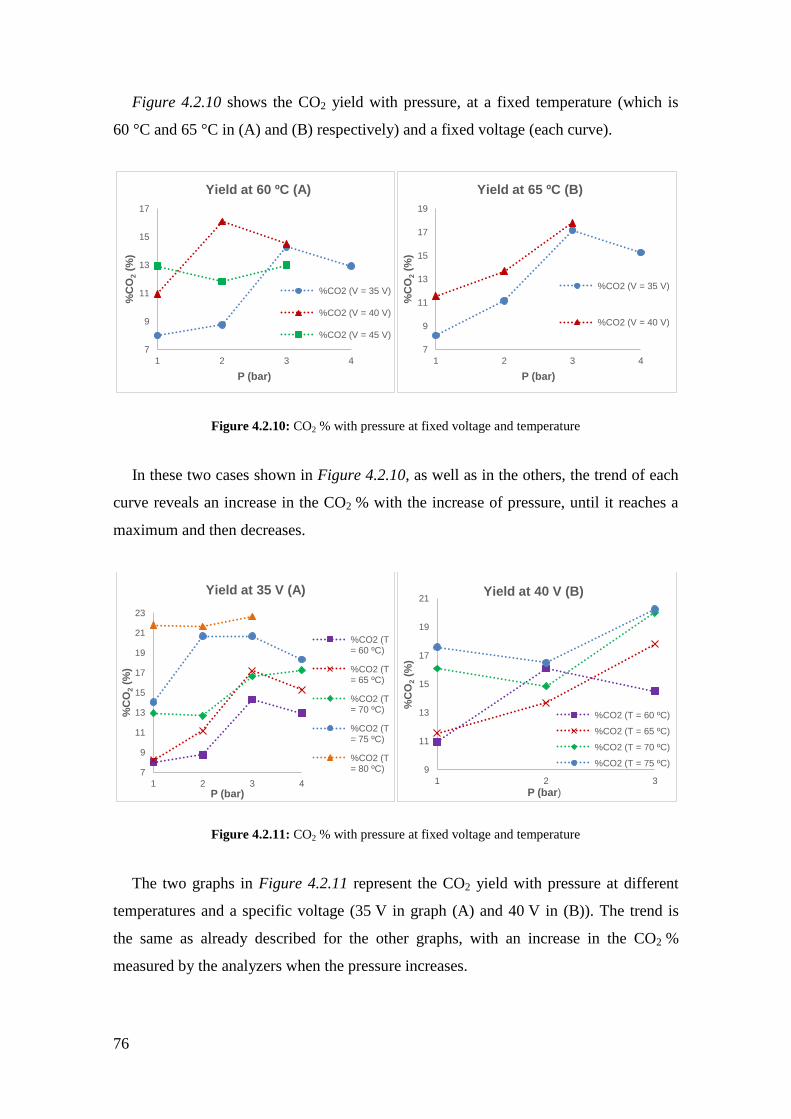
76
Figure 4.2.10 shows the CO2 yield with pressure, at a fixed temperature (which is
60 °C and 65 °C in (A) and (B) respectively) and a fixed voltage (each curve).
Figure 4.2.10: CO2 % with pressure at fixed voltage and temperature
In these two cases shown in Figure 4.2.10, as well as in the others, the trend of each
curve reveals an increase in the CO2 % with the increase of pressure, until it reaches a
maximum and then decreases.
Figure 4.2.11: CO2 % with pressure at fixed voltage and temperature
The two graphs in Figure 4.2.11 represent the CO2 yield with pressure at different
temperatures and a specific voltage (35 V in graph (A) and 40 V in (B)). The trend is
the same as already described for the other graphs, with an increase in the CO2 %
measured by the analyzers when the pressure increases.
7
9
11
13
15
17
1 2 3 4
%C
O2 (
%)
P (bar)
Yield at 60 ºC (A)
%CO2 (V = 35 V)
%CO2 (V = 40 V)
%CO2 (V = 45 V)
7
9
11
13
15
17
19
1 2 3 4
%C
O2 (
%)
P (bar)
Yield at 65 ºC (B)
%CO2 (V = 35 V)
%CO2 (V = 40 V)
7
9
11
13
15
17
19
21
23
1 2 3 4
%C
O2 (
%)
P (bar)
Yield at 35 V (A)
%CO2 (T = 60 ºC)
%CO2 (T = 65 ºC)
%CO2 (T = 70 ºC)
%CO2 (T = 75 ºC)
%CO2 (T = 80 ºC) 9
11
13
15
17
19
21
1 2 3
%C
O2 (
%)
P (bar)
Yield at 40 V (B)
%CO2 (T = 60 ºC)
%CO2 (T = 65 ºC)
%CO2 (T = 70 ºC)
%CO2 (T = 75 ºC)
77
This increase reaches a maximum and then a decrease is visible in some cases, while
in others the highest point corresponds to 4 bar. The exceptions, visible in the graph at
40 V and at 70 °C and 75 °C, are related to tests already described and to the same
problems mentioned before.
Another graph, similar to these shown here, is presented in Figure A.2 in annexes,
since they exhibit the same behavior and there are only little variations from the
observed standard behavior.
All the results listed above, and related to stack 1, led to some conclusions about the
selection of optimal conditions.
The ideal production should satisfy the following characteristics:
- A good CO2 yield;
- The lowest O2 percentage possible;
- The lowest voltage possible, in order to achieve the lowest energy consumption
possible;
- A high flow rate, in order to achieve high production.
The first two characteristics listed above are particularly important at this point of the
work, as a way to totally remove the oxygen before feeding the gas to the catalytic
reactor (to produce methane) has not been found yet, and oxygen, as already mentioned,
deactivates the catalyst and makes the gas mixture potentially dangerous. Fortunately,
these two characteristics are correlated, and this means that a test with a good CO2 yield
is, at the same time, a test with a low O2 concentration (considering the same CO
behavior in both tests). Then, to achieve this goal, the resulting H2:CO2 ratio is not the
best for the next methanation step (the best ratio is around 4 (considering the
stoichiometric reaction (2.33)), but a higher CO2 production, in order to reduce the O2
concentration, leads to ratios around 2). This concept will be better explained in the
following part related to the catalytic reactor. At this point, it is just important to point
out that the characteristics considered previously as the best could not be the best in an
absolute way, but in relation to the state-of-the-art achieved with this particular work.
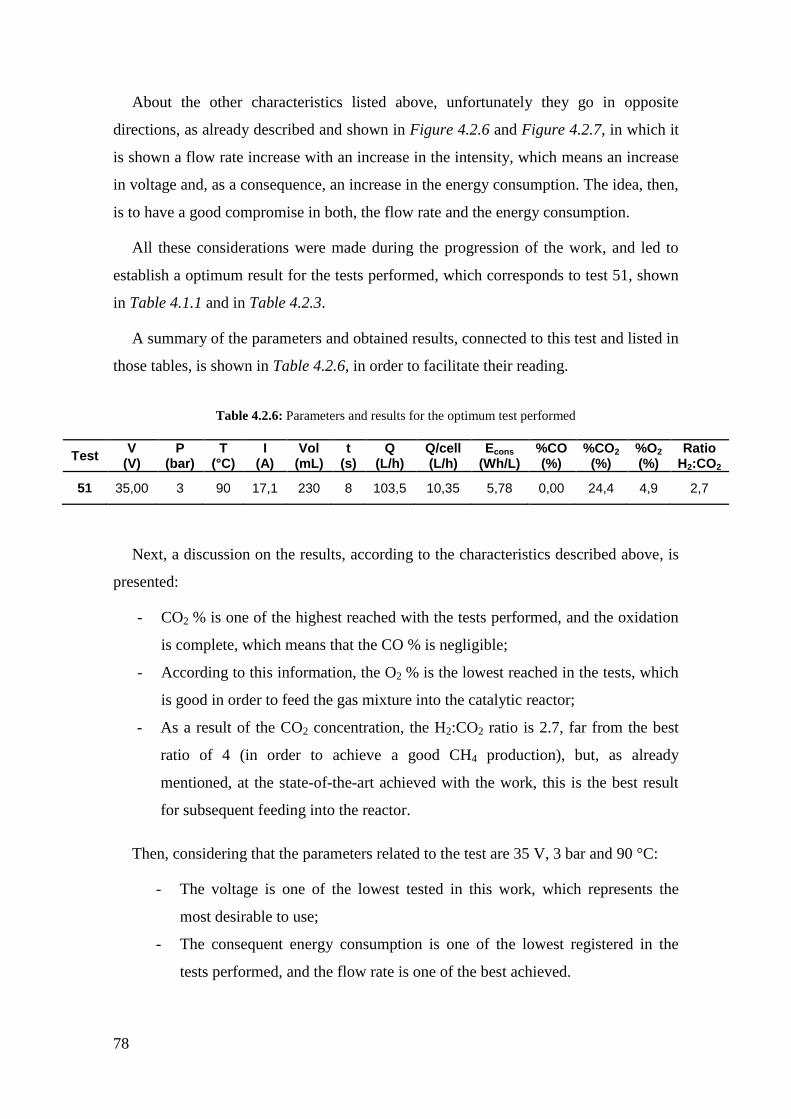
78
About the other characteristics listed above, unfortunately they go in opposite
directions, as already described and shown in Figure 4.2.6 and Figure 4.2.7, in which it
is shown a flow rate increase with an increase in the intensity, which means an increase
in voltage and, as a consequence, an increase in the energy consumption. The idea, then,
is to have a good compromise in both, the flow rate and the energy consumption.
All these considerations were made during the progression of the work, and led to
establish a optimum result for the tests performed, which corresponds to test 51, shown
in Table 4.1.1 and in Table 4.2.3.
A summary of the parameters and obtained results, connected to this test and listed in
those tables, is shown in Table 4.2.6, in order to facilitate their reading.
Table 4.2.6: Parameters and results for the optimum test performed
Test V
(V) P
(bar) T
(°C) I
(A) Vol
(mL) t
(s) Q
(L/h) Q/cell (L/h)
Econs (Wh/L)
%CO (%)
%CO2 (%)
%O2 (%)
Ratio H2:CO2
51 35,00 3 90 17,1 230 8 103,5 10,35 5,78 0,00 24,4 4,9 2,7
Next, a discussion on the results, according to the characteristics described above, is
presented:
- CO2 % is one of the highest reached with the tests performed, and the oxidation
is complete, which means that the CO % is negligible;
- According to this information, the O2 % is the lowest reached in the tests, which
is good in order to feed the gas mixture into the catalytic reactor;
- As a result of the CO2 concentration, the H2:CO2 ratio is 2.7, far from the best
ratio of 4 (in order to achieve a good CH4 production), but, as already
mentioned, at the state-of-the-art achieved with the work, this is the best result
for subsequent feeding into the reactor.
Then, considering that the parameters related to the test are 35 V, 3 bar and 90 °C:
- The voltage is one of the lowest tested in this work, which represents the
most desirable to use;
- The consequent energy consumption is one of the lowest registered in the
tests performed, and the flow rate is one of the best achieved.
79
The temperature is the highest tested, but this is not a problem since the reaction is
exothermic and the system could reach it without any problems. It was considered
useless to increase it even more, because of the steam production.
This result was chosen to be tested in the catalytic reactor to produce methane.
4.2.2 Oxygen removal
In a second step, the catalytic reactor has been filled with graphite nanoparticles. As
shown in Table 4.1.1, none of the tests performed leads to the total removal of oxygen
by reacting with the graphite electrodes to produce more CO and CO2. The complete
removal of oxygen is needed for two reasons:
- the catalyst deactivates with oxygen;
- hydrogen is an extremely explosive compound in oxygen atmosphere.
The objective was to remove oxygen before feeding the gas mixture into the catalytic
reactor for the methanation process, by making it react with the graphite nanoparticles.
The tests were realized considering, as a sample, the potentially most reactive gas
mixture, the one with the highest percentage of oxygen.
Firstly, the reactor has been filled completely with graphite nanoparticles and then
tested at 50 °C and 100 °C. In both cases, a sharp reduction in the exiting gas flow rate
has been observed, and, at the same time, the pressure in the electrolyzer, shown on the
control panel, increased. Moreover, the graphite nanoparticles seemed not to affect the
amount of oxygen in the gas mixture. The reason attributed to the increase of pressure
and the consequent decrease in the flow rate, is the amount of graphite nanoparticles in
the reactor, which did not allow the gas to easily flow in it.
It was, then, decided to fill only half the reactor with graphite nanoparticles, to check
the flow rate and pressure behavior. The tests were performed at different temperatures,
starting from room temperature (23 °C in the testing day), and increasing slowly to
50 °C, 100 °C and 200 °C. In this case, the gas flow rate measured outside the reactor
was the same as in its entrance, and no pressure increase was detected. About the gas
concentration, the graphite nanoparticles seemed to be active only at 200 °C, registering
a small decrease in the CO2 concentration. This result can be explained supposing that
the graphite nanoparticles adsorb CO2.
80
Regarding the O2 concentration, this did not change significantly during tests.
These details show not only that the graphite nanoparticles at those temperature, and
in a reactor with that residence time, does not react with oxygen, but also that they
decrease the CO2 concentration, which is not adequate since this compound is needed in
order to produce synthetic fuels (such as methane and methanol).
Graphite is a stable allotrope of carbon, and this explains why it did not react with
oxygen to produce more CO and CO2.
Considering all the arguments above, this solution to remove oxygen was put aside,
and different ways to achieve this goal were started to be searched.
4.2.3 Methane production
The methanation process did occur in the catalytic reactor. The following tables,
graphs and subsequent discussion require some explanation about the calculations used.
Since the Sabatier process involves two principal reactions ((2.33) and (2.34)
described in Table 2.4.5) and basically one side reaction (2.25), it is important to study
the process conversion and selectivity.
In particular, the CO2 conversion is defined as the ratio between the number of moles
of CO2 which reacted and the number of moles of CO2 fed to the reactor, and has been
calculated as follows, considering both, the principal reaction and the side reaction that
occur in the Sabatier process:
(4.6)
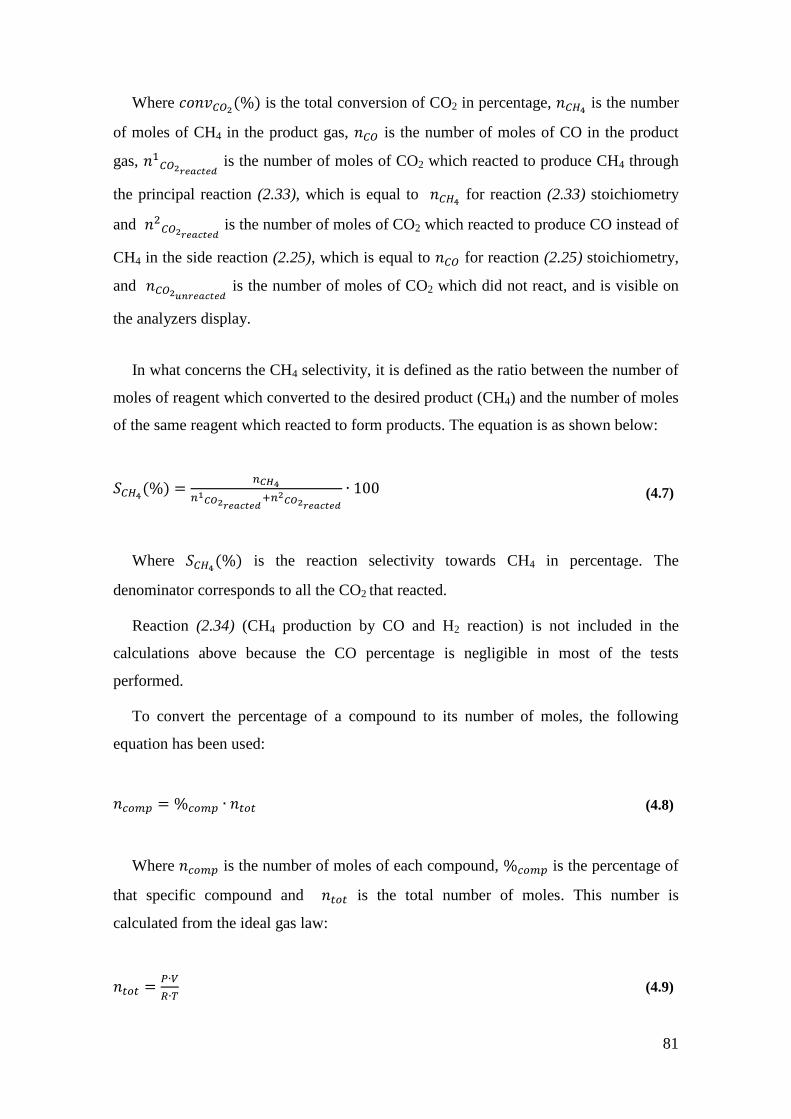
81
Where is the total conversion of CO2 in percentage,
is the number
of moles of CH4 in the product gas, is the number of moles of CO in the product
gas,
is the number of moles of CO2 which reacted to produce CH4 through
the principal reaction (2.33), which is equal to for reaction (2.33) stoichiometry
and
is the number of moles of CO2 which reacted to produce CO instead of
CH4 in the side reaction (2.25), which is equal to for reaction (2.25) stoichiometry,
and is the number of moles of CO2 which did not react, and is visible on
the analyzers display.
In what concerns the CH4 selectivity, it is defined as the ratio between the number of
moles of reagent which converted to the desired product (CH4) and the number of moles
of the same reagent which reacted to form products. The equation is as shown below:
(4.7)
Where is the reaction selectivity towards CH4 in percentage. The
denominator corresponds to all the CO2 that reacted.
Reaction (2.34) (CH4 production by CO and H2 reaction) is not included in the
calculations above because the CO percentage is negligible in most of the tests
performed.
To convert the percentage of a compound to its number of moles, the following
equation has been used:
(4.8)
Where is the number of moles of each compound, is the percentage of
that specific compound and is the total number of moles. This number is
calculated from the ideal gas law:
(4.9)
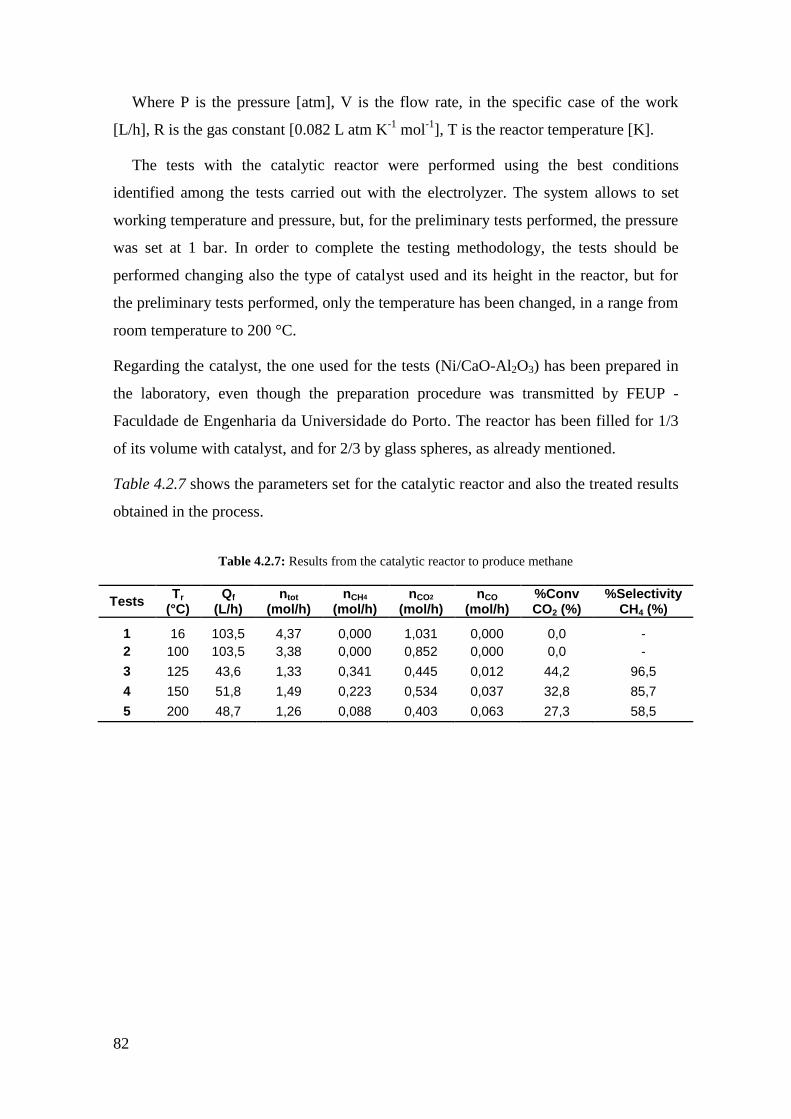
82
Where P is the pressure [atm], V is the flow rate, in the specific case of the work
[L/h], R is the gas constant [0.082 L atm K-1
mol-1
], T is the reactor temperature [K].
The tests with the catalytic reactor were performed using the best conditions
identified among the tests carried out with the electrolyzer. The system allows to set
working temperature and pressure, but, for the preliminary tests performed, the pressure
was set at 1 bar. In order to complete the testing methodology, the tests should be
performed changing also the type of catalyst used and its height in the reactor, but for
the preliminary tests performed, only the temperature has been changed, in a range from
room temperature to 200 °C.
Regarding the catalyst, the one used for the tests (Ni/CaO-Al2O3) has been prepared in
the laboratory, even though the preparation procedure was transmitted by FEUP -
Faculdade de Engenharia da Universidade do Porto. The reactor has been filled for 1/3
of its volume with catalyst, and for 2/3 by glass spheres, as already mentioned.
Table 4.2.7 shows the parameters set for the catalytic reactor and also the treated results
obtained in the process.
Table 4.2.7: Results from the catalytic reactor to produce methane
Tests Tr
(°C) Qf
(L/h) ntot
(mol/h) nCH4
(mol/h) nCO2
(mol/h) nCO
(mol/h) %Conv CO2 (%)
%Selectivity CH4 (%)
1 16 103,5 4,37 0,000 1,031 0,000 0,0 -
2 100 103,5 3,38 0,000 0,852 0,000 0,0 -
3 125 43,6 1,33 0,341 0,445 0,012 44,2 96,5
4 150 51,8 1,49 0,223 0,534 0,037 32,8 85,7
5 200 48,7 1,26 0,088 0,403 0,063 27,3 58,5
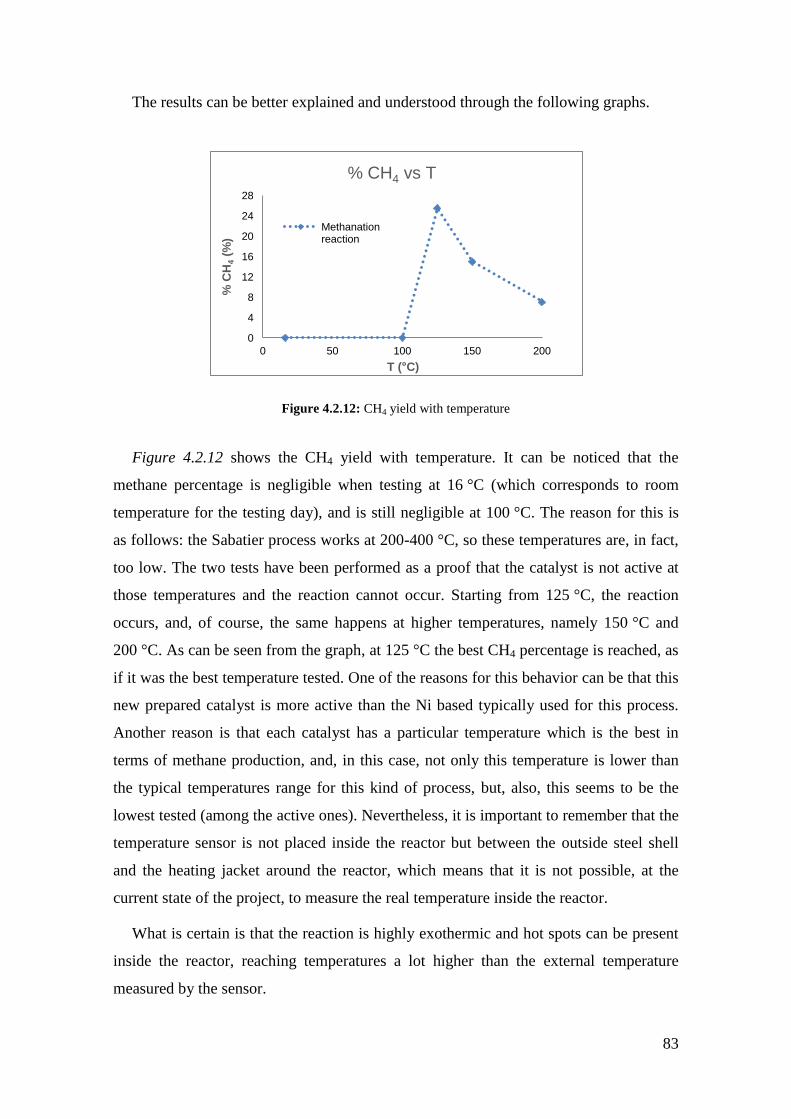
83
The results can be better explained and understood through the following graphs.
Figure 4.2.12: CH4 yield with temperature
Figure 4.2.12 shows the CH4 yield with temperature. It can be noticed that the
methane percentage is negligible when testing at 16 °C (which corresponds to room
temperature for the testing day), and is still negligible at 100 °C. The reason for this is
as follows: the Sabatier process works at 200-400 °C, so these temperatures are, in fact,
too low. The two tests have been performed as a proof that the catalyst is not active at
those temperatures and the reaction cannot occur. Starting from 125 °C, the reaction
occurs, and, of course, the same happens at higher temperatures, namely 150 °C and
200 °C. As can be seen from the graph, at 125 °C the best CH4 percentage is reached, as
if it was the best temperature tested. One of the reasons for this behavior can be that this
new prepared catalyst is more active than the Ni based typically used for this process.
Another reason is that each catalyst has a particular temperature which is the best in
terms of methane production, and, in this case, not only this temperature is lower than
the typical temperatures range for this kind of process, but, also, this seems to be the
lowest tested (among the active ones). Nevertheless, it is important to remember that the
temperature sensor is not placed inside the reactor but between the outside steel shell
and the heating jacket around the reactor, which means that it is not possible, at the
current state of the project, to measure the real temperature inside the reactor.
What is certain is that the reaction is highly exothermic and hot spots can be present
inside the reactor, reaching temperatures a lot higher than the external temperature
measured by the sensor.
0
4
8
12
16
20
24
28
0 50 100 150 200
% C
H4 (
%)
T (°C)
% CH4 vs T
Methanation reaction
84
Since the Sabatier process includes a principal reaction and a side reaction, it is
interesting to see the trend of the limiting reagent conversion and the selectivity towards
methane. The results obtained from the calculations are shown in Figure 4.2.13.
Figure 4.2.13: Selectivity and conversion yield with temperature for the catalytic reactor
Regarding the CO2 conversion, it is obviously equal to zero when the reaction does
not occur (and the same can be noticed about the CH4 selectivity), then it reaches a
maximum at 125 °C, and, then, it decreases with the increase of temperature.
Regarding the selectivity for the methane production, it reaches a maximum at
125 °C and then decreases with the increase of temperature.
Both the trends are in accordance with the CO2 conversion and with the CH4
production in Figure 4.2.12.
0
10
20
30
40
50
60
70
80
90
100
0
10
20
30
40
50
60
70
80
90
100
0 50 100 150 200
% C
on
ve
srio
n C
O2 (%
) % S
ele
cti
vit
y C
H4 (
%)
T (°C)
Yields vs T
Selectivity CH4
Conversion CO2
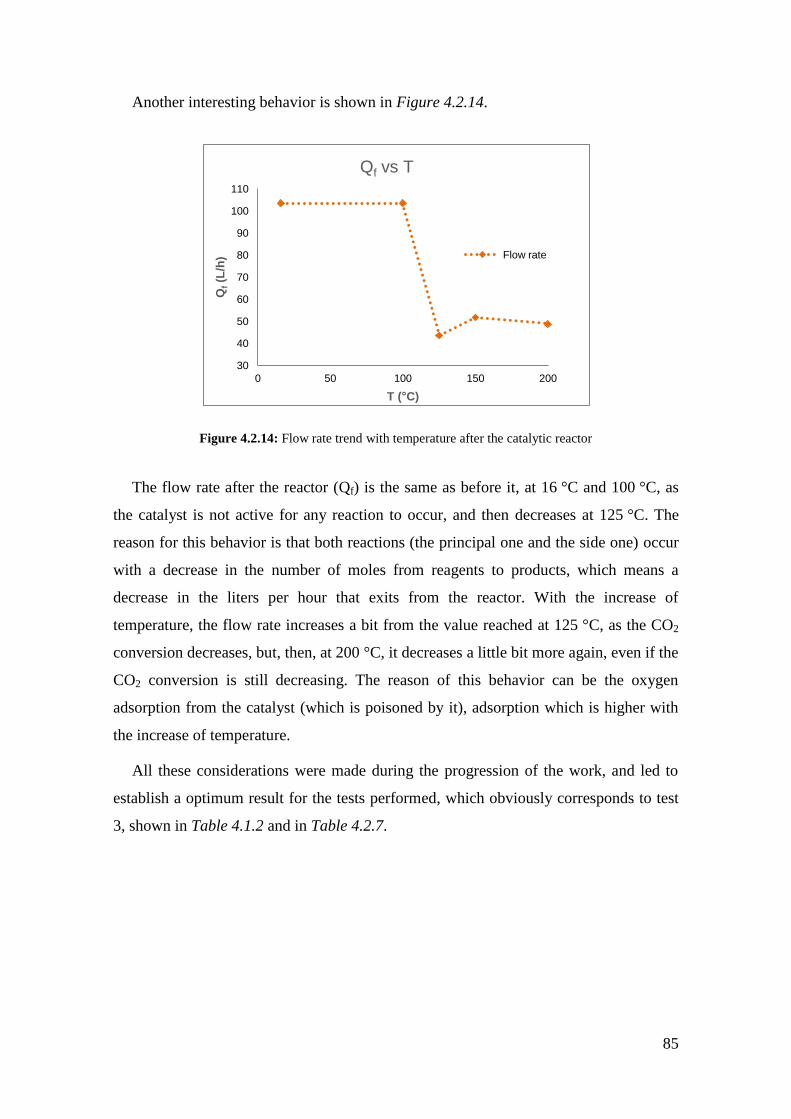
85
Another interesting behavior is shown in Figure 4.2.14.
Figure 4.2.14: Flow rate trend with temperature after the catalytic reactor
The flow rate after the reactor (Qf) is the same as before it, at 16 °C and 100 °C, as
the catalyst is not active for any reaction to occur, and then decreases at 125 °C. The
reason for this behavior is that both reactions (the principal one and the side one) occur
with a decrease in the number of moles from reagents to products, which means a
decrease in the liters per hour that exits from the reactor. With the increase of
temperature, the flow rate increases a bit from the value reached at 125 °C, as the CO2
conversion decreases, but, then, at 200 °C, it decreases a little bit more again, even if the
CO2 conversion is still decreasing. The reason of this behavior can be the oxygen
adsorption from the catalyst (which is poisoned by it), adsorption which is higher with
the increase of temperature.
All these considerations were made during the progression of the work, and led to
establish a optimum result for the tests performed, which obviously corresponds to test
3, shown in Table 4.1.2 and in Table 4.2.7.
30
40
50
60
70
80
90
100
110
0 50 100 150 200
Qf (L
/h)
T (°C)
Qf vs T
Flow rate
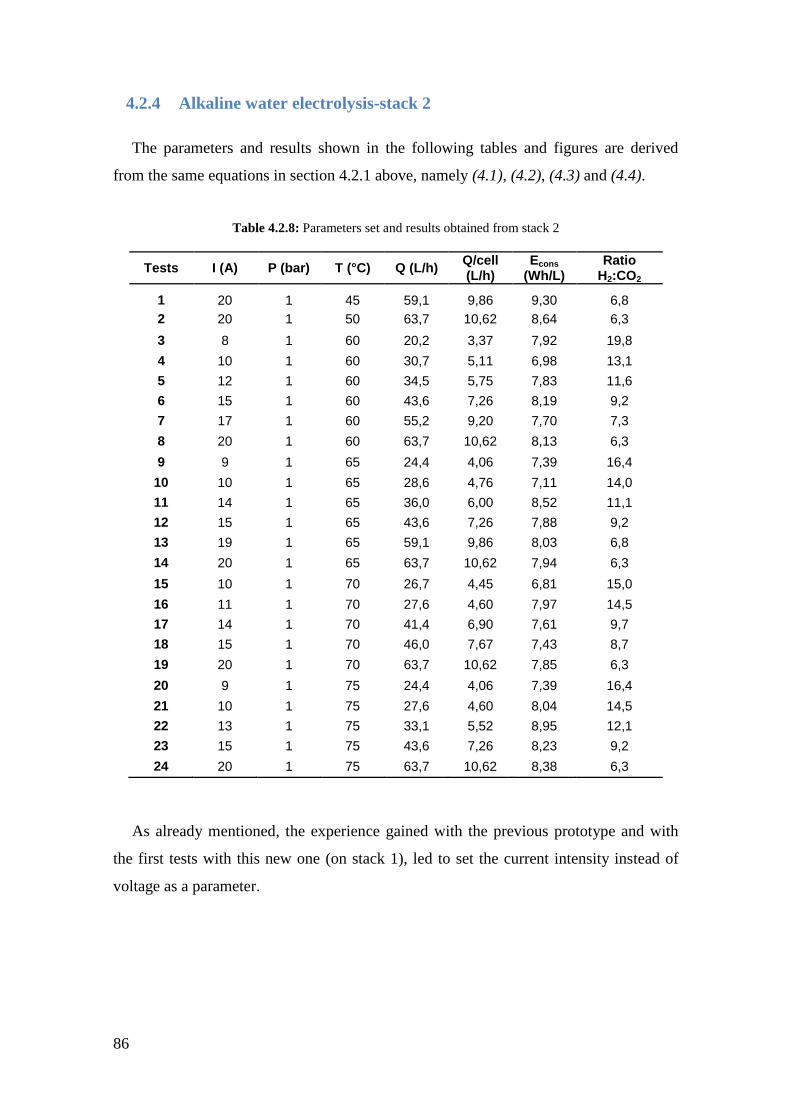
86
4.2.4 Alkaline water electrolysis-stack 2
The parameters and results shown in the following tables and figures are derived
from the same equations in section 4.2.1 above, namely (4.1), (4.2), (4.3) and (4.4).
Table 4.2.8: Parameters set and results obtained from stack 2
Tests I (A) P (bar) T (°C) Q (L/h) Q/cell (L/h)
Econs (Wh/L)
Ratio H2:CO2
1 20 1 45 59,1 9,86 9,30 6,8
2 20 1 50 63,7 10,62 8,64 6,3
3 8 1 60 20,2 3,37 7,92 19,8
4 10 1 60 30,7 5,11 6,98 13,1
5 12 1 60 34,5 5,75 7,83 11,6
6 15 1 60 43,6 7,26 8,19 9,2
7 17 1 60 55,2 9,20 7,70 7,3
8 20 1 60 63,7 10,62 8,13 6,3
9 9 1 65 24,4 4,06 7,39 16,4
10 10 1 65 28,6 4,76 7,11 14,0
11 14 1 65 36,0 6,00 8,52 11,1
12 15 1 65 43,6 7,26 7,88 9,2
13 19 1 65 59,1 9,86 8,03 6,8
14 20 1 65 63,7 10,62 7,94 6,3
15 10 1 70 26,7 4,45 6,81 15,0
16 11 1 70 27,6 4,60 7,97 14,5
17 14 1 70 41,4 6,90 7,61 9,7
18 15 1 70 46,0 7,67 7,43 8,7
19 20 1 70 63,7 10,62 7,85 6,3
20 9 1 75 24,4 4,06 7,39 16,4
21 10 1 75 27,6 4,60 8,04 14,5
22 13 1 75 33,1 5,52 8,95 12,1
23 15 1 75 43,6 7,26 8,23 9,2
24 20 1 75 63,7 10,62 8,38 6,3
As already mentioned, the experience gained with the previous prototype and with
the first tests with this new one (on stack 1), led to set the current intensity instead of
voltage as a parameter.
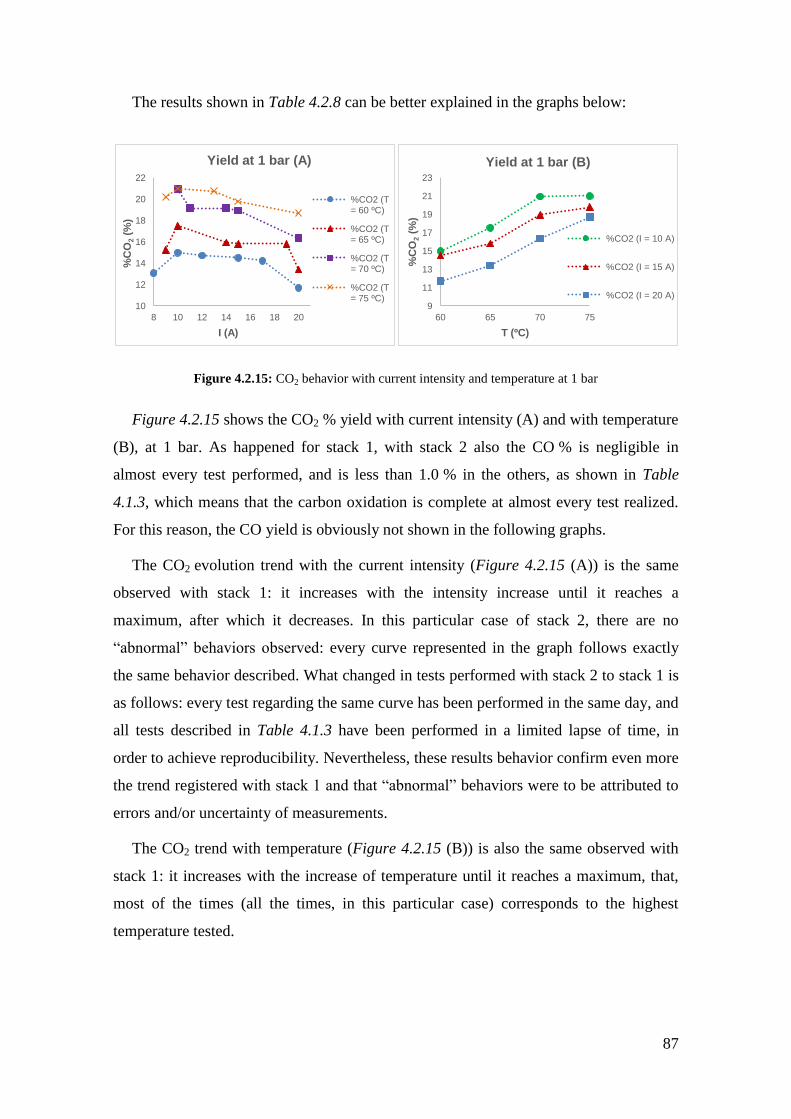
87
The results shown in Table 4.2.8 can be better explained in the graphs below:
Figure 4.2.15: CO2 behavior with current intensity and temperature at 1 bar
Figure 4.2.15 shows the CO2 % yield with current intensity (A) and with temperature
(B), at 1 bar. As happened for stack 1, with stack 2 also the CO % is negligible in
almost every test performed, and is less than 1.0 % in the others, as shown in Table
4.1.3, which means that the carbon oxidation is complete at almost every test realized.
For this reason, the CO yield is obviously not shown in the following graphs.
The CO2 evolution trend with the current intensity (Figure 4.2.15 (A)) is the same
observed with stack 1: it increases with the intensity increase until it reaches a
maximum, after which it decreases. In this particular case of stack 2, there are no
“abnormal” behaviors observed: every curve represented in the graph follows exactly
the same behavior described. What changed in tests performed with stack 2 to stack 1 is
as follows: every test regarding the same curve has been performed in the same day, and
all tests described in Table 4.1.3 have been performed in a limited lapse of time, in
order to achieve reproducibility. Nevertheless, these results behavior confirm even more
the trend registered with stack 1 and that “abnormal” behaviors were to be attributed to
errors and/or uncertainty of measurements.
The CO2 trend with temperature (Figure 4.2.15 (B)) is also the same observed with
stack 1: it increases with the increase of temperature until it reaches a maximum, that,
most of the times (all the times, in this particular case) corresponds to the highest
temperature tested.
10
12
14
16
18
20
22
8 10 12 14 16 18 20
%C
O2 (
%)
I (A)
Yield at 1 bar (A)
%CO2 (T = 60 ºC)
%CO2 (T = 65 ºC)
%CO2 (T = 70 ºC)
%CO2 (T = 75 ºC)
9
11
13
15
17
19
21
23
60 65 70 75
%C
O2 (
%)
T (ºC)
Yield at 1 bar (B)
%CO2 (I = 10 A)
%CO2 (I = 15 A)
%CO2 (I = 20 A)
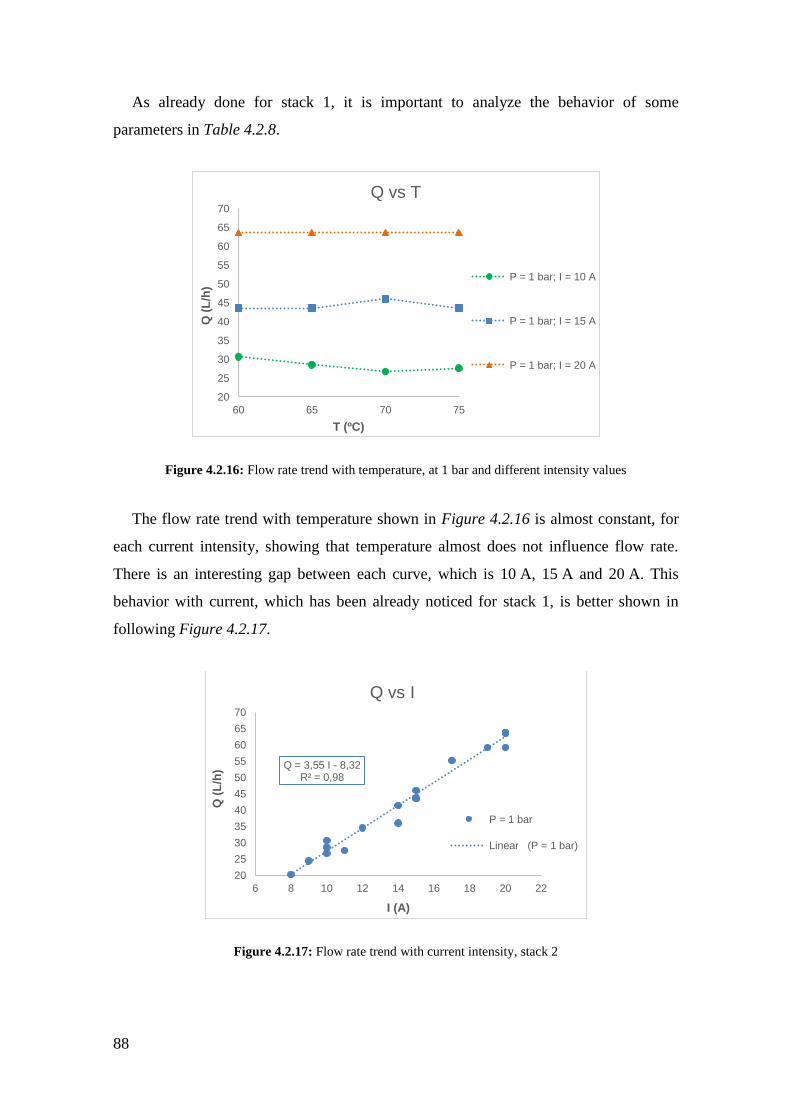
88
As already done for stack 1, it is important to analyze the behavior of some
parameters in Table 4.2.8.
Figure 4.2.16: Flow rate trend with temperature, at 1 bar and different intensity values
The flow rate trend with temperature shown in Figure 4.2.16 is almost constant, for
each current intensity, showing that temperature almost does not influence flow rate.
There is an interesting gap between each curve, which is 10 A, 15 A and 20 A. This
behavior with current, which has been already noticed for stack 1, is better shown in
following Figure 4.2.17.
Figure 4.2.17: Flow rate trend with current intensity, stack 2
20
25
30
35
40
45
50
55
60
65
70
60 65 70 75
Q (
L/h
)
T (ºC)
Q vs T
P = 1 bar; I = 10 A
P = 1 bar; I = 15 A
P = 1 bar; I = 20 A
Q = 3,55 I - 8,32 R² = 0,98
20
25
30
35
40
45
50
55
60
65
70
6 8 10 12 14 16 18 20 22
Q (
L/h
)
I (A)
Q vs I
P = 1 bar
Lineare (P = 1 bar)
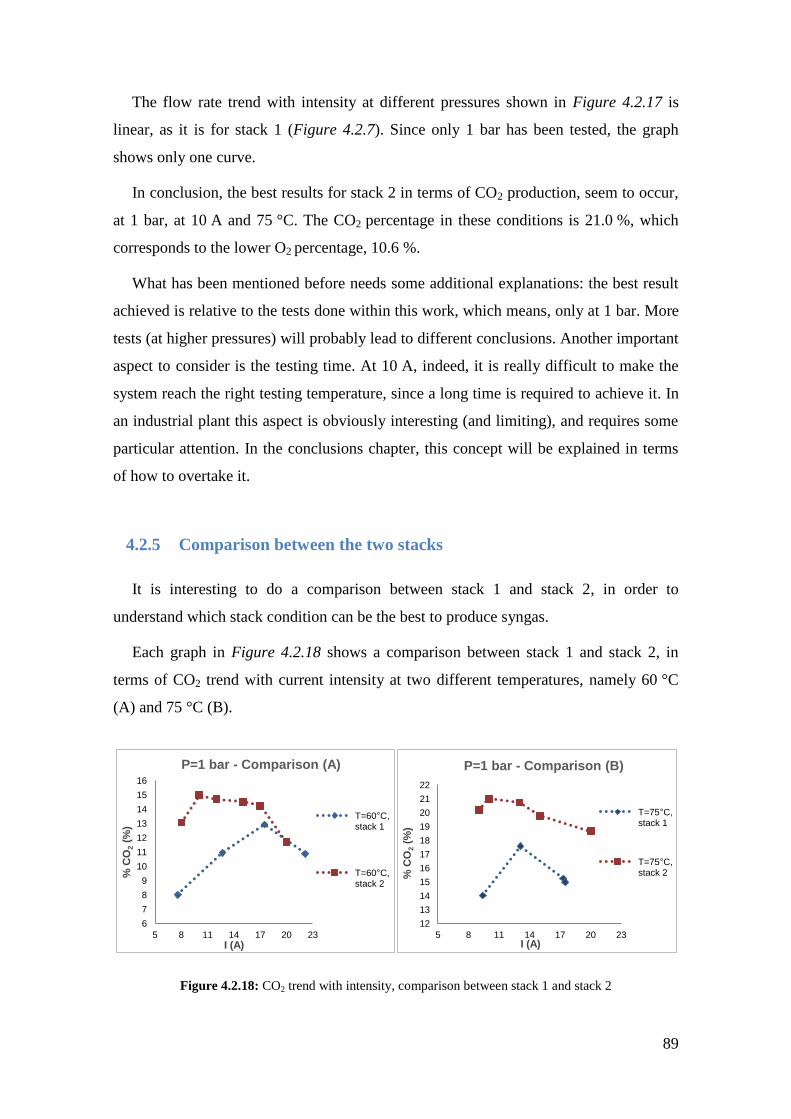
89
The flow rate trend with intensity at different pressures shown in Figure 4.2.17 is
linear, as it is for stack 1 (Figure 4.2.7). Since only 1 bar has been tested, the graph
shows only one curve.
In conclusion, the best results for stack 2 in terms of CO2 production, seem to occur,
at 1 bar, at 10 A and 75 °C. The CO2 percentage in these conditions is 21.0 %, which
corresponds to the lower O2 percentage, 10.6 %.
What has been mentioned before needs some additional explanations: the best result
achieved is relative to the tests done within this work, which means, only at 1 bar. More
tests (at higher pressures) will probably lead to different conclusions. Another important
aspect to consider is the testing time. At 10 A, indeed, it is really difficult to make the
system reach the right testing temperature, since a long time is required to achieve it. In
an industrial plant this aspect is obviously interesting (and limiting), and requires some
particular attention. In the conclusions chapter, this concept will be explained in terms
of how to overtake it.
4.2.5 Comparison between the two stacks
It is interesting to do a comparison between stack 1 and stack 2, in order to
understand which stack condition can be the best to produce syngas.
Each graph in Figure 4.2.18 shows a comparison between stack 1 and stack 2, in
terms of CO2 trend with current intensity at two different temperatures, namely 60 °C
(A) and 75 °C (B).
Figure 4.2.18: CO2 trend with intensity, comparison between stack 1 and stack 2
6
7
8
9
10
11
12
13
14
15
16
5 8 11 14 17 20 23
% C
O2 (
%)
I (A)
P=1 bar - Comparison (A)
T=60°C, stack 1
T=60°C, stack 2
12
13
14
15
16
17
18
19
20
21
22
5 8 11 14 17 20 23
% C
O2 (
%)
I (A)
P=1 bar - Comparison (B)
T=75°C, stack 1
T=75°C, stack 2
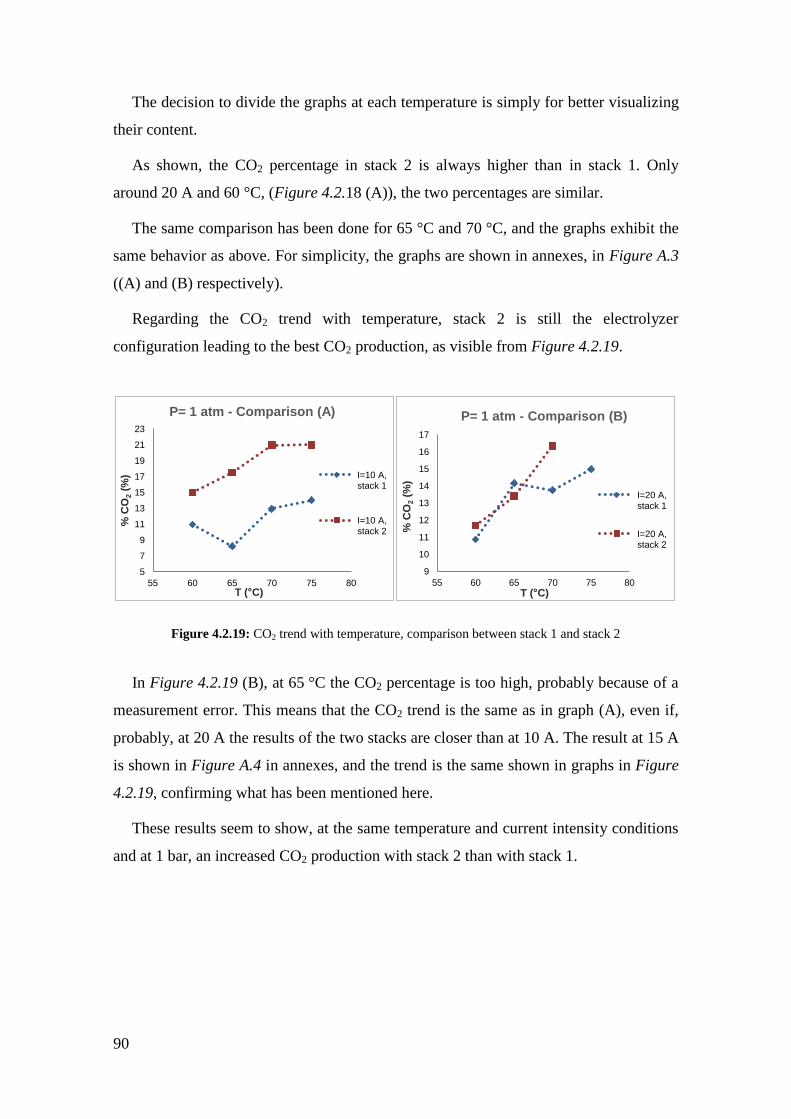
90
The decision to divide the graphs at each temperature is simply for better visualizing
their content.
As shown, the CO2 percentage in stack 2 is always higher than in stack 1. Only
around 20 A and 60 °C, (Figure 4.2.18 (A)), the two percentages are similar.
The same comparison has been done for 65 °C and 70 °C, and the graphs exhibit the
same behavior as above. For simplicity, the graphs are shown in annexes, in Figure A.3
((A) and (B) respectively).
Regarding the CO2 trend with temperature, stack 2 is still the electrolyzer
configuration leading to the best CO2 production, as visible from Figure 4.2.19.
Figure 4.2.19: CO2 trend with temperature, comparison between stack 1 and stack 2
In Figure 4.2.19 (B), at 65 °C the CO2 percentage is too high, probably because of a
measurement error. This means that the CO2 trend is the same as in graph (A), even if,
probably, at 20 A the results of the two stacks are closer than at 10 A. The result at 15 A
is shown in Figure A.4 in annexes, and the trend is the same shown in graphs in Figure
4.2.19, confirming what has been mentioned here.
These results seem to show, at the same temperature and current intensity conditions
and at 1 bar, an increased CO2 production with stack 2 than with stack 1.
5
7
9
11
13
15
17
19
21
23
55 60 65 70 75 80
% C
O2 (
%)
T (°C)
P= 1 atm - Comparison (A)
I=10 A, stack 1
I=10 A, stack 2
9
10
11
12
13
14
15
16
17
55 60 65 70 75 80
% C
O2 (
%)
T (°C)
P= 1 atm - Comparison (B)
I=20 A, stack 1
I=20 A, stack 2
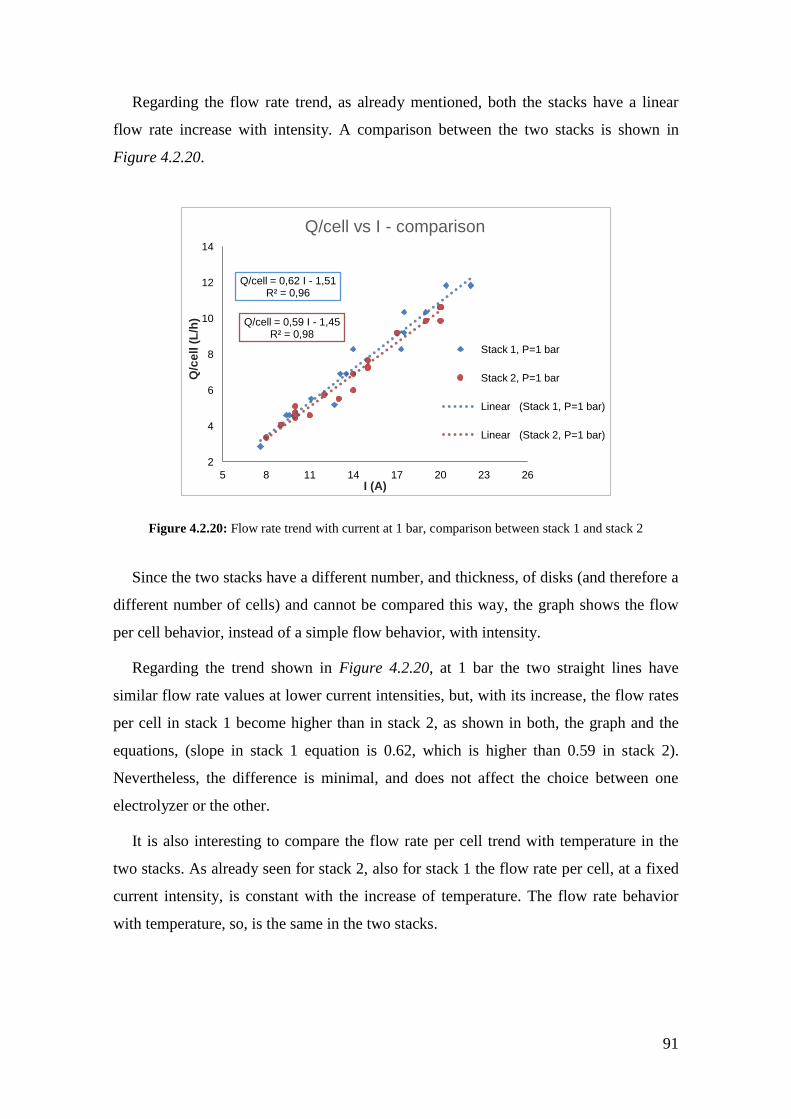
91
Regarding the flow rate trend, as already mentioned, both the stacks have a linear
flow rate increase with intensity. A comparison between the two stacks is shown in
Figure 4.2.20.
Figure 4.2.20: Flow rate trend with current at 1 bar, comparison between stack 1 and stack 2
Since the two stacks have a different number, and thickness, of disks (and therefore a
different number of cells) and cannot be compared this way, the graph shows the flow
per cell behavior, instead of a simple flow behavior, with intensity.
Regarding the trend shown in Figure 4.2.20, at 1 bar the two straight lines have
similar flow rate values at lower current intensities, but, with its increase, the flow rates
per cell in stack 1 become higher than in stack 2, as shown in both, the graph and the
equations, (slope in stack 1 equation is 0.62, which is higher than 0.59 in stack 2).
Nevertheless, the difference is minimal, and does not affect the choice between one
electrolyzer or the other.
It is also interesting to compare the flow rate per cell trend with temperature in the
two stacks. As already seen for stack 2, also for stack 1 the flow rate per cell, at a fixed
current intensity, is constant with the increase of temperature. The flow rate behavior
with temperature, so, is the same in the two stacks.
Q/cell = 0,62 I - 1,51 R² = 0,96
Q/cell = 0,59 I - 1,45 R² = 0,98
2
4
6
8
10
12
14
5 8 11 14 17 20 23 26
Q/c
ell
(L
/h)
I (A)
Q/cell vs I - comparison
Stack 1, P=1 bar
Stack 2, P=1 bar
Lineare (Stack 1, P=1 bar)
Lineare (Stack 2, P=1 bar)
92
As visible in comparing tests from 1 to 17 in Table 4.2.1 (stack 1) with tests from 1
to 24 in Table 4.2.8 (stack 2), the curves at 10 A (for stack 1 and stack 2) exhibit a
lower flow rate per cell than the curves at 15 A and at 20 A, as the flow rate per cell
increases with the increase of current intensity. There is one difference with the two
electrolyzers: for stack 1 the curves at each current intensity exhibit a higher flow rate
than the curves for stack 2, following the trend shown in Figure 4.2.20. Nevertheless,
the ΔQ/cell between stack 1 and stack 2 is almost constant with the increase of
temperature. These facts simply confirm what has already been mentioned:
- Flow rate values do not change significantly with temperature;
- The stack 1 curve is always above stack 2 curve, at each current chosen,
which means that the flow rate per cell in stack 1 is almost always higher than
in stack 2, as already seen in Figure 4.2.20.
It is also interesting to compare the energy consumption trend with current intensity at
fixed temperatures for stack 1 and stack 2. Studying the results shown in the same tables
as before (namely Table 4.2.1 and Table 4.2.8), it is visible that the energy consumption
values are pretty much similar, and fall in the same range of 6-10 WhL-1
, with the
difference that, around 20 A, stack 1 seems to have always (for every temperature
tested) a higher energy consumption than stack 2. Anyway, these values do not exhibit a
big gap between the two stacks in terms of energy consumption, so they do not affect
the choice between one electrolyzer or the other.
In conclusion, it seems that results such as the flow rate per cell or the energy
consumption cannot be taken as landmarks to consider one stack better than the other.
The result which marks a difference on the two electrolyzers is the CO2 trend: not only
the best result registered with stack 1 is overtaken by the best result detected with stack
2, but, this second electrolyzer, exhibits, in every condition tested, better results in terms
of CO2 production, when compared to stack 1. Furthermore, as already mentioned, the
stack 2 electrodes come from a different supplier and are cheaper than the electrodes
from stack 1, which makes stack 2 even more favorable. However, it is important to
point out that this conclusion regards only 1 bar, since higher pressures were not
explored with stack 2 due to lack of time (since it is a time-limited work). As will be
better explained in the next conclusive chapter, new tests at higher pressures will be
performed, in order to give a satisfactory and complete view of the matter.
93
5. CONCLUSIONS AND PERSPECTIVES FOR
FUTURE WORK
In this chapter, the principal conclusions obtained in this experimental work will be
reported, followed by some perspectives for future work.
The objectives of this experimental work concern different systems, which are
sequential steps of the same process.
Firstly, the study and optimization of synthesis gas production through a one step
innovative 1 kW prototype of alkaline water electrolysis (patented) using graphite
electrodes and without separation of the product gases. This part of the work has been
studied starting from the state-of-the-art technique achieved by previous research works,
in order to find the best process variables combination to obtain the best results, in
terms of carbon dioxide concentration, flow rate, energy consumption and so on. Then,
a second step has been the preliminary characterization of the process to produce one of
the fuels of greatest interest in fuel cells, methane (selecting the best operating
temperature) from the mixture of gases previously produced.
The principal conclusions achieved in this work are listed below:
- Even at low voltages, temperatures and pressures, the graphite oxidation is almost
always complete, and the CO percentage is never above 1 %. This trend (observed in
testing both stack 1 and stack 2) is different from what has been observed with the
previous studies on the laboratory prototype, and is probably related to the higher
current intensities that the new pilot plant allowed to test;
- With the increase of pressure, lower voltage values can be tested, since the current
intensity values increase when pressure increases (for the same voltage values). The
temperature range tested remains the same when increasing the pressure, since the
steam production increases at values higher than 90 °C, reducing the conductivity
power of the solution;
- In every test performed, the CO2 percentage increases with the increase of current
intensity until it reaches a maximum, and then a decrease for higher current intensity
values. The same behavior has been observed at every temperature and pressure
tested;

94
- The CO2 percentage increases with the increase of temperature until it reaches a
maximum. In almost every test performed, this temperature corresponds to the
highest tested, but, sometimes, a maximum in the CO2 percentage is observed at
lower temperatures, to decrease after this point is reached;
- The CO2 percentage increases with the increase of pressure until it reaches a
maximum, and then decreases. The same trend has been observed by the graphs in
the discussion of results chapter, when fixing both, temperature or voltage;
- In relation to the state-of-the-art achieved with this particular work, the ideal
production should satisfy the following characteristics: a good CO2 yield; the lowest
O2 percentage possible; the lowest voltage possible, in order to achieve the lowest
energy consumption possible; a high flow rate, in order to achieve high production.
All these considerations led to establish a optimum result (for stack 1) among the
tests performed, which corresponds to test 51: at 90 °C, 35 V, 3 bar, the results
obtained were a CO2 and O2 yield of 24.4 % and 4.9 %, respectively, and a flow rate
and current intensity equal to 103.5 L/h and 17.1 A;
- The O2 amount in the product gases is always significant, in every test performed
with both, stack 1 and stack 2. This calls to study about a way to remove it before
feeding the gases into the catalytic reactor for the succeeding step of methane (as
well as other fuels) production; in fact, oxygen poisons the catalyst and is dangerous
when mixed with hydrogen, two conditions that prove the importance in removing
oxygen from the gaseous mixture. A test to remove the oxygen has been performed
by filling the reactor with graphite nanoparticles. Not only the graphite nanoparticles
at those temperature, and in a reactor with that residence time, did not react with
oxygen (since graphite is a stable allotrope of carbon), but also they decreased the
CO2 concentration, which is not adequate since this compound is needed in order to
produce synthetic fuels;
95
- Some results shown in the graphs and regarding stack 1 do not conform with the
“normal” pattern, for several reasons: the uncertainty of the gas analyzer’s
measurements; the impossibility to control the temperature increase, as the reaction
is exothermic and easily reaches temperatures which were not foreseen with the
previous prototype (it is not easy to stabilize the results on the analyzers, and
sometimes it is possible to register false values); after some time using the same
electrolyte it was needed to replace it with a new one, as there were losses due to
evolved steam produced while working at high temperature, and, since the electrolyte
ability to conduct is not the same during all the working period, tests performed with
different electrolysis or in distant time frames can be somewhat different and show
an apparently strange result;
- Right after changing the electrolytic solution, for about one or two days, no CO2
production is registered. The reason for this behavior is believed to be due to the
solubility of CO2 in water (visible as sparkling water) until the gas reaches the
saturation concentration. Another reason, together with the previous one, can be that
NaOH reacts with CO2 to produce sodium carbonate (Na2CO3);
- The catalytic reactor has been tested with a Ni/CaO-Al2O3 catalyst in order to
perform preliminary tests on the methane production. At temperatures lower than
100 °C the production does not occur. At 125 °C, not only the reaction starts to
occur, but, also, the highest CH4 production is observed (25.51 %). Values as the
CH4 selectivity and the CO2 conversion are also the highest registered among the
tests performed, and correspond, respectively, to 96.5 % and 44.2 %. Even if at
higher temperatures the CH4 production is still observed, its selectivity is lower than
before, since a secondary reaction (the WGSR) occurs, leading to the concurrent
production of CO (which is an unwanted product). The CO2 conversion decreases as
well, as the CH4 amount produced is significantly lower than at 125 °C. The behavior
of flow rate with temperature is a decrease of it from 100 °C (no reaction) to 125 °C,
since both reactions (the principal one and the side one) occur with a decrease in the
number of moles from reagents to products. With the increase of temperature, the
flow rate increases a bit, as the CO2 conversion decreases, but, then, at 200 °C, it
decreases a little bit more again, even if the CO2 conversion is still decreasing,
probably because of the oxygen adsorption from the catalyst (which is poisoned by
it), adsorption which is higher with the increase of temperature;
96
- A linear increase in the gaseous flow rate with the increase of current intensity is the
trend observed with both stack 1 and stack 2. At 1 bar the two straight lines have
similar flow rate values at lower current intensities, but, with its increase, the flow
rates per cell in stack 1 become higher than in stack 2. Nevertheless, the difference is
minimal, and does not affect the choice between one electrolyzer or the other;
- In both, stack 1 and stack 2, the flow rate values are almost constant with the
increase of temperature (at fixed current intensity values), showing that temperature
almost does not influence flow rate;
- In stack 1, an increase of the energy consumption with the increase of voltage is
shown, independently from the tested temperature and pressure. The energy
consumption values in stack 1 and stack 2, at 1 bar, are similar, with higher values
reached in stack 1 with the increase of current intensity. Nevertheless, the difference
between the energy consumption results is minimal and does not affect the choice
between one electrolyzer or the other;
- The CO2 trend with voltage and temperature, at 1 bar, in stack 2, is the same
observed in stack 1, and without any mistake in the curves trend, thanks to the
knowledge achieved with tests on the previous stack. Nevertheless, stack 2 shows, at
1 bar, better results in terms of CO2 production, when compared to stack 1, in every
test performed. Furthermore, the stack 2 electrodes come from a different supplier
and are cheaper than the electrodes from stack 1, which makes stack 2 even more
favorable. The best results were obtained at 75 °C, 10 A and 1 bar. In these
conditions, the results obtained are a CO2 and O2 yield of 21 % and 10.6 %
respectively, and a flow rate equal to 27.6 L/h. It is important to point out that, even
if the result is the best in terms of CO2 production, a lot of time was needed, at 10 A,
for the temperature to reach the testing values, aspect which can be problematic in an
industrial plant.
97
Perspectives for future work
This experimental work was done on a 1 kW prototype, which represents the first
step of a scale-up project. For this reason it is necessary, as it is for every experimental
work, to know in which direction it should proceed, taking the conclusions and the
limits of the current work as a landmark. The perspectives for future work based on an
analysis of the present work are as follows:
- Try new ways to remove the oxygen from the gaseous mixture before feeding it into
the catalytic reactor for the fuels production. The problem in using the graphite
nanoparticles was, probably, the low reactivity of graphite (since it is a really stable
compound). One new test can be done using carbon black instead of graphite, a
carbon compound which is less stable than the first. Another test can be done with
swarf, trying to see if it is possible to oxidize it;
- Try to test the electrolyzer using a different electrolyte than NaOH. In particular,
with sodium carbonate (Na2CO3), whose production seems to be responsible
(together with the CO2 solubility in water) for the time needed for the carbon dioxide
production to start and to be measured on the analyzers, since sodium hydroxide
reacts with CO2 to produce it;
- Since the first test to verify if the graphite powder helps the carbon oxidation to
occur (or if that is the main reason for it) in the electrolyzers was not conclusive, it is
recommended to perform it again in the near future, in order to understand if it is
possible to avoid using graphite electrodes (replacing them with the steel ones) and
feed directly the electrolyte with graphite powder into the stacks;
98
- The H2:CO2 ratio chosen to feed the gaseous mixture in the catalytic reactor for the
methane production was much lower than the stoichiometric one. The reason for this
choice was, as already said, the need to reduce the O2 concentration in the mixture in
order to avoid further problems in the catalytic reactor. This consideration is related
to the state-of-the-art achieved with this work, but one of the perspectives for future
work is the use of a device to totally remove the oxygen. Once this goal is achieved,
two choices can be taken, depending mainly on economic considerations: maintain
the same H2:CO2 ratio and feed more H2 from another, simple, water electrolysis
system, or produce a mixture with the ideal ratio (around 5-6), which means a lower
content of CO2 and, consequently, a higher content of O2, and remove the oxygen in
the new device before feeding the mixture in the catalytic reactor;
- The sensor for the temperature measurement for the electrolyzer currently in use, is
placed into the storage tank instead of into the stack. It is probably better, in a new
pilot plant, to place it directly into the electrolyzer. Another important aspect
regarding temperature is that it is not possible to control the temperature increase in
the electrolyzer, as the reaction is exothermic and easily reaches temperatures which
were not foreseen for the previous prototype. A new pilot plant should have a system
to allow stopping the temperature where it is needed, in order to allow more time so
that the analyzers can stabilize readings;
- The temperature measurement in the catalytic reactor is not accurate, since the sensor
is placed between the external part of the reactor and the heating jacket. Especially
with exothermic reactions, it is important to check the temperature at different
heights inside it, in order to identify hot spots, or parts in which the catalyst is not
active (due to poisoning problems or a too low temperature and so on), and, in
general, to know how the temperature behaves in the reactor. The suggestion is to
place new sensors inside the catalytic reactor in the near future;
- The tests performed in the catalytic reactor in order to produce methane are defined
as “preliminary”, as the only parameter changed to observe the methane production
and behavior was the temperature. Future tests should include the study of other
parameters, such as pressure, catalyst height inside the reactor, and different types of
catalysts, in order to attain a more complete methodology for the tests execution;
99
- The tests in stack 2 were performed only at 1 bar, due to lack of time. New tests
should be performed at higher pressures in order to have a complete view of this
electrolyzer behavior, and to have a complete comparison between stack 2 and
stack 1;
- The best results in stack 2 were obtained at 10 A, but, as too much time was needed
for the system to reach the testing temperature, this aspect can be a problem in an
industrial plant. To avoid this aspect, new tests should be done with a jacket around
the stack in order to better promote the increase of temperature and reach the testing
conditions in less time than now. The possibility to use this device in an industrial
plant should, eventually, be studied considering mainly economic aspects;
- The consumption of the electrodes disks should be studied, in order to analyze the
consumption behavior and subsequently know after how much time it is needed to
replace the electrodes;
- After testing in a more complete way the methane production, new tests should be
done with the catalytic reactor in order to produce other synthetic fuels, such as
methanol. In particular, a new catalyst supplied for the project by FEUP seems to be
more active with CO2 than with CO, which is good, considering the actual mixture
composition obtained with the 1 kW pilot plant, and should be tested;
- In the meanwhile, the scale-up of the process should be performed, with new
prototypes of 5 kW, 100 kW and 1 MW.

100
B.101
BIBLIOGRAPHY
BECKER W. L., BRAUN R. J., PENEV M., MELAINA M., Production of Fischer –
Tropsh liquid fuels from high temperature solid oxide co-electrolysis units, Energy, 47,
2012, 99 – 115;
BP, BP Statistical Review of World Energy, June 2015;
BP, BP Statistical Review of World Energy, June 2015, 1, a;
CHANDEL M., WILLIAMS E., Synthetic Natural Gas (SNG): Technology,
Environmental Implications, and Economics, Climate Change Policy Partnership and
Duke University, January 2009;
CHEMSYSTEMS, Dimethyl Ether (DME) Technology and Markets, 07/08-S3 Report,
December 2008;
FUELCELLTODAY, Fuel cell basics – Technology types, May 2012;
GISFREDI P., Ambiente e sviluppo. Analisi di una controversia irriducibile, First
Edition, F. Angeli, Italy, 2002;
GONDOLINI A., Celle ad ossidi solidi per elettrolisi ad alta temperatura, PhD in
Industrial Chemistry, Alma Mater Studiorum – Università di Bologna, April 2013;
GUERRA L., Eletrólise da água para produção de gás de síntese, Master thesis in
Chemical Engineering, ISEL, Lisbon, January 2015;
GUERRA L., GOMES J., PUNA J., RODRIGUES J., Preliminary study of synthesis
gas production from water electrolysis, using the ELECTROFUEL®
concept, Energy,
2015, 1 – 7;
B.102
HOLLADAY J. D., HU J., KING D. L., WANG Y., An overview of hydrogen
production technologies, Catalysis Today, 139, 2009, 244 – 260;
IDA, DME/LPG Blends, IDA – International DME Association, 2010;
IEA, World Energy Outlook 2014, IEA – International Energy Agency, Executive
Summary, 2014;
IEA, World Energy Outlook 2014, IEA – International Energy Agency, Executive
Summary, 2014, 1, a;
IPCC, Climate Change 2014: Synthesis Report, IPCC - Intergovernmental Panel on
Climate Change, 2014;
IPCC, Climate Change 2014: Synthesis Report, IPCC - Intergovernmental Panel on
Climate Change, 2014, 56 and 100, a;
JUNAEDI C., HAWLEY K., WALSH D., ROYCHOUDHURY S., ABNEY M. B.,
PERRY J. L., Compact and Lightweight Sabatier Reactor for Carbon Dioxide
Reduction, American Institute of Aeronautics and Astronautics, 2011;
KEIM W., C1 chemistry: potential and developments, in Pure & Applied Chemistry,
Vol. 58, 1986, 825 – 832;
KHODAKOV A. Y., CHU W., FONGARLAND P., Advances in the Development of
Novel Cobalt Fischer-Tropsch Catalysts for Synthesis of Long-Chain Hydrocarbons
and Clean Fuels, Chemical Reviews, 107, 2007, 1692 – 1744;
LEE S., Methanol synthesis technology, PhD Thesis, Department of Chemical
Engineering, Akron, 1990;
B.103
MOLINO A., BARISANO D., (ENEA), Sviluppo di una unità prototipale per la
metanazione del syngas ed avvio alla sperimentazione, in Ricerca di Sistema Elettrico,
RdS-2012 Report, 296, September 2012;
MOULIJN J.A., MAKKEE M., VAN DIEPEN A. E., Chemical Process Technology,
Second Edition, Wiley, England, 2013;
MULLER J.T., URBAN P. M., HOLDERICH W. F., Electro-oxidation of Dimethyl
Ether in a Polymer-Electrolyte-Membrane Fuel Cell, Journal of the Electrochemical
Society, 147, 2000;
PETTINAU A., MAGGIO E., (ENEA), Stato dell’arte delle tecnologie coal-to-liquids e
possibili applicazioni sperimentali alla piattaforma Sotocarbo, in Ricerca di sistema
elettrico, RdS-2011 Report, 241, September 2011;
PUBCHEM – Public Chemical Database, Dimethyl Ether, USA, National Center for
Biotechnology Information, January 2016;
PUNA J., Desenvolvimento de novos catalisadores para a transesterificação de
triglicéridos em processos heterogéneos, PhD thesis in Chemical Engineering, IST,
Lisbon, 2014;
REDISSI Y., BOUALLOU C., Valorization of carbon dioxide by co-electrolysis of
CO2/H2O at high temperature for syngas production, Energy Procedia, 37, 2013, 6667 –
6678;
RODRIGUES J., Produção de Metanol por electrólise de água, usando eléctrodos de
grafite, GSYF Equipamentos para Energia Lda., 2013, a;
RODRIGUES J., Electrolisador e processo de produção de gás de síntese, por
electrólise da água, usando eléctrodos de grafite/carbono, GSYF Equipamentos para
Energia Lda., 2013, b;
B.104
STERNER M., Bioenergy and renewable power methane in integrated 100 %
renewable energy systems, PhD thesis in Electrical Engineering, University of Kassel,
Kassel, September 2009;
VAN DYK J. C., KEYSER M. J., COERTZEN M., Syngas production from South
African coal sources using Sasol – Lurgi gasifiers, International Journal of Coal
Geology, 65, 2006, 243 – 253;
WANG W., WANG S., MA X., GONG J., Recent advances in catalytic hydrogenation
of carbon dioxide, Chemical Society Reviews, 40, 2011, 3703 – 3727;
ZHANG J., FATAH N., CAPELA S., KARA Y., GUERRINI O., KHODAKOV A. Y.,
Kinetic investigation of carbon monoxide hydrogenation under realistic conditions of
methanation of biomass derived syngas, Fuel, 111, 2013, 845 – 854;
ZOULIAS E., VARKARAKI E., LYMBEROPOULOS N., CHRISTODOULOU C.N.,
KARAGIORGIS G.N., A review on water electrolysis, in the project titled “Cluster
Pilot Project for the Integration of Renewable Energy Sources into European Energy
Sectors Using Hydrogen (H2)”, funded by the European Union.
B.105
WEBSITES CONSULTED
http://www.internazionale.it/opinione/alessandro-lubello/2015/04/17/cina-economia-
dati-crescita-pil, Alessandro Lubello, L’economia cinese si trasforma, April 2015, date
of consultation 10.12.15;
http://www.api.org/Oil-and-Natural-Gas-Overview/Classroom-Tools/Classroom-
Curricula/What-is-Energy, API, What is Energy?, date of consultation 01.12.15;
https://www.arm.gov/education/studyhall/globalwarming/methane., ARM – Climate
Research Facility, Methane Background Information, date of consultation 08.01.16;
http://www.viewzone.com/verichipx.html, Bob Boyce, Free energy: the secret they
can’t kill, date of consultation 29.12.15;
http://www.cleancoalsyngas.com/index.php/what-is-ucg/syngas, Clean Coal Syngas,
date of consultation 03.01.16;
http://www.nmsea.org/Curriculum/7_12/electrolysis/electrolysis.htm, New Mexico
Solar Energy Association, Electrolysis: obtaining hydrogen from water: the basis for a
solar-hydrogen economy, date of consultation 18.12.15;
https://www.edf.org/methane-other-important-greenhouse-gas, Environmental Defense
Fund – EDF, Methane: the other important greenhouse gas, date of consultation
08.01.16;
http://www.eni.com/it_IT/prodotti-servizi/altri-prodotti/cleanfuel/metanolo/metanolo.shtml
ENI, Metanolo, date of consultation 01.11.15;

B.106
http://www.ambientediritto.it/dottrina/Diritto%20internazionale%20ambiente/Origine_e
voluzione_diritto_internazionale_ambientale.htm, Federico Antich, Origine ed
evoluzione del diritto internazionale ambientale. Verso una governance globale
dell’ambiente, date of consultation 12.12.15;
http://www.uniquegp.com/the%20sabatier%20reaction.html, UGP – Unique Global
Possibilities, The Sabatier reaction, date of consultation 09.01.16;
http://www.climatehotmap.org/about/global-warming-causes.html, Union of Concerned
Scientists, Climate hot map, global warming effects around the world, date of
consultation 11.01.16;
https://en.wikipedia.org/wiki/Synthetic_fuel#Indirect_conversion, Wikipedia, the free
encyclopedia, Synthetic fuel, date of consultation 04.01.16.
A.1
ANNEXES
INDEX OF FIGURES IN ANNEXES
Figure A.1: CO2 % with voltage at fixed temperature and pressure, stack 1 ............... A.2
Figure A.2: CO2 % with pressure at fixed voltage and temperature, stack 1 ............... A.2
Figure A.3: CO2 trend with intensity, comparison between stack 1 and stack 2 ......... A.3
Figure A.4: CO2 trend with temperature, comparison between stack 1 and stack 2 .... A.3
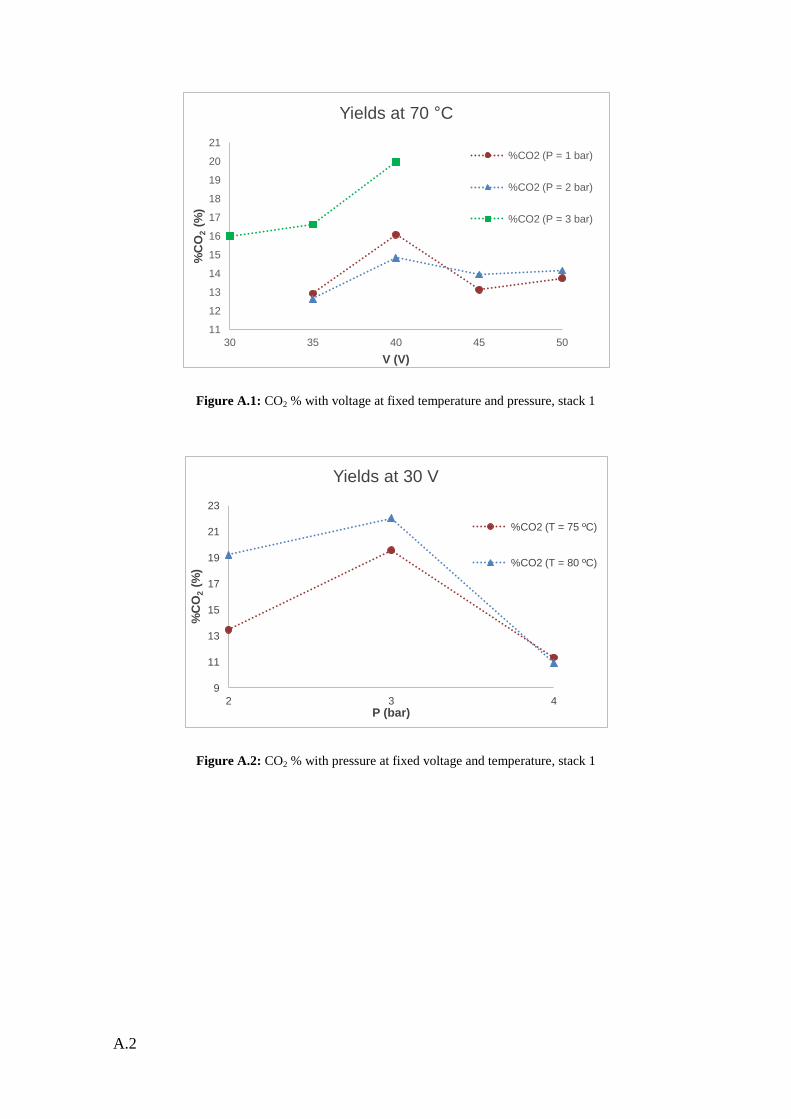
A.2
Figure A.1: CO2 % with voltage at fixed temperature and pressure, stack 1
Figure A.2: CO2 % with pressure at fixed voltage and temperature, stack 1
11
12
13
14
15
16
17
18
19
20
21
30 35 40 45 50
%C
O2 (
%)
V (V)
Yields at 70 °C
%CO2 (P = 1 bar)
%CO2 (P = 2 bar)
%CO2 (P = 3 bar)
9
11
13
15
17
19
21
23
2 3 4
%C
O2 (
%)
P (bar)
Yields at 30 V
%CO2 (T = 75 ºC)
%CO2 (T = 80 ºC)
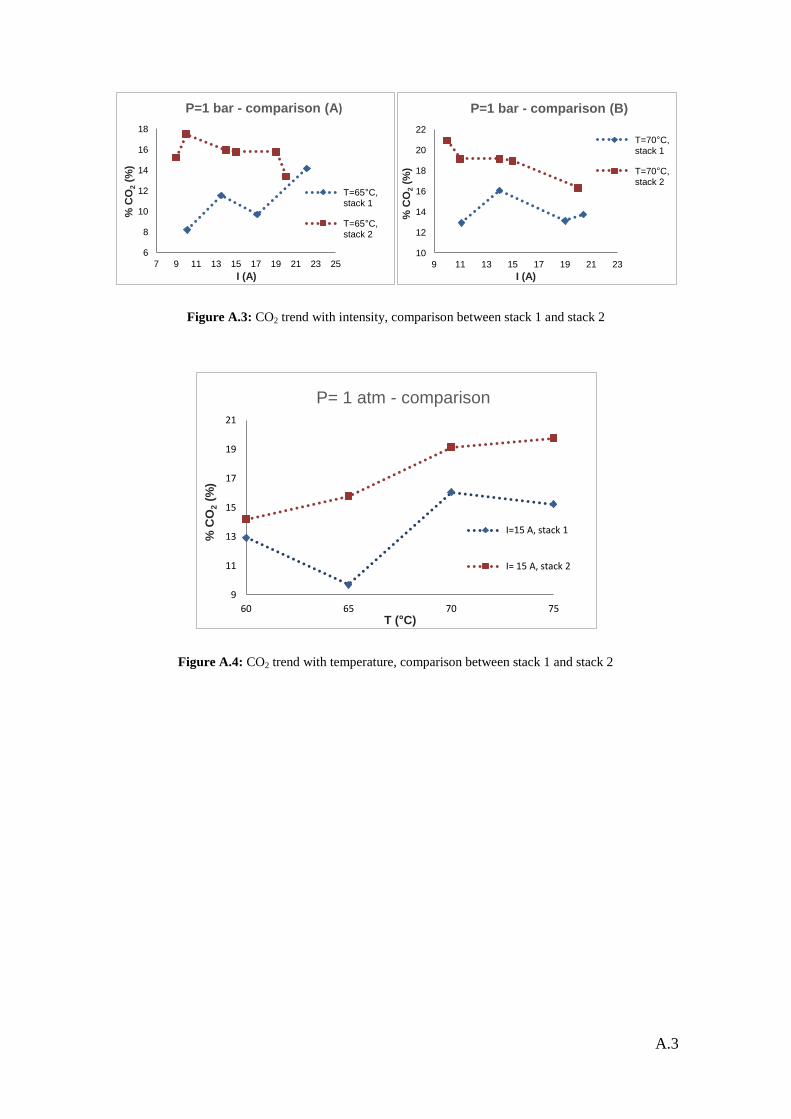
A.3
Figure A.3: CO2 trend with intensity, comparison between stack 1 and stack 2
Figure A.4: CO2 trend with temperature, comparison between stack 1 and stack 2
6
8
10
12
14
16
18
7 9 11 13 15 17 19 21 23 25
% C
O2 (
%)
I (A)
P=1 bar - comparison (A)
T=65°C, stack 1
T=65°C, stack 2
10
12
14
16
18
20
22
9 11 13 15 17 19 21 23
% C
O2 (
%)
I (A)
P=1 bar - comparison (B)
T=70°C, stack 1
T=70°C, stack 2
9
11
13
15
17
19
21
60 65 70 75
% C
O2 (
%)
T (°C)
P= 1 atm - comparison
I=15 A, stack 1
I= 15 A, stack 2
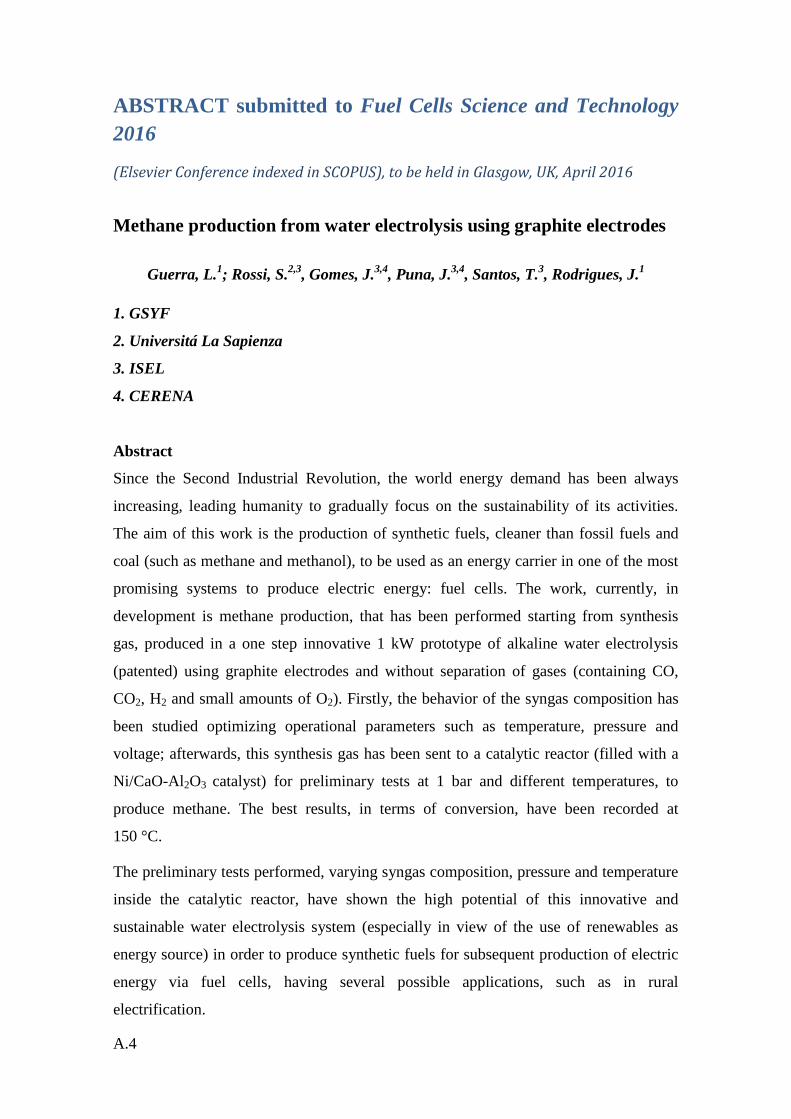
A.4
ABSTRACT submitted to Fuel Cells Science and Technology
2016
(Elsevier Conference indexed in SCOPUS), to be held in Glasgow, UK, April 2016
Methane production from water electrolysis using graphite electrodes
Guerra, L.1; Rossi, S.
2,3, Gomes, J.
3,4, Puna, J.
3,4, Santos, T.
3, Rodrigues, J.
1
1. GSYF
2. Universitá La Sapienza
3. ISEL
4. CERENA
Abstract
Since the Second Industrial Revolution, the world energy demand has been always
increasing, leading humanity to gradually focus on the sustainability of its activities.
The aim of this work is the production of synthetic fuels, cleaner than fossil fuels and
coal (such as methane and methanol), to be used as an energy carrier in one of the most
promising systems to produce electric energy: fuel cells. The work, currently, in
development is methane production, that has been performed starting from synthesis
gas, produced in a one step innovative 1 kW prototype of alkaline water electrolysis
(patented) using graphite electrodes and without separation of gases (containing CO,
CO2, H2 and small amounts of O2). Firstly, the behavior of the syngas composition has
been studied optimizing operational parameters such as temperature, pressure and
voltage; afterwards, this synthesis gas has been sent to a catalytic reactor (filled with a
Ni/CaO-Al2O3 catalyst) for preliminary tests at 1 bar and different temperatures, to
produce methane. The best results, in terms of conversion, have been recorded at
150 °C.
The preliminary tests performed, varying syngas composition, pressure and temperature
inside the catalytic reactor, have shown the high potential of this innovative and
sustainable water electrolysis system (especially in view of the use of renewables as
energy source) in order to produce synthetic fuels for subsequent production of electric
energy via fuel cells, having several possible applications, such as in rural
electrification.