steady state mechanics of the false twist yarn
TRANSCRIPT

ISTEADY STATE MECHANICS OF THE FALSE
TWIST YARN TEXTURING PROCESS
by
RAYMOND Z. NAAR
Ing. A.I.V., Ecole Superieure des Textiles de Verviers(1955)
S.M., Massachusetts Institute of Technology(1958)
SUBMITTED IN PARTIAL FULFILLMENTOF THE REQUIREMENTS FOR THE
DEGREE OF
DOCTOR OF SCIENCE
at the
MASSACHUSETTS INSTITUTE OF TECHNOLOGY
FEBRUARY 1975
Signature of Author_
Department of Mechanica4 Engineering,
Certified by
December 5, 1974
- - -- -Nw, V
ThesiA Supervisor
Accepted by
Chairman, Department Committee on Graduate Students
AfAR 3 1975LOR 1ctS _
II

STEADY STATE MECHANICS OF THE FALSE
TWIST YARN TEXTURING PROCESS
by
RAYMOND Z. NAAR
Submitted to the Department of Mechanical Engineeringon December 5, 1974 in partial fulfillment of the requirements
for the Degree of Doctor of Science
ABSTRACT
In the false twist texturing process a moving threadlineis subjected to temporary twist while heat is applied to partof the twist zone. The purpose of the process is to heat setthe twist deformation so that after cooling and twist removal,the filaments will seek to return to their set helicallycrimped paths. This crimping action leads to bulk and/orstretch development such as is encountered in double knitsuitings and/or stretch hosiery.
During processing, the entire twisted threadline is underconstant tension and torque, but is not at constant temperature,since part of it is intentionally heated to effect the settingprocess. The threadline is thus divided into three contiguouszones, all under the same stress field but each with differentmechanical properties. The threadline tension is a result offilament strain which arises from the difference between thedenier of the exiting yarn (imposed by the feed and exit rollvelocities) and the equilibrium denier for the unrestrainedyarn at the heater temperature, while the torque is due to thetwist imparted by the spindle. In the portion of the thread-line before the heater, the torque is supported by componentsof the bending and torsional moments acting on the individualfilaments, as well as the moment due to the tension of thefilaments. At the heater, the bending and torsional momentsbecome insignificant, and the torque is supported by tensioncomponents only; the twist, therefore, increases to maintaintorque equilibrium. This uptwisting is assumed to occur with-out filament migration. As the properties of the filamentchange along the threadline due to temperature changes, so doesthe mechanism by which the yarn is deformed.
The pertinent filament properties and yarn twistingmechanism have been analyzed. Values of tension and torquehave been calculated for a wide range of temperatures and over-feeds and are in agreement with experiment.
Thesis Supervisor: Professor Stanley BackerTitle: Professor of Mechanical Engineering

3
ACKNOWLEDGEMENTS
The author is indebted to the Phillips Petroleum Company
and to the WESTVACO Corporation for their fellowship support
in the early stages of his graduate program. Thanks are due
also to Burlington Industries, Inc. and to the E. I. du Pont
de Nemours & Company for fellowship and research assistantship
support during the latter part of his doctoral research. With-
out this generous industrial backing and encouragement the
completion of this program would not have been realized.
The author wishes to thank Professor S. Backer, Professor
M. B. Bever, Professor E. Orowan and Professor I. V. Yannas who
served on his Doctoral Committee. He greatly profited by con-
tact and discussions with them on scientific and other topics.
He also profited by discussions and collaboration with a number
of classmates and office mates, among them A. Crugnola,
D. Brookstein, A. Tayebi, S. Arghyros, B.Y. Lee, C. Brogna.
He also greatly profited from contact, discussions and
friendship with Drs. S. Batra and W. L. Yang, staff members of
the Fibers and Polymers Laboratories. The support of
Professor Yannas, who was always ready to help, listen and make
suggestions is most gratefully acknowledged. Professor
J. J. Thwaites was most helpful and gave unstintingly of his
time. The writer greatly profited from discussions with a
person of such critical and creative wit and is sincerely
grateful to him.
The author wishes to acknowledge the moral support he
received from his colleagues in the Department of Chemical
Engineering at Tufts University, Professors van Wormer, Botsaris
and Sussman. He is also grateful to Professor Gyftopoulos who
never ceased to encourage him towards completion.
Among others, the writer wishes to thank his wife and his
mother for their encouragement. Many thanks to
Dorothy Eastman who typed many of the progress reports connected
with the manuscript; to Joanna Larsen for typing the manuscript,
and to Guddi Wassermann for her accurate drawings.

4
Finally, it would be unfitting to conclude without stressing
the writer's deep indebtedness to Professor Stanley Backer,
the Chairman of his Doctoral Committee, who helped, advised and
encouraged the writer throughout his work. The writer considers
himself lucky to have been associated with a person of
Professor Backer's stature; he enjoyed and greatly profited
from the experience of working under a man of uncompromising
standards of quality and capability of seeing through complex
situations to the simple physical essence of a problem.

5
TABLE OF CONTENTS
Abstract
Acknowledgements
List of Tables 9
List of Figures 10
Chapter I.
Introduction 12
Chapter II.
Plan of Work 14
Chapter III. The False-Twist Process 15
(a) Description of the Process 15
(b) Twist Development in the Machine 18
(c) Controllable Machine Variables 20
(d) The False-Twisted Yarn 21
(e) Machine-Yarn Interaction 22
Chapter IV. Yarn Geometry 26
(a) Model for Yarn Geometry 26
(b) Yarn Contraction 30
Chapter V. Yarn Mechanics 31
(a) Classical Mechanics 31
1. Stress-Strain Curves of Yarns 31
2. Average Filament Strain 34
3. Yarn Torque 35
Bending Moment Contribution to Yarn Torque
Fiber Torsional Moment Contribution to Yarn
Torque
Torque due to Tension
(b) Tension and Torque for the Case of Equal
Tension on all Filaments 40
1. Tension: Stress-Strain Curve 41
2. Torque 41
(c) Overtwisting 42
1. Stress-Strain Curve 42

6
2. Torque in Overtwisted Yarn
3. Overtwisting from Zero Twist
4. Average Filament Strain on Overtwisting
5. Average Filament Strain on Overtwisting
in Various Zones of the Yarn
6. Torque on Overtwisting in Various Zones
of the Yarn
Chapter VI. Experimental Apparatus and Materials
(a) Apparatus
1. Texturing Machine
2. Torque Measuring Apparatus
3. Tensile Testing Machine
(b) Material Properties
1. Stress-Strain Curve of Feed Yarns
2. Stress-Strain Curve of Yarns Processed
through the False-Twister without Twist
3. Stress-Strain Curve of Freshly Textured
Yarns
4. Stress-Strain Curve of Yarns at Elevated
Temperatures--The Contractile Stress
Chapter VII. Experimental Results: Twist and Tension
(a) Introduction
(b) Experimental Procedure
(c) Experimental Results
1. Twist in Exit Zone
2. Twist in Entrance Zone
3. Tension
4. Denier
5. Analysis of the Data and Implications
for the Process
(d) Experimental Results: The Effect of Twist
(e) Experimental Data: The Effect of Draw Ratio
(f) Qualitative Model for the Process
Chapter VIII. Calculation of Tension
(a) False-Twister Operating, but Spindle
Stationary
1. Analysis
46
47
48
49
50
51
51
51
54
54
58
59
60
60
69
76
76
78
82
82
85
85
90
90
92
92
92
100
100
100
7
2. Experimental Verification
(b) Determination of the Tension during False-
Twisting
1. Analysis
2. Experimental Verification
3. Discussion
4. Example of Tension Calculation
Chapter IX. Measurement and Calculation of Torques
(a) Introduction
(b) Torque in the Entrance Zone
1. Torque due to Filament Bending
2. Torque due to Filament Torsion
3. Torque due to Filament Tension
4. Comparison of Calculated and Experimental
Data for the Case of the Entrance Zone
(c) Torque in the Heater Zone
1. Material Properties
2. Torque from Classical Yarn Mechanics and
from Equal Filament Tension Contributions
3. Overtwisting
4. Discussion of the Data
(d) Example of Calculation of Torque
1. Entrance Zone
(i) Torque due to Tension
(ii) Torque due to Bending
(iii)Torque due to Torsion
2. Heater Zone
(i) Torque due to Tension
(ii) Torque due to Bending
(iii)Torque due to Tension-Overtwisting
Chapter X. Discussions, Conclusions and Recommendations
(a) Discussion
(b) Conclusions
(c) Recommendations
102
104
104
109
110
120
126
126
127
127
127
130
131
133
133
137
137
140
148
148
151
158
161
164

8
APPENDICES
Appendix I. Additional Yarn Mechanics Derivations 161
(a) Stress-Strain and Torque-Strain Expressions
for Yarns; Twist Varies with Extension 161
(b) Stress-Strain Curves of Yarns Assuming the
Twist to Vary with Extension and the Fila-
ments to Extend at Constant Volume 169
(c) Stress-Strain and Torque-Strain Curves of
Yarns Assuming the Twist to Vary with Ex-
tension and the Filaments to Extend at
Constant Volume (Alternate Derivation) 171
(d) Overtwisting at Constant Radius 173
(e) Mechanics of Yarn Shrinkage due to Fiber
Shrinkage 175
(f) Shearing Strains on Fiber due to Torsion
and Bending 179
1. Differential Geometry of Yarns 179
2. Local Shear Strain on Fibers as they lie
in the Yarn 182
3. Local Shear Strain on Untwisted, False-
Twist Fibers 186
Appendix II. Literature Review 191
(a) Interaction between Machine Variables 191
(b) Heating and Thermal Plasticization 198
(c) Crimp Rigidity 215
(d) Effect of Machine Settings on Yarn Quality 230
References 240
Biographical Sketch 243

9
LIST OF TABLES
TABLE I: YOUNGS MODULUS OF YARNS PROCESSED THROUGH THEFALSE-TWISTER (BUT NOT THREADED AROUNDTHE SPINDLE)
TABLE II: YOUNG'S MODULI OF TEXTURED YARNS (GRAMS PERUNIT STRAIN)
TABLE III:STRESS-STRAIN CURVES FROM CONTRACTILESTRESS DATA
TABLE IV: RELATIVE LENGTH CHANGES IN YARN PROCESSEDTHROUGH THE FALSE-TWISTER (SPINDLE STATIONARY)
TABLE V: TWIST DISTRIBUTION - EFFECT OF TEMPERATUREAND TENSION
TABLE VI: TWIST DISTRIBUTION - EFFECT OF TWIST AT 210°C
TABLE VII:TWIST DISTRIBUTION - EFFECT OF YARN DRAW RATIOAT 2280C
TABLE VIII: TENSIONS ABOVE AND BELOW THE SPINDLE(210C Heater Temperature)
TABLE IX: CALCULATED AND MEASURED THREADLINE TENSION (GRAMS)DURING FALSE-TWISTING (50 TPI BASIC TWIST)
TABLE X: MEASURED AND CALCULATED VALUES OF TORQUE
(in-lb 10-5)
TABLE XI: COMPONENTS OF CALCULATED TORQUE (VIA OVERTWISTING)IN THE HEATER ZONE

10
LIST OF FIGURES
1 SCHEMATIC OF THE FALSE-TWIST APPARATUS
2 TENSION, TORQUE AND TWIST ALONG THE FALSE-TWIST THREADLINE
3 SCHEMATIC OF THE FALSE-TWIST APPARATUS SHOWINGDIMENSIONS
4 PHOTOGRAPHS OF THE FALSE-TWIST APPARATUS
5 PHOTOGRAPHS OF THE TORQUE-MEASURING APPARATUS
6 STRESS-STRAIN CURVE (partial) OF FEED YARN
6' STRESS-STRAIN CURVE OF FEED YARN
7 STRESS-STRAIN CURVES (partial) OF FRESHLYTEXTURED YARNS (2100C)
8 STRESS-STRAIN CURVES (partial) OF FRESHLYTEXTURED YARNS (1340C)
9 STRESS-STRAIN CURVES AT ELEVATED TEMPERATURES
10 TWIST IN THE ENTRANCE AND COOLING ZONES AS AFUNCTION OF TEMPERATURE AND OVERFEED
11 TWIST VARIATION WITH OVERFEED AT 1910C AND2280C
12 RELATIVE CONTRACTED LENGTH VARIATION WITHOVERFEED AT 1630C, 191°C, and 2280C
13 TENSION vs. TEMPERATURE AT VARIOUS OVERFEEDS
14 VARIATION OF TENSION WITH TWIST AT 2100C
15 TWIST IN THE ENTRANCE ZONE AS A FUNCTION OFTWIST AT THE SPINDLE
16 EXPERIMENTAL AND CALCULATED VALUES OFTENSION (1340C)
16' EXPERIMENTAL AND CALCULATED VALUES OFTENSION (2100C)
17 VARIATION OF 2 AND E2 WITH TEMPERATURE AT-2.86% OVERFEED
FIGURE
FIGURE
FIGURE
FIGURE
FIGURE
FIGURE
FIGURE
FIGURE
FIGURE
FIGURE
FIGURE
FIGURE
FIGURE
FIGURE
FIGURE
FIGURE
FIGURE
FIGURE
FIGURE

IILIST OF FIGURES (continued)
FIGURE 18
FIGURE 19
FIGURE 19'
FIGURE 20
FIGURE 20'
FIGURE
FIGURE
FIGURE
FIGURE
21
22
22'
23
MEASURED TORQUE vs. TEMPERATURE ATOVERFEEDS
EXPERIMENTAL AND CALCULATED VALUES(134°C)
EXPERIMENTAL AND CALCULATED VALUES(210°C)
CALCULATED COMPONENTS OF TORQUE INZONE AT 210°C (UPPER LIMIT)
CALCULATED COMPONENTS OF TORQUE INZONE AT 1340C (UPPER LIMIT)
RELAXATION OF TORQUE OF STATICALLY
DIFFERENTIAL GEOMETRY OF YARNS
DIFFERENTIAL GEOMETRY OF YARNS
CONTRACTILE STRESS vs. TEMPERATURE
VARIOUS
OF TORQUE
OF TORQUE
THE ENTRANCE
THE ENTRANCE
TWISTED YARN

12
I, INTRODUCTION
Amongst the important developments which have occured in the
last 50 years in the textile industry, one must certainly in-
clude the invention and subsequent commercial use of textur-
ing techniques for synthetic thermoplastic fibers.
Texturing is a broad term which covers a variety of industrial
processes which may be quite different yet have as a common
objective to modify the geometry of the straight cylindrical
synthetic filaments; this makes the yarn composed of such
filaments bulkier and fluffier and, in most cases, it also
makes it stretchy and elastic. Of the numerous processes
that have been developed by far the most important commer-
cially is the so-called false-twist texturing process. It
is estimated that 2/3 of all textured fibers are textured
using this process (R ). In the course of the last 20 years
or so that false twisting has been used in the textile indus-
try, considerable development and improvements have been
brought about in the false-twisting equipment; these have
resulted in very significant improvements in productivity.
The process itself is described in the next section, and de-
tails of the various components of the equipment may be found
in the literature and bulletins put out by various manu-
CR2)facturers(R2) As is often the case, art precedes science
and although, as mentioned, much has been done to improve
the equipment, very little work can be found in the published

3
literature which deals with the mechanism of the process,
i.e.', how a given yarn interacts with the 'equipment and in
which way the process parameters Coverfeed, temperature, rpm)
affect the yarn in process. There exists no understanding
or analysis which quantitatively or even qualitatively relates
the process parameters to the observed yarn response (tension,
torque, twist); there exists however, a considerable amount
of experimental work, empirical in nature, which correlates
changes in process parameters to changes in properties of the
treated yarn(Rl, R3)
The present research was undertaken with the objective of
understanding and, if possible, quantifying the interaction
between the machine variables alluded to above, and the cor-
responding response of the yarn being processed at steady
state in the false twister. Given that the machine variables
are of a mechanical and thermal nature, the yarn response
will be determined by the laws of structural yarn mechanics
and from the mechanical and thermomechanical properties of
the filaments composing the yarn. Ideally then the problem
would be solved if given the machine settings, and the appro-
priate material properties, one were able to predict the
yarn response, which is (as we shall see) the twist distri-
bution, the tension and the torque. The progress made in
answering this question forms the body of this thesis.
14
II. PLAN OF WORK
The work done in this thesis will be presented in the
following sequence:
(a) The false twist process will be described and its
main features analyzed in some detail.
(b) Theoretical considerations on yarn geometry and
appropriate equations for yarn mechanics will be
described and/or derived.
(c) Material Parameters. The experimental techniques
used in obtaining the material parameters will be
described, and the values of the parameters thus
obtained will be tabulated and graphed.
(d) Experiments on the false-twister. The experimental
technique used in obtaining process data as well as
data of the process effects on the yarn, will be
described. The experimental data will be tabula-
ted, graphed, and analyzed.
(e) Consideration of yarn mechanics in conjunction
with the experimentally determined materials pro-
perties, will be used to explain the data obtained
in the false-twist experiments; a model describing
yarn behavior will be outlined, and using this as
a basis calculations will be made of the important
processing responses such as tension and torque
which will then be compared to the values deter-

IS
mined experimentally in the false-twisting ex-
periments.
(f) Conclusions will be drawn and recommendations for
future work made.
The Appendix contains literature review of articles on
false twisting, as well as additional derivations of yarn
mechanics equations.
III. THE FALSE TWISTING PROCESS
(a) Description of the Process
Fundamentally in the course of this process a yarn is highly
twisted, heated to a high temperature to relax the stresses
imposed by the twist and thus be "set", cooled to room tem-
perature to improve the quality of set, and then untwisted
and wound in a package. All these operations are performed
continuously on a false-twist machine: untextured yarn enters
the machine and textured yarn is wound on the package. The
name "false-twist" derives from the fact that the twist the
yarn sees is not permanent but is removed by virtue of the
nature of the process itself.
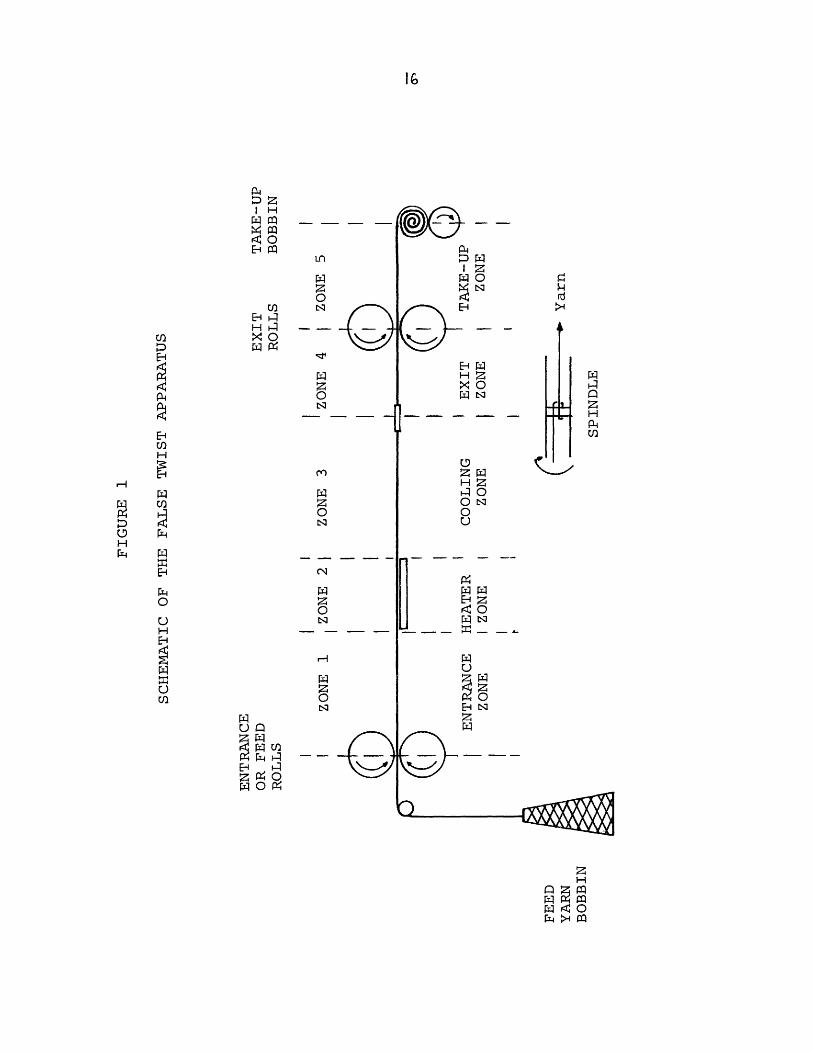
A schematic of the process is given in Figure 1. With re-
ference to Figure 1, the equipment fundamentally consists
I H
E LO
0U) N
H D ZIU PH
cr'
0 ZOU]
HU ) 0
E
H
1F 0F14 -H m
P4~D !

17
of two sets of rubber covered rollers, the feed and exit rolls
which serve to feed and move the yarn thru the machine.
Between these rolls is interposed a spindle ( a hollow cylin-
der with a pin across its center around which the yarn is
"threaded" as per the sketch). The spindle rotates as
shown and in so doing imparts twist in opposite sense to the
yarn upstream and downstream. Between the feed rolls and
the spindle is a heated plate whose temperature is carefully
controlled and with which the yarn comes in contact as it
travels through the machine. Downstream of the exit rolls
there is a package into which the textured yarn is wound,
often under some tension.
At steady state operation the experimentally observed situa-
tion is as follows: untwisted yarn (or yarn with only produ-
cer's twist, i.e., 1/3 to 1/2 tpi) enters the machine and is
immediately twisted to some twist level (which is a function
of the machine settings and material properties); as the
yarn passes over the heater it gets heated and the twist is
seen to increase (typically by 30%); between the heater and
the spindle the yarn cools to room temperature while the
twist remains substantially the same (a slight increase is
often observed); finally immediately it exits the spindle,
the yarn is untwisted and remains so as it moves through the
exit rolls and gets wound up on the package.

(b) Twist Development in the Machine
That on operating at steady state there is only twist up-
stream of the spindle but not downstream is puzzling at
first sight. However we can visualize how this comes about
via the following thought experiment: imagine the feed and
take up rolls stationary (no axial motion of the yarn) the
heater removed but the spindle rotating. It will impart an
equal number of turns upstream and downstream. Now allow,
additionally, the yarn to move axially thru the machine and
consider the number of turns entering and escaping in the
zones upstream and downstream of the spindle, during a short
period of time, At. Assume that, at the start of this time
interval, the zone upstream of the spindle contains x turns
of twist Z, and the zone downstream contains an equal number
of turns of twist S. During the time interval the following
happens in the two zones:
Upstream of the Spindle Downstream of the Spindle
Spindle inserts twist Z Spindle inserts equal numbe
Yarn with Z twist escapes
through the spindle into
the next zone
Fresh untwisted yarn enters
the zone through feed
rolls
of turns S
Yarn with twist S escapes
through the exit rolls of
the zone into the package
Yarn of twist Z enters the
zone through the spindle
and cancels some of the
existing S twist
r

As can be seen from the above, yarn in the zone downstream,
will receive fewer turns than yarn in the zone upstream
when the yarn is made to run through the machine so that the
twist in the downstream zone will decrease with time; as the
twist approaches zero, the number of turns of twist S, es-
caping through the exit rolls also approaches zero, and,
finally, at steady-state no twist is left in the downstream
zone. At steady-state the turns of S twist inserted in
the downstream zone are exactly balanced by the turns of Z
twist escaping from the upstream zone, so that the zone
downstream of the spindle remains free of twist. A simple
mathematical derivation of the approach to steady state has
(R5)been given by Denton

lo(c) Controllable Machine Variables
For a given machine the controllable variables are, the
velocities of the feed rolls Vin, and the exit rolls Vout,
the heater temperature, and the spindle rpm N.
The twist level is controlled by the ratio of spindle rpm
to outgoing velocity; the machine thus inserts at steady
state a constant twist, , which is a basic twist (orout
flat twist) since it refers to a number of turns per un-
twisted length of yarn. From considerations of yarn
geometry to be discussed later, one can calculate the
actual twist (or number of turns per twisted length of
yarn) given the basic twist; unfortunately, ideal yarn
geometry is not obeyed because the tension in the process
can vary considerably depending on the chosen machine
settings, and more specifically, on (a) the "overfeed"
Vin - Vout(defined as expressing the relative rates at
inwhich the yarn is fed in and withdrawn from the machine),
and (b) the heater setting which generates shrinkage forces
in the filaments.

The twist, temperature and overfeed are the major machine
parameters that a processor has at his disposal; there are
of course a number of other parameters (type of heater,
length of heater or duration of contact time, length of cooling
(R2)zone) that are decided upon by the machine manufacturer
In our work residence time in the heater and in the cooling
zone was such that thermal equilibrium was essentially at-
tained, so residence time per se was not a limiting consid-
eration.
(d) The False-twisted Yarn
The purpose of the sequence of operations occuring in the
false-twister is to "set" the yarn while the latter is highly
twisted; upon untwisting the yarn "remembers" its twisted
configuration: if left free it tends to twist back (not·
all the way, of course, because the filaments interfere with
each other); if it is prevented from twisting but allowed to
retract, it will do so, the filaments buckling or collap-
sing into short helical segments and snarls.
This behavior can be explained by considering that when
the yarn is heat set in the twisted configuration, the bend-
ing and torsional stresses built up on the filaments during
twisting have been largely or completely relaxed and the
filaments are thus stress-free, except for tensile stresses.
Untwisting the yarn reimposes on the filaments considerable
bending and torsional energy(R4)bending and torsional energy

22This feature, i.e., the ability of the filaments to buckle
into helices, whorls and snarls, results in a considerable
shortening of the yarn and a very significant increase in
diameter; these twin abilities of the yarn to retract (or
conversely extend considerably under low stress) and to
"bulk", are the two main properties which are of industrial
importance and have allowed for the creation of "stretch"
garments and hosiery.
(e) Machine-yarn Interaction
Restating the problem which forms the core of this thesis,
the question is how do the processing parameters, overfeed,
rpm and heater temperature interact with the yarn, that
interaction being manifested by the yarn twist distribution,
yarn tension and yarn torque? The first step in our analysis
is to derive some basic "principles" about the operation of
the machine, which will serve as a basis for further analy-
sis of the interaction; these principles are either derived
by direct consideration of the way the machine works or by
experimental measurements. Referring to Figure 2 where a
schematic representation of the machine is given along with
plots indicating the yarn response, the following apply:
Twist
From experimental observation (R1,R6,R7,R8) of steady state
operation the yarn is twisted as it enters the machine and
the twist remains substantially constant in the entrance

23
FIGURE 2
TENSION, TORQUE AND TWIST ALONG THE FALSE TWIST THREADLINE
TENSION
I~ iI, I I
TORQUE I
TWISTI I I~~~~~~~~~~~~~~~~~~I I I
I TWIST
I
II
i
I
ENTRANCE
I !
HEATER
I
EXIT
I
!
IiI
!
SPINDLE
- -w ....
II
I
I
I
I
I
I
I
I
I
I
I
I
I
I
I
II
l

24zone. When the yarn reaches the heater, the twist suddenly
increases (typically by 30%) as shown in Figure 2, and
thereafter remains substantially constant until the spindle.
At the spindle the basic twist must be such that = N-,out
and the actual twist is, of course, the basic twist corrected
for yarn contraction.
The transition at the heater is not a step function but more
gradual (R8), and often the twist is found to increase some-
what after the heater(R6 R7). For purposes of this work,
however, these refinements were neglected in order to deal
with a more simple and tractable model.
One of the important things to explain is the origin and
level of the twist increase at the heater or "twist jump",
and to explain and predict if possible, the actual twist
observed at the spindle, given the basic twist which is
known and imposed by the machine. That last point should
also be experimentally verified since a number of authors
have on occasion claimed(R9) that twist "escapes" from the
spindle; this would then mean that the basic twist imposed
by the machine is different from that given by T = Vout
Torque
The rotation of the spindle imposes a torque on the yarn
and it is in response to that torque that the yarn twists
on entering the machine The torque below the spindle at

25
steady state is taken to be constant all the way to the
entrance rolls. Now, in the absence of frictional restraints
(neglecting air drag) that torque must remain constant from
the spindle to the entrance. In actual industrial practice
this may not be quite so because the yarn may be passed over
various guides, the friction against which decreases the
torque upstream. Also the friction against the heater will
reduce the torque. However, in our experiments which will
be described later, there were no guides to add friction to
the yarn, and care was taken to minimize the tension against
the heater. So, the hypothesis of constant torque is a
realistic one.
Downstream of the spindle, where the yarn is untwisted,
there is a small torque of opposite sense to the upstream
one; as earlier explained, the untwisted yarn is a "torque"
yarn, the untwisting having disturbed the yarn from its set,
twisted minimum energy configuration.
Tension
For reasons similar to those previously expounded, the
tension below the spindle will be constant along the thread-
line. The tension above the spindle will be much higher
since the yarn is wrapped around the spindle and is literal-
ly pulled by the exit rolls. The overall level of tension
depends on the overfeed and the temperature.
We can summarize then by saying that the false-twisting

26process is one where the machine imposes constant tension
and constant torque; it is thus essentially a creep process
but a non-isothermal one. Understanding and quantifying the
reaction of the yarn to these particular creep conditions
is, as already mentioned, the objective of this work.
IV. YARN GEOMETRY
In this section we shall derive the geometrical and mechan-
ical relationships which determine the response of the yarn
to various stress conditions; these equations will be used
later to interpret the experimental data, and construct a
model for yarn behavior.
(a) Model for Yarn Geometry
The model used in this work is that used by other investiga-
tors(Rl1 ) as further refined by Gracie(Rll) In this model
the yarn is assumed to be composed of filaments all of which
lie along perfect concentric helices of identical pitch.
The helix angle varies with the radial position of the fila-
ment. The packing density is constant across the cross-
section. Given the packing density, this model predicts
(R11)that the yarn volume remains constant on twisting
Gracie also assumed that the filaments are continuously
distributed over the yarn cross-section; this makes it easy
to handle mathematically any equations involving filament
parameters, as one can integrate across the cross-section

21to obtain quantities such as tension and torque.
The symbols used to describe the geometry are:
W = number of fibers in the yarn
p = yarn twist (actual) in rad/inch
T = yarn twist (actual) in turns/inch
k = packing factor
f = filament radius
r = radius at any point within the yarn
b = outside yarn radius
Now, if at any radius r (r < b) of the yarn we "open" or
unwind the yarn by one turn, the following geometrical re-
lationships prevail (see sketch). The line AC is the un-
C ..11-1 - 1 -i .-; 4 4--C
2[ 12w
WUUIIU £L I..l0; . L I ILLLuiL; . L
angle with respect to the yarn
axis BC is q. The length
BC = 2, since the yarn twist'27 _ 1 p
is T = p turns per inchp T
and we "opened" one turn whichD
A D
2Tr corresponds to l/t inches.
The side AB is, of course, the
circumference of the yarn at radius r. Given thus AB and BC
we obtain AC as shown. Given the sketch above, the following
(identical) geometrical relationships also hold (see sketch
on following page).
I

Thus to 1" of yarn we have
/I7+ p2 fiber length at
radius r, and /1 + p2 b2 fiber
length at the outside radius.
Also,
cos q =1
, and
/ 1 + p2r2
sin q =pr (1)
where q is the local helix angle.
At the yarn surface
cos Q =1
/ +p2b2and sin Q =
pr(1')
where Q is the outside helix angle.
With the symbols as defined, the following relationship can
be established as shown by Gracie(Rll)between the number of
fibers and the yarn radius. Consider a cross-section of
the yarn perpendicular to the yarn axis; within an annulus
27rrdr the occupied area is 2krdr. If wf2 is the cross-sectional
area of a filament (perpendicular to its own axis) the cross-
sectional area of a filament inclined at an angle q (the
local helix angle) is if2 = f2/1 + p2r in view ofcos q
Equation (1). The number of filaments in the annulus is given
by the ratio of the occupied area divided by the cross-
I"
J1+�Zb�T-
1\ 14
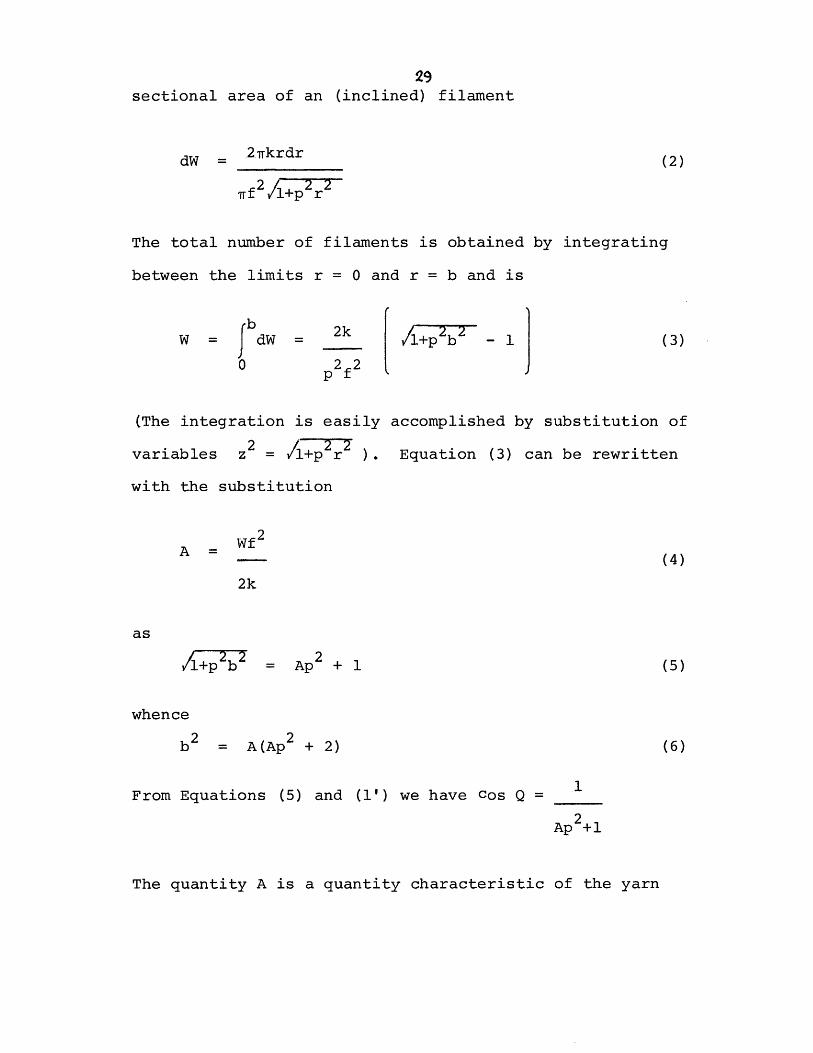
29
sectional area of an (inclined) filament
dW =27rkrdr
2 -+ 2 r2·fff l+p r
(2)
The total number of filaments is obtained by integrating
between the limits r = 0 and r = b and is
b
W = dW =
0
2k f 22
p2f2
- 1 (3)
(The integration is easily accomplished by substitution of
variables z = /l+p r ). Equation (3) can be rewritten
with the substitution
A =Wf2
(4)
2k
as
Ap2 + 1 (5)
whence
2 2b = A(Ap + 2) (6)
From Equations (5) and (1') we have cos Q =
Ap2+1
The quantity A is a quantity characteristic of the yarn

30structure. 2A is the cross-sectional area of the same yarn
with the same packing factor but with zero twist.
It is readily shown (by direct substitution) that the
radius r of the yarn that contains a specified fraction
(0<<1) of the total number of filaments W, is given by
/1 + p 2r2 = Ap 2 +1 (7)
For d = 1, r% = b. The cumulative fraction of filaments is
thus not linearly related to the yarn radius r (O<r<b).
(b) Yarn Contraction
When a bundle of filaments is twisted into a yarn, it con-
tracts lengthwise. This contraction, on twisting, has been
calculated by a number of workers(RlORll R12) For the
yarn model used here, which assumes the yarn to twist at
constant volume, the contracted length (i.e., the ratio of
the untwisted to the untwisted yarn length) can be cal-
culated as follows: in an inch of yarn an annulus at radius
r contains dW filaments, each of length l+p2r2 as described
in the previous section. The sum of the lengths of all the
filaments in the yarn cross-section divided by the total
number of filaments, gives the average filament length which
is the length of the.untwisted yarn. So the average filament
length is J dW/l+p2r2. The contracted length of the yarn, Lc
(often referred to as "contraction" in this work) is the

31ratio of lengths of contracted (twisted) to uncontracted
(untwisted) yarn, and is
L -= which after substitution (using
J dWl+p 2 r 2
W
Equation (2)) and integration (using z2=l+p2r2) gives(R10):
L = 2 2 (8)cAp2 +2 l+secQ
The above describes the geometry of the yarn. We now turn
briefly to describe some of the equations of yarn mechanics
that give rise to tension and torque.
V. YARN MECHANICS
(a) "Classical" Mechanics
1. Stress-Strain Curves of Yarns
The mechanical behaviour of continuous filament yarns in
tension has been extensively studied and reviewed(Rl). In
the simplest model, which was used here for the description
of the mechanical behavior of the yarn in the entrance zone,

32
the yarn tension is the sum (in the axial direction) of the
individual filament tensions which arise when the yarn is ex-
tended while the twist is assumed not to change sufficiently
to materially change the inclination of the filaments. In
this derivation, which has been found to give a good repre-
sentation of actual behavior for small strains (Rl), the
effects of lateral fiber pressure are neglected (hence the
change in packing density) as is neglected the effect of the
Poisson ratio contraction of the filaments (hence of the
yarn). The derivation is very simple and is as follows, with
reference to the sketch. The number of fibers in an annulus
2Trkrdrdr at distance r is dW =· _') ,/ -% -%
y
a
7T f4' l+p rz
from Equation (2). Call f the
stress on any fiber along the
fiber axis, the tension along the
fiber axis is t = rf2af. The ten-
fiber sion contribution along the yarn
axis axis is (cf. Eq. (1))
t = t cos q = t _ ff per fiber. (9)
/l+p2r2 /l+p2r2
So the incremental tension along the annulus is:
.2krdr Tr fl f2 fdT = dW'ta = 2r2 + ' (9)
Tr f, ' 1+ ,L:2r2

33
Further, from stress strain data on the filaments them-
selves
Cf = Eff (10)
where Ef of f are the filament Young's modulus and the
filament strain. Finally, from geometrical considera-
tions (R1 0):
2 y (11)
f Y l+p2r2
cy is the yarn strain and q the local helix angle. Replacing
these quantities into Equation (9') we obtain
rdrdT = 2rkE. (12)
Y kE(l+p2r2 )2
and integrating with the usual substition z2 = l+p2r2
between r = 0 and r = b, we finally obtain for the yarn
tension, also using Equation (5)
A(Ap2+2) A(Ap2+2)T = IT kEfy = TkE (F-l) (13)
Y (Ap2+1)2 (Ap2i) 2(
where F = ( y+1) is the extension ratio of the yarn.
Equation (13) corresponds to Equation (4.9) in (R10), and
gives the relationship between the tension developed in
the direction of the yarn axis, if we extend by y a yarn
twist p originally stress-free in all fibers.

34
2. Average Filament Strain
For a number of calculations to be discussed later, the con-
cept of the average filament strain is desirable. Of course,
one can define an infinity of averages, but two have been
found useful in this work, They are defined below and refer
to the yarn model under stress discussed in the preceding
section, that is where the yarn prior to application of the
stress is assumed to have been stress-free in all filaments.
Filament Strain Averaged Over the Yarn Cross-section
b
= 0 CfdW- _ - (14)f
W
Substitutions in terms of Equations (2) and (11) followed
by integration gives
£ = Y (15)f Ap 2 +1
Filament Strain Averaged Across the Yarn Radius
This is defined as
b
f = ttanl pb (16)Jo bdpbio dr
after substitution via Equation (11) and integration.

35
3. Yarn Torque
As various workers have shown CR13fR14) r:yarn torque arises
in continuous filament yarns from a variety of sources: the
filaments in such a yarn are both twisted and bent, and that
requires in turn (in the absence of setting) the existence
of torsional and bending moments on the filaments, which have
components in the axial yarn direction and hence, give rise
to yarn torque. Further, if a twisted yarn is extended, there
is. a tension component in each filament (situated at r from
the yarn center) perpendicular to the radius. These tension
components multiplied by r constitute also a twisting moment.
We shall briefly describe the method used in deriving the eq-
uations of these torque components as used in our particular
model.
Bending Moment Contribution to Yarn Torque
For beams in pure bending(R15 )
EI
MBE = (17)
where E is the Young's Modulus (assuming Hookean behavior
in tension and compression), I, the moment of inertia with
respect to the neutral axis and P is the radius of curvature.
The filaments are assumed to lie in helices in the yarn, and
from differential geometry of space curves (R16) we have

.1 . ain 1
p r r
36
(18)
in terms of quantities previously defined.
The bending moment per fiber at radial position r is thus
EI f p2 r2 .
r i+p2 r2
and the contribution of the bending moment to yarn torque
is given by its component inclined by 90-q to the yarn
(R13)axis
EI r p2 r2 /Maxial = M sin qr Il+pr2 (20)
per fiber, using Equation (1).
For an annulus containing dW fibers we have, dMBE=dW-Maxial
and the total contribution is the integral over the whole
cross-section:
b kEI p2b2BE = -axial 2 ln(l+p2b2) 2- (21)
0 pf2 (l+p2 b2)j
using conditions. C2) and (20). Substituting for the moment
i.f4of inertia I - , we get
4
kEf2 ( _ ' 2 22 IE'f22 Ap .(Ap+2)MBE - |ln +(l~p2b2) -i-- = 21n(Ap +1)- (22)
4p tl+p 2 b2 4p (Ap2+1)2
J7 ' .Wk 'using also Equations (5) and (6). This Equation corresponds
37
to Equation (10I in CR13).
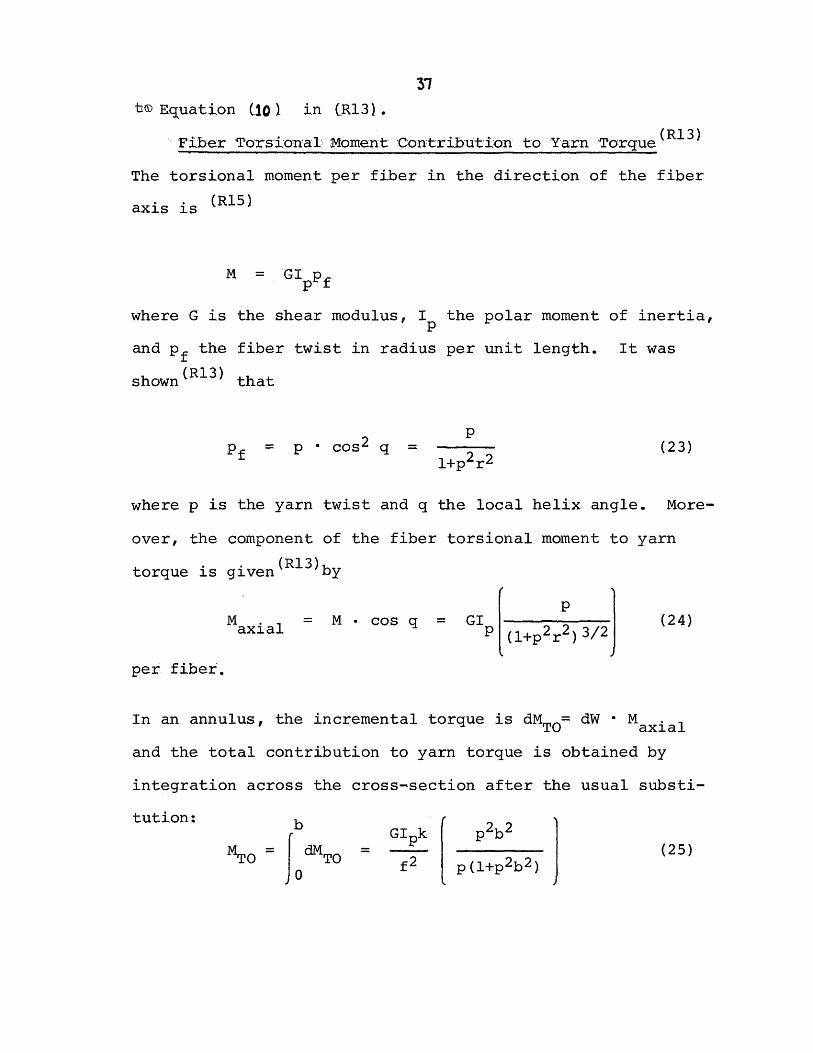
(R13)Fiber TorsionalI Moment Contribution to Yarn Torque
The torsional moment per fiber in the direction of the fiber
axis is (R15)
M = GIpPf
where G is the shear modulus, Ip the polar moment of inertia,
and pf the fiber twist in radius per unit length. It was
shown(R13) that
2 (~pPf = p cos2 q = (23)
l+p2 r2
where p is the yarn twist and q the local helix angle. More-
over, the component of the fiber torsional moment to yarn
torque is given(Rl3)by
pMaxial = M · cos q = GI (l+p2 r2 )3/2 (24)
per fiber.
In an annulus, the incremental torque is dMTo= dW · Maxia
and the total contribution to yarn torque is obtained by
integration across the cross-section after the usual substi-
tution: (
MTO · IGIpk I b
TO ~:TO f2 P (l+p2 b2)

3s 4
Substituting for the polar moment of Inertia I fP 2
we finally obtain, using Equations C5) and C6),
TGkf2 p22 IrGkf Ap 2 CAp2+2)
MTO= = (26)
2 pCl+p 2 b2 ) 2p (Ap2+1)2
Equation (26) corresponds to Equation (32) in (R13).
As will be discussed below, the value of G was not measured
directly. In this work for purposes of numerical computa-
E CR18)tion, it was taken to be G = 1-8)
Torque due to Yarn Tension 4
As was explained earlier, the components of filament tension
parallel to the yarn axis give rise to yarn tension; the
components of filament tension perpendicular to the yarn
axis give rise to fiber torque.
The derivation of the torque-tension or torque-strain curve
will now be given; it will follow the lines of the derivation
for yarn tension earlier described. In slightly different
form this derivation was originally given in (R14).
If af is the stress along the fiber axis, the tension per
filament is 7f2 af. The tension contribution in the direc-
tion perpendicular to the yarn axis is (using Equation (1)):
2 ...p.rtcirc= t sin q = 7f2f (27)
/l+p2r2
per filament. The corresponding torque contribution per

39
fiber is tcir r and the torque contribution of an annulus
of dW fibers is Cusing Equations (2.) and C27))
2wkrdr prdMTE = dW t r = · f r (27)TE d tcirc f 2 4+p·r2
irf2/l+pr 2 /+p r2
which, after the substitutions of af=EfCf (Equation (10)) and
Cf = i>, (Equation (11)) as for the case of derivation ofl+p2 r2
tension,integrates (with the substitution of variables
z2 = l+p2 r2 ) to
TkEf y Ap2 .(Ap 2 +2)MTE = 21n(Ap2+1) - (28)TE 3 (2 8)
~~~P ~(Ap 2+1)
If we express in terms of average filament strain, defined
by Equation (15), we obtain for the torque,
JrkE f ap 2 A2M 2 =f 2(Ap2+np2+1) in (Ap +2) (29)
MTE p3 Ap2 +1
Equation (29) corresponds to Equation ( ) in (R14).
From Equations (13) and (28) it is possible by simple sub-
stitution to derive an expression linking yarn tension to
yarn torque due to tension:
T 2(Ap2+l)21n(Ap2+1) 1 (30)
MTE P lAp2(Ap2+2)
which shows that the torque is directly dependent upon yarn
tension.
Restating the physical assumptions which served as a basis
for the derivation of Equations (13) and (30), the yarn is
assumed to be originally stress-free in all its filaments;
it is then extended by an amount Ey , and the stresses gener-

40ated in the filaments give rise to a tension (Equation (13))
and a torque Equatton C291).
(b) Tension and 'Torque for the Caise of Equal T:ensi:on
on all Filaments
The physical situation in the entrance zone in the false-
twister does not conform to the classical tension and.torque
model just described, which assumes the existence of an
already formed yarn, which is then extended, giving rise to
tension and to torque. Rather, in the case of false twisting,
an untwisted yarn enters a constant torque-constant field and
is twisted with free radial migration under the action of
these force fields.
Free radial migration means that a given filament does not
always occupy the same radial position in the yarn cross-
section, but is free to migrate radially from the yarn core
to periphery and vice versa, as the yarn is formed. Radial
migration serves to eliminate differential strains, that would
otherwise have been generated in the filaments, as the result
of differences in path length. The subject of migration is
extensively discussed in (R10).
For our purposes, therefore, a more realistic model for ten-
sion and torque is one where the filaments are under equal
tension and the derivation for this case is given below.

41
1, Tension; Stress-Strain Curve
If all the filaments are under the same stress, af (corres-
ponding to the same strain, Ef), then exactly as in the case
of yarn mechanics earlier described, the tension contribution
per fiber in the axial direction is
ta
(Equation (9))fl+p2 r 2
/1= p r
and the contribution to yarn tension in an annulus dr is
dW ta (Equation (9')), Integrating over the cross-section:
b b2krrdr
T = dW-t
n a n __2 /:V
2krcffln(Ap 2+l)
2P
p2r2
7Tf2a
f ,
l+p2r2
2kwEfefln (Ap2+1)
2P
b rdr
2k7ofl+p2 r20
(31)
using Equations (2) and (9). Note that in this case af is a
constant.
2. Torque
By a reasoning identical to that used in the derivation of the
torque in the classical mechanics description, we arrive at
the expression
= dW t circ
2Tkrdr
rff l+p 2 r 2
* f2a pr .* r (27)
/l+p2 r2
which upon integration (of is now a constant) gives:
dMTE
v -1 -- V L-T

42
p3 AP2 AP2+2) 2lnCAP2+1) (32)
with, of course of = Ef f.
As will be described later, this expression for the torque has
been used to calculate the torque due to tension in the en-
trance zone. Equations (31) and (32) can be combined showing
a direct relationship between tension and torque; both, of
course, are zero when f or f are zero.
It may be said at this point, in anticipation of what will
follow, that the values of torque calculated by this means
are about 10% higher than the values of torque calculated
using the "classical" expression (Equation (29)) at the
same average fiber strain.
(c) Overtwisting
In the cases of yarn mechanics analyzed so far, migration
was assumed to have taken place so as to equalize filament
tension. There are cases of course, where migration is impeded:
this is the case for instance, on uptwisting an already twisted
yarn(R10 R8) Since the situation during the false-twist
operation as the yarn moves to the heater zone is one of
uptwisting, it was necessary to study the yarn mechanics of
uptwisting without migration, or "overtwisting".
1. Overtwisting - Stress Strain Curve
The analysis of overtwisting was modelled as follows: A yarn

43
is assumed to have been twisted to twist level Pi; it is
then overtwisted (or uptwisted without migration) to twist
level P2 at constant radius, allowing no contraction to take
place, and then it is extended or compressed by an amount
F, (F = extension ratio) at constant volume. The amount of
overtwisting (uptwisting) is defined as c -P and the finalP2 P
twist is p3 = - . The problem is to determine the stressF
strain curve and the torque-strain curve of this yarn.
The major difference between this deformation mode and the
ones earlier described arises because on overtwisting in
the absence of migration, the outside filaments of necessity
must be extended and the inside filaments compressed, when
a system is overtwisted under little or no applied external
load. Thus the total tension across the yarn cross-section
may be zero (the tensile and compresive components cancel-
ling each other) but the torque due to these tension com-
ponents will not cancel out. Thus one could have a yarn under
no net tension which could still exhibit torque due to tension
components.
The derivation of the tension and torque relationships follows
the reasoning employed earlier. The important difference lies
in the relationship derived between the yarn strain or exten-
sion ratio, and the filament strain, (cf. Equation (11)).
Moreover, this derivation takes into account the twist change
brought about both by overtwisting and by the extension of

44the yarn (this latter was neglected in the simple derivation
of tension and torque earlier discussed).
To derive the desired expression, we imagine that we start
with a yarn of twist P1 which we uptwist at fixed length to
twist P2, and then we allow the length to vary so that the
twist becomes p3 at given extension ratio F. We consider a
yarn thus treated and focus on an annulus at r of thickness
dr; the contribution to yarn tension is
2krdr 2 Ef fdT = dW t = .f2 . (33)
f2 4+p4r2f ?r +prr2
using Equations (2), (9) and (10).
We must now relate cf to F the yarn extension ratio (F =l+ey),
and to do so we reason as follows: Identifying some fiber of
fractional order (percentile rank) , we have, for 1" of yarn
in the yarn before overtwisting, a fiber length
: +p2r2 : A2p2+1
where r is the yarn radius at which this filament is located
(Equation (7)).
Since the overtwisting to the imaginary state P2 is assumed
done at constant radius (hence at constant volume), the re-
lationship between the percentile rank of the filament and
the yarn radius has not changed although all the filaments
(save the central one) have been extended because their heli-

45cal path has lengthened. Now after extension of the yarn, the
same fiber of the same fractional order (percentile rank) ,
had a length
A' =A+1 /Al+p2r23 3 3
corresponding to 1" of the extended yarn; the filament length
corresponding to F inches of yarn in the extended state is
=r Fr = F(Afp +1) = F/o p2 r2
Therefore the extension ratio of a filament going from p1
through p2 to p3 is
- = 1+ Sf =
1
Now, since by definition is
F (Ap 3+l)(34)
Ap2+l
/ 2 l+p 2r 2-1 /l+p2r2-
Ap33
(7)
2Ap21
we have replacing it in Equation (34) and rearranging:
3 f F/l+p2r2f = 1 = 2 2
- + pr 2 ( +1
- 1 (35)
Replacing (35) in Equation (33) and integrating between
r=O and r=b, with the usual substitution, z = /l+p2r2 , we
obtain
F 21 21T = 2frkE F -iln(Ap2+l) - ln(Ap 2 +1)
f 2 1 2 3pl P3
(36)
K i- q

46
in terms of the final state of the yarn or, more explicitly
F 2 F 2 c: .P22kEf lnAp 1) --- in +
p 2 1 c2p 2 2Pl1
1I) (36')
in terms of the original state of the yarn, the amount of
P2 P3Fovertwisting, c = -P P , and the imposed extension
ratio, F.
An interesting consequence of Equation (35), is that if we
overtwist to p3, and then extend the yarn by an amount F such
that p3 becomes equal to the original twist (p3 = Pl), then
ef becomes simply equal to F - 1, i.e., the filaments are
all under the same strain and their strain is equal to the
yarn strain! Also, T = 0 in Equation (36) when F becomes
l ln(Ap 3+1)F =J P3 n (Ap2+1)P3 12,1
2. Torque in Overtwisted Yarns
The torque here is calculated as was done previously; we use
Equation (27) and Hooke's law (Equation (10)), and the value
of the strain in Hooke's law is given by Equation (35). We
thus have:
(37)
dME = 2irfkrdr 'ff2K F/l+p2r22Ekrdr -f
f2 f P-22 |P1i4 2/ r- i 2+1
1 3J P3
dW t
p3r-1 p · *r (38)
/l+p2 r2
sin q r
which is integrated from r = 0 to r = b with the substitution

47
z = +p2r2 to:
3
M I= 2kEl(H2-2HN+2N-1)+2N(H-l)+N2 in 2 -NlnH(39)TE P33 1-Nm 2 m H-N
with the abbreviations
2 2I~l _ F2 1 C 2 f11 m- = N 1 1- 2 -Ap +1 C2 m F1 3
Equations (36) and (39) can be combined indicating a direct
relationship between tension and torque; in this case however,
when T = 0, which occurs for the value of F given by (37),
MTE is non zero.
Restating the model on which Equations (36) and (39) are
based, it assumes a yarn of twist P1 stressless in all fila-
ments, which is first uptwisted to 2 at constant length and
constant volume, and then extended by F at constant volume so
that its twist changes to p3. During uptwisting migration
is not allowed. The equations for the resulting tension and
torque are given by (36) and (39).
3. Overtwisting from Zero Twist
A special case of the overtwisting model analyzed above is
when the yarn is assumed to be twisted without migration
starting from zero twist. This case is a simpler one to ana-
lyze as we can take as a starting point the case P1 = 0.
The stress-strain curve then simply becomes

4g
T = 2 kEIFA - (40)1]
where P2 is the twist to which the yarn is brought up from
zero prior to being deformed by F, and the torque equation
becomes:
2wkEr (Ap3 ) .F(Ap3 +3) Ap3 (Ap3 +2)2kEf 3 3 3 3
MTE = 3P 3 3 2
+ ln(Ap3+1) (41)
in terms of the yarn in the final state; to obtain the
curve in terms of actual overtwisting twist, P2, simply
P2replace p3 with P3 = '
F
4. Average Filament Strain on Overtwisting
The average filament strain across the yarn cross-section
in overtwisting, starting with a stress-free yarn of twist pi
is defined as
J b1= dW
~f = sf
Substituting
f= J0
and dW from (2) we nave
2krdr . 1
f2 W
This can be integrated with the usual substitutions to
-f =F -3 ln(mAp3+ 1) - 1m m2Ap32
(42)
_ _ t . _ v

49
The average extension ratio of the fibers is defined as
Af _ 1 + f (43)
5. Average Filament Strain on 2-Stage Over-
twisting in Various Zones of the Yarn
It is sometimes necessary to calculate the average filament
strain in annuli or concentric zones of the yarn cross-section;
this is so because in calculating the torques it is important
to associate the correct value of the modulus with the cor-
responding strain and it was found experimentally that the
stress-strain curves at high temperatures are strongly-
non-linear.
To calculate, then, the average strain we proceed as follows:
We define the zone of interest via the cumulative fraction
(percentile rank) of the filaments that correspond to it.
Thus, suppose we want to break down the yarn in n concentric
zones (of arbitrary magnitude). Suppose we are interested
in the zone contained between the i and the i+lcumulative
fraction of filaments; the difference
i, i+l - i+l - i (44)gives the proportion of the total population contained in that
zone. We can now define the strain in that zone as follows
using Equations (2) and (35), with
'f 2m
I P3)

Soi+l1i+l
-_ _ _ _ _ _
1 I" i~, m F X2r2 -
W.ii+l ,fi M/1fP3+
. 2.krdr-1 f2/l _p (45)
f2/+pr2-I 1+Pj3
which after integration, utilizing the relationships
z = l+p2r2 = Ap2+1, and ymz+l--=mAp2+1
i,'i+l - +I
2
F (m-l) lnmAP3 i+1+1
,i+2Ap2 mAp 2i + 1
6. Torque on Overtwisting in Various Zones
of the Yarn
To calculate the torque due to overtwisting in any given zone
of the yarn, we use again Equation (38), but, instead of in-
tegrating between r = 0 and r = b, we integrate between
=ri4 i /3i (iP3 +2 and
ri+l--A+ Ai+lp+2),
these limits being taken directly from Equation (7), and the
equation for torque in the. zone = +1 becomes
'27rkE [ -2 F-
2 2lni+lAP3+ 1 F (1-2m) + lnAi+lP3+1 F(Api+l (47)
m iAp2+1 m3 A 2 2ip+ i 33
(46)

Si
This equation was used to calculate the torque of the yarn
over the heater. When the substitutions ~i=O and i+l=l
are made, this equation reverts to Equation (39). The modulus
E, is the modulus corresponding to the strain ii+l given by
(46) for the case of strongly non-linear stress-strain curves.
VI. EXPERIMENTAL APPARATUS AND MATERIALS
(a) Apparatus
1. Texturing Machine
The texturing machine used in this study is fundamentally a
laboratory size machine operating at low spindle speeds,
typically 1000 rpm, (whereas industrial machines operate at
speeds of up to 500,000 rpm), but capable of operating under
a wide variety of machine conditions. The feed rolls and exit
rolls were taken from the front and back rolls of the MITEX
Drafting Force Analyzer(R17). The motors used for driving
the feed and exit rolls are hysteresis synchronous planetary
gear motors and are independently controlled. The motor out-
put is 18.75 rpm in both rotating directions which provides
yarn speeds of the order of an inch per second. Such pro-
cessing speeds were selected so as to make possible photographic
recording of the moving yarn using ordinary photographic eq-
uipment(R). In commercial machines the spindle rpm and the
yarn velocity are so high as to make observation of the
moving yarn impossible without the use of specialized high
(R6)speed photographic equipment

52
The spindle on the laboratory apparatus is a Leesona Hi-Speed
spindle which is driven by a direct current motor with a Variac
speed controller. A power transmission belt passes over the
hollow bore twist tube of the spindle to impart either S-twist
or Z-twist to the yarn in the twisting zone. The spindle
speed can be adjusted to give any twist level required. A
laboratory hot plate is used as heater for setting the twisted
yarn; it can be adjusted to any length corresponding to the
required residence time.
The overfeed is controlled by varying a gear set on the exit
rollers, and the range of overfeed and underfeed covers all
the possible range within which the false twister can oper-
ate. The length of the cold zone, heating zone, cooling
zone and the distance between the spindle and the exit rolls
can easily be adjusted. For ordinary operation the yarn
coming out of the exit rolls was aspired by a vacuum cleaner.
The yarn tension is measured by monitoring the deflection
of the feed roller assembly. The feed rolls and their motor
are mounted as an assembly on two pivots, about which the
yarn tension is transmitted to a cantilever of a force trans-
ducer. The deflection of the cantilever is measured by a
four-arm strain gage bridge input to a Sanborn Rectifier Am-
plifier/Indicator Model 311A. This device made it possible
to detect the yarn tension in the twisting zone without in-
troducing disturbances in the process as a result of con-
tact between the yarn and a tension measuring device. By

53
exchanging positions of the heater and the spindle and feeding
the yarn in the reverse direction the apparatus can be used
to measure yarn tension in the take-up side.
The tension measuring device has some serious limitations.
The mass of the motor roller head assembly is approximately
1 kg and though the strain gage arrangement was quite sensi-
tive, the readings obtained at low processing tensions were
poorly reproducible. For instance, the motors had to be
kept cool and this was done by wrapping around them a piece
of wet tissue paper: as the water evaporated when the motors
were heated, (a matter of 3-4 minutes), the tension reading
was affected. This necessitated great care in experimentation
and considerable duplication to arrive at meaningful values
of tension.
The twist distribution was measured by stopping the machine
while operating at steady-state, removing the yarn and un-
twisting it. Previous work on the machine by Dr. W.L. Yang(8)
had demonstrated that this gave a true distribution of the
twist as it exists during actual steady state operation. He
demonstrated this as follows: two multifilament yarns (Black
Dacron 70/34 and White Dacron 70/34) were fed together through
the machine. The machine was stopped and the twist was de-
termined in a number of locations on the threadline from
photographs taken through a low power microscope. The machine
was operated again under identical settings and now photo-
graphs were taken through the microscope (at exposures of

54
10 sec) at the same locations, while the yarn was running.
The twist was measured from the photographs and found to be
identical to that measured previously. The twist distribution
thus obtained was in agreement with that observed on commer-
cial machines R6) and with that observed by other workers
working with specially built lab equipment operating at low
(R7)speeds
A detailed scheme of the apparatus indicating the exact
dimensions of the various zone is gaven in Figure 3. Figure 4
shows photographs of the apparatus.
2. Torque Measuring Apparatus
This was composed of a steel wire (piano wire) of known
torsional rigidity (obtained from torsional pendulum experi-
ments). The wire was suspended vertically and the yarn whose
torque was to be measured was attached, through a special jaw
arrangement in series with the wire itself. A device at the
bottom part of the yarn prevented twist escape while permit-
ting vertical movement of the yarn to allow for contraction
(or lengthening). This same device permitted uptwisting or
detwisting the yarn under test. The torque was measured by
following the deflection of a mirror permanently attached to
the steel wire. A picture of the apparatus is shown in
Figure . This apparatus was contructed by Mr. Danny Lee of
the Fibers and Polymers Division.
3. 'Tensile Testing Machine
These were measured on a table model Instron Tensile Testing

Q.4 0 P4I 0
L In _ . a)* r- Ha * 4
- H 0-H
H 0 rd -rl 4-3) Cd W -H0 O a XZ E 4 (1
_ _ _, _, _
_r _ _ _ __ _
I
t'00
ai 8In-Gorreq
,--tI---
a 0,cr
_ _ _ . -_ _ __
O4j
C^
55
z0H0)
0HH
3:
0Un
H EH
U
E-
H
nU3q
i
I

56
FIGURE 4
THE FALSE-TWIST APPARATUS

57
FIGURE 5
THE TORQUE MEASURING APPARATUS
I
Ii II11 "
J I
I IUI
ii ,
t1o itI I a
0H'
iiI
I
.
i
I

Machine. Typical experimental conditions were 5" gage length
and 0.2" min crosshead speed.
(b) Material Properties
The yarns used in this study were supplied by the duPont Com-
pany and were all 150/34 Dacron yarns (150 total denier; 34
filaments). Dacron is duPont's trademark for its poly (ethy-
lene terephthalate) fiber. The yarns were identified as
High draw ratio, Medium draw ratio and Low draw ratio yarn,
but the actual draw ratios were not disclosed by the manu-
facturer. The Medium draw ratio yarn was chosen to perform
the majority of experiments on the false-twister (being the
yarn representative of commercial practice) while a few ex-
periments, confirming in nature, were performed on the High
and Low draw ratio yarns.
For purposes of this work, the important properties were the
mechanical properties of the yarns at room and at elevated
temperatures (i.e., at the temperatures of the heater). The
following measurements of mechanical properties were performed
on the Medium draw ratio yarn:
(1) The stress-strain properties of the untextured or
"feed" yarn were measured on the Instron Tensile Tester. The
Young's modulus (from the Hookean part of the curve) and se-
cant moduli at various strains were calculated. These quan-
tities are needed for the analysis and calculation of the
tension and torque in the entrance zone of the false-twister.
In this work the compressive modulus of the fiber was assumed

59
to be equal to the tensile modulus, hence equal to the bend-
ing modulus, The shear modulus G was taken equal to E(R18)12
(2) The feed yarn was processed through the false twister
with the heater on at various overfeeds, but was not threaded
around the spindle. The stress-strain curves of yarns thus
processed were determined on the Instron. The values of the
moduli were calculated and used, as will be explained later,
in the development of the theory for explaining the observed
tensions in the actual false-twisting process.
(3) The stress-strain properties of freshly textured
yarns were measured. The moduli were taken as representative
of the mechanical properties of the yarn in the exit zone
and were also used in the development of the theory explaining
the tension in the false twisting process.
(4) The feed yarn was processed through the false-
twister, with the heater on at various overfeeds, but was not
threaded around the spindle,exactly as in case (b) above.
The tension developed during processing (the so-called "con-
tractile stress") was measured and was used to derive the
stress-strain curves of the yarns at elevated temperatures
(the so-called "hot" stress-strain curves) which were used
in computing the tension and the torque of the yarns during
the process.
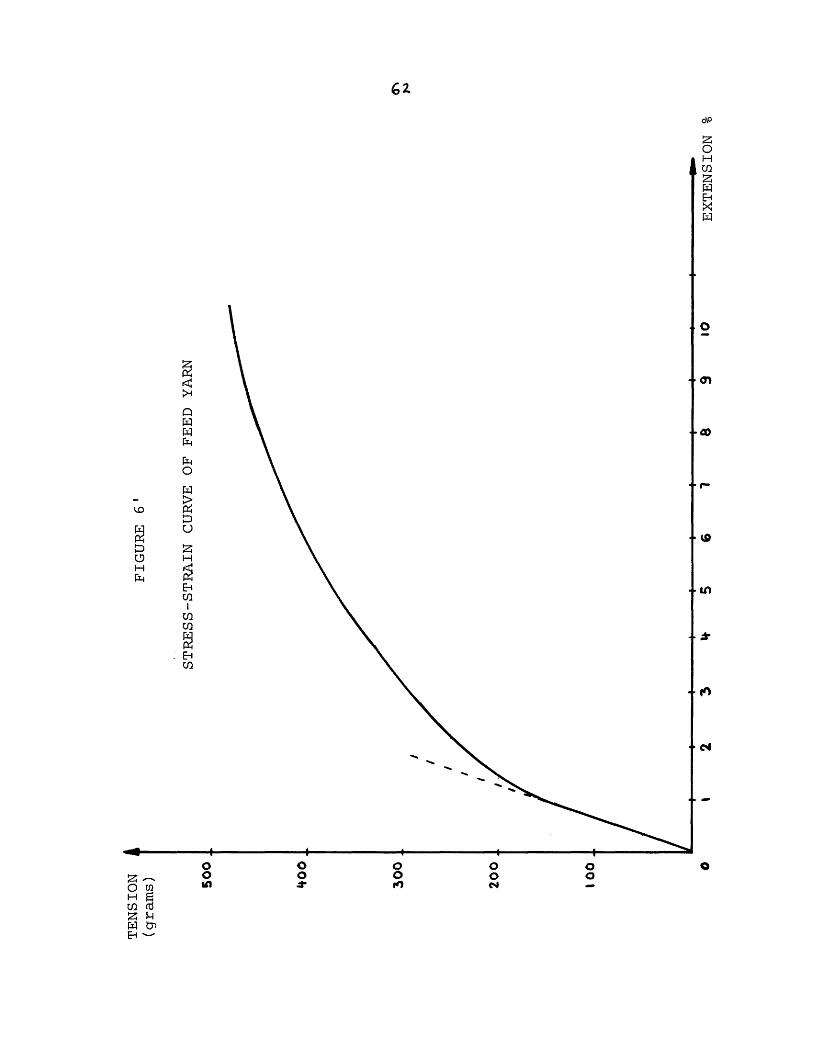
1. Stress-strain Curves of Feed Yarns
The Medium draw ratio yarn was tested on the Instron Tensile
Tester, (5" gage length, 0.2"/min cross-head speed). The
60
stress-strain curves thus obtained are shown in Figures 6
and 6'.
2. Stress-strain Curves of Yarns Processed
Thru the False-twister without Twist
As mentioned, the yarns were processed thru the false-twister
but were not threaded around the spindle; their mechanical
properties were determined on the Instron as above. The
Hookean moduli were calculated and are given in Table I.
Notice that in general,heating lowers the modulus of the
yarn even at the relatively low temperature of 134°C.
The modulus
drop is more significant the higher the overfeed and the
higher the temperature. One might have expected that pro-
cessing at -6.67% overfeed and at a high temperature would
have resulted in a higher modulus. Apparently the destruc-
tion of the molecular architecture (presumably orientation)
which occurs under the influence of temperature cannot be
remedied by additional extension at the levels used in these
experiments.
3. Stress-strain Behavior of Freshly Textured
Yarns
In the model used to predict the tension level developed
during false-twisting, and which will be described later,
it is necessary to know the modulus of the filaments in the
cooling and exit zone. To obtain these values measurements

61FIGURE 6
STRESS-STRAIN CURVE (partial) OF FEED YARN
TENSION (grams)
200
115
I 50
125
I00
75
50
25
0 0,. I EXTENSION %2
R
r4z
HH H
lU)
Z -
O U)H U) (o
P -
\0
0
01IU)E
O
.X
LA
OO 0 0 0 OO 0 0 0 0int K N

63
TABLE I
YOUNG'S MODULUS OF YARNS PROCESSED THROUGH THEFALSE-TWISTER (BUT NOT THREADED AROUND THE SPINDLE)
MODULUSGRAMS/UNIT £
GRAMSPER DEN PSI
FEED YARN: 150/34 DACRON* 6MEDIUM DRAW RATIO 16200 108 1.91, 106
PROCESSED AT:
1340C, +6.13% OVERFEED 11910 75.0 1.32 106
134 C, 0% OVERFEED 13850 92.3 1.63 106
134 C, -6.67% OVERFEED 15350 108.8 1.92 106
2100C, +6.13% OVERFEED 11790 74.2 1.31 106
2100°C, 0% OVERFEED 12650 84.3 1.49 106
2100°C, -6.67% OVERFEED 14410 102.2 1.81 106
* Limit of Hookean; behavior for feed yarn 0.72% or 115 grams

64
must be performed on textured yarn. There are two main
problems associated with measurements on textured yarn:
i) The filament modulus following heat-treating (con-
tact with the heater) changes with time, as morphological
changes (such as secondary recrystallization) go on for hours,
or even days, following heat treatment.
ii)The mechanical handling of the textured yarn is
very critical; the yarn comes through the spindle and up to
the exit rolls under tension in the untwisted configuration.
Beyond the exit rolls, depending on the level of tension, the
yarn may retract (crimp may develop),and once this has
happened, it becomes impossible to measure the moduli of the
filaments because entanglements between fibers develop which
are practically irreversible. In this case it is necessary,
in order to remove the crimp, to apply forces which may be
much higher than the forces to which the yarn was subjected
while in the machine; this in turn may affect permanently
the filaments (if the required stresses are in the non-Hookean
region) so that a measurement of the modulus of interest may
not be possible. It is thus important to measure the yarn
properties on the yarn which has emerged from the exit rolls
but which has not been allowed to contract so that the crimp
has not been allowed to develop.
This was accomplished by collecting the yarn that exits the
false-twister on a long ruler under 40 g tension and glueing
its ends onto the ruler. Sections of the yarn were then
mounted on a cardboard strip, and the ends of a given section

65
were glued onto the strip always under the same tension; each
section was approximately 7" long. The cardboard strip
was then securely mounted on the Instron at 5" jaw separation
at which point the cardboard was cut across: a tension between
30 and 40 grams would register in the machine. The machine
was then started and the stress-strain curve determined. The
initial part of the curve was always found to be in the
Hookean region and it was an easy matter to extrapolate to
zero stress and back calculate the true gage length. In the
course of these experiments the test was not allowed to pro-
ceed to the break but was stopped at given stress levels
(100 grams) and the machine was reversed.
If, upon reversing, the machine was stopped at load levels of
20 to 30 grams, where crimp was not allowed to develop, then
on reapplying the stress essentially the same value of the
modulus (within +5%) was obtained. If, however, the jaws
were allowed to come close enough for crimp to develop, then
the "modulus" obtained by extrapolating the straight part
of the curve, after the crimp had been removed, was substan-
tially lower than the value of the original modulus. Repeated
cycling thereafter between 20 and 100 grams resulted in a
progressive increase of the modulus, (note that by cycling
at 20 grams, the yarn was not allowed to retract again) which
approached the value obtained in the very first test; thus
something like a progressive "combing" and disentanglement
of the filaments occured during this sequence of cycling.
The results are shown in Table II, and Figures·7 and' 8

H - o * o o
w ao -oo
H H o o o o oU C)O N D O O ODr Ho o cD NC n -- o- co c N
N H- C C0 O O> C ' OOH - L U U U o L
L O * Ln
dp H cc ) o C C * C C) C)
, H LA N o on--I L
- ~O O O : O O ON N tN C) H
:>H C) CD C) CC) N L - N LA - N
r-H C)N OD
rJ2 H _ C) * * O
H M~o .0
H +Cl) - H CD C) C) C) * )
M ON M r-. co
dP N C) U C)H c - -< >e- , o o o '
' i
H e
- H -C C O OW U C) L C) O U o0 ro HN * N
O O N H O H *N
H ~ ~ .~ .l c~ b-4 H
3O0C:)
0 r,>>4
>4 U >
HHE,
H OZO
O4 V
M C
C o o o o k o o o o ff O o o o o o o o o
k r r- r r- 1 - 1 r t k oD o O o 4- 0 0 0 0 o O O O O 0 X c c 4cJ 4c r- 4 4 4c 4J c o ~a,) ~ ~ ~ o OE o o o o O o o o O 4N E-
N N N 4 N N N N Ns- _ _ _ .. - ... .- 0c0 HO I '
a0 o Eq laXa o4) a
o U U U U X U U U U U ) X
X H N C H SN ( ts' L ) Pi

NCD
0C
67o\o
z
uQ ..o NHC-4
E-IxE-
o
r-rdHC)-Prd
04
U
U)
E-iU)
Z -0 UH U)CdZ rE -
o\o
H
o\o
Di.
r.HlPH
0
OUOC)
oN
U)
rdE
O O
- -X00V) A
O C-r >) ,HOXrd 0
4 rO
o o O O O0 _ _ -o
0

o\o
Z0
00
r-
\o0
r-
+1
UrPL
W
0H
U)
H
UI
mE-1
o\o
ra'I'
U)
0
o0 0 0 0 00 %~N 0 4.
O U) -H Z k
v
uB
Go

Comparison of the moduli given in Table II with those of
the yarns that had been processed without twist through the
false-twister (Table I) shows that the textured yarn moduli
are considerably lower; as will be discussed later, for a
given set of texturing conditions (temperature, overfeed)
the tension will be lower the higher the twist; the yarns that
are processed under zero twist are therefore processed under
the higher tension
4. Stress-strain of Yarns at Elevated
Temperatures - The Contractile Stress
For purposes of calculating the tension and the torque of the
yarn in the heater zone, the mechanical properties of the
yarn at elevated temperatures must be known. This is a dif-
ficult problem because (a) at elevated temperatures the
viscoelastic character of the filaments becomes pronounced
and the experimental timescale will greatly affect the results
and (b) the filaments shrink at elevated temperatures so
that the reference state of the yarn (the equilibrium unstres-
sed denier) is different at each temperature.
For these reasons it was decided to determine the stress-
strain curves of the yarns at elevated temperatures, using
data obtained on the false-twister itself (which would auto-
matically give the right experimental timescale); this was
accomplished by running the yarn through the machine but
without threading it around the spindle. At a given temper-
ature, the yarn was run at progressively increasing overfeeds

70and the tension developed at each overfeed (the. "Contrac-
tile stress"~ was monitored and recorded, The tension, of
course, decreased with overfeed, and at some value of the
overfeed the tension developed was zero. The denier of
the (shrunk) yarn, calculated on the basis of the equation
of continuity, which gave rise to zero tension,was taken as
the equilibrium unstressed denier at that temperature, de
The tensions developed at lower overfeeds corresponded to an
extension of the yarn from the equilibrium denier; by asso-
ciating the tensions to the corresponding extensions, the
stress-strain curves were constructed.
With reference to the
appended sketch,which
shows diagramatically
the arrangement of theI I I
i' V3 false-twister for these
di d3 experiments, V and
di are the velocity and denier of the feed yarn while V3
and d3 are the velocity and denier of the yarn exiting the
machine. Note that the spindle has been omitted in the
sketch since the yarn was not threaded around it (just as
was the case for the experiments earlier described under
heading (b) (2)).
Two assumptions are made which are subsequently verified
experimentally: (a) The denier changes on heating, i.e.,
going from zone 1 to zone 2, but does not change as the yarn

Iimoves from zone 2 to zone 3 the cooling zone; (b) the tension
developed does not depend on the length of the heater, as
long as thermal equilibrium was attained. Remembering that
in our experiments the controllable variables are the heater
temperature and the overfeed i -V3 and that V was the
quantity that was varied, Vi having been kept constant for
all the experiments performed in this thesis, we have from
the equation of continuity that
Vi di = V3d3 (48)
or
d3 = d 1 (48')~V3 i
For any given value of V /V3, a tension is registered by
the tension measuring device (earlier described) and recorded;
to that value of V /V3 there corresponds also a denier
given by Equation (48'). At some value of Vi /V3, say
Vi
V3 e
the tension registered is zero; the denier de corresponding
to that value of overfeed via (48'),
V.,
e V 3 e
is the equilibrium unstressed denier for the particular
heater temperature at which the experiments were performed.

12In all cases where tension was registered (i.e., at over-
.vifeeds lower than V- ) the corresponding denier d3 is the
strained denier of a yarn whose equilibrium (unstrained)
denier is de. So de and any d3 are related by
de = d3(1+) (49)
hence d
=1 (49')d3
The strains thus determined, with the corresponding tensions,
were used to construct the stress-strain curves. These
results are presented in Table III and Figure 9. Concerning
the graph, note that at each temperature the starting denier
is different, but that the yarn deniers corresponding to the
same overfeed are nessarily equal. The stress-strain curves
themselves are strongly non-linear; their non-linearity
(concavity towards the y-axis) increases with temperature.
This behavior is reminiscent of rubber, and, of course, the
materials become more "rubbery" as the temperature is increased.
Experimental Test of Hypothesis that denhot=dencooling
To check the hypothesis marks were made along the yarn
prior to its passing through the machine. (The marks were
actually two knots made about one inch apart). The length
of these marks was measured with a ruler while they were in
the entrance zone, the hot zone, and the cooling zone.
The relative length. changes are presented in Table IV.

73
s tnN L
r I I r I
H N
o m H oo N -
. 4 4~;cu
, -
0
H4
I I n
I I I r,
I I o0 II I
I I cn I I oo 0
a \o
I O I o0 HCO HID
I I I I I C I 0 I N I I.0
N or H dHl H
I I
I I
I I I '. Ln
0 HH
I ,-!1C Co
0 a I cc Nm LA 'O O O
O q I w (-1O C4 C~
I '1v I 0 I m , I em N 0 Cm N(N N M M H
0 0 cc 00Ln LA I'D
I 0" In
(N n LA Irs n tn v
I O O 0D H-COc 'I c
I . . .
I 0 I ( I I I I I I
LO ID mo IH H( ID I 0 ccH 1-4 C1.4. 1d'
I (N I LA I N I V I coLA c H T IDI I I I I C
Ln '0 0 *
I I N0C.
I I r-.
II I 0 0 Nm D 0. o HH H H (N (N
I ,* I 00 I 0 -T Nr- .~ . .~ :
>~~~~- o A v W>
0 I m ,H N I I 0 I L l u P
_I 0 0 N Cn I000 0 - H -1 -
I 'D cm m
(IN - m
Co 0 L 0DN Ln
I 0)L 0m N
. . . .
I -W co co
0 Ln 0oCo LA co
I N LA co 0N 0 C LA
. . . .
0 I I L c I I I
O H '4' ' 0 4 ' 0 ' C;0 w .- ·H H N C NOC "
.4 -4
0 I r N I '4' I I I I a) 0 0 (NA Co A m A o N
~~~~~~~~~~~~~~~~1~
0 I a) I
C( . L dm
I I I I 0
o c N fh H
0 co I I I I 0 c 00 L C 0 N0 00 H H
0 W I I I
(N C c m NrP(N 0i r
,-4 4n
I 0 c cc N LA ID0 H ' r oO 0 0 0 0
. . . . .
I 0
(N N H
o c C O ' C N '.0 'C OH ' H C '00C C N 0 .0 c a9 '.0C 0 C (, H '. 0y Co O 0 LA '4 H NO oN (N NO cc ao o
(N O N LA ( C '0 L ' M C ( *H oA c0 .0 : 'r C ( H (N LA 'O- m (N N N N H H H H H H H | I I
U)LnZ
LcoN(N
'U-G -El
W0C,HV(N
HHH
w
t1c
U0
E-
9
4
U)
HE-z
U
U)CZ
UEnmw
zH¢2:HU)En
F4K
U
I
W
wl
0n ;
C -E'-
UJ
'i4H-
M _r.rE-
Cow-4
cn _
a'4
Co EHW.
MC-
E
LAW
HH C')
--
E
n kW0
U)c
U -
cx4wWW
0 dP
03·
__
-
_ - -- ._
I
I
I I
I I O O " - "

14
FIGURE 9
STRESS-STRAIN CURVES AT ELEVATED TEMPERiTURZ'S
(eo;ov%( crovo%
180
110
160
30
IO
110
100
go
80
1070
60
so40
30
I0
0
I .5
134.5
1"3
191S
110
j 6.1 - - 5c6.61 1. overfecd -7 t
I 0 20 30 o0 So Co
-
10f~xtcnso CY-)·
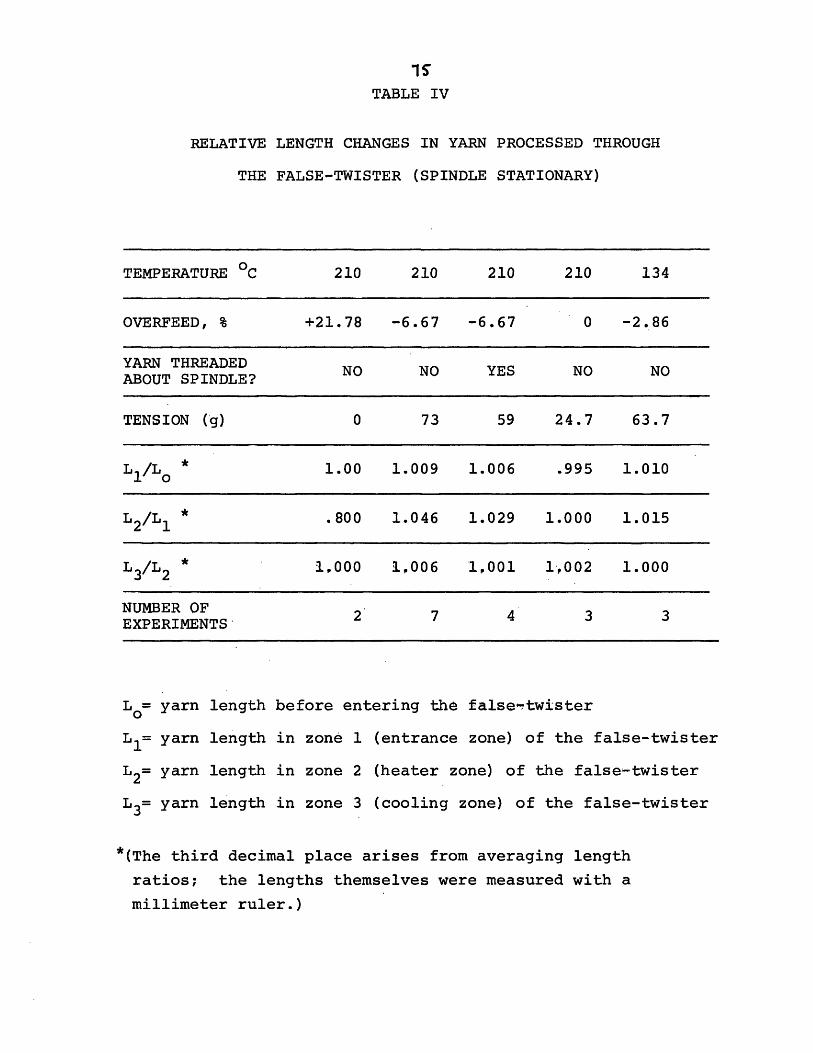
15TABLE IV
RELATIVE LENGTH CHANGES IN YARN PROCESSED THROUGH
THE FALSE-TWISTER (SPINDLE STATIONARY)
TEMPERATURE °C 210 210 210 210 134
OVERFEED, % +21.78 -6.67 -6.67 0 -2.86
YARN THREADEDABOUT SPINDLE? NO NO YES NO NOABOUT SPINDLE?
TENSION (g) 0 73 59 24.7 63.7
L /Lo* 1.00 1.009 1.006 .995 1.010
L2/L1 * .800 1.046 1.029 1.000 1.015
L /L * 1,000 1,006 1,001 1,002 1.0003 2
NUMBER OF2EXPERIMENT 7 4 3 3EXPERIMENTS'
Lo= yarn length before entering the false-twister
L1= yarn length in zone 1 (entrance zone) of the false-twister
L2= yarn length in zone 2 (heater zone) of the false-twister
L3= yarn length in zone 3 (cooling zone) of the false-twister
*(The third decimal place arises from averaging length
ratios; the lengths themselves were measured with a
millimeter ruler.)

16
Experimental Verification of the Hypothesis that
Tension is Indeedpendent 'of Heater Length
Experimentally, at
2100 C and 0% overfeed, the tension was 24.55 g at 25 mm
heater length, and 24.95 at 50 mm heater length. At 210°C
and -6.67% overfeed the tension was 77.3 g at 24 mm heater
length and 79.80 at 42 mm heater length.
It appears thus that both hypotheses are valid.
VI. EXPERIMENTAL RESULTS: TWIST AND TENSION
(a) Introduction
In what follows will be presented the results of the experi-
ments performed on the false-twister with the objective
of measuring twist distribution and tension. These experi-
ments were performed with two objectives in mind:
(a) The first was to acquire experience and a feel for the
behavior of the machine and the interaction with the thread-
line,so as to provide necessary insight for construction
of a model representing the process.
(b) The second objective was, of course, to have experimental
results and data against which to compare the predictions of
the model in order to assess whether the model completely
represents reality.
For these reasons the experimental conditions chosen to carry

17
out the false-twist experiments were extremely broad, spanning
a range. very much broader indeed than are encountered in in-
dustrial practice. To give an example, typical machine con-
ditions for processing 150 denier polyester yarns are 220 -
230°C heater temperature, 60 turns per inch twist at the
spindle, and overfeeds of the order of 1-2%. Our experiments
were conducted at temperatures ranging from 1340 C to 245°C.
The overfeeds used were varied from -6% to +6%, and the twist
was varied from 40 to 60 turns basic twist, which corres-
ponds to actual twist at the spindle from 46 to 84 turns per
inch. Also, although most experiments were performed with
Medium Draw Ratio yarn (as identified by the manufacturer),
a number of experiments were performed with the so-called
High Draw Ratio yarn (which exhibits higher shrinkage on
heating or, equivalently exhibits higher contractile stresses
when heated at constant length); the Medium Draw Ratio yarn
is typical of commercial practice.
The quantities measured experimentally as the processing
conditions above were varied were the twist distribution,
the twist contraction, the tension and the torque. At least
five experiments were performed in each condition tested
(sometimes more). The experiments where torque measurements
were carried out, were performed more than a year after the
experiments where tension and twist were measured, random
checks during the processing of the former showed good agree-
ment (within the rather serious accuracy limitation imposed
by the tension measuring device) with results obtained in

78
the earlier set of experiments,
(b) Experimental Procedure
Before starting the texturing experiments, components of
the machine were tested and calibrated as follows:
The heater was brought up to temperature and checked. To
check the heater temperature, substances of known melting
point were sprinkled on the heater (at a point in the path
of the yarn). Such substances are normally used for the
calibration of hot stage microscopes. A thermocouple (attached
to a potentiometer recorder) had been attached on the heater
approximately 1" away from the path of the yarn. When the
crystals melted indicating that the right temperature had
been achieved, a reading was made of the voltage at the ther-
mocouple and thereafter (usually for no more than 24 hours)
the heater setting was maintained at that voltage reading.
The accuracy of this reading was checked using these sub-
stances at least once daily (more often if the settings were
changed in the course of a given day).
This was done because the heater was a simple laboratory hot
plate and was not equipped with any controlling device that
would maintain constant temperature; it was found that as
line voltage fluctuated, temperature changes of 10-15°C
would easily occur at the same Variac settings, hence the
necessity for careful monitoring.

79
The tension device was calibrated next, A stand on which a
light pulley was mounted was interposed between the feed
rolls and the spindle; the pulley was exactly at the same
level as the feed rolls. Yarn from the feed rolls was passed
over the pulley and various weights were suspended at its
free end. (See sketch) The Feed rolls were then rotated so
as to let the weight descend;
the rotation direction was then
reversed. The potentiometer
readings for the two cases were
recorded and the average reading
was used as calibration against
the weight. This calibration
also had to be performed daily
as the apparatus showed considerable drift.
The spindle speed itself was adjusted at each experimental
condition with the use of a Strobotac, and continuously mon-
itored stroboscopically for the duration of a test.
For operation, the machine was started with the yarn slack
(so as to take into account the contraction) and as the
yarn twisted, it was positioned over the heater. The tension
variation was followed in the potentiomenter; it increased
as the yarn contracted on twisting, and then decreased to a
stable level, the stabilization requiring 2-3 minutes. Even
when stabilized, the tension continuously fluctuated about
a mean value and as many as 30 random readings of the potentio-

meter indicator were made to arrive at the mean; the mean
as well as the range of variation observed are given in the
tables with the experimental false-twist data. In spite
of all precautions, the reproducibility of tension experiments
otherwise identical, but performed weeks apart, remained un-
satisfactory, especially at high values of overfeed which
corresponded to very low tensions. Part of the problem
is that the roller-strain gage arrangement was not built
for accurately recording low tensions, and the potentiometer
needle often did not return to zero when the machine was
stopped and the tension released.
When the spindle rpm had been carefully adjusted and the
tension stabilized as indicated above, the machine was allow-
ed to run for about 5 minutes and then stopped, and the yarn
was removed in order to measure its twist distribution, con-
traction, and, in later experiments, torque. The machine
was stopped (both roller and spindle were stopped simultan-
eously) and the yarn was collected on an 18" long steel ruler
equipped with alligator clips at its ends (the jaws of which
were rubber lined).
The threadline was then cut beyond the edges of the ruler
and the ruler with the yarn deposited on a table. Marks 5"
apart had been traced on the ruler near each end so that a
5" interval bracketed yarn in the cold zone while another
5" interval bracketed yarn in the cooling zone. Both zones
were at least 2" away from the ends of the heater zone;

red marks were made on the yarn at the edges of the 5"
intervals.
For purposes of twist measurement, the yarn was then clamped
with miniature clamps (one inch beyond the 5" gage length).
It was then cut from the ruler, and, making sure that no
twist escaped, it was mounted on the jaws of a twist meter
set 5" apart, and untwisted under a tension of about
0.5 g/denier. The twist meter itself was mounted vertically
so that the yarn would elongate as it untwisted without
frictional constraints; a ruler mounted on the twist meter
next to the yarn permitted measurement of length at the
0.1 inch level.
Torque measurements were performed as follows: With the yarn
mounted on the ruler as removed from the machine, a thin
strip of cardboard was slipped between the yarn and the ruler.
The edges of the yarn just beyond, but contiguous with,
the 5" gage marks were sandwiched and glued onto the cardboard
using Eastman 910 contact cement. This gave a rigid bond
which allowed no twist escape. The 5" specimens were then
cut from the ruler and carefully mounted on the demountable
jaws of the torque measuring device. The assembly was mounted
on the machine; a weight was suspended on the lower jaw (cor-
responding to the tension measured during false-twist pro-
cessing) and the torque measured by following the deflection
of the mirror on the steel (piano) wire onto which the yarn
was attached in series (see description of experimental ap-

paratus). In some experiments additional weights were hung,
or weights removed, and the variation of torque with tension
recorded.
(c) Experimental Results: The Effects of Temperature
and Overfeed
The data collected are presented in Table V. The table
classifies the results first according to heater tempera-
ture. Within each temperature classification the data are
further broken down according to overfeed. For each experi-
ment are then reported the spindle rpm, the theoretical
machine basic twist (the ratio of the rpm to exit roller linear
velocity), the actual twist, and the basic twist as measured
on the twistmeter, as well as the contracted length (the
twists' ratio) for both the entrance and the exit zone.
Further, the ratio of the measured basic twist to that cal-
culated (theoretically imposed by the machine) has also been
computed. The following observations are pertinent to the
data which are also presented in Figures 10-13.
1. Twist in the Exit Zone
(i) There is good agreement between the theoretical
machine-imposed basic twist and the measured basic twist.
While there is some systematic variation within each group,
the variation over the whole range of overfeeds and the whole
range of temperatures is only 8%. The fundamental hypothesis
(that the false-twist machine inserts a constant basic twist)
is a correct one. The systematic variation within each can

MIO I
I I I I I II 1 1
uL n n )I I I I I ,1- I 4
MOD-I II
1 CD
m r> oa
0-c--.-4 m LA
I Mn r, I I
i 1* C CO
O DMN.0s o
LI N I ( 0
l (N L
i c,4 q. nLIIIII~lrlO~V
D LAA M %O m D W
III I-4 H -4'A,-4r
U0 O O) N.-IO.
I I I -4. I -4. -4 - 4 -I.I 4
0
I cNA ,B I
r- 11
00 N l
I I
0aOO D (N M w
-4 0 0 ( N 0N LN0 N l r ' OD v eh s
. . . . . . . .L. . . . .. . . . . .
... m· ... I(. . . (. ... .L.. .vvv InV M C m W Q mmm mm mmm
l'00 -4 N rl '
1-4 4 en lw
IVr- v N 4 em o1 (o
0l NW Er El '!
N m n m m
In O H m r 0 CV V D - r- ol s" In O r- CV M r- OD N nOmLA NO mOr' O -INn NL El' m m cm N - 4. 00.-I MO (N~lLDN OLW'O O.-ICmml NO,-4(N
I o
(oDI I I I I W'ElLA I I I I I I I I I I
L-io u mo(N
r-lALA -4(N(N
N LbD NLAO I
10 0ir- OD· · .
· . .ob oOr D uL
I I I I I rI-4. I I I II I11
N D W O O N IV O D000 0 N W ODL 0 L ) D L N OD Ol I 000 00 N
D1oLDL o lo- lo DrlDl C Drla~o o a0 ooo
-4 e 0N n - m a N In N D L( N DNLm o l CY, Nq -4 0 0N L W -4rN N O rN rNOO N 00 r OD N N O O 0
. . . . . . . . . . . . . . .
ON 0S (Ni (N 0
M000O CO D
' .l E0 e ess
(N 000 LA
LA LAM (N (NwD D D wD w
l El uL oe (N
DL 000-4' L . LA Lev n on on n
MM .- 4LD b ID
E U DLo0p} LA LA· rgoV
.ID Lb Lb Lb L
Lb a Lb N A
L DL o 00-4or sr u r l
000 000 oo oo000o oooo o oLn LALn L ALUn Ln L Ln OL L ) n n LA Ln ALo L
000co
-D -4-I -
+ I
UOrl
ooo0 0
o
Uo
-4
00000
m -O D
+ II
U
-4
-4
ooo
M D
LD O D+ I
Uoo-4
00000
00--4I-4
MO oN
.-40 L .LD El o L o+ II
UoaoN(N
L LA N 0-4
L L LA N N
w w L Ln
V N N Lb 0
o00-4 + II
H
0 wz o oH
Z Z o
z
H
lil
U- u(
EH
OH
E- H
Un I, ) 3cE- CO Ed
NE
:w
> UH
.4 U) z(AZm dr4
E-- dP E--
LA1 5
WzON
zHZ
8u
w
3viH- :0- E EL
H m
E4UE-'4'E-0T
OHH) U) ~
E- HUmv
4 Z.H N
On x mH
Em E i
0r.N
4-Io04
0-4mr.04-I
-,IEl
cl00014
4-Ia
ElEl140
InIaEl0x
-.4
aZ-4:E144a
. l
00
a
04
0 r
El 0
* La
IIaX w
N
E.

g4
be explained by considering that the measurement of the
(basic) twist was performed under a stress of 0.5 g/denier
or 75 grams; the yarn , however, was processed under var-
iable tension, the tension in the exit zone being roughly
twice that of the cooling zone (because of the tension jump
across the pin). The theoretical machine twist, TM, and the
measured basic twist, TB, should agree when the tension
used to untwist the yarn is approximately the same as the
tension in the exit zone: this should be so when the process-
ing tension is in the range of 25-40 grams; reference to
the table shows that TB and TM are in good agreement in this
case. When the tension under which the twist was measured
is higher than the processing tension, then the yarn was
extended (relative to its state of strain in the exit zone)
on measuring the twist, and the measured basic twist is thus
lower than it was on the machine; the opposite is true for
high processing tensions. Reference to Table V shows the
data to be in agreement with the argument above.
(ii) The actual twist at the spindle is also roughly
constant, varying between 60 and 65 tpi for the whole range
of experiments. Within a given temperature group the twist
decreases somewhat as overfeed decreases: this decrease
is of the order of 3.5% and is no doubt due to the tension
which elongates the yarn in the hot zone. Another way of
looking at the data is to consider the contracted length
or TB/TA . The contracted length increases as overfeed de-

creases and this must be a manifestation of tension which
extends the yarn in the heater zone. See F'gures lO,ll,and 12.
2. Twist in the Entrance Zone
The situation here is quite different from that in the
cooling zone.
(i) Within a given temperature group the twist varia-
tion is quite pronounced, this being true of both the basic
and the actual twist, the higher the underfeed, the higher
the twist. (Figure 11)
(ii) The contracted lengths increase with tension and
twist in contra-distinction to the results observed in the
exit zone. No doubt this is because the contracted lengths
in the entrance zone are less sensitive to tension than is
the case in the heater zone (the yarn being much more defor-
mable in the heater zone than in the entrance), and so the
contraction increases with twist as predicted by yarn geometry.
Also, of course, higher twist and higher tensions imply
higher torques. (Figure 121
(iii)The twist level distinctly decreases as the temper-
ature is increased. CFigure 101
3, Tension
Ci) The tension within a given group varies with over-
feed: the lower the overfeed the higher the tension.
(ii) In -general, tension drops as temperature increases,
especially at low overfeeds- CFtgure 13'. The. prediction of
tension

86FIGURE 10
TWIST IN THE ENTRANCE AND COOLING ZONES
L AS A FUNCTION OF TEMPERATURE AND OVERFEED
(50 tpi basic)
BASICTWIST(tpi)
COOLING ZONE0 &. A__-A, £
I
2 Tension ENTRANCE ZONE0
0 4~t Tens~~~~~~~~~~~~~ ion
%
+ +6.13%
o 0%
a -6.67%
TEMPERATURE C! I I ! I I I .
160 170 180 190 200 210 220 230 240 250
80
10
60
50
40
30
20
I0
l
120 130 140 50

FIGURE
FIGURE 11
BASICTWIST
TWIST VARIATION WITH OVERFEED
AT 1910C (+), 2280 C (0) and 2450 C (A)
(50 tpi basic)
(tpi)
COOLING ZONE.-O ---- 2 0)
4 ENTRANCE ZONE
I 0
oI a
| I | , | | , , , 0
OVERFEED %
so
80
70
SO .
40O
30,
20,
10
+ 4
-6 5 -4 3 -2 -I 0 1 2 3 4 5 6

8
FIGURE 12
RELATIVE CONTRACTED LENGTH VARIATION WITH OVERFEED
AT 1630 C (A), 1910 C (+) AND 228 C (o)
(50 tpi basic)
RELATIVECONTRACTEDLENGTH
ENTRANCE ZONEa0 _ _ _ _a o~~~~ 0- - 2 - lk
COOLING ZONEIt
OVERFEED %
-6 -5 -4 -3 -2 -I 0 2 3 4 5 6
1.00
0.9
0.8
0.7,
0.6
0.5
I

FIGURE 13
TENSION vs. TEMPERATURE AT VARIOUS OVERFEEDS
(50 tpi basic)
-6.67%
0*1
0%
If I
I+6.13%
t .
120 130 1 40 150 160 110 180 190 200 210 220 230 240 250
TENS.(g)
80
70
60
50
40
30
20
IO
f fTEMPERATURE C
. . , <~~~~~
r
I\
I~mmm .
90
will be analyzed in detail in a later section.
4. Denier
Values of yarn denier before and after texturing are re-
ported. These values were obtained by weighing the untwisted
entrance zone and exit zone specimens which had been used for
the measurement of twist; the values of untwisted length
were also used in the calculation of basic twist. All spe-
cimens were measured under a weight of 75 grams corresponding
approximately to 0.5 g/denier. The deniers as reported have
not been corrected for the extension of the filaments under
the 0.5 g/den load. The correction in the entrance zone
would be of the order of 0.5% and in the exit zone of the
order of 0.8%* The results show that the yarn denier follows
rather well the values predicted by overfeed and the contin-
uity equation.
5. Analysis of the Data and Implications
for the Process
Summing up the data we observe that the machine inserts as
a reasonable approximation a constant twist in the heater
zone (as imposed by machine conditions) but a different value
of twist in the entrance zone; since both the tension and
the twist are seen to increase as the overfeed decreases,
the torque must do the same. Also, since the final twist
is constant, the magnitude of the driving torque is, therefore,
related to the twist change at the heater, the so-called
"twist jump". The existence of high torques at the negative
*due to the difference in moduli

91
overfeeds implies that a greater part of the twist at the
spindle is elastic in nature, being the response of the cooled
yarn to the high level of torque: therefore, at constant speed,
at the spindle, the number of set turns of twist must be lower
in the case of the high torque. This observation has been
verified by allowing the cooled yarn to untwist (under zero
tension and torque), measuring the number of turns thus lost,
then completely untwisting the yarn in the twist-meter and
expressing the number of elastic turns as a percentage of
total turns. The results are shown in Table V and are in
agreement with the argument above. Since it is the number
of set turns of twist that determines the elastic and bulking
charactersitics of the yarn, the above imply that better
bulking should be achieved at high overfeeds; this, however,
is not the whole story, for the measured basic twist is
lower at high overfeeds, and the quantity that matters for
purposes of bulking is the set basic twist. When this is
calculated it is seen (Table V) that the set turns of twist
per untwisted length are essentially constant within each
temperature grouping (they increase very slightly with under-
feed), but that they increase with temperature.
It should be emphasized that the bulking or stretching
quality is not merely determined by the set number of turns;
other properties such as the quality or permanence of setting
are quite important commercially but cannot be inferred from
the data collected and reported above.

92
(d) Experimental Results: The Effect of Twist Fig, 14)
Table VI gives the experimental results of the effect of
twist variation at constant temperature over the same range
of overfeeds as before. The same qualitative observations
can be made from these data, as were earlier made, concerning
the basic twist and the effect of overfeed on tension. The
interesting phenomenon here, however, is that the tension
is seen to drop systematically with twist at identical
conditions of temperature and overfeed. The twist in the
entrance zone at equivalent overfeeds and, therefore, the
torque increases with twist as would be expected from the
higher spindle rpm (Fig.15). We can therefore see here that
as twist increases, the tension drops, and the torque increases;
since the contractile stresses in the filaments generated at
the heater are assumed to be the same irrespective of twist
(and depending solely on overfeed and the equation of contin-
uity), and since the inclination of the filaments (twist) is
imposed by the machine,at high inclinations, these contractile
stresses will have considerable tangential components which
will be manifested as torque and smaller components (because
of the high helix angle) in the axial direction of the yarn,
which leads to lower tensions and vice versa.
(e) Experimental Results: The Effect of Draw Ratio
To assess the effect of yarn draw ratio, false-twist pro-
cessing experiments were performed over a range of overfeeds
at 2280C. The results are given on Table yri;for comparison,
the data concerning the Medium Draw Ratio yarn under the same

93FIGURE 14
VARIATION OF TENSION WITH TWIST AT 210°C
TENSION(grams)
90
80
ENTRANCEZONE
A
COOLINGZONE
\
o 0 0 0~ D°
so
OVERFEED:
-6.67%
0%
· ~ - Of
, + ~ 4 _4, - - - 6.13%
35 45 55 65 75 tpi
70
60
50
40
30
20
I
L
I
85TWIST,5 25

94-
FIGURE 15
TWIST IN THE ENTRANCE ZONE AS A
FUNCTION OF TWIST AT THE SPINDLE
ACTUAL TWIST(ENTRANCE ZONE)
60
50
40O
30
1· . 4 -7 . *
+
0·A
'.
0 -6.67% OVERFEED
A
+
0% OVERFEED
6.13% OVERFEED
+
ACTUAL TWIST AT THE SPINDLE (tpi)50 I0 10 80 90
· A
20.
101
L
I
D
I
10 soso50 CO 90

HZo"E-.
I C ID. l 00
I. .1 ,N .n
IDI I
0 C) NC( I
,-IOI I
I co m
I 00I c
I E0 1A
a* * .** . e *. .
o~
D1J2{ N ] CN n ) nLn
U E- P
H4 U z a -OON COC Inn1U H *HQ H -N C c aq MH
H
0
NH ... H... HHH n ..... C0 .. 0ml 0 oc o 1.o0
E-Ie
¢ q tD Eq .. .O1 Ln r- m .0 OO N Nr a) fncoax mco N
3 E- o 0 ID c . OD co r-N
UEH ZHU1 H I- T*l . *I r- 4
< 0 m o l 0O < O
CQ E4E- Ztr r r - r
E- XI E
O mw. ) HXH
El I
-I Ln C)
Ollo0 .cr o o
) a
dPcco~+ '
+ I
N 1 00
In In Ln
C) H H
dP dPl rNH 1 0
C) 'I+ I
Cl 00 C)
C' Co O
C) nD 0D
C n k-
dP dP
HI 1
'I C) k0
+ I
H
i-IE,,

I I i I IO 0 o0 I0 .oH H CN in in
- X
E0zzZ ZOU
E HO~
E-H U
m EH
Zz0OZ
EZ41
E E-
H - H iE 9 El 0 Z<)VSE Or- Z ZX \ Nxo m
z-,i$- V j q~~J
< E-1 O~D U) 0E H v
E E-
rp
Ul HiF 3 mm pq p
r4u HWHWZH
rWUHEii -(
r- 0 'O CO) O
00 O 0 O0 OD
CO l CO
(N c) " () (
00 00 CD 00 CO CO o O C O00 co CO CO
(N - O (N WDD 00 (N H
!'
r- I 00 00
D N N D CD
.0 C0 Q0 (N in
e a' in in in
(N in 0 D C
O O O On OLn Ln in vr in
O O O O OV N- Oq I' COO O H H H-4H H H
o\o
01mK >o
O CO NCO .o0
V CO in oI I
ID (IN I'D Q0Co OD r rO C0 OD C0 CO
r Ln H r-i n
r N H CN H
rn Z IzT I'
H N 00 CO T
H n in nO CD
:T " r "TC O N O O O O H
N N N CD CDIO - O3 O Ni t i- ) 00
O CO H N (N' Ln in in int0 s k0 k0 sO
· r- oo N
(N in 'D0 CD O
O O O o0 Oifn In in : inO {o Oq 'O Ln
Z N (N '.0 CoO O 1 - H
H l H rH r- rH
H
z oH 3 H
az (:
O O NO '0 '.0
O in 'DI I
oH K a
a: C
96
zoH
E-'
(N
00 0 0H- Oq
HH
E
OH
EI1
0E
zU0
HCE
HmHEHH
HHIR
uW o,_q 00coN
z:
PL4P:

91conditions, already reported as part of Table V, are also
included. There is a noticeable difference in the performance
data between the two yarns; at comparable overfeeds the ten-
sion, as expected, is higher for the High Draw Ratio yarn and
the twist in the entrance zone is also higher. That indicates,
of course, that the corresponding torque is higher.
(f) Qualitative Model for the Process
On the basis of the data we have collected and studied, we
can now put together a simple picture of the process. For
a given rpm and exit yarn velocity, the spindle inserts a
constant number of turns of basic twist to the yarn and to
a reasonable approximation a constant number of actual turns
of twist at the spindle. At constant twist two parameters
are available and at disposal to vary: temperature and over-
feed. A decrease in overfeed brings about an increase in
tension, and that brings about a significant increase in
torque, which is now manifested as an increase in the twist
of the entrance zone; that must be the reason why the twist
is found to increase in the entrance zone as the overfeed
decreases.
The effect of a temperature change on tension is more diffi-
cult to predict; the reason can be seen by consultation of
the stress-strain curves of the untwisted yarns at the high
temperature: These curves are strongly non-linear with
strain and are lower as the temperature increases. Now the
origin of the tension in the process arises out of the tenden-
cy of the filaments to shrink when exposed to the heater,

9:to some equilibrium value at the given temperature,
which can be characterized quantitatively by some equili-
brium unstressed denier, de. Of course, the higher the tem-
perature, the higher the equilibrium shrinkage, and the
higher the equilibrium denier; this means that, if at con-
stant basic twist and overfeed we increase the temperature,
we are in effect increasing the strain on the. filaments in
the hot zone, since their final denier is constant (control-
led by the overfeed), but their equilibrium denier is now
higher. At the same time the modulus at the high tempera-
ture is lower. It is the competing effects of modulus
decrease and concomitant strain increase which decides the
outcome: If one effect dominates over the other, then the
tension will either increase or decrease or even not change.
The dependence thus on temperature is a pure manifestation
of the material behaviour and could be quite different for
different materials; inasmuch as tension influences torque,
the twist profile will also be different (though not the
final twist) if the temperature dependence of the material
properties is different. Finally, concerning twist, the
comment made in the previous section apply: Higher twists
leads,-of course, to higher torques and higher twist values
in the entrance zone while at the same time, because of the
high inclination of the filaments, they lead to lower values
of tension.
Qualitatively, thus we can explain the behavior observed
experimentally. At the quantitative level, though, and in

99
a deeper sense we have left many fundamental questions un-
answered as yet. For to fully understand a process, one
should give quantitative answers which are in agreement
with the experimental facts. Questions that need to be
answered include the following:
(1) What kind of yarn twisting mechanism exists that
generates an essentially constant twist under a variety of
tension and temperature conditions?
(2) What mechanisms of tension and torque are operative
in the yarn that result in the change of twist from the en-
trance zone to the heater zone? In other words, why should
the twist be constant at the heater zone and not at the en-
trance zone; and why should the two differ?
(3) What kind of model, from the yarn mechanics stand-
point, can account for the tension levels observed in the
yarn?
(4) What kind of model, consistent with our qualitative
observations can account for the torques experimentally
measured?
We attack the problem first by discussing the tension beha-
vior of the filaments and then going into some depth in the
mechanism for torque generation.

too
VIII. CALCULATION OF TENSION
(a) False-twist Operating but Spindle Stationary
1. Analysis
We attack the problem of calculating the tension by analysing
a case simpler than the actual false-twisting, namely, the
case of the tension developed in te false-twister as the yarn
is running through the machine and is threaded around the
pin, but the pin itself is stationary (does not rotate).
In this case, of course, no twist is developed, but just as
for actual false twisting, the tension in the system will
be higher downstream of the spindle and will be related to
the tension upstream by the tension ratio r; r was experi-
mentally determined in this work by reverting the pin and
heater position and the direction of motion of the yarn
(since the strain gage which measures tension is attached on
what serve as feed rolls. during normal machine operation).
Fundamentally we seek an expression derived from the physics
of the situation and the machine conditions, which will allow
us a value of the strain of the yarn in zone 3 or zone 4
(whose tensions are related by the tension ratio r). Then
through knowledge of the material properties we can relate
strain to tension. The following relationships can be used
to that effect: The continuity equation which expresses the
constancy of mass at any point in the threadline:
Vidi = 3d3 v4d4 (Equation 48)

101
Relationship Between the Yarn Deniers
In zone 2
de = d2(1 + 2 ) (49)
where de is the equilibrium denier to which the yarn would
go if allowed to shrink freely at the heater temperature.
In zones 3 and 4 as a result of the tension difference
d(unstr) = d3(1 + 3) = d4(1 + 4)
d3 1 + c4
d4 1 + c3
(50)
(50')
where d(unstr)is the denier of the cooled yarn at zero stress.
In zones 2 and 3
d2 = d3 (51)
postulated and experimentally verified as reported in an earn
lier section, 2 c3 4 re the filament Cand yarn) strains.
Equality of Tension and the Material
Properties
T 1 = 2 = T 3 r
Assuming Hookean behavior,
(52)

I02
T3 = E3C 3 (53)
c4 = r£3 (54)
T2 =E 2 2 =E 2{ 11 Ed ]
from Equations (49) and (51).
If we now replace in (55) the value of d3 from Equation (50'),
and use (52)
T3 = E23) - (56)d(1 + r 3)
This last equation, in conjunction with Hooke's law,
Equation (53) forms a system of equations which can readily
be solved to yield T3. If the behavior of the material is
non-Hookean, one needs to express the stress-strain curves
analytically as T = f(s) or alternatively one can express
the moduli as functions of strain E = f(s). This will com-
plicate the computations but will not alter any of the ar-
guments above. In any case two stress-strain relations are
needed; one for the hot zone where the contractile stress
is developed, and are for the cooling zone (the yarn upstream
of the spindle having, of course, the same stress-strain
curve as the yarn downstream).
2. Experimental Verification
To verify the analysis above, the threadline tension for

103
two different experimental conditions were calculated and
compared to experimental values. The two cases are as
follows:
Laboratory False-twister Settings:
2100C, -6.67% overfeed
The measured tension was 71 grams and the tension ratio
across the pin (measured as earlier described) was 2.1 with
150/34 Medium Draw Ratio Dacron yarn. The spindle was not
stationary but was made to rotate slowly (%100 rpm correspond-
ing to %5 tpi), to avoid snagging which occurs at the spindle
if the yarn is entirely without twist. The tension level was
high enough to be outside the linear range of the stress-
strain curve, not only of the heated yarn but also of the
cooled yarn. In order to avoid the complications of express-
ing analytically the stress-strain curves and then solving
the tension equations, the moduli were taken from the stress-
strain curves at the level of tensions experimentally deter-
mined (70 g.). The appropriate values were 225 grams/unit
strain for the heated yarn and 12,000 for the cooled yarn
(the linear part of the stress-strain curve has a modulus
of 14400). Using these values, the predicted value of
tension is 78 grams vs. 71 grams experimentally determined.
Note that this testing condition is an extreme one, as yarns
are usually processed under overfeed rather than underfeed
conditions, so actual processing tensions are much lower.

1o
Laboratory False-twister Settings:
210°C, 0% overfeed
The measured tension was 23 grams and the tension ratio
was 2.3, measured as before. The machine rpm was 100
(corresponding to 5 tpi). The hot yarn modulus (taken from
the stress-strain curve at 23 grams tension) was 95.4 and
the cooled yarn modulus was taken as 14400 grams/unit strain.
The calculated value of tension was 28 grams. Thus the re-
sults for the two cases are reasonable and the model can be
accepted as valid.
(b) Determination of the Tension During False-twisting
1. Analysis
The preceding simple analysis allows for determination of
the strains developed in zone 2, zone 3 and zone 4, based on
machine conditions, and on the a priori knowledge of the mo-
duli. The moduli of importance were the "hot" modulus (and
the concept of equilibrium denier) and the cooled yarn modulus.
In the case of actual false-twist operation the picture is
evidently more complex because the yarn in zones 1, 2, and
3 is twisted while in zone 4 it is untwisted. Consequently,
in addition to material parameters, we must also consider and
take into account yarn mechanics. Since the tension in zones
3 and 4 has been expressed in terms of filament strains that
are then translated into tensions using the Young's modulus,
it is useful to express the twisted yarn tension in terms of

IOS
filament strains rather than yarn strain. From yarn
mechanics the yarn tension for small strains is. given in
terms of the average filament strain f by combining Equa-
tions (13) and (15).
T = 'kEE A(Ap + 2) (57)(Ap2 + 1)
This equation, as explained earlier, assumes the yarn to
have been originally stress free in all filaments; the yarn
tension arises from the stress induced in the filaments upon
extension of the yarn.
To derive the equations which will allow determination of
yarn tension for the case of false-twisting, the following
assumptions are made:
(1) The twist p is known. Actually the basic twist is
known, and if the contraction factor is known so
is p.
(2) We assume the yarn denier to be the same in the
heater and in the cooling zone. This was ex-
perimentally verified for the case of untwisted
and very lightly twisted yarns (see Table IV); the
validity of that assumption for the case of twisted
yarns, is supported by the observation that little
twist change occurs as the yarn moves from the
heater to the cooling zone.

166
(3) We assume that the filaments obey Hooke's law in
zones 2, 3 and 4 or, if the stress-strain curves
are non-linear, they can still be expressed analy-
tically. Alternatively, an appropriate value of
the modulus must be chosen from the experimental
data.
(4) We assume, in particular, that the shrinkage be-
havior of the filaments in the twisted yarn and
so the "hot" stress-strain curves earlier deter-
mined on untwisted filaments are applicable to
twisted yarn. We assume that the
equilibrium denier de is only dependent on temper-
ature; also the tension and torque in the heater
zone arise from tension, which is developed on
heating, because the yarn is not allowed to shrink
to the value of equilibrium denier corresponding
to that temperature.
(5) We assume that Equation (57) represents the mech-
anism of yarn tension buildup: the filaments are
all stressed, with respect to some (hypothetical)
unstressed state where they would have all been at
their equilibrium unstressed level, and these strains
give rise to yarn tension.
(6) We assume the tension ratio r to be known experi-
mentally.

t10
With these assumptions the equations to be used are:
'The continuity' equation_ at steady-state
V. d.1. 1 = V4d 4
Relati'onship between the yarn (or filament) denier
de = d2 (1 + 2) (49)
where 2 is now the average filament strain. Also2
d3( 1 + E3) = d4(l + 4 ) (50)
with 3 the average filament strain in zone 3. Also
d2 = d3 (51)
The equality of tensions
This is expressed in terms of yarn mechanics
T = wrkE2 (Ap + 2) T E A(Ap + 2)
(2 + 1) (Ap 2 + 1) 3)(58)
a consequence of Equations (52) and (57). Since the
geometry (i.e., twist, denier, packing factor) are
the same in zones 2 and 3, we can simplify (58) to
E2E2 = E3s3 (58')
This, of course, assumes that the mechanism by which
the yarn is supported is the same in both zones. Also
T4T -
rC52)
(48)

10
which can be rewritten in full detail,
2, 2 . T-Wf (Ap + 2) 4 1 2T =71kE C - E WT34rf2 (52')
T3=E33 2k (Ap2 + ) r r
with all symbols previously defined.. Note that the
modulus in zone 3 and 4 is the modulus of the cooled
yarn. Simplifying (52') and rewriting
2 (Ap2 + 1) 1E:3 2 · -E4 (52')Ap +2 r
It will be seen later that the quantity 2(Ap + 1) isAp2 + 2
the tension ratio of an untwisted to a twisted yarn at
the same average filament strain. We define, for brevity
2
Ap+ 2· r 2 r' (59)2(Ap2 + 1)
Finally,
£ 1 = 1 e g (55)2
Replacing e4 from (52'') in (50) we solve for 3; we
then replace in the calculated expression d3 from (55)
and £2 from (58'). e3 is then given by the implicit
equation
d d 4de d d 414 - 4
.E3 .E3 d1+ 1 e
£3 F 2 (60)2 2
d d 1r'd -4 r 4
E4 Ee E'E 3 + '32 E

109
The value of E3 is the average filament strain, which
is translated into yarn tension through Equation (57);
it is seen to depend on the ratios E3/E2 and d4/de.
2. Experimental Verification
To check the validity of the model, the tensions for overfeeds
of +6.13%, 0% and -6.67% and for 2 temperatures (1340 C and
2100 C) were calculated via Equation (59) and compared to
those actually measured. The various quantities in Equa-
tion (59) were calculated as follows:
Denier: d was taken directly from the contractileeq
stress data; d4 was calculated from the equation of
continuity (48).
Moduli: E3 was taken from Table II; the value of E3
corresponding to 0% overfeed was not experimentally
determined, but was interpolated from the +6.17% and
-6.67% overfeed data which differ by less than 20%.
E2 was taken from the contractile stress data. Since
the stress-strain curves are non-linear, the experimen-
tal value of the tension was used (corrected for the
twist from the equations of yarn mechanics) in conjunc-
tion with the stress-strain curves to determine E2.
The alternative would have been to express E2 analyti-
cally as a function of 2 and to use an additional
equation to determine 3 .
The tension ratio was taken as 2.3; r was measured as

110
described earlier (Section VIII, Ca), 1.1 the results
are shown on Table VIII and show considerable scatter.
The value of 3 from C60) was then calculated and was
translated into yarn tension using Equation (57) and
values of E3 from Table II ; the value of the twist
used to relate filament tension to yarn tension was the
one experimentally determined.
The results of the tension calculation are given in Table
IXK;Fig.16,16'. They apply to yarns textured to 50 tpi
basic twist, whose twist distributions have been reported
in Table V. The agreement between the calculated and
experimental values, considering the miniscule values
of the strains involved, and the assumptions and approx-
imations used is good.
3. Discussion
The expression for 3 depends on the ratios E3/E2, d4/de,
and r', but this dependence cannot be expressed analytically
in a simple way. To get insight into this dependence we con-
sider first Equation (58') which was used to derive (59)
E2 -3 E= 2 (58')
This indicates that 3 varies directly with E2/E3 and 2. In
our experiments the ratio E3/E2 was found to vary from 17 to
225 (Table IX) and this variation is almost entirely due
to the variation in E2 since E3 varies over a range of only

1I
aY N H 0kDO H H '0D
(N (N (N H
(N 'IO r
*dl (N Qr( t>4 0
NN~
co 0 0I 0 , %
O C4 9(4 L) '
. (NIN N-(N 4(
0
(N
0-HEn.0
U U UH -H -rlUi) En U
R R R
.14 04 01 .1 4 0c, C, ., 04
(N 0 04 o4 0
O4 v v 44H 4 H - o 4
Q)o o 4 o0 O) O O 0r
· l ·u · n · @
) a@ a ~o a) ocE-4 E-4 U 4
0)a-4
>O
O
.-I
·(d)
E-1
.N (Nl ((N (N
E,1
co3 ·O5I Cfl0 0
o 0UQ)
(O -H
u o
40or)
r-.
E~U)
E-
C1r
EA
-12
kD
(N00cqOD
0
00
Z H-P4 0)U) -4
G)01H 0H .0)H ·4-)
0CO
4 -
0HU)Hz
E
-H11
.0
P4
LA
U0
.l*H(a.Q
04
LA
O Co-
)
OE n30o5 Q4c-U)
oc
)O. U0 4
Q)
O
o oo H4
O O
H4 H
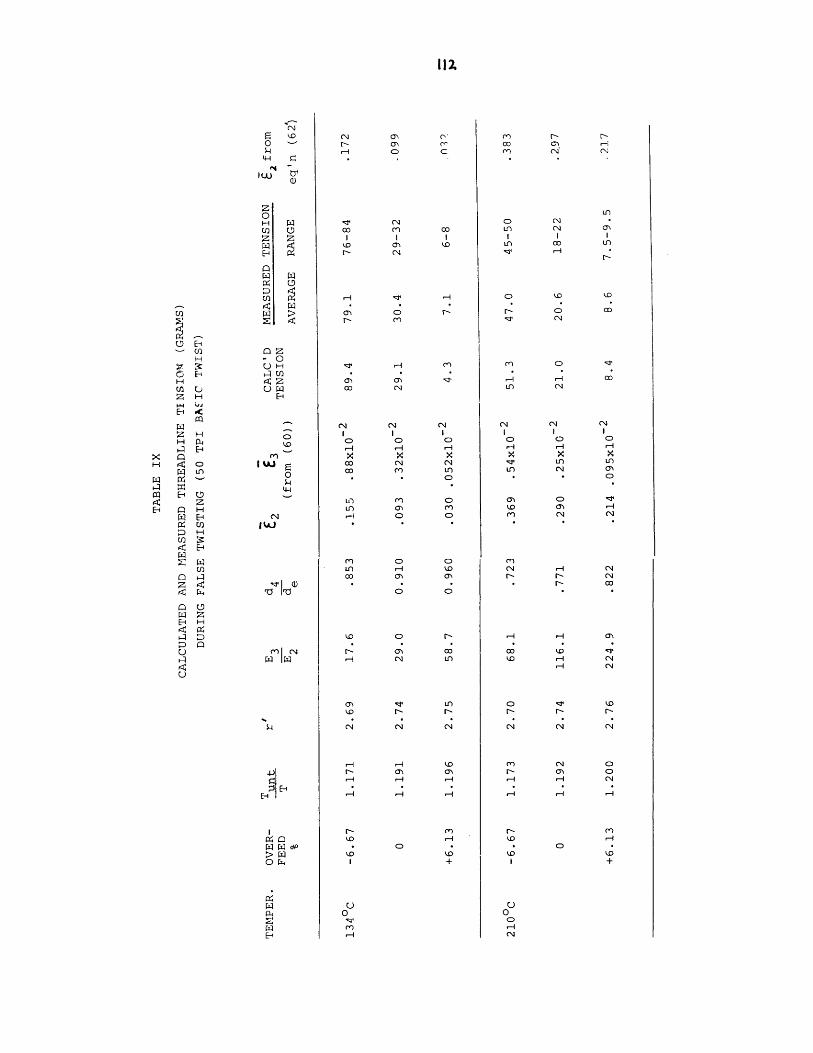
112
(N 0 C-r- o) c-
ooo cI I I
N- C04
01 0
liN 01co cq01 0
01
CN N tN
1 ,H 1
c0 1 CI CO m Ln
In o O n1 0 O
01 C) 0Dco o oIn H '.0
0 o
ND O 0\O O o
H 04 In
0D I
CN N CN
0-4 0-4 04H H 'N a1 01
H H H
IN
'.
o1H
'.
U-
en m r
Ln
CO N
L) N o0
In Ox, LnI I I
0o o
N X
~m o d
ko o' 0x X X* * O
01 0
NCN r- c
NH 04
H H 01
'.0 H 04
0 '.or- r- o\O dt U)
N N N
01 04 04
Nl 01 01m CS H H 04
H H H
kD
I
01)
'.+
oo
CNHJ
04
0 ~~4-4 r0
01)
z0H
0UI)
twE-1
(2W:
z-UH
uZ
-i.
,0
o
4-4
0J
GAJ
' 1
dW
H
C E-
ICIZ H
E- ,C
ZHH 1.
< H
O H
Ul
-I
EH
CD
B-. LB-1 Ivt
m E'
3a[-.-
E-
I H0 x1
W
0
z

113
FIGURE 16
EXPERIMENTAL AND CALCULATEDVALUES OF TENSION (1340C)
*T
N
"N
II I -
TENSION(qrams)
96*
80
68
6'
60
56
62*
48LfBf
36
32Z
a28
Il-
12
8-
4a.
NN1.
-6 -S - -i3 2 - o l 2 3 4 5 6
OVERFEED %
r
.
I

411FIGURE 16'
EXPERIMENTAL AND CALCULATED
VALUES OF TENSION (210°C)
-.4 -3 -a -I o I 5 6
OVERFEED %
TENSION(gr Ims)
56
52
48
4"
32
28
2.0
8
4'
-6 -5-·-------·------ T_ ___.T___ T ��- 7-.-·- 111- �-��.--�.-----�--111�--.�1�1--�-�11�--- ·1__7s_�117·-�-�C�
0

115
18% Cfrom 9800 to 11900 grams/unit strain). Therefore, the
higher the hot modulus the higher £3'
Equation (58) also varies directly with 2. To obtain in-
sight into the dependence of T2 itself with machine variables
we note that the expression d4/ deq which appears in (59)
can be rewritten as
d d d d 3 d d d3e _ e 3 _ + 2)( + 2 )
a4 - d3 d4 d2 d4(61)
from Equations (51), (50) and (54). The second parenthesis
in (60) for the highest value of strain encountered in the
experiments (r' = 2 69, e3 = 9 x 10⁻³ ) is 1.015. It can thus
be neglected and Equation (60) can be rewritten
de 1 + 2 (62)
d4
or
d2 = _1 (62')
d4
This equation says that 2 is the "overall" yarn strain im-
posed by the machine (de being controlled by the temperature
and d4 by the overfeed). Note that this affords us a sim-
plified way of determining the tension, for given 2, we have
immediate access to E3 through Equation (58'), remembering,

i16
however that E2 is also a function of C2 Values of e2
calculated uing Equation C62'L are shown on Table IX; there
is reasonable agreement between e2 calculated via Equation (62')
and s2 calculated via Equation (58'), given 3 from Equa-
tion (60), which is also shown on Table IX, With the above
in mind, we can now explore in more detail the predictions
of Equation (59) concerning the effects of processing var-
iables in 3.
Dependence of on r'
A numerical calculation was made to assess how 3 depends on
r'. Data were used from the experiment at 210°C and 0% over-
feed. With reference to Table IX , the variables of interest
in this case were E3/E2 = 116.1, d4/de = .7714. Equation (59)
was used to calculate 3 as r' was given the values 2.1, 2.3,
2.5, and 2.7. The results, illustrating the effect on 3 of
the variation of r' are given below.
r!
2.1
2.3
2.5
2.7
.3
2.52 x 10⁻³
-32.52 x 10
-32.51 x 10
-32.51 x 10 - actual case
So, at least in the range of interest, the dependence on ris
not significant;in view of the difficulties in obtaining an
accurate measure of rthis observation lends further support
to the validity of the data.

III
Dependence o'f' on Temerature
at Constant Overfeed
As the temperature is increased, the equilibrium shrinkage
modulus de increases so Equation (62") predicts that 2 in-
creases. However, as can be ascertained from Figure 7 , at
constant overfeed the modulus E2 decreases with temperature.
With reference to Equation (58'), the net result on £3 can-
not be predicted as 2 increases and E2 decreases. The re-
lative change of material properties with temperature will
therefore decide whether 3 increases or decreases with tem-
perature at constant overfeed. Figure 17 illustrates the tem-
perature variation of T2, calculated for the case of -2.86%
overfeed, as well as that of the corresponding modulus E2.
Note that the calculated values of tension as a function of
temperature given in Table IX are in agreement with experi-
ment.
Dependence of Tension on Twist
The strain on the filaments, 3, is assumed to be independent
of twist (cf. Equations (58) and (58t)). However, the filament
inclination increases the higher the twist, and therefore, the
contribution to yarn tension decreases as the twist increases.
This can be seen from Equations C57) and (311, and is in agree-
ment with the experimental data CTable VI).
In summary, the origin of the tension force at zero or posi-
tive overfeeds is assumed to be due to the shrinkage tendency

0it
o t
0
0
/Ki
0 0 0 O 0 O 0 0o 0 0 o 0 0 0 0c* 0 co '0 : eV 0, N N , t . O(1 r1 > _ _
0 O 0 0o 0 0 0
go %0 * 4
H. 0LO NO
0r
0 0Nu
0
/
/
C~
0
coCo
I
r-
HFrI
0
mEi
0 K
0
0c_)NO
,0r,-C W
0.0oN Wc4
I000o0
n
,O
·
g,
z
OO0HE-
H
O
0
0NC 4
_ ·
_

119
of the filaments under the influence of temperature; the
level of tension is controlled by (Ca the temperature,
which determines the equilibrium denier to which the unre-
strained fiber would tend in the absence of machine con-
straints, and (b) the overfeed which imposes the denier of
the filament exiting the machine, hence, the overall fila-
ment strain (relative to the equilibrium denier). This
strain results in a filament stress which is manifested,
subject to the constaints of yarn geometry, as yarn tension.
In predicting the yarn tension, it is necessary to know the
material properties; therefore, the stress-strain behavior of
the untextured and textured yarns were determined experi-
mentally, as were the contractile stress curves which were
expressed as high temperature stress-strain curves; moreover,
the tension jump across the spindle was experimentally deter-
mined. The twist was also taken from the actual experimental
data though all twist values were very close, irrespective
of overfeed. The mechanical model chosen for expressing yarn
tension assumed the yarn to have been stress-free prior to
application of a strain. This model (discussed in
Section V Ca) 1, of this work) assumes that as the yarn is
extended, the filaments are strained to an extent dependent
upon their distance from the yarn axis; the yarn tension was
expressed analytically in terms of the average filament strain.
The stress-strain curves of the fibers at elevated tempera-

IZ0
tures are nonlinear; use of the average filament strain
also averages the modulus. The expression derived
(Equation C60)1, predicts that, irrespective of the type of
material used, the tension will decrease as overfeed increases
and as the twist increases; these predictions are in agree-
ment with experiment. Equation (60) further predicts the
tension to depend on the ratios E3/E2 and d4/de more speci-
fically, the temperature variation of the tension depends on
thequaniities de and E2 which vary in opposite sense with
temperature. The relative sensitivity to temperature of
d and E2 will decide whether the tension will increase or
decrease with temperature and cannot be predicted a priori.
Given the temperature dependence of de and E2, the model pre-
dictions are in agreement with experimental measurements
of tension.
4. Example of Tension Calculation
To illustrate how the calculations pertinent to Table
were performed, we go through the computation of tension for
the case of 2100 C and -6.67% overfeed.
We must solve Equation (59) to obtain 3. To translate 3
into yarn tension we use Equation (57)
- 2T = frkE A(Ap + 2) (57)
3 3 Ap 2 + 1
or, more commonly, we calculate the tension ratio of the

121
untwisted to twisted yarn with the same average filament
strain, The tension in the untwisted yarn is
Tunt = f2f = Tf WE3£3 = 2rkAE: 3 (63)
where all quantities have been previously defined. The
ratio of Equation (63) to Equation (57)
Tunt
T
2 (Ap + 1)
Ap2 + 2(64)
is used to calculate the yarn tension in zone 3, given the
average filament strain hence, the tension along the fiber
axis in that zone.
The quantities we need to know or calculate are de, d4, r,
E3, E2, S3, A, p and T.
Determination of p
This is known experimentally and is 61.6 tpi or 387.044 radians
per inch.
Determination of d4
This is given by the equation of continuity, d4 = (Vi /V4)di .
The overfeed, (Vi - Vo)/Vi = -0.0667, so that V4/Vi = 1.0667
and d4 = 150/1.0667 = 140,625.

122
Determination of d
From the contractile stress table, de or zero contractile
stress, corresponds to an overfeed (Vi - V0o /Vi = .2286;
hence, from continuity, d4 - de = CVi/V )di = 150/.7714
= 194.445
Determination of A
By definition, A = Wf 2/2k with W = 34, k = 1. We must,
however, compute f2 which is the filament cross-sectional
area in zone 3 with d2 = d3). We take the cross-sectional
area to correspond to that of yarn of denier d4. This is
not quite true as the denier in zone 3 and zone 2 is some-
what higher than in zone 4 because of the tension difference
across the spindle, but the assumption (especially at low ten-
sions) is good. More exactly, d3 and d4 are related by
d4 1 + 4/2 .3
d3 1 +
when 4 is of the order of 5% (a very high strain),
the ratio is 0.97.
From the definition of the concept of denier, we have
2 5 _14'0'..6'25
f 2p(9 x 10 ) =34
2 1.643 x 10⁷ in2 andfor zone 3; hence,frf 1.643 x 10 in and
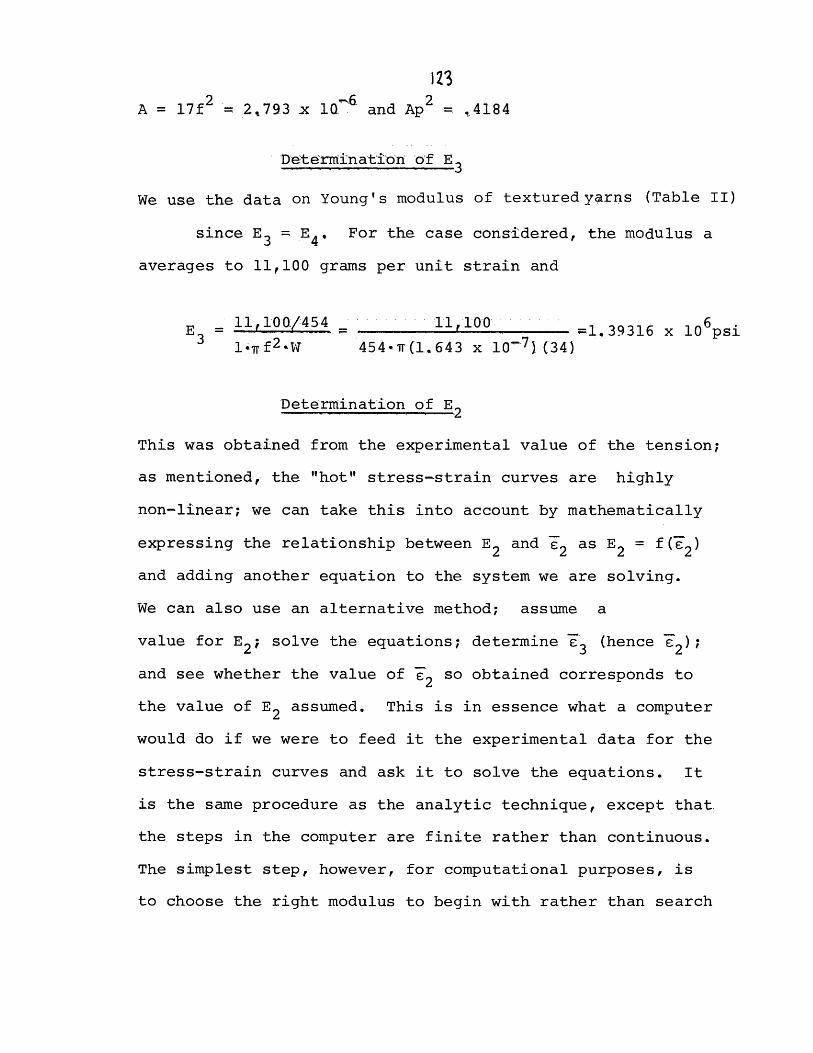
123
A = 17f2' 2,793 x 1Q_6 and Ap2 .4184
Deteriination f E3
We use the data on Young's modulus of textured yarns (Table II)
since E3 = E4, For the case considered, the modulus a
averages to 11,100 grams per unit strain and
1llr 1OQ/4l54 1,100 6E = 11, T0 f 4:54 _= -.1 1 1.39316 x 10⁶psi
3 1 .11f2 ^W 454-.r(1.643 x 10⁻⁷) (34)
Determination of E
This was obtained from the experimental value of the tension;
as mentioned, the "hot" stress-strain curves are highly
non-linear; we can take this into account by mathematically
expressing the relationship between E 2 and 2 as E2 = f(72)
and adding another equation to the system we are solving.
We can also use an alternative method; assume a
value for E2; solve the equations; determine 3 (hence E2);
and see whether the value of 2 so obtained corresponds to
the value of E2 assumed. This is in essence what a computer
would do if we were to feed it the experimental data for the
stress-strain curves and ask it to solve the equations. It
is the same procedure as the analytic technique, except that
the steps in the computer are finite rather than continuous.
The simplest step, however, for computational purposes, is
to choose the right modulus to begin with rather than search

124
for it analytically or digitally; this is what was done here
and the steps were as follows., The experimental tension
on the twisted yarn was 47 grams so that the tension along
the filament axis was (from Equation C62)
nt47 x unt 47 x 1.1730 = 55.13 grams.
T
From the contractile stress curves this corresponds to strain
on .34. Thus, now we calculate F 2 as
E 2 -_ - = 20351.42 psi55.13/454 55.13/454 = 20351.42 psi(.34) f2 W (.3 4 ).34)(1.64 3 x 10- 7 ) (34)
The ratio E3/E2 is therefore, E3/E2 = 68.46.
Notice that in both calculations of E3 and E2, the cross-sec-
tional area, f2, with respect to which the modulus is cal-
culated, is not the original (unstressed filament) area, but
is the area corresponding to d4; the justification is that the
denier is the same in zones 2 and 3. We have, however, not
corrected for the thermal expansion which would increase
somewhat the cross-sectional area for the case of the fila-
ments in zone 2.
The calculations were given here in detail to underline all
the assumptions made; in practice, a short cut may be taken
Rather than expressing E2 and E3 in psi and since we only
need their ratio, we can express the ratio directly in terms

of grams/unit strain, and obtain
1.1,10.0/1
55.13/.34= 68.46
using the numerical values previously empolyed,
Determination of
We substitute the proper numerical values into the equation
for 3', Equation (59), and we have
194. 445
C3 =
- 140.6251 + 68*46T3
1 194.445 '
2.7(140.625) -1 + 68.46c 3
3+ .3778 - 2.0768 x 1033 + .3778 07683. = 0
Solving the equation, we obtain
- _ -.3778 15104c3
2
-.3778 + .3886
2
-.3778 - .3886
2
0.0108 5.4 x 10⁻³
2
= REJECT
The average strain in zone 3 is thus 0.54% which corresponds
to a longitudinal fiber tension of 59.94 grams in that zone
(modulus E3 = E4 = 11,100 g/unit strain) or an axial yarn
tension through Equation (64) of 59.94/1.173 = 51.2 grams
versus measured 47 grams (see Table IX).
or,

124
IX. MEASUREMENT AND CALCULATION OF TORQUES
(a) Introduction
Calculating the torques is a more difficult task than calcu-
lating the tensions, since the material properties are known
with less certainty. To illustrate, both the bending modulus
and the shear modulus enter into the calculations of torque;
the bending modulus was assumed equal to the tensile modulus,
whereas in fact, it depends on both the tensile and the com-
pressive modulus, the latter not having been measured in this
work. Also, it was assumed that G = E/12, but the complete
stress-strain curve in torsion is not known. Also, with the
exception of Young's modulus, which was measured as earlier
described, the values of the torsional and bending moduli at
high temperatures are not known.
In the calculation of the torque, the tension in each filament
is multiplied by the corresponding moment arm to give the torque.
The contributions of the filaments to yarn torque are thus
weighted, the outer filaments contributing more to yarn torque
than the inner filaments.
The torques were determined experimentally following the pro-
cedure described in Section VI,(b); the objectives of this
phase of the work were not only to measure the actual values
of torque, but also to calculate them from the yarn geometry
and the filament mechanical properties and to elucidate the
phenomenon of yarn uptwisting, that is, the twist jump that
is observed as the yarn enters the heater zone.

121
The results of the experimental measurements and the cal-
culated values of torque are given in Table X and they shall
be discussed, with reference to the Table by first examining
the torques in the entrance zone and then the torques in the
heater zone. (See also Figure 18)
(b) Torque in the Entrance Zone
The three components of torque (tension, bending, torsion)
described in Section V, (a), 3. were calculated separately
and then summed to give the total torque. These components
were calculated as follows:
1. Torque Due to Filament Bending
The expression for this was derived following the method of
Platt (R13), but adapting it to the constant packing yarn
model, with filaments continuously distributed across the
yarn cross-section; the torque is given by Equation (22).
In our calculations the bending modulus was assumed to be
equal to the tensile modulus, which was taken from the linear
part of the stress-strain curves of the untextured yarns,
determined on the Instron as described in Section VI, (b), 1.
The twist values used in these calculations were those ex-
perimentally determined and reported in Table V. The re-
sults of these calculations are reported in Table X under
the column "Entrance Zone/Upper Limit".
2. Torque Due to Filament Torsion
The expression for this was derived, as above, following the

12.g
w w 9rE Z r a
W 4J O
3N E NEl Z r 10 04 044...4 0
Z - r4
W N M IZ W l CS h J O
POt PI DE
Z r( a,1 oW ::, -4
_ o a>
C 11. I
o o oN ~ I I
rl II10. . .· e
t~9 r
0 J
O 0-4
w ); 4 Z -4 0004 . . .N -
*44 40 04
0. 0 C
444.4
0-4.1).1
sr o H ,N 04 -4 04- . . .
C * C,.-,
· ·0 . o
N 0.4 o 0 04 uID N n
.Uv ,
- .rl
-44.4
I 0.o aEt a-
0 N 041V -4
- . . .-
Co o
J 3 ~~~~XE 1> 1
' 0§4 1 N
Z N . .41 A; ..C.,0
* .404 N 0.44 N N
W Z, 4 - 4
0 0 40 o
I c a c 5-4o -4 0x o
-40 0 .0-4 > O
lCa > C4444>. _ 4-44- -444> > O >.0 V . 0..,uC IIIC "
0 0 0. 04 a0 004o 04o
00
UCac.w-440 I~·-, I.r4x 44:~04 0
w M.4 In
Ec ZsgcE 0a Hw
4.4 004404o
0
0C 0,
3'
00
co
ooHw0
0 w g60 10 .o 4Vl 7
0 M C0 0 0.,, .,1 , I
C. C I 44 44 0 044 M 44 E
>r
I
C nE. 0
1 l _0 t044 00. > Ox 'a *
M 4. 0, 0O4 - O
007 O..to o " C44 04 0Z I E
>: u W 8
or u eo. . . I
1J Nm A OI .rc
o et
N az
· i io aI I. ". .
II1)I 1· 11 IN P·
>
I1oIrI-
ll OO rI· a
It1o11
1-
V
NclI

129
FIGURE 18
MEASURED TORQUE vs. TEMPERATURE AT VARIOUS OVERFEEDS
TORQUE 5(in-lb 10 )
a
a
-6.67%
00
0
N
_. +_ 6.13%++
~+~~~~~~~~~~4
TEMPERATURE °C._ , t , , | , . , , I I
IZO 130 140 ISO 160 1' 0 180
40
30
20
lO
j
F
I
L,
F
J90 200 210 2QO6

13D
method of Platt(R13), but adapting it to the constant pack-
ing yarn model; the torque is given by Equation (26). In
our calculations the shear modulus was taken as G = E/12
with E determined as outlined above. The twist values in the
calculations were those experimentally determined and repor-
ted in Table V. The results of the calculations are report
reported in Table X under the column "Entrance Zone/Upper
Limit".
3. Torque Due to Filament Tension
Two methods were considered in calculating the torque in the
entrance zone.
"Classical" or Simple Yarn Mechanics
This model assumes that the yarn is formed under no tension
and is then extended without change in twist; the extension
generates a tension and a corresponding torque. This model
was discussed in Section V(a), 31, but was not used in this
work since the physical situation in the false twister does
not conform to this model.
Torque Due to Equal Filament Tension
In the false twister untwisted yarn enters the twisting zone
and is twisted under constant tension. A more realistic
model, therefore, is one where the filaments of the yarn are
under equal tension. The torque equation resulting from this
situation was derived earlier; combining equations (31) and
(32), this torque is given in terms of the tension by

131
TMTE
p
22+ 2) I (65)~p2 + 1)
For a given yarn tension and twist, the torque predicted by
this model is higher than that predicted by the model of
"classical" mechanics discussed in the previous paragraph and
given by Equation (30). Also, the torques' ratio increases
with the twist; it is typically 1.075 for 38 tpi and 1.13
for 48 tpi.(for 150/34 Dacron yarn).
In calculating the torque in the entrance zone, Equation (65)
was used, and T, the tension, and p, the twist, were the
actual experimental values and taken from Table V. Notice
that the modulus does not appear in Equation (65); however,
Equations (31) and (32), from a combination of which Equation
(65) is derived, both assume Hookean behavior; the same is
true of Equation (30), which links tension and torque for the
case of simple (or "classical") yarn mechanics.
4. Comparison of Calculated and Experimental Data
for the Case of the Entrance Zone
It is seen in examining Table X that the agreement between
the experimental values of torque in the entrance zone and
in the cooling zone is good; further, independent work, using
a torque measuring device mounted on the threadline and record-
ing torque while the machine was operating, confirms the re-
sults presented here' I9 ) .

132
In comparing the experimental and the calculated values
of torque (reported under the column "Entrance Zone/Upper
Limit") one sees the latter to be higher, the more so the
higher the overfeed. The following are possible reasons for
the variance between experimental and calculated results.
(i) The experimental values have been measured on the thread-
line 15 - 20 minutes after the machine was stopped. In that
period of time inevitably some stress relaxation has occurred
in the sample. Even during the false-twist operation, while
the yarn is still in the entrance zone, the bending and tor-
sional moduli must relax, since any yarn segment remains in
that zone for 25 - 30 seconds.
(ii) Mention should be made again of the uncertainty concern-
ing the values of the bending and torsional moduli since the
torques were calculated assuming the bending modulus to be
equal to the tensile modulus and G = E/12.
(iii)Another significant effect is that due to the non-linear-
ity of the stress-strain curve. The bending strains (i.e.,
the extreme tensile fiber strain or bending) for outside
filaments at 30.2 tpe and 41.4 tpi of a 150/34 polyester yarn
(typical of the values of twist encountered in the entrance
zone) are 3.2% and 5.14% respectively. These are well beyond
the elastic limit, and the associated secant moduli are 8500
and 6800 grams per unit strain, respectively. The Hookean
Modulus is 16200 grams per unit strain (108 gpd) and the

133
elastic limit is approximately .72%.
To account for the non-linearity of the stress-strain curves,
the bending and torsional contributions to torque were recal-
culated assuming now that the tensile modulus for all the
filaments in the yarn was that corresponding to the strain
experienced by the outer filaments. The strain depends
on the twist and the experimentally determined values of twist,
shown on Table V were used. The calculated values of torque
gives us a lower bound for the torque values and are tabulated
in Table X under the heading "Entrance Zone/Lower Limit".
It is seen that the calculated values of torque bracket the
experimental values. (Figures 19 and {9').
(c) Torque in the Heater Zone
The problem of calculating the torque in the heater zone is
also complex: the material properties are not immediately
accessible to experimental measurement, and the yarn twist
suddenly increases as the yarn enters the heater zone. This
suggests that the mechanism by which the yarn supports the
torque changes at that point and that a new model must be
sought in order to calculate the torque. The various elements
of the calculations will now be discussed.
1, Material Properties
The critical material parameters are the moduli of elasticity
in tension and in shear. These have been taken from the
high temperature stress-strain curves as described earlier

434
FIGURE 19
EXPERIMENTAL AND CALCULATED
VALUES OF TORQUE (134°C)
-5 - t - -2 - O O 2 3 4 6
OVERFEED %
TORQUE
-b 10')
ZONE
ANCE
(in-
zo
I 6
I
lo
8
44
ZONE
~'ZyzlIk2~
-6____ _ _._ __ _______ __._ __
5
3+ A

135
FIGURE 19'
EXPERIMENTAL AND CALCULATED
VALUES OF TORQUE (210°C)
EXPERIMENTAL HOT ZONE
_.. .. .. -EXPERIMENTAL ENTRANCE ZONE
-C * -3 -2 -I , i i 3 4 5 6
OVERFEED %
TORQUE
105 )(in-1
36*
3z,
30
28
24'
22
20
18
16
I0
6 ,
4
-6 -!-6 -5_ _ _ _I_
?

136
(Section V. (b) 4.). These curves are non-linear and the
moduli are thus a function of the strain. The unstrained
state for each processing temeprature corresponds to the
freely shrunk yarn at that temperature. The moduli of el-
asticity are much lower at the high temperatures than at
room temperature. Again, for the pertinent calculations,
the compressive modulus was taken equal to the tensile
modulus and G was taken as E/12.
Two points should be made at this time:
(i) The assumption G = E/12 may underestimate G, if G
depends on temperature only. As the temperature is increa-
sed, the orientation of the material decreases as shown in
Table I, and its behavior becomes more rubberlike, so that
G should tend to E/3 as the melting point is approached.
However, computation of the torque contributions due to
filament bending and torsion (with G = E/12) will show
them to be negligible compared to the contribution from
tension. A tripling of the value of G will not affect this
conclusion. Even if stress relaxation does not intervene,
the bending and torsional filament contributions play a mini-
mal role in supporting the total torque, if the behavior
of the yarn is elastic and remains so throughout the whole
heater zone.
(ii) It is conceivable, however, that the mechanical pro-
perties, and, in particular, the bending and torsional rigi-
dities, may change with time of heat treatment as new order

develops within the fiber. Arthur and Jones found(R20)anddevelops within the fiber. Arthur and Jones found and
Morris and Roberts R21) confirmed the necessity of a minimum
residence time in the heater if the crimp rigidity and the
quality of crimp were to be at an acceptable level. The
present work does not take this possibility into account.
2. Torque from Classical Yarn Mechanics and from
Equal Filament Tension Contributions
These two methods were reviewed earlier in the discussion of
the calculation of the torque for the entrance zone; appli-
cation of Equations (30) and (65) to the experimental con-
ditions in the heater zone gives results (presented in Table X)
which seriously underestimate the torque at high overfeeds.
This is not surprising as the physical phenomenon that occur
in the heater zone (namely, a sudden twist increase as the
temperature of the yarn is abruptly changed) cannot be re-
presented by the simple physical model on which this deriva-
tion is based. A more realistic physical model is necessary
3. Torque due to Overtwisting
The mechanics of overtwisting (or uptwisting of the yarn with-
out allowing for filament migration) have been analyzed in
Section V (c). From the physics of false-twisting, it is known
that yarns being processed in the false twister are twisted
to a high degree before reaching the heater and that consid-
erable friction exists between the filaments at that stage:

138
therefore, on uptwisting in the heater where the yarn softens
and the interfilament friction increases because of better
wetting and more contact between the filaments) the filaments
will not be able to migrate freely, and overtwisting will
take place.
The torques due to overtwisting were calculated and are re-
ported in Table X. The torque calculations require a number
of steps: these are outlined in the paragraphs that follow,
while a detailed example of calculations is given in a later
section.
To calculate the torque, we use in principle, Equation (39)
which, however, requires knowledge of Pl, the twist before
overtwisting, p3, the twist after overtwisting and extension,
F, the amount of extension after overtwisting, and the ten-
sile modulus, E2. Now, P1 and p3 are the twists in the
entrance and heater zone and can be obtained from the experi-
mental data (Table V), but F has to be calculated. To ob-
tain F, we use the tension equation for overtwisting (Eq'n(36))
the experimental values of tension, T, and modulus, E2,
earlier determined in the section on the tension calculation
(Table IX). We first relate F to f, the average filament
strain, via Equation (42), and then use Equation (36) relating
F to the yarn tension T and to the modulus E2, and solve for F.
Having obtained F, we compute f, the average filament strain.
via Equation (42), and compare it to the value of F2' corres-

139
ponding to the value of E2, which was used to determine F
in the first place. If the two do not agree, a new value of
E2 is chosen and an iteration performed until the value of
modulus used corresponds to the value of f or f obtained
through Equation (42). An example of this calculation is
given in the next section and it includes the various com-
putational steps in full detail. It should be emphasized
that this method of obtaining F does not involve any approx-
imations (other than any assumptions made in the derivation
of the equations).
Having determined the value of F, we now proceed to calcu-
late the torques and add the following refinement to the
calculations; since the stress-strain curves are non-linear
the moduli will vary depending on the filament portion in
the yarn; since the component of yarn stress is multiplied
by the moment arm, the external filament will contribute more
to yarn torque by virtue of their position. To get the best
possible estimate of the torque, the moduli corresponding to
the appropriate value of strain should be used. To that effect,
the yarn cross-section was divided into concentric layers, or
zones, each the thickness of a filament diameter and each
accomodating a number of filaments in accordance with the
teachings of yarn geometry(Rl): in our case, (150/34 yarn)
the core accomodates a single filament, the second layer, 6,
the third 12, and the last, or outside zone, 15. The zones are
characterized by the cumulative percentage of the fibers con-

146
tained in each. Thus, the last zone contains 15/34=0.4412
of the total filaments and in the cumulative notation
(introduced earlier in Chapter II, Equation (7)), it is
characterized by the range t =0.56 to =1.
In Section V,(c) 5., Equation (46), it was shown that the
strain in any part of the yarn (within any given limits)
could be related to the yarn extension ratio F, and we use
this equation, given F, to calculate the strain in each
layer. Next, from the strain and the high temperature,
stress-strain curves (Figure 6), we determine the modulus,
and these 4 moduli (actually 3, as the core was ignored)
were used to calculate the torque in each layer, or zone,
using Equation (47). The sum of the torques of all the
layers was then taken to be the torque of the yarn and was
reported on Table X. While Table XI gives a detailed break-
down of the torque components, a detailed sample calculation
is given at the end of this section. See also Fig. 20 and 20'.
4. Discussion of the Data
As earlier discussed, the agreement between the experimental
values of the torque determined in the entrance zone, and in
the cooling zone (a surrogate for the torque in the heater
zone) is satisfactory. The values in the heater zone are
consistently higher than in the entrance zone. This may be
a consequence of the experimental technique of mounting the
specimens on the torque measuring apparatus, which may affect
much more the entrance zone segment (which is very twist-

(41
c)cla " r�aomvlol=
mor-oN
$E o r cl
a*u! In o s�I� " " ,
o,UNI · �
WC1 I � N rloel ID m mBE " "
rlZNI · C
O1 9�N rl Ln
olwwI Io ID r-*zi�01 ri o NONI · rl N
9 - · - -O��CIN
� 0 r- n N
gg
9 n nCII 0 v, P-ZZI o oWOI · aJUNI O r( O
WclP��OBP " "�ol · oo rlZNI o n
r-*I n v,
OIWWI o in*ZI o n
or rl
a�or-�nln
0 mrIoru1, rn oh��aw o
%1$6 , , ,,
9cwi 0Z;� oUN
Cm IIoz o r rug o �rN rl O
WZN
r-a mr N
W��o �oz�oo"ka ,,, o
ON Y) rl
aT I�
r 1 Nr-ooor N mOlP1 (O
zro rl
k/g� " " N�oln�I
r-
z Zrw m 9�clg,,
rlN rlU ON P. O
Xb IoW
W(Z I� I rlow rn 0 rl
m� oz rl 0 in14 ng o ·vlc ENI · rl N
> o
an�N0 WW n m o
u rz rl8 alo"NO "a 0 rlOr
clo Icl I r( rl 01
w a " m 0 o 0
n���n
3w rl
S , N
urw n n oo
a P N OO WO r( O,r0 UN OrZ; Wa oI o
�w oct 'o o N
% *" " "ZN r. rl
U r(j P N O \Dww rl Il 0*Z r- 0301 n r NON( · N rl
9 mp1001om��oN mOVIes9 O m� N�D
el51 a ,�lcol r- Io o
ttl oI 0 rw01 o r o
+lurul . n
[t: a3owl m P NoZI OI VI U1HOI o IDINI · vi
ula I m n n
oo wwir3� o NO IDNIONI · rl m
. I.,
I
I Is

FIGURE 20
CALCULATED COMPONENTSOF TORQUE IN THE ENTRANCE
ZONE AT 210 C (UPPER LIMIT)
TORQUE
in-lb, 1 05
i
I
ii~~~~'
i
II~~~~~
l
f 4
4
a
"'6
I -
. a- 2

FIGURE 20'
CALCULATED COMPONENTS
OF TORQUE IN THE ENTRANCE
ZONE AT 1340C (UPPER LIMIT)
0
(TENSION)
0-
(TORSION)
(BENDING)
OVERFEED %6 'I 2 2-itUn
TORQUE
in-lb -10
3I
28
14
lto120
18
I 6
I ItI
II
10
8
U
I
- 4 -6 4
I
w
I
,/I
Am
,
.
2 6 -

144
lively) than the cooling zone segment (which, for all intents
and purposes, is a solid rod). The test speciments are un-
avoidably disturbed, when, after mounting the yarn cardboard
assembly on the jaws of the machine, the cardboard is cut and
removed in order to allow the torque to register (see experi-
mental technique in Section IV(b)). The difference could
also be due to some additional relaxation that may take place
in the entrance zone.
To illustrate, Figure 1 represents the torque decay curve of
a yarn, twisted statically to the same basic twist, and under
the same tension as the yarn processed in the false twister
at 1340C and -6.67% overfeed (Tables V & X). The twist in-
sertion (240 turns in 5.8 inches of yarn under 75 g tension)
took approximately 3 minutes, and the relaxation readings
were started immediately after that, without removing the
applied tensile stress; thus the relaxation is due to the
bending and torsional components of the torque only. The
data clearly shows that the relaxation rate is such that the
torque decay not only occurs during the 15 minutes or so that
elapse between stopping the machine and actually testing the
specimen, but that it must also occur in the entrance zone
in the course of false-twisting. The residence time in the
entrance zone is of the order of 30 seconds in our equipment;
in commercial equipment where speeds are considerably higher,
the relaxation that occurs in the entrance zone is doubtless
much less. One consequence of the long residence time in
our equipment is that (since part of the components that

140
o I
0oI- o\o I
4) 10 I NI I I '
) N I.rnr .'a1 (1) 0 ' a ' 4-QH(n 1 4
I 0)
Ei ~ ~ ~~-1iU uH H
Eq
H O
E-4000
0Z /rHE-1i
EHx I 0-H0 1 Eq,,_ I||&_
UI4I I I
O00
00(O
00
I80o00
00
o000
In
00'000oI004
000
LIM I1 04

146support the torque relax) the twist must increase rather than
remain constant along the entrance zone.
With reference to Figure 2t , note that the torque is higher
for the statically twisted yarn than for the false-twisted
yarn. This is no doubt due to the fact that the twist inser-
tion mechanism is different for the two yarns (R22); static
twisting, which is really continuous uptwisting, impedes
migration, and leads to higher torques than false-twisting
where the yarn is formed in one step to its final twist.
In comparing the calculated with the experimental data, in
Table X, the calculated values are in good agreement with
experiment. The calculated values are in general higher than
the experimental values; the one exception is the experiment
at 134°C and -6.67% overfeed, where difficulties were en-
countered in measuring the torque. As earlier explained,
undoubtedly some relaxation occurs in the 15 minutes that
elapse between stopping the machine to collect the yarn speci-
men and the moment when the yarn torque is actually deter-
mined.
Another reason why the calculated torque in the heater zone
is higher than that measured in the cooling zone is that,
although the model used to calculate the torque excludes the
possibility of any migration occurring at the heater zone,
work by W. L. Yang (R 8 )demonstrated that some migration does
indeed occur, though it was not possible to quantify the

191amount. This additional migration undoubtedly mitigates
somewhat the effects of overtwisting.

18(d) Example of Calculation of Torques (210°C -6.67%)
To illustrate how the calculations pertinent to the values
presented on Table X were performed, we go through the
computation of the torques for the case of 2100C and -6.67%.
1. Entrance Zone
(i) Torque due to Tension
The relationship between tension and torque is for the case
of equal tension on all filaments:
T Ap2 (Ap + 2) - (65)
P2 ln(Ap2 + 1)
In our case, experimentally T = 47.5 g, p = 40, 6 x 2 x =
2 2255.10 rad/inch and A = Wf2/2k. We take W=34; f is calcu-
lated from the denier definition f2 x p x 9x10 = 150/34,
2 -6 2 -7 2whence f = 1.1307 x 10 cm = 1.7526 x 10 in k=0.8.f
Thus, A = 3.7242 x 10 6 and Ap2=.24235. Replacing these
quantities in Equation (65), we get MTE= 10.20 x 10 5 in-lb.
(ii) Torque due to Bending
The expression for this torque is
MBE - T 21n(Ap 2 + 1) - p(Ap 2 + 2 (22)BhE -fp CAp2+ J1Substituting the value of E = 1.91 x 10 psi for the modulus
(Table I) and the other values as in the calculation just
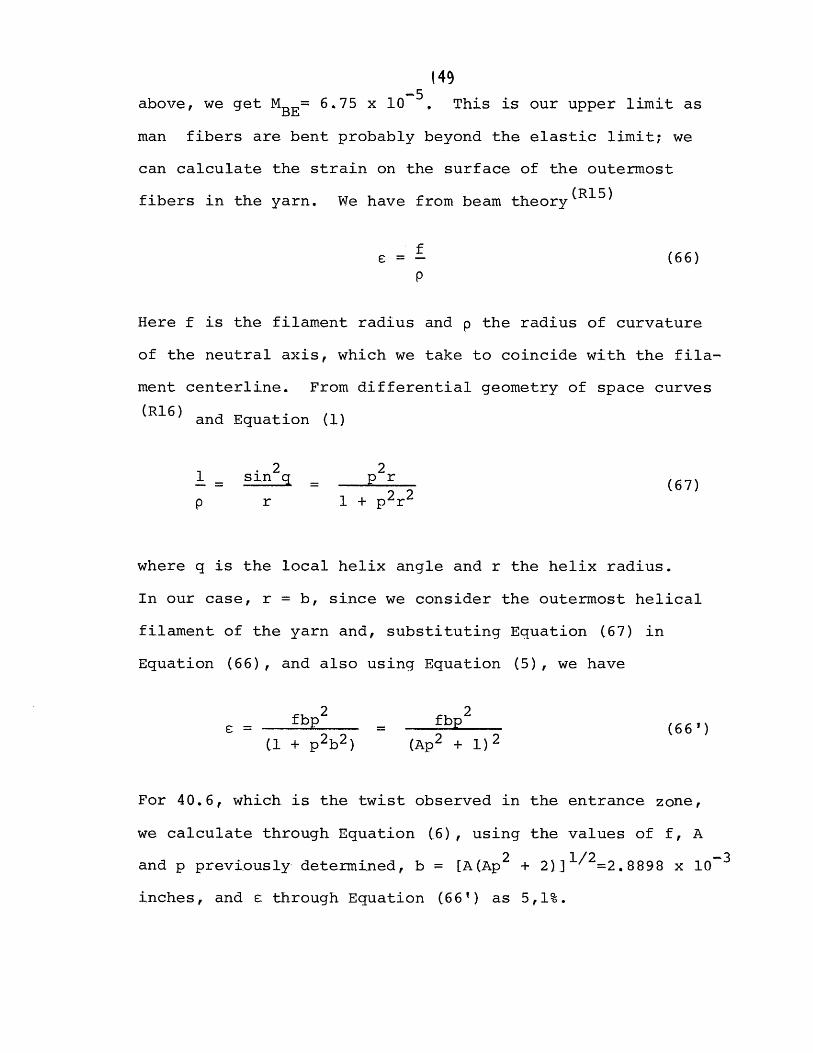
(49-5
above, we get MBE 6.75 x 10 . This is our upper limit as
man fibers are bent probably beyond the elastic limit; we
can calculate the strain on the surface of the outermost
fibers in the yarn. We have from beam theory(Rl5)
£ = - (66)
Here f is the filament radius and p the radius of curvature
of the neutral axis, which we take to coincide with the fila-
ment centerline. From differential geometry of space curves
(R16) and Equation (1)
1 = sinq p r (67)
p r 1 + p2r2
where q is the local helix angle and r the helix radius.
In our case, r = b, since we consider the outermost helical
filament of the yarn and, substituting Equation (67) in
Equation (66), and also using Equation (5), we have
2 2£ = fbp fbp (66')
(1 + p2 b2 ) (Ap2 + 1)2
For 40.6, which is the twist observed in the entrance zone,
we calculate through Equation (6), using the values of f, A
and p previously determined, b = [A(Ap2 + 2)] 1/2=2.8898 x 10- 3
inches, and through Equation (66') as 5,1%.

ISD
This is clearly outside the Hookean range (which ends at
about 0.7% extension) and the secant modulus at 5.1% is
only 42% of the original value of 1.91 x 10⁶. So, an absolute
lower limit for the bending contribution is 42% that of the
value originally calculated, or 2.84 x 10 . The range with-
in which lies thus, the bending contribution is 2.84 x 10 5
to 6.75 x 10 5.
Note that we have assumed throughout that the bending modulus
equals the tensile modulus. This is probably not true at
larger strains, and we thus have an uncertainty about the
value of the compressive modulus.
(iii) Torque due to Filament Torsion
This is given by Equation (26), which after the substitution
G = E/12 becomes
kGf Ap (Ap2 + 2) (26')
24p (Ap2 + 1)2
Using the numerical values given above, Equation (26') gives
MTO = 4.84 x 10- 5 in-lb for E = 1.91 x 10⁶ psi Cupper limit)MTO =
and 2.04 x 10 5 for E = 0.42 x 1.91 x 106Ccorresponding to the
outer fiber lower limit)). Note that we have always assumed
G=E/12. Though we do not know the stress,-strain curve of the
filaments in torsion, the dependence of G on E hopefully, para-
llels the change of G with torsion or filament twist. The
values calculated above are given in Table X.

I Si
2. Heater Zone
(i) Torque due to Tension-Equal Tension on all Filaments
2We use the values of Ap = .4184 with p = 61.6 tpi, or
387.044 radians per inch and tension T = 47 grams, given in
the numerical example of the tension calculation (Section VIII,
(b) 5) We use Equation (65)
T Ap2 (Ap2 + 2) = 12.00 x 10⁻⁵MTE = - = 12.00 x 10
p 2 ln(Ap 2 + 1)
This equation implicitly assumes that the modulus is inde-
pendent of strain;-we know, of course, from Section IX, (c) 3.,
that this is a physically incorrect model.
(ii) Torque due to Bending
We use here the same values of A and p as above. We assume
the modulus to be constant and equal to E2 used in the tension
calculations, and the same is true of f . However, here k=l.
We use Equation (22)
_ Eff 2I 22 (A2 + 2)
BE 4p (Ap2 + 1)2
-.50295] = .133 x 10-5
It is, thus, negligible compared to the actual torque. The
torque due to filament torsion is equally small and is calcula-
ted the same way using G = E/12. Some values for MBE and MTO

152
are reported on Table X
(iii) Torque due to Tension-Overtwisting
This is computed in various steps, and we shall illustrate
them in their proper sequence.
(1) Establish Relationship Between Average Filament
Strain and Yarn Extension Ratio
That expression has previously been given as
f = +- = F F(1 - m) ln(mAp2 + 1) (42)
m m2Ap2
2with p=p3, m=(Pl/p3) . The quantities A and p are as above,
2m = (39.6/61.6) = .413265; hence, we get after substitution,
Af = 1.1119F.
(2) Determine the Actual Value of F Using the Over-
Twisted Stress-strain Curve
The Stress-strain curve is
T F ln(Ap2 + 1) - ln(Ap + 1).2~kE pl2 p3 2
We use the experimental values of T and E2(from tension cal-
culations, numerical example) as well as the experimental values
of Pi and p3, and solve for F; given F, we immediately obtain
Af. We now check the modulus (from the hot stress-strain
curve) corresponding to that value of 1f 1 + f). It should
be the same as the experimental value of E2, If it differs,

153we iterate, i.e., chose a different value of E2 to solve
the tension equations and obtain F and f. We do so until
the value of E2 chosen to use in the tension equation is the
same as the value which corresponds to f obtained after
solution of the tension equation. An alternate method would
be to express analytically the dependence of E2 on Af (or f)
and to include this as an additional equation in the cal-
culations. We would, thus, have
f = fl(F) = 1.119F the first relationship we established
F = f2(E2, and T, Pi, P3) the overtwisted stress-strain
curve of the yarn
E2 = f3(Lf) the high temperature stress-strain curve ofthe filaments,
and with the three equations, we could solve for the three
unknowns Lf, F, and E2. The reason this was not done is that
the analytic expression, E2= f3(Af) would be a polynomial
which would complicate the calculations considerably. The
experimental curves could, of course, be fed into a computer,
and the computer would then solve the three equations numeri-
cally by an iterative procedure as was done here. The impor-
tant thing to notice is that these methods are equivalent,
and that there is no simplifying assumption involved in
solving the equations and determining E2, f and F by the
method used here.
Note, however, that in a physical sense, this derivation uses
the concept of the average strain just like the tension equa-

i S4
tions did.
Returning now to the tension equation (stress-strain curve),
we chose T = 47.5 and E2 = 20394 (corresponding to 2 = 34)
from the data on tension determination. Solving the stress-
strain equation for F with these values results in F = 1.216
and f = 1.3524. Notice that the agreement between the
"starting" f (.34) and the computed Af 1 + f (1.3524) is
good. Nonetheless, we shall seek a better value by iteration,
for illustrative purposes. Let us choose E2 corresponding
to = .345 in lieu of .34. We now go to the high temper-
ature stress-strain curves (which are expressed in grams
vs. strain), and correct the value of E2 (expressed in psi)
by multiplying by the "modulus" R 34 5 expressed in
grams/strain corresponding to = .345 and dividing by the
"modulus" R 34 expressed in grams/strain corresponding to
£ = .34; this is, thus, a dimensionless correction factor.
This is a simpler computational technique than converting
the "modulus" R in psi, but otherwise equivalent to it..345
We assume, of course, no change in the cross-sectional area
of the fiber. Thus, the new E2 = 20394 x R 3 4 5 /R 34
20394 x 59/34.5 x 34/55 = 21560.
Using this value of E2 in the stress-strain equation, we
obtain F = 1.199 and = 1.334, or 2 33.4%. We can sum-fmarize te results
marize the re-sults- as follows
Assumed T2 and corresponding E2 s2 calculated by solution
of stress-strain curves
using values at left
.34 20394 .35
.345 21560 .334
Clearly, the sought after value is intermediate between the
chosen ones. We choose = .342, corresponding to a modulus
E2 = 20334 x R /R = 20394 x 57/34.2 = 21012 psi. With
that value of the modulus, the solution to the stress-strain
equation yields F = 1.2072, or Af = 1.3423 which we accept
as a close enough approximation. Thus, the correct value of
F is 1.2072, which expresses the amount of extension the
yarn has "suffered" after overtwisting at constant length.
Notice that the value of strain, 2, and modulus, E2, which
satisfies the overtwisting stress-strain equation is very
close, indeed, to the value which satisfied the tension
equation; this lends further support to the consistency of
the model.
(3) Calculate the Strain and Modulus in Four Con-
centric Layers of Yarn
As earlier discribed, the yarn was divided into four layers:
a central core (first layer, 1 filament), the second layer
(6 filamentsr, the third layer C12 filaments) and the outer
layer (15 filaments}. Each layer, thus, contains a given
percentage of the yarn filaments. The strain in each layer
has been calculated and is given by the expression

156
Ai i+= 1 + ciri+l )
T F' ii _______ (-ImAp20Exr:l) l i~l I (46)£i = 2 + F2 1) inf 2 (46)
i'i~l Im J i,i+lm2Ap2 +mApp i + 1
where ii +ll = ii - .i is the percentage of fibers in
that layer, and i+l and i define the upper and lower limits
of the layer in a cumulative way. Thus, for the outer layer,
~3,4 = 15/34 = 0.44, and 4 = 1, and 3 = 1 - 0.44 = 0.56.
Replacing these values in Equation (46), using the value of
F calculated in the previous section (and the same values,
of course, for m, A and p), we obtain 3 4 = 41.34% as the
strain (relative to the equilibrium freely shrunk yarn at
that temperature) in the outer layer. For the third layer,
*2,3 = 12/34 = 0.35, with 3 = 0.56 and 2 = 0.21; we obtain
c2 = 31.54%. We now group the central filament and the2,3
first layer together and calculate the strain C0,2 = 23.81%
To each of the three strains there corresponds a modulus E2,
and these are calculated exactly as in the previous case
using as base the modulus E2 = 20394, corresponding to a
strain of .34 and corrected by the ratio of the moduli
R 4 13 4/R R 31 5 4/R and R 23 8 /R 34' These values are
Outer zone s = 41.34 E = 33181 psi
Middle zone = 31.54 E = 15931 psi
Inner zone s = 23.80 E = 7107 psi

151
(4) Calculate the Torque in Each Zone and Sum it
over the Cross-section
We use Equation (47) and calculate, using the values of
A, p,m,~,I and E derived above:
Torque in outer zone 16.32 x 10⁻⁵
Torque in middle zone 2.51 x 10- 5
Torque in central zone .14 x 10
TOTAL TORQUE 18.98 x 10⁻⁵ inch-lb
The torque measured in the cooling zone was 18.74 in-lb
and that measured in the entrance zone was 18.12 in-lb.
(5) Comment on the Strain Levels
Since the equilibrium denier (or freely shrunk denier)
of the yarn is 194.445, the actual deniers in zone 2 and
zone 3 of the overtwisted yarn are predicted to be
e 194.445Outer zone e = 137.6(1 + 2) 1.4134
Middle zone 194.445= 147.821.3154
194.445Central zone = 157.06
1.2380
Thus, relative to the starting denier of 150, the outer
filaments would decrease in denier by 9%, while the central
filaments would increase in denier by 4.5%. This strain,
however, need not extend over long sections of the filaments,

as the filaments in the entrance zone have migrated radially
and only a short section of a given filament may find its way
at any given yarn position on the yarn surface. Thus, the
denier variations may be over extremely short intervals and,
the only way to discern then would be to make successive
microtome sections of any given filament and measure the
variability in cross-sectional area. Another possibility
about which there are no published data is that when the yarn
is overtwisted though radial migration is prohibited,
longitudinal migration may still take place to minimize denier
variation along a given filament.
X. DISCUSSION, CONCLUSIONS AND RECOMMENDATIONS FOR
FUTURE WORK
(a) Discussion
This work has focused on the operation of false twisting
and had as an objective to understand the physical basis
and to analyze the mechanism of steady-state false twisting,
and to evolve a model for the process. There are actually a
number of distinct aspects of the process one must understand
which, however, are highly interdependent.
Cl) The first, and most accessible, is the phenomenological
analysis of the. fundamental actions of the machine. Thus, for
at least the simple machine we have in the laboratory, it is
a good assumption that the tension and the torque are constant
along the threadline, and that the machine inserts a number

IS,of turns of basic twist, controlled and predicted by the
ratio of the spindle rpm to the (untwisted) yarn take up
velocity; a small correction need be applied to account for
the yarn extension in the exit zone. Further, the actual
twist at the spindle depends only on the basic twist and
seems largely independent of tension under steady-
state conditions.
(2) The next topic to be understood is how the yarn re-
sponds to the process which is one of torsional and tensile
non-isothermal creep; in other words, what are the mechanics
and mechanisms of yarn deformation in this stress field?
(3) Inextricably related to the mechanism of yarn response
is the problem of the determination and knowledge of the
material properties. The yarn, after all, responds to a stress
field, while the machine actually imposes a strain (through
overfeed, temperature and twist), which is "translated"
into a stress through the material properties. To illustrate,
under identical machine conditions, two yarns of the same
count, but of even slightly different material properties
(such as Medium and High Draw ratio PET) will respond differ-
ently.
(4) Finally, one must consider what is really the ultimate
reaction of the yarn to the false-twi.st process; in other
words, the setting quality of the yarn. The specifics of
this interaction and the molecular mechanisms involved are,
thusr another important part of false-twist texturing

160
The present work addressed itself to points C1), (2), and (3)
but did not touch upon point 4). Other workers(R23,R24 )
have been concerned specifically with point 41. Concerning
(31, the fact that many material properties (in bending and
torsion) were not easily measured,
and that all material properties change
along the threadline, made it impossible to assign unequi-
vocal values to the various moduli; also, the properties that
were measured (the high temperature stress-strain curves, and
the stress-strain curves of the feed and textured yarns) were
non-linear, which complicated the computations. Consider
what happens during the course of false-twisting to the fiber
structure along the threadline:
Entrance zone: Immediately after the yarn is formed, bending
and torsional contributions to torque begin to relax, so that
the twist should increase; the threadline tension leads to
tensile creep which also leads to twist increase.
Heater zone: All moduli decrease significantly; the bending
and torsional strains become negligible compared to the tensile
strain; this last is controlled by the overfeed and the equi-
librium denier which the unrestrained yarn would shrink to at
the particular processing temperature. The modulus decrease
and the shrinkage are due to the partial breakdown of the ori-
ginal structure and orientation. Concurrent with the dis-
ordering, there must be an ordering phenomenon, or gradual re-
crystallization in the new geometry, which must result in an

161
increase of the bending and torsional modulus; that, of course,
is the essence of setting for a crystalline fiber.
Cooling zone: With the temperature decrease, there is a
concomittant increase in the modulus in tension as well as
bending and shear, Thermoelastic phenomenon due to the non-
crystalline regions may become manifest at this point. Even
if setting has not occured by rearrangement of the molecular
structure in the heater zone, cooling below the glass transi-
tion would result in setting, albeit of a less permanent
nature.
This continuous change of the material properties makes it
very difficult to know the correct values of the moduli at
various positions of the threadline; we have assumed in the
calculations that the moduli measured experimentally cor-
respond to the initial part of the entrance zone, the ini-
tial part of the heater zone and the last part of the cooling
zone; we have also assumed that the twist does not change be-
yond the heater zone, and that it is constant in the entrance
and in the heater and cooling zones.
(b) Conclusions
The conclusions we draw about the process are that it imposes
a certain twixt and a certain strain on the filaments; the
strain level is controlled by the overfeed and the temperature,
this last controlling the level to which the yarn would have
shrunk if unrestrained. At constant overfeed, the higher the

162
temperature, the higher the strain; it does not necessarily
follow that the tress is also higher because the modulus
drops with temperature, while the stress-strain curves at
elevated temperatures are non-linear. So, the tension level
cannot be predicted without a riori knowledge of the material
behavior at elevated temperatures. With the yarns used in
this work, the tension was found to drop at constant over-
feed, as the temperature was increased.
The tension level was calculated assuming simple yarn geometry,
i.e., assuming that the yarn in the heater zone was formed
stressless in all filaments and was then extended; the average
filament strain in the heater zone equals the strain imposed
by the machine. This strain then leads to a filament stress
(the level of which depends on the high temperature modulus)
and to yarn tension. The experimental results are in agreement
with calculated values of tension.
The machine also imposes a torque on the yarn; that torque
is constant from the entrance rolls to the spindle, and is
supported in the entrance zones by contributions from fila-
ment bending moment, filament torsional moment and filament
tension; at the heater zone, the contribution from bending
and torsional moments. becomes negligible, and the torque has
to be supported by tensile contributions only. Since the
modulus drops, the yarn must twist further to balance the
torque, and this is the fundamental reason for the uptwist

163
observed at the spindle. Now, as the overfeed is decreased
at constant temperature and constant (basic) twist, the
tension, as earlier explained, must increase, and since the
basic twist is the same at the higher stress, the torque is
higher; this is manifested by an increase in twist at the
entrance zone, which results in a smaller twist change at the
heater.
The twist increase at the heater takes place by a mechanism
referred to as "overtwisting", where migration is forbidden
and the increase in twist occurs by increase in the helical
path of the filaments in the yarn; at the same time, the
yarn is extended so that tho overall effect is one of uptwisting
and extension. The equations for tension and torque on over-
twisting have been derived, and the torque calculated on the
basis of these equations, using experimentally determined
values of tension and twist agrees well with the torque values
measured experimehtally (within a range of uncertainty due to
imprecise knowledge of the material properties).
Thus, the elucidation of the mechanism of false-twisting has
been achieved, and a model has been proposed to account for
the measured tension and torque. The results of the calcu-
lations with the model are in reasonable agreement with ex-
periment.

164
(c) Recommendations
There are, of course, many questions that remain unanswered
and many aspects of false-twist texturing that have not been
investigated. In the writer's opinion, among the topics
that merit further research are the following:
(1) Investigation of unsteady-state situations, such as a
sudden change in threadline tension or spindle rpm. In view
of the practical importance of these phenomena (they lead
to barre effects in goods knitted from textured yarns), it is
important to understand how the system adjusts to step changes
and by what mechanism the yarn responds, Another type of
transient disturbance occurs when real twist in the feed
yarn, which had been stopped by a guide, escapes from the
guide, and passes through the machine.
(2) Even for the steady-state situation, a more detailed
analysis may be in order; for instance, a careful analysis of
the twist distribution and twist increase in the entrance zone
is necessary in order to assess the effect of relaxation of
the bending and torsional strains. Even then, the problem
may be complicated by the fact that the torsional rigidity of
the yarn is much higher immediately after it has been formed;
so that a twist change, because of the inhibiting effect of
the interfilament friction-and absence of migration, may not
accurately reflect the corresponding torque change.
C3) Detailed studies and measurements of torque under dif-
ferent twisting conditions are needed to obtain better insight

165
into the twisting and uptwisting mechanisms at room and at
higher temperatures; the interrelationship between torque
level, twisting mechanism and migration should be investigated.
(4) The interaction between the pin and the yarn should also
be examined more extensively, and the. effect of the yarn finish
assessed both on the tension level and on the ability of the
spindle to transmit torque without twist escape.
(5) Better information concerning material properties is
badly needed. The behavior of fibers in bending and torsion
at various temperatures is not known; the effect of combined
stresses on the behavior of the filaments is not known. Pro-
perties of the fibers in compression, both axial and lateral
(the latter becoming important when the yarn is over the
heater),at various temperatures must be determined. The break-
down and subsequent restructuring (at high temperatures) of
the molecular architecture and its effect on the quality of
setting should be investigated.
(6) No mention was made in this work of texturing processes
such as draw texturing and friction twisting. These, because
they offer economic advantages, are becoming increasingly
important commercially and are more recent developments than
false-twisting. The phenomena that occur in false-twisting
also occur in draw texturing, and an analysis of the process,
the elucidation of the drawing and flattening of the fibers
would be of considerable merit.

166
APPENDIX I
This Appendix contains derivations on various topics
of yarn mechanics, which, however, were not used in the
modelling of the false-twist process presented in the
main body of this work.

1 7
APPENDIX I
(a) Stress-strain and Torque-strain Expressions for Yarns;
Twist Varies with Extension
This analysis is identical as to assumptions and method to
that given in Sections V(a)2., and V(a)3., with the excep-
tion that it takes account of the twist change due to yarn
extension; it still assumes, however, as did the earlier de-
rivation, that the yarn radius remains constant in extension.
The difference between the two methods arises in calculating
the fiber strain, which is calculated as follows: In one
inch of yarn before extension, we have a filament length at
radius, r
2r2Z = 1 + p r
and to 1" of yarn after extension at constant radius, we have
= 1 + p2r22
where p pp' = = - (68)
1 + Cy F
where F = 1 + Ey is the extension ratio of the yarn. But
one inch of unstressed yarn becomes F inches after extension,
and the length of filament corresponding to one inch of un-
stressed yarn becomes, after extension
-' = F F + p'2r2 = F2 + p2r2 (69)2 2

168
Thus, the filament strain is
.2 + 2r2£ -- -1 = +pr
I l+prto h + p-r-(70)
Replacing Equation (70) and using Hooke's law, Equation (10),
in Equation (9) and integrating ith the substitutions
2 22 2 2 22z = 1 + p r and Z F2 + p r , we obtain for the tension
2 222 rkFaE + i
T in + 1 + in
~ + pb2 F + 1
Replacing Equation (70) and using Equation (10) in Equation
(27), and integrating with the usual substitutions, we ob-
tain for the torque:
2wrkEfF 2 2 2 22MTE = F + pb 2 )(1 + p2b2)uTE -
2p
+ (1 + F2 ) InI + F
F2 + p2b2 + 1 + p2b2
+F n 222b 2+ F2 in 1 + - F - p2b2
The symbols have all been defined above or in the
Sections IV and V(a).
i)
(72)
1:

169
(b) Stress-strain Curves of yarns assuming the Twist to
Vary with Extension and the Filaments to Extend at
Constant Volume
The derivation is identical to the one that precedes this;
the difference arises in calculating the filament strain:
The filament strain after yarn extension F is
F l 1 + p'2r'2Sf = - - - - 1 (73)f //1l + p2r2
(cf. Equation (70)) where p' = p/F (Equation (68)), and r'
is the radius of the yarn which locates a filament original-
ly situatied at radius r. To relate r' to r and F, we reason
as follows: We express the constancy of volume of a filament
as
of = rf' (1 + ) (74)
with f and f' the radii before and after extension, and -f
the average filament strain defined by Equation (16). Note
that we assume that all filaments are extended by the average
filament strain, and are, therefore, all reduced in diameter
as follows
f
f' = - af (74')
We also assume that the yarn radius changes as the filament
radius, and that the packing factor remains constant, so that

170
r' = af (74'')
Replacing Equation (74' ) in Equation (73) and Equation (73)
in Equation (9) and using Hooke's law, Equation (10), we
get after integration, with the usual substitutions:
1
T = 2wkE F /1 + lnp 2b22 2
+ (1 + p 2b2) + 1- + in (1 +/ 1/) (75)wt p) J22
with ~= (a/f)
The corresponding torque has not been calculated.

171
(c) Stress-strain and Torque-strain Curves of Yarns
Assuming the Twist to Vary with Extension and the Fila-
ments to Extend at Constant Volume
(Alternate Derivation)
As in case (b), we seek a suitable expression for of. Here
we make use of Equation (7) which identifies a filament of
fractional order , and we express the fact that the frac-
tional order of a filament in the yarn remains, of course,
unaltered by extension
= [/ 1 + p2r2 - 1 = + p'2r2 - 1Wf2 P Wf 2p 2
(76)
Simplifying, and rearranging we obtain
/1 + p2r2 = pi /1 + p·2rw2 + 1 - (76')
We abbreviate D fp/f'p' and using Equation (74') and
Equation (68), we substitute in Equation C73). Then using
Hooke's law and substituting in Equation (9), we obtain,
after integration
.F. F 2F 2f(2p 2 2T = 21kE 22 ln(Ap2+1)-2 ln(Ap +F )+ 2 lnF2 (77
wh 2 2where = D/F and A is given by Equation (4).
All the terms in Equation (77) are in terms of the original

172
parameters, i.e., yarn parameters before extension.
To obtain the torque, we substitute the strain in Equation (27)
also using Hooke's law, and we obtain for the torque, in terms
of the original yarn parameters,
M = kEF3 Ap2+) 2(l'D) (D-2F)+ (FD) CAp-2+1)fTE 3 2D2
+ F , 2D)ln(Ap2+l) + ln{ 3 J+1 -D D
D-3F-2D2+4FD1
2D2J
(78)

113
(d) Overtwisting at Constant Radius
This derivation differs from the one given in Section V(c),
in that we assume that we start with yarn of twist P1 which
we overtwist without contraction to 2 at constant radius
and then extend by F at constant radius to a final twist of
P3' To calculate the filament strain, we consider that a
filament at radius r in one inch of yarn prior to uptwisting
has length
1 = 1 + 1
After uptwisting and extension by F, a filament at radius r1
on one inch of yarn has length
9 2r 2
= /1 + P32rl
But, the filament now has length (because of the yarn
extension):
' = F = F 32rl23 3
hence, the filament strain is
3 F + p 2r 2f = - - 1 = - 1 (79)
! 9i 2+ 2rl21 1 1
We replace that in Equation (33) and we obtain, after inte-
gration, for the tension
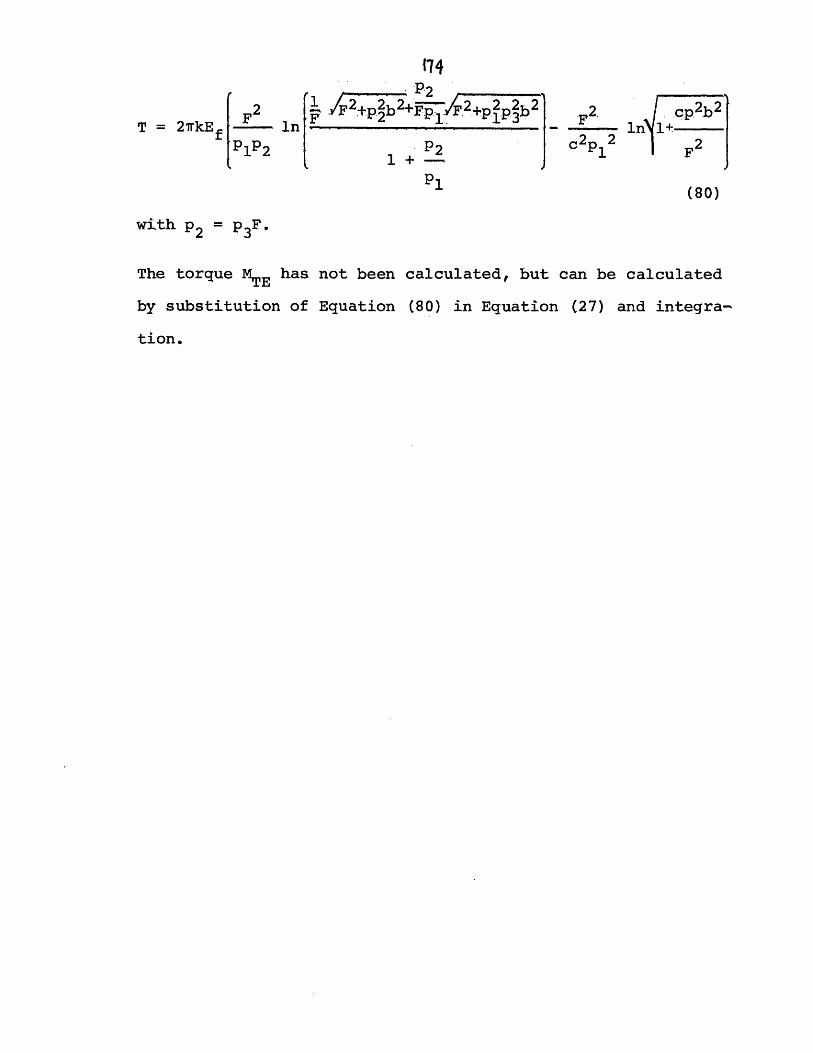
2
T = 2kEf -
.P1P2
714
ln. . 2- 2 2 I 1 -
1 +}2 c P1 2
P1(80)
with P2 = P3 F.
The torque MTE has not been calculated, but can be calculated
by substitution of Equation (80) in Equation (27) and integra-
tion.

I7S
(e) Mechanics of Yarn Shrinkage Due to Fiber Shrinkage
I We assume a yarn of twist .
which is suddenly exposed to
an environment where the fila-
ments would like to shrink (for
instance, temperature or sol-
vent). We examine the resultant
relationship between filament
snrinKage, yarn snrlnKage, yarn
tension and yarn torque. We assume that the yarn shrinks at
constant volume as a result of filament shrinkage, and we ex-
amine the strain in a given filament.
With reference to the sketch at the left, the fiber length
corresponding to 1" of yarn prior to shrinkage at radius r
is= + p1 r
1
The fiber length corresponding to 1" of yarn in the shrunken
state (state 2) is
= A + 22r222
Because the volume of the yarn remains constant, the radii
where a given filament is located before and after shrinkage
are related by
r2 = / r = r2 1Y
where F = 1 + sy is the yarn extension ratio, i.e., F = L1/L2.Y
I_

16Now, the twists are related by Pi = P2/F, and replacing
r2 and P2 in the expression for . we get1
1
Now, since the yarn has shrunk from F" to 1", the original
fiber length is
2
I' = Ft = F + 11 F3
So, as the yarn shrinks from L1 to L2, a given filament will
shrink from ,' to £1 2
Now, if the fibers had been allowed to shrink freely, and
if t is the percent shrinkage, then
= l+t
where eq is the (non-arrived at) equilibrium length of theeq
filament after shrinkage. Therefore, the strain on the fiber,
due to the fact that fibers have shrunk but have not attained
their true equilibrium length is
2 2. (.l+t) /i(l+t) p 2 2r 2 2+l2 2 (81)f 2. - 1 2 -1= - 1 (81)
eq 1 P2 r2 + F
The "stress-strain" relation for the yarn is obtained by sub-

111
stituting Equation (81) in Equation (9), and we obtain
after integration
T = nl+p2b2 + F3+p2b2 (82)
and the torque is obtained by substitution of Equation (81)
in Equation (27)
2kEf+t) F3 2 /l+p 2b2 (+F 3 ) n/F+pb 2
2p 3
p2b2 ln(l+p 2b2)+/l+p2b2 - + +F
/-(t) /F(l+t) (83)
In Equation (82) and Equation (83) p P2 and r - r2 so that
the expression for tension and torque are given in terms of
final yarn parameters (after shrinkage). Note also that Ef
is the modulus of the stress-strain curves of the filaments
during shrinkage.
The "contractile stress" of a yarn which results if we keep
the yarn length constant but generate the shrinkage force, is
obtained by putting F = 1 in Equation (82) and is
2ikE tT = ln/l+p2b2 (84)
t
The contraction which ensues if we generate the shrinkage,
allow yarn retraction but prevent any untwisting of the yarn,
is obtained by putting T = 0 in Equation (82) and solving
for F; explicit solution in terms of F is not possible, but
the expression is
-

178
(1 + t) =
v'Fln F f3+2b2
1in +p2b2 + 3+p2b2
Equation 85) has been evaluated for the case of a 70/34
Nylon yarn and the actual yarn shrinkage for a given equi-
librium fiber shrinkage are given below:
Sy =(F - l)% t% Yarn Shrinkage
fiber shrinkage
2.0
3.8
6.5
9.1
13.0
16.7
20.0
33.3
50.0
1.5
2,9
5.2
7.2
10.5
13.7
16.7
29 3
45.5
1.33
1.31
1.25
1.26
1.24
1.22
1.20
1.14
1.10
THus, the
for fiber
1.3 times
yarn shrinkage is higher than the fiber shrinkage,
shrinkages up to 10%, the yarn shrinkage is roughly
the filament shrinkage.
(85)
_ _ __ _

179
(f) Shearing Strains on Fiber Due to Torsion and Bending
1. Differential Geometry of Yarn
Reference is made to the MIT Textile Division Notes (R25)and
Hildebrand(R16) concerning differential geometry of yarns
and space curves. For yarns obeying ideal geometry, the
filaments are assumed to be in helices concentrically around
the yarn axis as illustrated in Figures 22 and 2 (R25)
The symbols have the following meaning: xl, x2, x3, are the
system of axes to which the helix (filament path) is referred
to; x3 is the yarn axis; r is the radius from the yarn axis
to the centerline of a particular filament of radius, and S
is the helix described by the centerline of the filament.
At any point P on S, the unit tangent t, unit normal n and bi-
- (R16)normal b , can be defined and are shown on Figure 22.
Additionally, n and b are, of course, perpendicular to t, and
their common plane intersects the filament as shown in
Figures 2Z , and 22'. Any point R on the filament circumfer-
ence can be defined by the angle that the vector dPR makes
with the normal (Idj=), Any point P or S is defined by the
radius vector 16)
X OP = rcosei + rsinej + recotqk (86)
where i,j,k are the unit vectors along x x2 and x3.
Any point R or the fiber circumference can be defined by the
radius vector

180
FIGURE 22
DIFFERENTIAL GEOMETRY OF YARNS
I
I
I
I
I
I
IIi
0
N

FIGURE 22'
DIFFERENTIAL GEOMETRY OF YARNS
0
0
01.
VI.
h
I
F Sin ) b
( cos )5 '
r,

4. -4. -.
TI- OR = X + rcos-O + rsinS + rcotqk
+ fcos1 + fsinb (87)
Substituting n and t in terms of the parameters of the helix
itself(R16) and introducing into Equation (87), we get
Y =( rcos - fcosecos + ninesinfcosq) + (rsin -
fsinOcos4 - f.cosOsinfcosq) + (rocotq + cosq)l (87')
2. Local Shear Strain on Fibers as They Lie in the
Yarn
In a twisted yarn, any filament at radius r and helix angle q
could have been brought to the same state of strain by
"wrapping" around a cylinder of radius r - f, at a helix
angle q. Since the fiber itself is a cylinder, each of the
generators of the (as yet unwrapped) cylindrical fiber will
correspond after wrapping to a given value of , which will
moreover, be independent of . Thus, on the generator corres-
ponding to the "inside" of the wrapped fiber, we will have
= 0, and on that corresponding to the outside, % = w/2.
The local shear strain on any point R of the fiber circumfer-
ence will be given by tan ,a being the angle between the
tangent to the generator through point R and the tangent to
the corresponding point P on the fiber center line. But,
tang =1 -cos/cos/cos and cosw is, by definition(R25) the
dot product of the unit tangents at R and P. We seek cost
as follows:

l83
From differential geometry (16 ) the tangent is defined
+ _dx 1+ dX T =- 1
de dO
and the unit tangent is
+ dx+ dX 1 +t = - = -
ds ds
dx2+ 3
dO
dX3 ++ k
d8
dX2dx2 -t+ -jds
(88)
ds k(89)
where X is any radius vector. It follows that:
t Td d dt = T - = (90)ds de ds
Applying Equation (90) to Equations (86) and (87) we get,
t -= sinsinq 1 + cosesinq + cosq kds
(91)
t_ d [ (fcosp - r)sinO + sinfcosqcose]ds
+ [(r - fcos)cose + fsin cosqsin]3
+ rcotqk (92)
with
.s inq
/(fcos~-r)2sin2q+f2sin2csin2qcos2q+r2cos2 q
(92')
As earlier mentioned, t t' = cosa and tana =/ -cos2a/cosa.
Hence, we get, after suitable substitutions:

fcosqtan = (93)
...- - fcossinqsinq
This indicates that the strain is non-homogeneous and depends
on ~. From Equation (1) we have
tanq = pr (1')
prsinqcosq = (1')
l+p2 r2
Replacing Equations (1') and (1'') into Equation (93)
and expressing tang as a local fiber twist so that
tana = PF f (1''')
where F is the local fiber twist in radians/inch, we obtain
pP= (94)F l+p2r2 - p2rfcos9
which expresses the local fiber twist in terms of the yarn
twist and the angle . A simplified version of Equation (94),
obtained by omitting the term in f in the denominator (the
quantity l+pr 2 being usually much larger than p rfcos) has
been given by Platt (R13) and was used earlier in the calcula-
tion of yarn torque due to fiber torque (Section V(a)3.)
PF tp (23) ,(94')F =l+p 2r2

Note that Equation (94') indicates the local fiber twist to
be constant around the circumference of the fiber (homogen-
eous shear strain).
As was shown in the sketch in Section IV(a) which dealt with
yarn geometry, the length of fiber of helix angle q, corres-
ponding to one turn of twist of the yarn is ST = 2rvf/p2`r2.
From the geometry of the "opened" yarn, we also have
S= 2r (95)sinq
Replacing Equation (95) in Equation 94), we get
f.cosqtan.a = - - (96)
T - fcosfsinq
2rr
referred to a constant fiber length corresponding to one turn
of twist. This expression allows us to predict what happens
to the strain if we collapse or straighten a filament. If
we collapse the filament into a loop, q = 90° , cosq = 0.
Hence, tana = 0, i.e., no shear strain or twist, since the
filament is now simply bent. Conversely, when we straighten
the filament without allowing for end rotation, q = 0, sinq = 0,
cosq = 1, and
tana =-- (97)
ST
orPFor radians (97
ST length ST

186
which corresponds to 1 turn of twist in the length ST.
3. Local Shear Strain on Untwisted, False-twist Fibers
We consider a yarn made of filaments all of which already
have some twist prior to being twisted into the yarn. In
this case, the angle is no longer constant for a given fila-
ment, but is a function of 8, = XO. Under these circumstan-
ces, tana is calculated as detailed in (R25) and its expres-
sion is identical to that given in (R25)
tana = fX + fcosq (98)
r - fsinqcosX8sinq
Note that in (R25), Equation (98) gives the local helix angle
of fibers in a single yarn as they lie in the ply.
If we how straighten the fiber without allowing for rotation
(q=O), we have, using Equation (95), i.e., with reference to
a fiber corresponding to one turn of twist
tana = 2rf( + 1) (99)
ST
or since tana = pFaf,
2r(X + 1) radians (99)
ST length STTT
If we now untwist the filament by one turn (2rr radians), the

18'the twist becomes
p, = 2(X + 1) 2w _ 2wX
ST ST ST
which can readily be shown to be the same twist as when the
filament is bent into a loop (q = 90°), using the simplidied
version of Equation (98); pF is, of course, the original
twist of the filaments.
Consider now a filament in a false-twist yarn, after setting
but prior to untwisting; we assume the setting to be perfect
so that by definition all strains on the filaments are nil
so, tana = 0. This means in Equation (98) that X = -cosq.
Now when we straighten the filament without allowing for
rotation, we have,.using Equation (99 ')
= 27r(1 - cosq) (100)
ST
and when we untwist it by one turn
P = -2cosq (101ST
which is the twist in the untwisted filaments of the false-
twist yarn; q is, of course, the angle of the filament in
the yarn prior to untwisting. The sign is negative because
it is in the opposite sense than the twist in the (twisted)
false-twist yarn. Clearly, the shear strain in an untwisted
false-twist filament is

I1A
tana = 2rfcosg 9 (101')ST
on the basis of which the shear strain energy can be calcu-
lated. The total strain energy must, of course, take into
account the bending energy and the tensile energy (if any).
Equation 931 can be simplified, exactly as was done with
Equation (94), by neglecting the term fcospsinq in the
denominator
tan = -sinqcosq (93')r
It thus becomes identical,except for the sign, with Equa-
tion (101'). Thus, Equation (101') says that the shearing
stress on an untwisted and straightened false-twist filament
equals the shear strain that the (originally untwisted)
filament would experience if it were twisted (without relax-
ation) to the final twist that the yarn is subjected to prior
to untwisting, assuming that all the twist is "set". The
twisted yarn, of course, never fully experiences this shear
strain, since the bending and torsional components relax at
high temperature. Because the moduli are much lower, even if
relaxation did not come into play the strain energy due to
shear at high temperature is much lower than the strain energy
corresponding to the false-twisted and straightened filament
at room temperature.
Tana in Equations (93') and (101') is directly related to
the torsion of the filament centerline in the twisted yarn.

189
APPENDIX I I
This Appendix contains review and analysis of various
papers from the scientific literature relating to the
false-twist process.

190
(a) INTERACTION BETWEEN MACHINE VARIABLES
1. The Work of Burnip, Hearle and Wray
In their paper, "The Technology of the Production of False-
Twist Textured Yarns", (R26,R3) these authors studied experi-
mentally the effects on other processing parameters brought
about by a change in the setting of one of them, as well as
the yarn properties as a function of various machine settings.
They conducted their experiments on a specially constructed
false-twist unit, equipped with a Falspin spindle (made by
Scragg) and a contact heater from the Scragg CS-1 machine.
The unit was so constructed as to allow feeding the yarn at
a controlled tension (by passing it through an adjustable
tension gate) or feeding the yarn at a controlled rate (by
interposing, after the tension gate, a pair of positively
driven rollers). The various machine elements were set suffi-
ciently far apart to permit insertion in the yarn path of a
tensiometer to measure yarn tension. The machine rpm was kept
constant at 45,000 rpm while the tension, the heater tempera-
ture and the speed were varied between wide limits. No provi-
sion was made for measuring yarn temperature. The yarn used
in these tests was 70 denier nylon 6.6.
Constant Tension Experiments
In this series of experiments, yarns to be textured
were fed into the machine at predetermined levels of tension;
this was done by suitably adjusting the setting of the tension
gate in the feed zone. The machine was then run, and tensions
at various positions in the yarn path were measured. The
data shows that:
1. Higher pre-tensions, i.e., imposed tensions
between the tension gate and the guide, lead, as expected, to
higher tensions upstream of the guide.
2. For a given level of pre-tensions, the run-
ning tensions are almost always lower the higher the nominal
twist. Some anomalies have also been observed which cannot
be readily explained; for instance, the yarn tension is seen
to drop across the heater; also the effect of the heater tem-
perature on processing tension is equivocal.
Constant Extension Experiments - Untwisted Yarn
On operating the machine on a constant extension, by
interposing a set of feed rollers between the tensioning gate
(and above the guide) and the heater box, a number of experi-
ments were performed. First, the authors determined (at negli-
gible pretensioning, but at variable overfeeds) the tension
developed due to yarn shrinkage, the so-called "contractile
stress"; in these experiments, the false-twist spindle was
removed and was replaced with a guide over which the yarn was
made to pass; the yarn was thus run in the untwisted state.
The tensions recorded are illustrated in Fig.23and are seen
to pass through a maximum as the temperature increases. The
authors also found that:
1. the friction yarn-heater adds approximately 7 g to

192
FIGURE 23
CONTRACTILE STRESS vs. TEMPERATURE
t I I l i I ! a I i0 t40 80 120 160
TEMPERATURE (C)
STRESS
(gpd)
TENSION
(grams
20
18
I'1 6
IZ
10
6.
2.
to
over teedc
QL I
0.30
0.26
O.t2
0.10
0.01ao i
0
I
6
10
A p
200 240 280
}

193
the tension for the case of the untwisted yarn. Note that
these results are the opposite of what they found in the
constant tension experiment.
2. As the amount of overfeed increases, the stress
maximum occurs at increasingly higher processing temperatures,
until, at very high overfeeds, no maximum is observed before
the sharp drop at the melting point. The authors anticipate
this maximum to occur at even lower temperatures, and the
higher in value for experiments run at negative overfeeds. At
2% underfeed, the tension was very high (35 g) and at higher
underfeeds, the (untwisted) yarn breakage was excessive.
The effects of pre-tension were also investigated at
room temperature and at 190°C and are as follows:
1. The higher the pre-tension the higher the tension
upstream of the feed rolls; at the high temperature, however,
this dependence is very slight.
2. The tension above the heater is higher than that
below the heater. This would be expected because of the fric-
tional drag of the yarn across the heater; as mentioned, how-
ever, it stands in contrast to the data found for constant-
tension processing. The tension ratio is independent of the
tension level. They also observed (and it is difficult to
understand why) that the tension below the heater is often
lower than the pre-tension.

194Constant Extension Processing Using False-Twist
The authors find that:
1. The lower the overfeed, the higher the tension.
2. The tensions increase over the heater and over
the spindle. This increase, however, is not proportional to
the tension.
3. The temperature profile of the tensions is quali-
tatively similar to that found in the case of the untwisted
yarn. However, at the same value of overfeed the tensions in
the untwisted yarns are higher than the corresponding tension
in the twisted yarns.
Conclusions
Although a great number of experiments were performed,
some ambiguities and uncertainties exist which make it diffi-
cult to draw valid conclusions about much of the data presented.
What is of interest to us in our work can be summarized as
follows:
1. Higher pre-tensions or low overfeeds lead to high
running tensions.
2. In constant extension processing, tension increases
in the yarn path due to friction across the heater and around
the spindle.
3. The effect of temperature on the running tension
depends on overfeed.
4. Implicit in the previous discussion is the effect of
draw ratio on the contractile stress. Lower draw ratios may
lead to lower values of contractile stress. For undrawn yarns

which should exhibit no contractile stress, the processing
dynamics may be quite different than for drawn yarns.

196
2. Twist distribution: The work of Sasaki et al
These workers (R7) measured the twist distribution along the
false twist threadline in a specially constructed laboratory
machine. A black and a white yarn were simultaneously fed
to the machine, and the twist was measured directly from the
photographs. Their apparatus differed in a number of ways
from the apparatus used in this work: thus guides were inter-
posed between the spindle and the heater and between the heater
and the feed rolls. A tensiometer was also interposed between
the heater and feed rolls. Thus neither the tension nor the
torque were constant along the threadline. The twist levels
in their experiments were comparable to ours: many of their
experiments were conducted at approximately 50 tpi basic twist.
Since the dimensions of their apparatus were different from ours
(the heater dimension is 9 cm vs 4 cm for ours) different pro-
cessing speeds were used: the speed ranged from 5.4 m/min to
12 m/min, whereas our (nominal) speed was 0.57 m/min. The
authors measured the twist distribution as they varied the
temperature, the tension, the yarn speed and the twist level.
The twist distribution was found to be as earlier described in
this thesis (Sect III (e)): low twist in the entrance zone and
increasing twist over the heater. The twist, however, was not
constant in the entrance zone but was found to increase grad-
ually; the same gradual twist increase was observed over the
heater.
The results of Sasaki's work, where comparable, are in agree-
ment with the results obtained in this work: thus the twist

197
change at the heater is smaller the higher the tension. The
twist sensitivity to tension, however, as measured by the
actual twist at the spindle for a given basic twist (50 tpi)
is higher than that observed in this work: at 2300C, for
tensions varying between 75 and 30 grams they observe a twist
varying from 71 to 63.5 tip. Under comparable conditions
experiments carried out in this work (Table V) show the twist
to vary between 65 and 61.1 tpi.
Sasaki also performed crimp rigidity experiments and finds
that the crimp rigidity depends almost exclusively on the
actual twist at the spindle; the contact time at the heater
was of the order of .75 sec, which is sufficient to impart
good setting qualities to the yarn.

198(b) HEATING AND THERMAL PLASTICIZATION
1. Theory
In all texturing processes where permanent deformation of the
polymeric fibers is required, heating plays a most important
role. Indeed, texturing usually requires that filaments be
subjected to large deformations and remain at this level of
deformation permanently. These deformations, if not beyond
the breaking strain of the material at room temperature, would
nonetheless require large forces for their realization; further,
if realized at room temperature, they would be only partially set,
since there always exists immediate and delayed recovery from
deformation which becomes a more important component of the
total deformation as the temperature is lowered. So, increasing
the temperature facilitates the deformation of the filaments to
the desired level and allows for good setting. Since fibers
are usually crystalline polymers, heating to within 30 to 40°C
of the melting point usually results in partial melting of the
crystalline structure (and lowering of the modulus) which faci-
litates the deformation; this is probably followed by gradual
recrystallization at the high temperature. When the fiber is
cooled, crystallization occurs rapidly effectively immobilizing
the chains and preventing molecular and macroscopic recovery.
In the original Helanca process, highly twisted yarn was wound
on packages, and the setting operation took place in an auto-
clave. In the false twist process, the yarns are passed through
heaters. These may be of various designs, though recent ma-
chines are all equipped with conduction-type heaters. These are

199
essentially metal plates (often curved) heated via various
means, but most often electrically. The yarn comes in con-
tact with the heater and so is heated primarily by conduction.
The heater design provides for optimum insulation. The
heater thermostatic controls are usually of very high quality
as the constancy of the temperature level is all important for
purposes of yarn uniformity. Earlier heaters heated the yarn
by convection and radiation. This gave a very even heating,
but the overall efficiency was lower than that of conduction
heaters. The tremendous increase of speed of texturing within
the last few years entails a decrease of the residence time in
the heater. This resulted in poorly plasticized yarn. It was
thus necessary to lengthen the heater and to increase the heat
transfer efficiency. The latter was accomplished by abandoning
the convection heaters in favor of the conduction heaters. De-
tailed descriptions of the heaters and their controls are given
in R2 and R28.

2o
Transient Conduction to a Cylinder
For an isotropic, homogeneous material, whose thermal
conductivity is constant, the heat conduction equation in
cylindrical coordinates is
T X bT 4 _ + 4 ) (102)t tbr' r br m PC
T = Temperature
t = time
Q = heat generated per unit of time and space within +ihdifferential element considered
c = heat capacity )
= density )) of the element
k = thermal conductivity ) considered
= k/pc = thermal diffusivity )
For the case of a yarn (infinite cylinder) considered as a
stationary system with no heat sources, equation (102) becomes,
because of symmetry
-T in b' + r )r (103)
For initial and boundary conditions we have
T (r,o) lT (104)
that is uniform initial temperature across the yarn cross sec-
tion and
-T (OA) O (105)

2or
i.e., no temperature gradient at the center at any time be-
cause of cylindrical symmetry.
The physical meaning of these conditions is so general that
they are applicable to any yarn heating system. The boundary
condition concerning the yarn surface depends, however, on
the heating method. If it were possible to heat the yarn so
as to keep its surface temperature constant, then we would
have
T(6,) T (106)
More commonly in a convection heater we assume the heat flux q
transferred to the surface per unit area to be proportional to
the temperature difference between the surface and the fluid
(q = q /2nbL = h (Tf - Ts) ), and to be transferred by conduc-
tion to the center of the cylinder
27 2iL dr <r :
aT, t l {k [T(hot)- ] (107)

Finally, if it were possible to have a
I specified value of q per unit area at the
boundary
T (bt) q (108)
for instance, for radiation.
Equation (103) can be solved by separa-
tion of variables (R16), the constants
and eigenfunctions involved in its solu-
tion being specified by appropriate
boundary conditions. The final form of
the equation is very unwieldy: it is
usually graphed using dimensionless
parameters
I T 2
r
t b T Ij = t or ft , 6 ) (104)
Kt/62 is known as the Fourier number Fo,
and hb/k is known as the Biot number Bi
(R29,R30,R31).
L
, _
i I
I
I
I_ _-

o03
Heat Transfer Equation for Large Values of m
A simpler case applies to systems where the ratio k/hb = m
is sufficiently large thus rendering the internal temperature
gradient very small (R29,R31) Indeed m is the ratio of the
thermal conductivity to the heat transfer coefficient, and is
called the "relative surface boundary resistance" expressing
the ratio of the surface resistance (to passage of heat) to the
internal (or bulk) resistance. When this ratio is small, the
surface offers little resistance to passage of heat compared
to the bulk: hence the surface temperature Ts quickly or im-
mediately goes from Ti to Tf and the temperature drop occurs
along the radius of the cylinder. Conversely, if m is large,
then Ts approaches Tf only gradually, and the radial tempera-
ture gradient is then very small. This is generally taken to
hold true for values for m larger than 6. When this occurs,
a simple heat balance on a cylinder of radius b, length L over
a time interval dt yields:
dq - 2 ibL ( TI T)dt r L p cT
T.T be
Tj-T t O sT~-T\V~EcJ
All equations are, of course, applicable, given the right

Z04
boundary to either heating or cooling of the yarn.
Two types of heaters are used in false twist texturing.
In the first (the "convection" heater) yarn passes through a
heated chamber and is heated by the hot fluid. In the other
(the "conduction" heater) which is now by far the most common,
the moving yarn comes in contact with a heated plate; strictly
speaking treating the heating and cooling of the yarn analytic-
ally, as if it were a stationary system is erroneous; the yarn
is rotating and moving axially: in the convection heater it
probably balloons and creates eddies so that the system is
probably under turbulent conditions. In the conductive heater,
the yarn does not balloon, but it probably is heated both by
conduction and convection. On cooling, ballooning often occurs.
The point has been made by Ziabicki (R32) that the problem of
cooling of an axially moving wire has not been solved. Some
work has been published on cooling of melt spun yarns (R32),
but the knowledge of heat transfer coefficients is very poor,
and widely different values have been reported. It appears thus
that an exact treatment of the heating and cooling of the yarn
is a very difficult one; hence the necessity of using approx-
imate methods. ..

2. Experiments with a Convection Heater
Temperature Gradient across the Yarn
Arthur and Jones (R20) tackled the problem of heat
transfer to nylon yarns moving in a convection heater. They
considered the problem to be that of transient heat conduction
in a stationary system previously discussed, with a boundary
condition conforming to equation (107). With these assump-
tions they proceeded to calculate the material constants in-
volved and specifically the diffusivity.
They found, experimentally, (a) that the diffusivities of dry
and conditioned nylon are approximately the same (this merely
signifying that the ratio - K is the same in the twopc
cases), (b) that the diffusivity decreases with temperature,
(c) that the heat transfer coefficient is independent of yarn
velocity in the range tested (200 - 1,000 ft/min).
They proceeded to calculate the temperature profile of the
yarn, using numerical methods, since the variability of does
not allow the use of the published graphical solutions. For
the conditions they used (convection heater at 500 C, and a
60/20 yarn of 75 tpi basic twist or 104 tpi actual twist at
room temperature), they found that at 0.06 sec residence time
the surface temperature T = 119°C and T - Tc = A T = 12.5
At 0.13 sec T = 180and T = 9C and at 0.2 sec T = 227ands s
AT = 8C. When T 232.5 0, dT = 7°C, the "average" yarn
temperature is 230 C and 75% of the volume of the yarn is
within 50 of T. Thus T decreases as T increases, and

Arthur and Jones conclude that since in texturing practice
the yarn surface temperature is typically 200 C at about
0.4 - 0.5 sec. residence time, the temperature is essentially
uniform across the yarn cross section.
Next they utilize equation (105) valid for negligible tem-
perature gradients (incorporating the temperature dependence
of C given in (R33)) to calculate h which they find to be
3.7 x 10 - 3 cal/sec/cm2/C for 30 denier and to decrease to
3.15 x 10³ for 70 denier yarn. They do not offer any ex-
planation for this change.
Calculation of m
With these data it is possible to obtain an approximate
value for m = ~h. Since K = C , using Arthur and Jones'
data at two temperatures, 200 and 220°C, we have
-3 -4K20 = 0.95 x 10 x 0.345 x 1.14 = 3.73 x 10 ) oraverage 4
K = 0.58 x 10 x 0.582 x 1.08 = 3.63 x 10 3.68 x l0220 for dry) nylon
For 70 denier yarn we have, always using Arthur and Jones'
data
-43.68 x 10= 3.68 -3 -2 = 10.25, which is well above the3.15 x 10 x 1.14 x 10
"critical" value of 6. With conditioned nylon, whose reported
value of Cp is higher, m would be higher. On the other hand,
increased values of h would necessarily lower m.

Conclusions:
These results answer the questions that prompted Arthur and
Jones to undertake this research. They had observed that at
Ts = 2300 and 0.35 sec. residence time, the yarn properties
were poor; at Ts = 2300 and residence time 0.7 sec., these
properties were optimum. They were uncertain as to the why,
since it was possible that a big temperature gradient might
have existed across the yarn radius at short times and,
equally possible, that a certain minimum time was essential
for setting. Their work indicates the latter to be the case,
since the temperature gradient was found to be negligible.
L01

2o0
3. Experiments with a Conduction Heater
Heat Transfer - Heating Step
Morris and Roberts (R25) studied the heating of the yarn
and its effect on the resultant crimp properties. They used
a Scragg Minibulk machine equipped with a standard conduction
heater; this heater could be replaced by another of the modu-
lar type which allowed the temperature profile to be varied
at will. Their experiments were analyzed assuming the tem-
perature gradient to be negligible based on the results of
Arthur and Jones. The governing equation is equation (105).
Tf Ti exp bpc t (106)
Morris and Roberts assumed the value of k to be constant for
nylon. However, they could not calculate it (since they did
not know the value of h for the conduction heater), so they
proceeded to measure it, using equation (108) and the yarn
surface exit temperature (which was close to the melting point);
they found k1 to be 4.8. This is much higher than the appa-
rent value of k1 obtained by Arthur and Jones at their highest
reported temperature (this value for 227°C was 2.74 and extra-
polated to 260°C it is 2.4, or exactly one-half the Morris and
Roberts value). The Arthur and Jones data refer to a 60 and
the Morris and Roberts to a 70 denier yarn; but Arthur and
Jones found h for such yarns to differ by about 10%. These
results show, therefore, that the heat transfer coefficient h

269
is considerably better (by a factor of 2) for the conduc-
tion heater.
However, Morris and Roberts assumed k to be constant with
temperature, on the basis of Jones and Porter's data (R34)
on conditioned nylon. Arthur and Jones assume k to be
temperature-dependent (on the basis of Wilhoit and Jones'
data (R34) which shows Cp for dry nylon to be temperature-
dependent). From Arthur and Jones' published data, it is
possible to calculate k via equation (105), and this is
indeed found to be temperature-dependent. Multiplying k1
by the corresponding value of Cp yields the quantity 2h/b
(cf Equation (106)) which is seen to be essentially constant;
this lends support to Arthur and Jones' argument and, there-
fore, casts doubt on Morris and Roberts' argument concerning
the constancy of k during the heating of the yarn. This is
shown on the Table below (data from Ref. 2a, Fig. 6,
Tf - Ti = 4750).
Yarn Yarn Resi- k1 CpSurface Average dence from fromTemp. Temp.' ' Time Eq-n _...-A&J°C C T , T sec. (105)
50 44 456 0.01 4.08 0.377
120 116 384 0.06 3.54 0.472
180 177 323 0.13 2.96 0.552
227 225 275 0.20 2.74 0.615
kl CP
1.54
1.67
1.63
1.68

2L0
Further, if we accept Morris and Roberts' value of k 1= 4.8,
this means, as discussed, that the value of the heat transfer
coefficient for the conduction heater is double the value
found for the convection heater by Arthur and Jones. This,
in turn, would halve the value of m = b to 5 which, in turn,
implies that the temperature gradient across the yarn radius
may no longer be negligible.
Heat Transfer in the Cooling Zone
Cooling data of the yarns in air can be represented by an equa-
tion analogous to the previous one
T -Tair = exp ( -k2t) (106')
TH Tair
In Morris and Roberts Fig. 2, plots of n (T - Tair ) vs t
result in straight lines; these correspond to k2 values of
3.4 (for an untwisted yarn running at 324 ft/min) and 2.4
for a twisted yarn running at 59 ft/min, whose actual speed
was 59/1.45 = 40.5 ft/min. k2 appears to be constant over
the temperature interval studied, and this supports the
Morris and Roberts hypothesis. That k2 is lower on cooling
than on heating is also to be expected, since cooling occurs
by convection only. The k2 (hence h) dependence on speed
probably is real (presumably the faster moving the yarn
creates more turbulence), though the two yarns were not
directly comparable, since one was twisted and the other was
not.

211
If we accept the velocity dependence of k2 as being real,
then we see that faster moving yarns will be hotter when
they reach the spindle, since the heat transfer coefficient
increases in a slower fashion than the speed: to a 800%
increase in velocity there corresponds only a 140% increase
in heat transfer coefficient.

212.
4. The Work of Jones and Mason (R35)
The objective of this work was "to provide a simple method
for calculating the time-temperature history of a highly
twisted yarn passing over a contact heater and cooling
thereafter in bulk air". The authors start from the same
theoretical premises as Morris and Roberts but use the
equation
e ( _F-T CP
the ratio of heat transfer coefficient to heat capacity.
The subscript H ( ) is used to denote the heating step
and the subscript C ( ) indicates cooling. They perform-
ed their experiments on a "home-made" false twisting unit
equipped with a conduction heater and operating with con-
stant tension yarn feed; they used a device similar to that
used by Morris and Roberts to measure the yarn temperature.
The authors proceed to measure By ~ by plotting
t Ti;-) vs 2 t/ making the following assumptions:
(a) The yarn denier in the twist zone is determined
experimentally as a function of untwisted denier, twist and
tension, hence the contraction is known. Given the take-up
speed, the actual speed of the yarn is calculated, as are
the residence times on the heater and in the cooling zone.
(b) The twisted density for nylon 6.6 is taken to be
1.04 (as determined by Arthur and Jones), and with that and
the knowledge of the denier, the yarn radius b is calculated.

For speeds of the order of 60 ft/min (to take a point where
Morris and Roberts have comparable results) and for 70
denier yarns, the equation becomes
ea tf-_T - C.28. 5°2 6aT- F iill
or a value different by an order of magnitude from that calcu-
lated by Morris and Roberts. Thus the results of the two
papers are in conflict. However, the heat transfer coefficient
increases with speed as Morris and Roberts have found (but at
a slower rate than the speed itself). If the present data
are accurate, then cooling is considerably slower than antici-
pated from the (limited) data of Morris and Roberts.
Results for Other Fibers
Experiments similar to those performed on nylon were also
carried out with other fibers: Terylene (PET), Ulstron (PPR),
Lycra (elastomeric) and glass. The following results were
obtained:
i44 (1 Iwt) C ( 0// aC.) _ (1_6__J/ C)Nylon 6.6 142 0.79 112
Terylene 251 0.45 113
Ulstron 184 0.70 129
Lycra 117 0.82 96
Glass 402 0.32 129
The C was estimated by measuring the energy input into the
heater necessary to raise the temperature of a known mass of
yarn by a known amount. The heat transfer coefficient seems

214
to be the same for all yarns and the average value of the
-6quantity h x b = 112 x 10 . These data strongly suggest,
then, that the rate of heat transfer is a function of denier
and a function of specific heat. A general equation can be
used with this relation to cover all yarns studied, that
equation being
T T. tF Ti 703 tnn FT T C Dn
F p n
Indeed,: plotting'thelog-vs. tn/CpDn results in a straight
line for all yarns. In experiments on cooling the product
h x b was not constant, but found to be
hc x b = [43.5 + 3.1 (S)2] x 10-6 cal/cm sec °C;
however, like its counterpart, it does not depend on the
nature of the fiber. The heat transfer equation becomes:
Ti TF _ 6.28 ln T CpD [43.5 + 3.1 (Sb)2] t
and it covers all yarns (except Lycra, which could not be
false-twisted).
Thus, the present authors extend the work of Morris and
Roberts to other yarns; in experiments where conditions over-
lap, their results are in reasonable agreement with those of
Morris and Roberts, as far as heating is concerned. However,
the cooling rates they find are substantially lower than
those found by Morris and Roberts.

21S
(c) CRIMP RIGIDITY
1. Introduction
Crimp rigidity, crimp contraction, crimp intensity, crimp
index are all terms that are used in practice to measure
the extensibility of a textured yarn due to crimp removal.
This turns out not to be a straightforward operation, be-
cause a textured yarn is a very delicate entity, and it is
essentially impossible to reproducibly define an unstressed
length for it; further, it is impossible to remove me-
chanically the crimp without at the same time straining in
tension the filaments themselves. These problems have been
obviated in practice by stressing the yarn, to remove the
crimp, to a stress level 2 commonly 0.1 g/d which corres-
ponds to a small and known extension of the filaments and
using the length 12 thus measured (which is reproducible)
as the reference length for the test; to allow more or less
reproducible measurement of the "unstressed" yarn length, one
measures a length 11, corresponding to some small level of
stress 1
The crimp rigidity is thus usually expressed as
1 - 1CR= 12 x 100 (107)
and it-has the significance of a compressive or contractive
strain that a yarn of equilibrium length 12 would undergo
upon application of a compressive load (or removal of a ten-
sile load) 2 - 1 It varies from 0 to 1 (or 0 to 100).

21C
Had the crimp rigidity been expressed as extensibility in1 1
classical tensile terms, (for instance, as e =)
one could obtain values ranging from zero to infinity with
reference, however, to an arbitrary and not easily reprodu-
cible gage length. (CR and e are related, of course, by
e = CR/(1-CR) ).
In addition to the plethora of synonyms for the term "crimp
rigidity", a number of terms have also been used to describe
the process (or processes) that regenerates the crimp, which
is usually latent as a result of a setting process that oc-
curs after the textured yarn has been put on a package.
These include the terms "crimp development", "crimp release"
and, sometimes, "relaxation".
2. Tests for Measuring Crimp Rigidity
In what follows will be given an outline of some of the tests
used in practice.
Development of Crimp in Hot Water: The Heberlein Tes R2 'R28).
In this method, recommended by Heberlein for textured poly-
amide-fiber yarns, several skeins are first reeled off, the
tension applied for removing the crimp during winding normally
being about 0.1 g/den. The skeins are then placed in a re-
laxed state in water at 60°C for 10 min, after which they are
centrifuged and dried without tension for 24 hours under
normal atmospheric conditions.
The skeins are rewetted by immersion for 30 sec in water at
60°C containing about 2 g/l of wetting agent. The lengths

211
if of wet stretched skeins under a load of 0.2 g/den are
measured after 1 min. The skeins are then dried without
tension in an oven for 60 min at 60 C and cooled in a condi-
tioned room for 60 min. Their lengthstunder a load of
0.002 g/den are measured after 1 min. The crimp contrac-
tion is given by C.C. = (if - lo)/lf x 100.
For polyester-fiber textured yarns, Heberlein's procedure
is similar. The skeins are placed in water at 600C, which
is heated to the boiling point in 15 min. and then kept at
the boil for a further 15 min. The table below gives
typical values of crimp contraction for nylon yarns textured
by various means (as determined by this test).(z2)
PercentYarn Type (Crimp Contraction)
Conventional Helanca stretch yarn
(twist - heat-set - untwist) about 70
False-twist type stretch 60 - 65
Modified stretch (post-treated, stabilizedor set) 20 - 25
Stuffer-box textured 20 - 30
Edge-crimped textured 40 - 65
Development of Crimp in Water at Room Temperature. The
H.A.T.R.A. Test (R3). In this test, a skein of unrelaxed
yarn is immersed in water at room temperature under a tension
of 0.1 g/den for 2 min. The major part of the tension is re-

21S
moved, the yarn being under a tension of 0.002 g/den, and
2 min. later, the crimp rigidity (or percentage crimp con-
traction) is read directly from a scale.
Certain types of bulked yarn are first relaxed by immersion
in hot water and subsequent drying, and the procedure for un-
relaxed yarns is then followed.
Development of Crimp in Steam (R36) In this method, several
skeins are reeled off under a tension of 0.1 g/den. Their
lengths are measured after 1 min. under the same tension and
then again after a further period of 1 min. under a tension
of 0.2 g/den. The skeins are steamed for 1 min. under a ten-
sion of 0.002 g/den, and their lengths are remeasured.
Development of Crimp in Water and Measurement of Skein Length
as Function of Time (R36) The skeins are completely im-
mersed in water at 60°C for 10 min., dried in an oven at
60°C for 60 min. and cooled in a conditioned room for 1 hr.
They are tensioned at 0.1 g/den for 1 min., and their lengths
are measured. The load is reduced to 0.002 g/den, and the
skein lengths are measured as a function of time over a
period of 10 min. or 1 min.
Further Variations in Procedure. In addition to time, tem-
perature, immersion medium, and tension as mentioned above,
the fineness of skeins may be varied. Some additional vari-
ants on the tests described above are given in (R2).

zL9
Development of Crimp in Hot Air (R36) Skeins of 50 den
are reeled off under a tension of 0.05 g/den; they are
loaded to a tension of 0.001 g/den and treated in an oven
in ventilated air at a given temperature for 5 min. They
are then cooled for 5 min., and the skein length, 11, is
measured under 0.001 g/den tension. The load is increased
to 0.1 g/den, and the length 12 is measured after 30 sec.
For each test, it is possible to obtain a result within
30 min; this time is rather short in comparison with that
needed in other methods.
The Crimp Index Test (R37)
(a) Determination of yarn denier: Remove a length of yarn
from the bobbin, apply a stress of 0.1 g/d;(based on un-
textured denier) and measure the extended length; weigh
the yarn and calculate the denier.
(b) Procedure: Wind skeins of 5000 total yarn denier.
Load skeins with "light" load (3 loads are used: 0.5 mg/den,
15 mg/den and 50 mg/den). Develop crimp as per (c) below;
cool and/or dry and condition (always under one of the loads
above) and measure the length after conditioning (still under
load), 1o. Add a load of 0.1 g/den and measure length lf.
Calculate crimp index as
if - 1C.I.= -
if
We obtain thus 3 values of crimp index each corresponding to
a given "light" load.

Z2o
(c) rimp Development:
1. Hang skeins (under light load) in 100 C air for
10 min. (note that sticky finishes may interfere with crimp
development).
2. Immerse skeins (under light load) in cold water
(watch out for entrapped air bubbles which tend to float the
skeins).
3. Immerse the skeins in cold water (as above) and heat
water to the boil (or 98°C) at the rate of 2°C per minute.
Use transparent container to allow viewing the skein.
Crimp Permanence Test (R3). After measuring the crimp index
per above procedure, add to the lightly loaded skein a load
of 0.1 g/den and leave weight on for 24 hrs., at the end of
which remove the extra weight and measure the skein length
after 10 sec., 15 min. and 24 hrs. From these data calculate
percent recovery.
Continuous Method for Measuring Crimp. A continuous method
CR38)has been developed by Luenenschloss (R3 The yarn is fed
under high tension (sufficient to remove the crimp) through
a first set of rolls, and it is kept under a lower constant
tension thereafter. Under this low tension the yarn con-
tracts and is taken up in the contracted (crimped) state by
the second set of rolls (which rotate slower than the first
and whose rotational speed is adjustable). A very light weight
is suspended in the yarn between the rolls, and its position

22.
(height) is monitored photoelectrically; the yarn path
between the rolls is thus triangular. For a given value
of crimp rigidity the weight and the takeup speed are
suitably adjusted, and the machine is set in motion. If
portions of the yarn have a different crimp rigidity, the
position of the weight is affected: a servomechanism then
adjusts the takeup roll velocity so as to bring the weight
to its original position. The variation in the takeup roll
velocity is continuously recorded. This leads to a defini-
tion of a "continuous crimp contraction"V2
CCR = (1.00 - -V )--100 where V2 and V1 are the peripheral
velocities of the takeup and feed rolls, respectively.
The significance of the variation of the takeup speed, in
order to keep the portion of the weight unchanged, would be
equivalent in the classical C.R. test to varying the gage
length (or skein length) in order to get the same value of
the contracted length of the skein (i.e., under the light
load) as the crimp rigidity changes.
The information from the takeup roll can be fed directly into
a computer which can then calculate averages, mean, and
standard deviations and other pertinent statistical data,
autocorrelation and spectrum functions.
In analyzing the effect of various parameters on the CCR,
the author found that the optimum development temperature
(in a convection oven) is 130°C and that about 1 minute is
required to activate the crimp to a maximum. Typical results

for nylon 6.6, 70 denier textured at a theoretical twist
of 65 tpi exhibits a continuous contraction value of the
order of 70%, while the same yarn, tested by the Heberlein
method exhibits a crimp contraction value of the order of
50%.
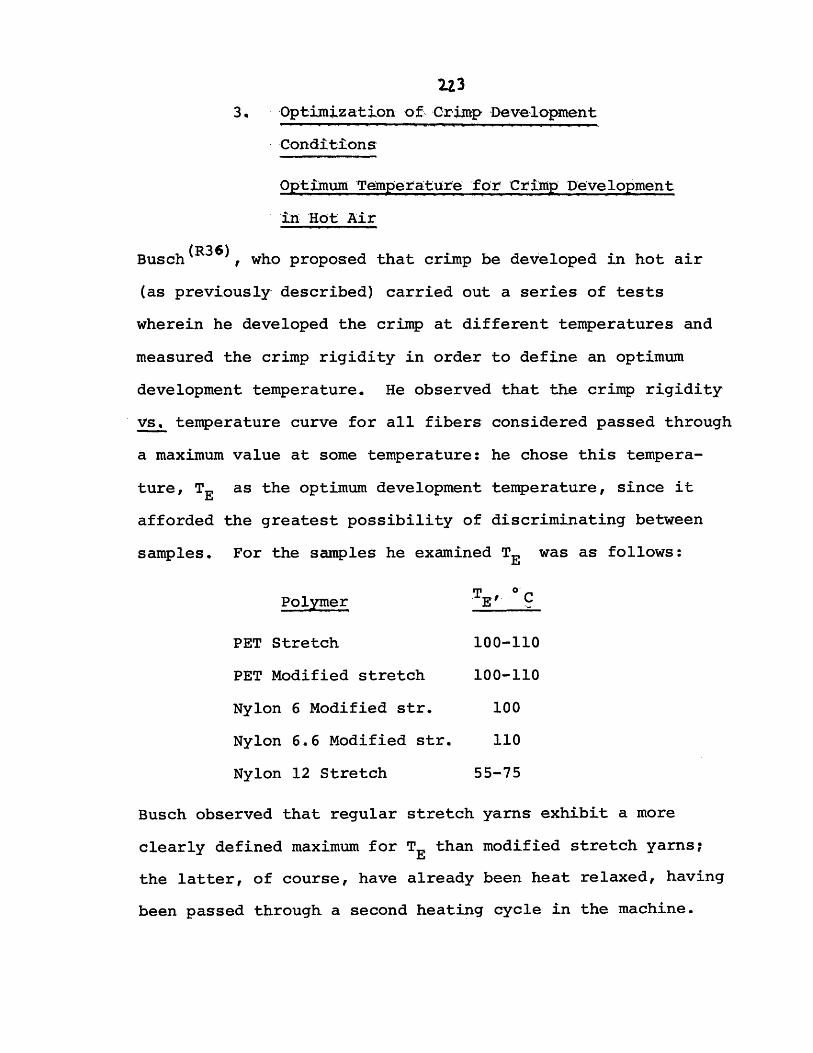
3. Optimization of Crimp Development
Conditions
Optimum Temperature for Crimp Development
in Hot Air
Busch (R3), who proposed that crimp be developed in hot air
(as previously described) carried out a series of tests
wherein he developed the crimp at different temperatures and
measured the crimp rigidity in order to define an optimum
development temperature. He observed that the crimp rigidity
vs. temperature curve for all fibers considered passed through
a maximum value at some temperature: he chose this tempera-
ture, TE as the optimum development temperature, since it
afforded the greatest possibility of discriminating between
samples. For the samples he examined TE was as follows:
Polymer TE' °'C
PET Stretch 100-110
PET Modified stretch 100-110
Nylon 6 Modified str. 100
Nylon 6.6 Modified str. 110
Nylon 12 Stretch 55-75
Busch observed that regular stretch yarns exhibit a more
clearly defined maximum for TE than modified stretch yarns;
the latter, of course, have already been heat relaxed, having
been passed through a second heating cycle in the machine.

For these yarns essentially constant values of crimp rigi-
dity can be obtained by developing the crimp over a broad
range of temperatures.
Effect of Crimp Development Method on the
Value of Crimp Rigidity
Brook, Eames and Munden(R 39 ) assessed the influence of the
crimp development step on the resultant value of the crimp
rigidity. Their experiments were performed on single yarns
(rather than skeins) and they gauged the (developed) crimp
in air, by measuring the length of the yarn successively
under a load of 0.0002 g/den ( ), under a load of 0.1 g/den
( ) and, again, under a load of 0.02 g/den ()). Each load
was applied for 1 min. They thus, calculate two values of
crimp rigidity wich they call, respectively, 'tyarn percentage
collapse" = L-tI, /t~) x 100, and "yarn crimp rigidity" =
( n.x 100%.
They evaluated a conventional nylon 6.6 twist-set-untwist
yarn, 2 false-twisted nylon 6.6 yarns (one of which was a
modified-stretch yarn which had been passed through two
heaters to stabilize the crimp), 1 false-twisted PET yarn,
and 1 edge-crimped nylon 6.6 yarn. The crimp development
procedures were as follows:
Ca) Yarn wet relaxed in water at 20°C for 2 hr.
(b) Yarn wet relaxed in water at 40°C for 2 hr.
Cc) Yarn wet relaxed in water at 700 C for 2 hr.

Cd) Yarn dry relaxed in an oven at 1000 C for 2 hr.
(e) Yarn steam relaxed for 2 min. on the bottom bed
of a Hoffman press.
For purposes of comparison, the crimp rigidity of each yarn
was also measured via the standard H.A.T.R.A. test. Concern-
ing crimp rigidity they find that:
(a) In all cases the H.A.T.R.A. crimp rigidity figure
in lower than the results obtained under the other
test.
(b) For regular stretch nylon yarns the temperature of
the wet relaxing medium has a relatively small ef-
fect on the crimp rigidity; d heat relaxation at
100°C is as effective as wet relaxation.
(c) For modified nylon stretch yarns higher wet tempera-
tures (700C and above) are needed to generate max-
imum crimp; moreover, dry heat relaxation at 1000C
is less effective than hot wet relaxation.
(d) For PET the relaxation (i.e., crimp development)
temperature plays an important role and high temper-
atures are preferred.

22X
4. Discussion: Factors That Affect Crimp
Rigidity Measurement
'The Problem of Yarn Sensitivi'ty-
A textured yarn is very sensitive to handling because:
1) the crimped filament modulus is very low; 2) the fila-
ments snag easily and also intermingle readily: the friction
between filaments thus may critically affect the length, and
is a factor contributing to an anelastic behavior on recovery
from extension. These factors make it virtually impossible
to assess an unstrained gage length. In false-twist yarns
we have the additional problem of torque which tends to twist
the unrestrained filaments. These factors are minimized if
one deals with a skein of yarn and if one uses plied or balan-
ced torque yarns.
Processing History
This, of course, is the prime parameter that determines crimp
and a number of studies have been made to assess the influence
of process variables on the crimp rigidity. These have been
discussed elsewhere and will not be considered here.
Packaging
The conditions of packaging (and, in particular, the level
of tension) affect the crimp by imparting to the yarn a
"temporary" set. Both the overfeed to the package and the
yarn position in the package are thus important. It is not
known whether all of this set is temporary, but one may pre-,

22.1
sume that it does have some permanent effects since, struc-
tural changes (perhaps further crystallization or humidity
conditioning, or both) are occurring in the fiber for a per-
iod of time after it has been packaged. That freshly made
yarn is not "equilibrated" is known because crimp rigidity
changes as function of time on the bobbilR2,' P 270) and
because freshly made yarn is even more sensitive to handling
than "equilibrated" yarn. These structural changes will
clearly be affected by the tension level and the filament
geometry of the yarn on the package.
Crimp Development
Of the various means for developing the crimp, temperature
(or temperature/plasticizer) is the most common and water is
the usual immersion medium. Even here, however, a number of
points are critical:
The temperature: water at about 1000 C is usually recom-
mended. Originally, when the nylons were the only synthetic
fibers being textured, relatively low water temperatures
were used (such as 60C). Water, however, is not a good
plasticizer for polyesters and higher temperatures were re-
quired for activation, hence, the use of 100°C water.
Steaming and dry heat have also been practiced.
Another critical parameter is the stress under which the
crimp is bieng developed. The crimp rigidity is affected by
the level of stress.
In addition to the medium, the stress and the tempera-

2Zgture, the length of time a specimen is subjected to the high
temperature may be also critical.
The Crimp Rigidity Test Itself
A number of practical difficulties arise in the performance
of the test;
In case of torque yarns, the skein is twisted under a
light load, but tends to untwist under a heavy load.
On load removal, if the skein is prevented from twisting,
filaments will tend to snarl upon retraction and when the
skein is finally let free, its contracted length is differ-
ent than that from a material which was allowed to contract
while twisting.
The retraction of the skein is strongly time-dependent,
presumably because of the interfilament friction (and, to a
lesser extent, because of the viscoelastic properties of the
filaments);successive loadings at relatively short time inter-
vals lead to different values of the crimp rigidity because
of the change in . The greatest change occurs when a spe-
cimen is loaded for the first time, as this is when the maxi-
mum number of rearrangements takes place. The skein changes
almost permanently with each measurement, so that the measure-
ment is in a sense a destructive test.
Crimp rigidity tests attempt to measure the maximum extensi-
bility and it is conceivable that this is not the quantity
that is of most practical importance, as the yarn in a knit
structure is not free to contract to an unstressed state, not

2L9
is it habitually extended to a fully uncrimped state. There-
fore, for practical purposes, a test using loads intermediate
between those used in practice may be useful.

23o0
(d) EFFECT OF MACHINE SETTINGS ON YARN QUALITY
1. Crimp Rigidity, Crimp Contraction
The Work of Burnip,: et al
In the course of the experiments described earlier (Appendix
II,(a)) BurniJR 26)also measured the extensibility of the
crimped Nylon yarns. They reported the extensibility
as the percent extension between loads of 0.006 and 0.09g/den;
from this data crimp rigidity (CR) values can be calculated.
The results of the constant-tension and constant-extension
experiments show that CR depends strongly on temperature:
the higher the temperature, the higher the crimp rigidity.
Temperature by decreasing the crystallinity and increasing
the segmental mobility of the noncrystalline regions, serves
to relax the stresses imposed during twisting. Then, as
recrystallization occurs, the new structure is locked in
and is "set"; the higher the temperature, the higher the
proportion of material which has melted and will recrystallize.
The effect of pretension and overfeed was also studied in
both the constant-tension and constant-extension experiments.
At very low tension levels (2.5g) the CR is low, but increases
with tension up to a certain level (7 g) beyond which the CR
decreases as the tension is further increased (to 16 g).
In the case of yarns processed at very low tension,some degree
of ballooning was noticed below the spindle; further, these

2-.t
yarns exhibited a number of wild filaments; all this suggests
an inadequate degree of threadline'control during processing
at very low tensions. Yarns processed under high tension
conditions were uneven and exhibited "necking" (tight areas)
in places.
It is also possible that when the yarn is kept under high
tension, the fibers keep their orientation even at high
temperatures. Perhaps when the molecules remain oriented in
the longitudinal direction (as they do when the applied stress
is high), they find it difficult to "set" in bending and in
torsion.
The effect of twist has also been studied by Burnip in the
constant-tension machine: stretch increases and, beyond a
certain level, decreases with twist. While it is to be expected,
of course, that low-twist levels should give little stretch,
it is more difficult to understand why stretch should decrease
beyond a certain level of twist. The authors, considering the
highly twisted yarn, (which, after untwisting, still looks
highly twisted with no bulk at all) suggest that "high twist
binds the loops firmly into the core of the yarn and so
prevents its easy removal on ntwisting". An analogous sug-
gestion is to be found in the literature (R9). One must also
note that, in Burnip's experiments, increased twist entails
an increased residence time in the heater.

232.
Other workers( R2 p.74) using ARCT-FT-1 type equipment,
have observed that the crimp contraction increases with
temperature.
Experiments with ARCT-FT-3 (R2) indicate that an increase
of overfeed from zero to 4% increases the crimp contraction
in good agreement with Burnip's data.
The Work of Morris and Roberts
Morris and Roberts(R2 1) found that the crimp rigidity CR,
at constant heater contact time, increased linearly with
heater temperature, though a maximum is reached as we ap-
proach the melting point of the material. The CR maximum
occurs at lower heater temperature and is higher in value
as the residence time increases (i.e., yarn speed decreases).
The writer feels that Morris and Roberts have correctly iden-
tified the occurrence of the maximum with the "melting" of
the yarn: he calculated from data presented in their Fig. 3
the yarn temperature corresponding to the point immediately
following the maximum and found that the yarn temperature
(using k = 4.8) was of the order of 250 C which is the re-
ported melting point for this yarn. The crimp rigidity max-
imum is lower, the higher the yarn speed, because high yarn
velocities correspond to lower residence time in the heater
and to appreciably higher yarn temperatures at the spindle
(the yarn is hotter when untwisted).

233
Morris and Roberts also found, by crossplotting the data
above, that at constant heater temperature the crimp rigi-
dity increases with contact time, but the rate of increase
gradually decreases to zero, i.e., the crimp rigidity be-
comes (asymptotically) constant at sufficiently long times
(of the order of 2-3 seconds in their particular experimen-
tal setup). They also observe, significantly, that the rate
of temperature increase of the yarn, with time, is consider-
ably faster than the rate of increase of the crimp rigidity.
This is in excellent agreement with the findings of Arthur
and Jones, namely that for good setting the yarn must be
kept at the high temperature for a sufficient amount of
time for molecular changes to occur.
Further, since the variation of contact time above was
achieved by varying the yarn speed (hence, among others, the
cooling time), some further experiments were made at three
different (but constant) yarn speeds (hence, three differ-
ent cooling times) where the heater contact time was varied
by varying the length of the heater (otherwise kept at con-
stant temperature). These results show that at constant
heater temperature and constant heating time, the longer the
cooling time, the better the crimp rigidity. At "short"
heater contact times (of the order of 0.5 to 1.0 sec.), the
crimp rigidity increases by about 15% (from 25% to 40%), as
the cooling time increases from 0.3 sec. to 1.3 sec. At
"long" heater contact times, 2-3 sec., (where the crimp

234
rigidity has "plateaued"), it still increases, but appa-
rently at a slower rate, with cooling time.
Summary of Temperature Effects
Morris and Roberts' works prove that the variables affecting
the crimp rigidity are in order of importance:
(a) The yarn temperature. The higher the temperature,
the better the crimp rigidity.
(b) The length of time the yarn has spent at the high
temperature, for, since during the "contact time" the yarn
is not at constant temperature, the longer and the more ef-
fective will be the heat treatment. Referring to the sketch
depicting two hypothetical yarn heating rates, yarn B will
have been subjected to a better heat treatment, even though
at the exit from the heater yarns A and B have the same
temperature (we assume that they move at the same velocity).
Yarn
Temperature
Distance along heater
I
I
EXITENTRANCE

235
In practice, both yarn temperature and crimp rigidity in-
crease exponentially with contact time, but the former
increases faster and "plateaus" much earlier. For nylon 6.6
heating times of the order of 1 second are desirable.
(c) The cooling time also affects the crimp rigidity.
Ideally, the yarn should have cooled to room temperature
when it reaches the spindle. If it is hot when it reaches
the spindle, the increase in tension that it experiences
upon untwisting, while still plastic, decreases the level
of crimp rigidity. Cooling times of at least 0.5 seconds
and preferably as long as 1.5 seconds are desirable.
So maximum crimp rigidity is attained by operating at as
high a temperature as possible and maximizing both heating
and cooling time. In practice, of course, compromises are
necessary, and there is always the possibility of some
tradeoff between heating time and temperature; however,
the least expensive way of increasing the crimp rigidity
is simply to increase the cooling time by increasing the
yarn path. Incidentally, trade opinion holds it that con-
vection heaters give "better" and more uniform yarn than
conduction heaters.

2.36
2. Yarn Breaking Strength
Effect of Temperature
The strength decreases as the temperature is increased,
although this drop is small up to heater temperatures of
the order of 210°C (R2, p.6 7). Similar effects are re-
ported by Burnip (R26) on both constant tension or constant
extension equipment at residence times varying from 0.5 to
1.8 sec.
Effect of Twist
The data are not all in agreement, but suggest that a de-
crease in strength occurs as the twist is increased.
Burnip et al (R26), experimenting with a very broad range
of twist values (50 to 170 tpi) on the constant tension
apparatus, observed "an overall trend towards reduction in
strength as the twist is increased". However, "this was not
statistically significant at the 95% confidence level".
The data on ARCT-FT-1(R2 p 76) which cover a much nar-
rower twist range (60-80 tpi) suggest the existence of a
maximum in the vicinity of 60-70 tpi.
In all of these experiments the basis of comparison is the
breaking strength of the untextured yarn and, therefore,
the effects of twist and temperature are confounded.
The Effect of Overfeed and/or Tension
The ARCT-FT-1 experiments indicate a decrease in breaking
strength as overfeed is increased from 2 to 6% (R2 p. 345)

237
The ARCT-FT-3 experiments (overfeed 0 to 4%) and the
Leesona 553 experiments (overfeed 2 to 4%) show either
a slight increase (at low denier filaments) or no
change (R2 p. 347)
Burnip (R,3) operating on the constant extension appa-
ratus, found a trend towards higher strengths at higher
overfeeds.

3. Other Effects
These are listed, but only in general terms by El-Behery(R2).
This list of material parameters that affect the properties
of the textured yarns is as follows:
Variation Between Supply Packages: That this
is a problem is shown by the work of Morris and Roberts(R21)
who state that, "under carefully controlled laboratory con-
ditions, there is almost exact correspondence between dye
uptake differences before and after texturing. Under pro-
duction conditions, further variation is added by the bulking
process." This is a problem which is very difficult to con-
trol, and no easy solution to it is seen.
Type of Material to be Processed: It is stated
that if we assume the yarn to be composed of a number of
identical helices of diameter A, the retractive force of
the yarn is
F K E Dd ;Y A2
K is a constant, D and d are the denier of the total yarn
and the filament, respectively, and E is the Young's modulus
for the filament. So at constant F and D a change in E can
be compensated by a change in d.
Filament Cross-section: It is stated that
textured yarns produced from multilobal cross-section have
sparkle, glitter and a silk-like hand and appearance.

Total Denier: The author states that for
yarns of different total denier, false-twisted with the
same twist factor, the retractive force is independent of
the total denier and depends on the filament denier. Also
different migration patterns may be noticed.
Filament Denier: It has been found that the
fewer the number of filaments in a stretch yarn of given
denier, the greater its stretch and resistance to extension.
Effect of Yarn Structure: Plied yarns give
better stretch and a more vigorous recovery in the resultant
fabric than single yarns of equivalent total denier.
Effect of Spin Finish: The spin finish on
the yarn before texturing will affect the amount of tension
desired, the heat transfer rate, the amount of twist needed,
and the yarn speed.

REFERENCES
R1 Comptes-Rendus of the International Study Sessionon Textured Yarns, J.E.T. (1969), Lyon
R2 Wilkinson, G.D. ed. "Textured Yarn Technology",Monsanto Co., 1967
R3 Burnip, N.S., Hearle, J.W.S. & Wray, G.R., J. Text.Inst. 52, 343, 1961
R4 Hearle, J.W.S., J. Text. Inst., 57, T441, 1966
R5 Denton, M.J., J. Text.Inst., 59, No. 7, 344, 1968
R6 Luenenschloss, J. & Weinsdoerfer, H., Chemiefasern 20,Nov. 1970
R7 Sasaki, T., Kuroda, K., and Suminokura, T., J. Text.Machinery Soc. Japan (English Edition), 16, No. 4, 1970
R8 Yang, W-L, Progress Report on the Mechanics ofTexturing, 2/15/71 - 12/31/71, Fibers and Polymers Div.,M.I.T.
R9 Krause, H.W., "Bulk, Stretch & Texture", The TextileInstitute 1966
R10 Hearle, J.W.S., Grosberg, P. and Backer, S., "Struc-tural Mechanics of Fibers, Yarns and Fabrics",Wiley-Interscience, New York, 1969
Rll Gracie, P.S., J. Text. Inst. 51, T271, 1960
R12 Treloar, L.R.G., J. Text. Inst., 55, P13, 1964
R13 Platt, M.M., Klein, W.G. and Hamburger, W.J., Text.Res. J., 28, 1958
R14 Postle, R., Burton, P. and Chaikin, M., J. Text. Inst.,55, T338, 1964
R15 Timoshenko, S. and Young, D.H., "Elements of Strengthof Materials", 5th ed., D. Van Nostrand & Co.,Princeton, N.J., 1968
R16 Hildebrand, F.B., "Advanced Calculus for Applications",Prentice-Hall Inc., Englewood Cliffs, N.J., 1962
R17 Plonsker, H.R. and Backer, S., Text. Res. J. 37,673, 1967

241
REFERENCES (continued)
R18 Ward, J.M., "Mechanical Properties of Solid Polymers",Wiley Interscience, London, 1971
R19 Brookstein, D., Private communication
R20 Arthur, D.F. & Jones, C.R., J. Text. Inst. 53, T217(1962)
R21 Morris, W.J. & Roberts, A.S., "Bulk, Stretch andTexture", The Textile Institute, 1966
R22 Thwaites, J.J., Threadline Torsional Characteristicsin the False-Twist Process; to be published
R23 Crugnola, A., Sc.D. Thesis, M.I.T. 1972
R24 Arghyros S., Sc.D. Thesis, M.I.T. 1973
R25 Notes on Differential Geometry of Straight Yarns.M.I.T. Textile Division
R26 Burnip, N.S., Hearle, J.W.S., Man Made Textiles,October 1960, P40, November 1960, P54
R27 El-Behery, A., Clewison Review, 1971
R28 Bulletins by ARCT, Heberlein, Sotexa, Leesona, etc.
R29 Rohsenow, W.M., and Choi, H.Y., "Heat, Mass andMomentum Transfer", Prentice Hall, 1961
R30 Eckert, E.R. and Drake, R.M., "Heat and Mass Trans-fer", McGraw Hill and Co., Inc., New York, 1959
R31 McAdams, W.H., "Heat Transmission", 3rd edition,McGraw Hill and Co., Inc., New York, 1954
R32 Mark, H.F., Atlas, S.M. & Cernia, E., "Man MadeFibers Science and Technology", Vol. 1, Inter-science, New York, 1968
R33 Wilhoit, R.C. & Dole, M., J. Phys. Chem., 57, 14,1953
R34 Jones, C.R. & Porter, J., J. Text. Inst., 56, T498,1965
R35 Jones, C.R. & Mason, T., J. Text. Inst., 61, T147,1971

2q2
REFERENCES (continued)
R36 Busch, H., "Bulk, Stretch and Texture", The TextileInstitute, 1966
R37 Backer, S., Private communication
R38 Luenenschloss, J. et al, Chemiefasern 21, 41,Jan. 1971
R39 Brook, G., Eames, J.R. and Munden, D.L., "Bulk, Stretchand Texture", The Textile Institute, 1966

BIOGRAPHICAL SKETCH
The writer was born in Greece in 1933 where he completed
his secondary education in 1951. His undergraduate studies
were done in Belgium at the Ecole Superieure des Textiles
de Verviers, and he came to M.I.T. after their completion
in 1955, to what was then called the Textile Division of
the Department of Mechanical Engineering. He obtained a
Master's Degree in 1958. For about seven years he was directly
involved in industrial research and development, and for four
years thereafter he was a research administrator at Cabot
Corporation. His research work originally dealt with funda-
mental polymer characterization via infrared, microscopy
and X-rays, molecular weight distributions, stress cracking
and rheology; at a later stage he became involved with process
development, i.e., compounding and extrusion of crosslinked
high density polyethylene pipe. He was then promoted to
Research Manager in which capacity he continued to direct
research; in addition, he was in charge of Customer Service.
His last position with the Cabot Corporation was that of
Research Manager, Cab-O-Sil (a pyrogenic silica of extremely
large surface area) and Cab-O-Lite; he directed a Research
group, a Technical Service group, and a Pilot Plant group.
The writer resigned his position at Cabot in order to return
to M.I.T. for his doctoral program. Since 1972 he has been
associated with Tufts University as an Adjunct Professor,
lecturing on the Chemistry and Physics of Polymers.

24q
PUBLICATIONS
"Irradiation of Cotton Fibers with Cathode Rays", co-authorwith Pan et al, Textile Research Journal, 1959.
"Molecular Weights of Blends of Polydisperse Polymers",paper presented at the 1962 Symposium of the Societyof Chemical Industry in London. Published in theSociety's Monograph No. 17, "Techniques of PolymerScience", London (1963).
"Single Point Determination of Intrinsic Viscosity",J. Poly. Sci., Vol. 7 (1963).
"The Effect of Inhomogeneities in the flow propertiesof polyethylene", J. Appl. Poly. Sci., Vol. 8, (1964).