solvent induced swelling of membranes - … · solvent induced swelling of membranes - measurements...
TRANSCRIPT
Loughborough UniversityInstitutional Repository
Solvent induced swelling ofmembranes - measurements
and influence innanofiltration
This item was submitted to Loughborough University's Institutional Repositoryby the/an author.
Citation: TARLETON, E.S., ROBINSON, J.P. and SALMAN, M., 2006. Sol-vent induced swelling of membranes - measurements and influence in nanofil-tration. Journal of Membrane Science, 280 (1-2), pp. 442-451
Additional Information:
• This article was published in the Journal of Membrane Sci-ence [ c© Elsevier] and the definitive version is available at:www.elsevier.com/locate/memsci
Metadata Record: https://dspace.lboro.ac.uk/2134/4773
Version: Accepted for publication
Publisher: c© Elsevier
Please cite the published version.

This item was submitted to Loughborough’s Institutional Repository (https://dspace.lboro.ac.uk/) by the author and is made available under the
following Creative Commons Licence conditions.
For the full text of this licence, please go to: http://creativecommons.org/licenses/by-nc-nd/2.5/

Cite paper as: Tarleton E.S., Robinson J.P. and Salman M., 2006, Solvent induced swelling of membranes – measurements and influence in nanofiltration, J. Membrane Science, 280, 442-451. DOI: 10.1016/j.memsci.2006.01.050
1
SOLVENT INDUCED SWELLING OF MEMBRANES – MEASUREMENTS AND INFLUENCE IN NANOFILTRATION
E.S. Tarleton1 ([email protected]), J.P. Robinson2 and M. Salman1
1 Advanced Separation Technologies Group, Department of Chemical Engineering, Loughborough University, Loughborough, Leicestershire LE11 3TU, UK.
2 School of Chemical, Environmental and Mining Engineering, University of Nottingham NG7 2RD, UK.
ABSTRACT This paper describes improvements to an apparatus for in-situ determinations of swelling where a linear inductive probe and electronic column gauge with an overall resolution of 0.1 µm was used for measurements of seven variants of polyacrylonitrile (PAN)/polydimethylsiloxane (PDMS) composite nanofiltration membranes in a range of alkane, aromatic and alcohol solvents. The unswollen membranes incorporated PDMS layers between 1 and 10 μm nominal thickness and were manufactured with a radiation and/or thermal crosslinking step. The tested membranes exhibited a range of swelling dependent on the degree of crosslinking, the initial PDMS layer thickness and the type of solvent. With no applied pressure the PDMS layer on some radiation crosslinked membranes swelled as much as ~170% of the initial thickness whilst other membranes were restricted to a maximum swelling of ~80%. When a pressure up to 2000 kPa was applied to a membrane then swelling could be reduced to ~20% of the value obtained at zero applied pressure. By vertically stacking up to 3 membrane samples it was possible to determine the swelling of PDMS layers as thin as 1 μm, although higher imposed pressures rendered some results unreliable as the measurement resolution of the apparatus was approached. The results of the swelling experiments are contrasted with crossflow nanofiltration performance in terms of solvent flux and solute rejection. KEYWORDS Membrane swelling; Nanofiltration; PDMS; Organic solvents; Flux; Rejection. INTRODUCTION In a recent paper [1] a new in-situ method for determining the swelling of dense, hydrophobic nanofiltration membranes with a high resolution dial comparator was described. Using a radiation crosslinked PAN/PDMS composite membrane that incorporated a nominal 10 μm thick PDMS layer and solvents with a range of solubility parameter (δ) spanning 14-29 MPa0.5, the authors showed measurements of swelling for both pure solvents and solvent mixtures at pressures up to 2000 kPa. Some of these data were compared favourably (in terms of measurement standard deviation (SD)) with the more widely used method of Ho and Sirkar [2] where the weight difference between a dry and solvent impregnated polymer sample is determined; see [3-5] for applications of the technique and [6, 7] for alternative swelling measurement techniques. An inherent disadvantage of the Ho and Sirkar method is the need to use ‘thick films’, ‘slabs’ or ‘blocks’ of pure polymer in order to establish sufficiently accurate measurements. The extent of swelling is strongly related to the degree of polymer crosslinking as well as the affinity of the polymer for the solvent and is potentially influenced by the presence of a backing in a composite membrane which typically swells to a different extent. The use of relatively thick samples of polymer is also a problem when crosslinking is mainly achieved by exposure to radiation. As the
Cite paper as: Tarleton E.S., Robinson J.P. and Salman M., 2006, Solvent induced swelling of membranes – measurements and influence in nanofiltration, J. Membrane Science, 280, 442-451. DOI: 10.1016/j.memsci.2006.01.050
2
depth of penetration is normally limited a sample will tend to experience a different degree of crosslinking toward its centre relative to that close to the exposed surfaces. The ability to determine swelling for a composite membrane where the selective layer is measured in the ‘as manufactured’ state and in intimate contact with the backing layer(s) is a distinct advantage and one that is offered by the authors technique. More realistic measurements of swelling are likely to provide for improved modelling and thus better understanding of solvent/solute transport mechanisms. However, initial measurements [1] were restricted to a membrane with a nominal 10 μm thick PDMS layer as the suitability of the technique was explored. There is generally a desire to use thin selective layers on membranes to maximise flux rates and the remainder of this paper explores the potential of measuring swelling in composite membranes with PDMS layers <10 μm thickness. EXPERIMENTAL Membrane All swelling experiments used samples of flat sheet cellulose fibre/PAN/PDMS composite membranes. A typical SEM micrograph of each membrane cross-section is presented in Figure 1 and all seven variants were tested in their ‘as manufactured’ state. Although not all details of membrane manufacture were available due to issues of confidentiality, the micrographs show similar general structures where a PAN layer is sandwiched by a PDMS layer (at the top) and a cellulose fibre layer (at the bottom); neither the PAN nor cellulose fibre is thought to play any role in nanofiltration other than to provide support to the selective PDMS layer. A PAN layer had a typical thickness of 40 μm. Membranes incorporating nominal PDMS thicknesses between 1 and 10 μm were available. During manufacture of the membranes designated (a)-(f), a PAN support was roll-coated with a solution containing the siloxane monomer and a catalyst, and initially subjected to a thermal treatment process to induce crosslinking. Further crosslinking of the PDMS was achieved via irradiation with an electron beam from a low energy accelerator [8]. The procedure resulted in a reasonably well-defined PDMS layer with little evidence of pore-intrusion into the PAN (although the true extent of the PDMS layer was difficult to identify in some cases as evidenced by Figure 1). Electron beam radiation generally induces two opposing effects on PDMS composite membranes, crosslinking by the formation of radicals which subsequently combine to form covalent crosslinking bonds and degradation of the membrane material. An optimum radiation dose therefore exists which induces the maximum increase in crosslinking density with only marginal degradation of the membrane material. Membranes (a), (b) and (f) were each exposed to a ‘standard’ radiation dose of 80 kGy during manufacture (1 kGy ≡ 1 kJ/kg) whilst three other specially prepared samples, designated membranes (c), (d) and (e), were respectively treated with radiation doses of 200, 100 and 50 kGy. One membrane sample, designated (g), was available with a similar substrate material, however, the selective PDMS layer was formed by phase-inversion and subsequently crosslinked using a purely thermal technique. In this case there was significant PDMS intrusion into the PAN layer. Whilst localised variation in PDMS thickness was observed in several SEMs, nitrogen gas permeation measurements showed that the average thickness was as stated and average permeances were within 2% of the literature quoted value of 280 barrer. Nitrogen permeances for all membrane samples were thus indistinguishable, which is consistent with the observations of Dudley et al. [9]. As noted earlier, crosslinking promoted by radiation prevents the use of a gravimetric method for swelling determination as a block of PDMS treated in such a way would not exhibit the same degree of crosslinking as a thin PDMS layer on a composite membrane. Solvents
Cite paper as: Tarleton E.S., Robinson J.P. and Salman M., 2006, Solvent induced swelling of membranes – measurements and influence in nanofiltration, J. Membrane Science, 280, 442-451. DOI: 10.1016/j.memsci.2006.01.050
3
A range of alkane (octane, hexane, heptane and cyclohexane), aromatic (xylene) and alcohol (methanol, ethanol and propanol) solvents were used in the swelling experiments. These span a range of polarity, and thus potential swelling capability, as evidenced by their solubility parameter δ = 14.3-29.2 MPa0.5 [10]. All solvents had initial purities in excess of 99% and were obtained from Sigma-Aldrich, Fisher Scientific or Shell Global Solutions. Apparatus and Procedure The form and operation of the membrane swelling apparati have previously been described in detail [1]. For completeness the salient features are described here together with the new refinements to the technique. With reference to Figure 2(a), in an experiment with no applied pressure a 2 cm square sample of PAN or membrane was placed in a flat-bottomed dish, a 10 mm diameter spacer was placed on top of the sample and the linear measurement probe was positioned over the spacer and connected to the electronic column gauge. The probe/gauge combination, which essentially comprised a digital dial comparator, had a resolution of 0.1 µm. Referring to Figure 2(b), with the addition of a support frame and cantilever bar that pivoted about a bearing mount in one end, it was possible to impose a pressure upon a test sample. By adjusting the distance between the sample and pivot, and/or adding weight to the free end of the cantilever bar the applied pressure could be varied up to 2000 kPa. In a typical swelling experiment the sample to be tested was initially mounted dry in the dish. Membranes with a 10 μm nominal PDMS thickness could be tested individually. For thinner PDMS layers the potential of using membrane ‘stacks’ was investigated where up to three separate membrane samples were positioned vertically, one on top of the other. With the membrane(s), spacer, probe and cantilever bar all in place, 10 ml of solvent was quickly added to the dish to completely immerse the sample after which swelling started immediately. Sixty seconds was typically allowed for a sample to reach an equilibrium thickness before a final displacement measurement was taken; this time included a safety margin of circa 15-30 s and was established during a sequence of preliminary experiments where transient measurements of swelling were taken following the introduction of solvent. The rapidity of measurements meant that any longer term fluctuations in laboratory temperature (typically 18±2ºC) had little influence on measurement accuracy. As a precaution, however, the apparatus was shrouded from drafts and sunlight and preliminary experiments with heptane solvent and an 80 kGy radiation, 10 μm membrane were repeatedly performed at different times over a period of days to confirm general data reproducibility. RESULTS AND DISCUSSION Swelling Measurements Swelling tests were performed using the apparati shown in Figure 2 and the membrane forms represented by Figure 1. Data for the PAN alone and the 80 kGy radiation crosslinked membrane with the nominal 10 μm PDMS layer have been previously published [1] but some are included for comparison purposes. For the PAN substrate and lower polarity solvents such as n-heptane and xylene there was no change in lateral dimension (i.e. below the detection limit), however, with higher polarity alcohols some shrinkage was observed. Experiments using the PAN/PDMS composite often showed appreciable swelling. For low polarity solvents the swelling was exclusively dictated by expansion of the PDMS, whereas with the highest polarity solvents shrinkage of the PAN substrate became progressively more comparable to dimension changes in the PDMS. To overcome the inevitable variability’s of membrane manufacture it was necessary to perform a number of repeat experiments for each membrane/solvent combination and between 4 and 10 measurements were
Cite paper as: Tarleton E.S., Robinson J.P. and Salman M., 2006, Solvent induced swelling of membranes – measurements and influence in nanofiltration, J. Membrane Science, 280, 442-451. DOI: 10.1016/j.memsci.2006.01.050
4
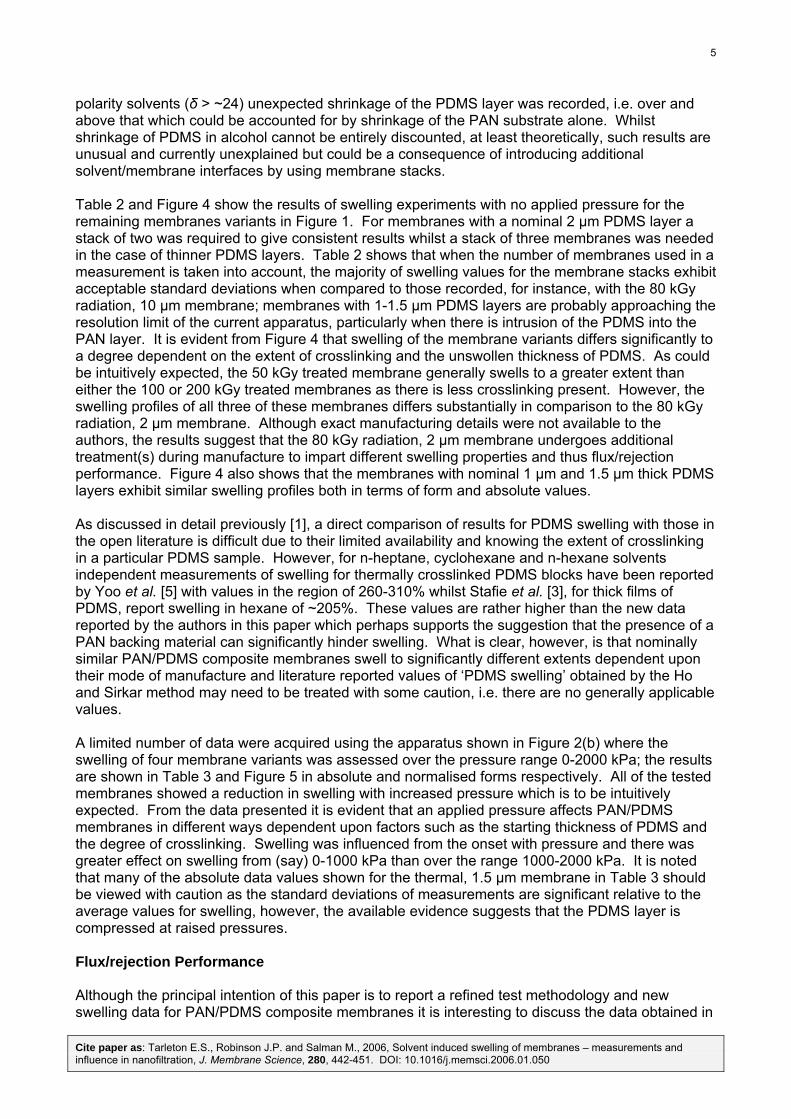
typically taken. When evaluating swelling of the PDMS layer in a composite membrane it was assumed that any dimension change in the PAN was the same as determined in a corresponding experiment with the PAN alone. The test samples, as assessed by visual inspection at the end of an experiment, were completely wetted in all cases. Tables 1 & 2 and the corresponding graphs in Figures 3 & 4 show typical results of experiments with no applied pressure using the apparatus depicted in Figure 2(a). The data demonstrate an ability to quantify swelling and comprise average values for sample expansion/shrinkage and respective standard deviations (SDs) for the displacement measurements.† As a rule-of-thumb, in the following descriptions a sequence of measurements are taken to be acceptable when the SD is circa 10% (or less) of the average value. Whilst this choice is somewhat arbitrary, measurements by the Ho and Sirkar method typically yield SDs of the same level (e.g. [3]). Considering the 80 kGy radiation, 10 μm membrane as a reference, Table 1 and Figure 3 show that a peak swelling of 169% occurred with n-heptane solvent (δ = 15.3 MPa0.5) which corresponds favourably with the literature reported value of solubility parameter for PDMS at δ = 15.5 MPa0.5. Over the region δ = 15.3-23.6 MPa0.5 the solvent polarity increases to induce progressively less swelling in the PDMS layer and at even greater values of δ the membrane swelling was reduced still further and reliable values were difficult to obtain. Corresponding results for the 80 kGy radiation, 2 μm membrane are also shown in Table 1 and Figure 3. Whilst the swelling follows a similar general trend in terms of the position of the peak, the absolute values are substantially lower as the PDMS layer is nominally 2 μm, rather than 10 μm, thick. Moreover, when a single membrane was tested there was a tendency for the measurement SDs to be somewhat larger for the membrane with the 2 μm PDMS layer; Figure 3 also shows that the average values are more scattered relative to the data recorded for the 10 μm membrane. The swelling of a single membrane with a 1 μm PDMS layer could not be measured reliably given the limiting 0.1 μm resolution of the measurement probe. In an attempt to overcome the difficulties associated with measurements of thinner samples, tests were performed using membranes stacked vertically in double and triple configurations prior to placement of the spacer and linear probe. Whilst additional solvent/membrane interfaces are introduced by this procedure, which may interfere with overall measurement accuracy, it was hoped that their influence would be negligible relative to the potential benefits. Table 1 and Figure 3 show that when two samples of the 80 kGy radiation, 2 μm membrane were stacked one on top of the other then more consistent data were obtained over the region δ = 14.3-23.6 MPa0.5, as evidenced by the SDs which are in keeping with those recorded for the 80 kGy radiation, 10 μm membrane. The similar normalised profiles shown in Figure 3 also infer a similar degree of crosslinking. A reduced number of experiments were also performed using a stack of three membranes, however, Table 1 shows that the benefits are limited when the starting PDMS thickness is sufficient (which in turn infers that the additional solvent/membrane interfaces introduced by the stacking procedure have little, if any, detrimental effect on measurement accuracy when low polarity solvents are used). It is noted that in the authors previous works with low polarity systems, maximum solvent fluxes and minimum solute rejections were reported in nanofiltration experiments for the 80 kGy radiation, 2 μm and 10 μm membranes when δsolvent ≈ δPDMS. Their data suggest that the relationship of these two parameters closely follows swelling propensity over the region δ = 14.3-18.2 MPa0.5 [11-13]. Swelling experiments with n-propanol, ethanol and methanol solvents and the 80 kGy radiation, 2 μm membrane identified a limitation of the measurement technique. Although not observed with single membrane samples, when stacks of two and three membranes were tested using higher
† When viewing Tables 1 & 2 the reader should be aware that in many cases the quoted SDs are those obtained for measurements with two or three membranes arranged in a vertical stack. Whilst the average values recorded for swelling were divided by 2 or 3 as appropriate to give the swelling for a single membrane the SDs are not corrected in this manner, rather they are stated as recorded for the stack.
Cite paper as: Tarleton E.S., Robinson J.P. and Salman M., 2006, Solvent induced swelling of membranes – measurements and influence in nanofiltration, J. Membrane Science, 280, 442-451. DOI: 10.1016/j.memsci.2006.01.050
5
polarity solvents (δ > ~24) unexpected shrinkage of the PDMS layer was recorded, i.e. over and above that which could be accounted for by shrinkage of the PAN substrate alone. Whilst shrinkage of PDMS in alcohol cannot be entirely discounted, at least theoretically, such results are unusual and currently unexplained but could be a consequence of introducing additional solvent/membrane interfaces by using membrane stacks. Table 2 and Figure 4 show the results of swelling experiments with no applied pressure for the remaining membranes variants in Figure 1. For membranes with a nominal 2 μm PDMS layer a stack of two was required to give consistent results whilst a stack of three membranes was needed in the case of thinner PDMS layers. Table 2 shows that when the number of membranes used in a measurement is taken into account, the majority of swelling values for the membrane stacks exhibit acceptable standard deviations when compared to those recorded, for instance, with the 80 kGy radiation, 10 μm membrane; membranes with 1-1.5 μm PDMS layers are probably approaching the resolution limit of the current apparatus, particularly when there is intrusion of the PDMS into the PAN layer. It is evident from Figure 4 that swelling of the membrane variants differs significantly to a degree dependent on the extent of crosslinking and the unswollen thickness of PDMS. As could be intuitively expected, the 50 kGy treated membrane generally swells to a greater extent than either the 100 or 200 kGy treated membranes as there is less crosslinking present. However, the swelling profiles of all three of these membranes differs substantially in comparison to the 80 kGy radiation, 2 μm membrane. Although exact manufacturing details were not available to the authors, the results suggest that the 80 kGy radiation, 2 μm membrane undergoes additional treatment(s) during manufacture to impart different swelling properties and thus flux/rejection performance. Figure 4 also shows that the membranes with nominal 1 μm and 1.5 μm thick PDMS layers exhibit similar swelling profiles both in terms of form and absolute values. As discussed in detail previously [1], a direct comparison of results for PDMS swelling with those in the open literature is difficult due to their limited availability and knowing the extent of crosslinking in a particular PDMS sample. However, for n-heptane, cyclohexane and n-hexane solvents independent measurements of swelling for thermally crosslinked PDMS blocks have been reported by Yoo et al. [5] with values in the region of 260-310% whilst Stafie et al. [3], for thick films of PDMS, report swelling in hexane of ~205%. These values are rather higher than the new data reported by the authors in this paper which perhaps supports the suggestion that the presence of a PAN backing material can significantly hinder swelling. What is clear, however, is that nominally similar PAN/PDMS composite membranes swell to significantly different extents dependent upon their mode of manufacture and literature reported values of ‘PDMS swelling’ obtained by the Ho and Sirkar method may need to be treated with some caution, i.e. there are no generally applicable values. A limited number of data were acquired using the apparatus shown in Figure 2(b) where the swelling of four membrane variants was assessed over the pressure range 0-2000 kPa; the results are shown in Table 3 and Figure 5 in absolute and normalised forms respectively. All of the tested membranes showed a reduction in swelling with increased pressure which is to be intuitively expected. From the data presented it is evident that an applied pressure affects PAN/PDMS membranes in different ways dependent upon factors such as the starting thickness of PDMS and the degree of crosslinking. Swelling was influenced from the onset with pressure and there was greater effect on swelling from (say) 0-1000 kPa than over the range 1000-2000 kPa. It is noted that many of the absolute data values shown for the thermal, 1.5 μm membrane in Table 3 should be viewed with caution as the standard deviations of measurements are significant relative to the average values for swelling, however, the available evidence suggests that the PDMS layer is compressed at raised pressures. Flux/rejection Performance Although the principal intention of this paper is to report a refined test methodology and new swelling data for PAN/PDMS composite membranes it is interesting to discuss the data obtained in
Cite paper as: Tarleton E.S., Robinson J.P. and Salman M., 2006, Solvent induced swelling of membranes – measurements and influence in nanofiltration, J. Membrane Science, 280, 442-451. DOI: 10.1016/j.memsci.2006.01.050
6
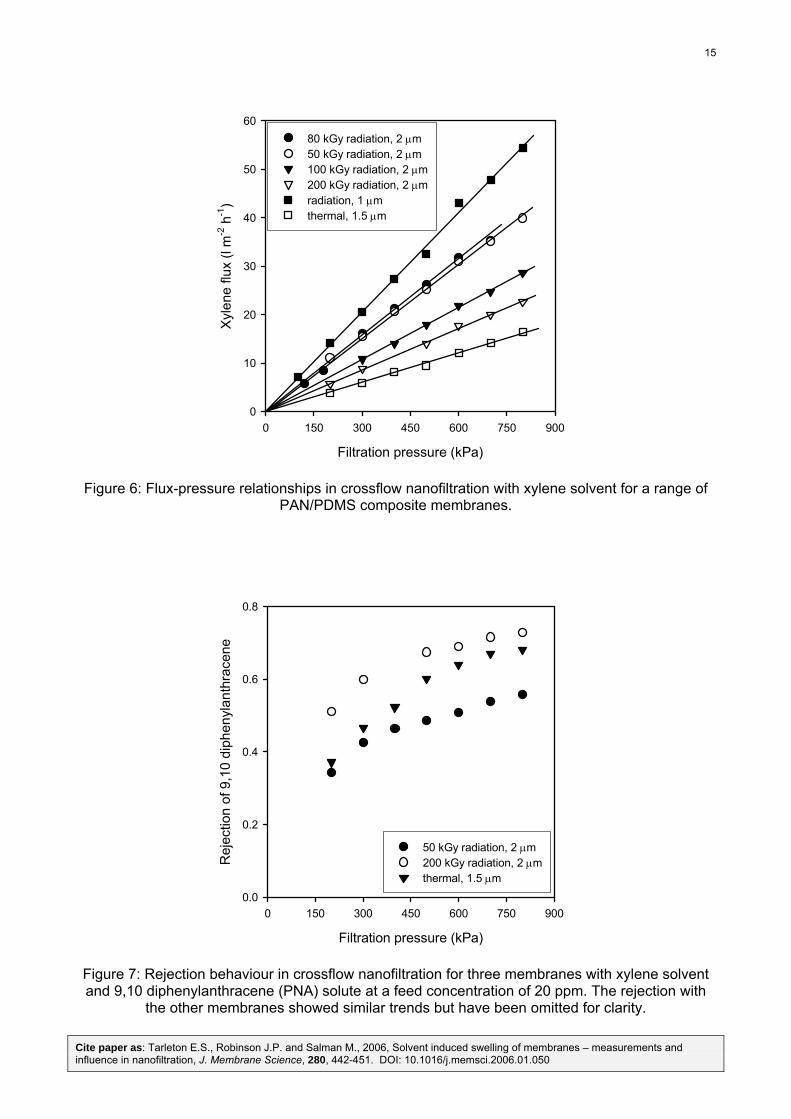
the wider context of crossflow nanofiltration performance. Flux and steady state rejection are the principal measures and Figures 6-10 illustrate the salient features of swelling on these two parameters as well as representative swelling data for ethanol mixed with a second, lower polarity, solvent. For fuller descriptions the reader is directed to previous papers by the authors [11-15] where experimental arrangements and some of the data reported in Figures 6-10 are discussed in greater detail along with applications of nanofiltration models. All crossflow nanofiltration data reported in this paper were obtained with a DESAL membrane module (wetted surface area = 75 cm2) at a crossflow rate of circa 1 l/min. Measurements of rejection, as determined by UV-vis spectroscopy or refractive index, were typically repeatable within ±1%. Figures 6 and 7 show that in crossflow nanofiltration with a feed comprising a low polarity solvent and poly-nuclear aromatic (PNA) solute at dilute concentration, the flux-pressure relationship is linear in accordance with Darcy’s Law for all the tested membranes whilst solute rejection increased over the same pressure range. Several researchers have reported increasing solute rejection at raised pressures [3, 16-19], frequently with obeyance of Darcy’s Law, whilst others have reported non-linear solvent flux/pressure relationships [20-22] that has been attributed to membrane compaction [20]. Sufficient data are presented in this paper to suggest that the PDMS layers on composite membranes will generally undergo compression during pressure driven nanofiltration, particularly over the range 0-1000 kPa. However, the overall situation presents something of a paradox, how can increasing pressure, membrane compaction and increasing solute rejection occur simultaneously with a linear solvent flux-pressure relationship? Possibilities include: 1. The polymer chains move closer together under the raised pressure to reduce free volume,
diffusional solute transport subsequently slows due to a reduced diffusion rate through the denser polymer and solute rejection progressively increases. Such an arrangement could reasonably be expected to also slow diffusional solvent transport and thus cause non-linearity of the flux-pressure relationship.
2. The polymer chains move further apart during swelling to allow a greater free volume in the
membrane structure which tends to promote an element of convective flow and lower rejections. When the pressure is raised the reduction in free volume naturally brings polymer chains closer together to enhance rejection by a size exclusion mechanism. For this to happen simultaneously with a linear flux-pressure relationship, the free volume/flow paths in the PDMS would have to remain sufficiently large so as not to adversely affect flow.
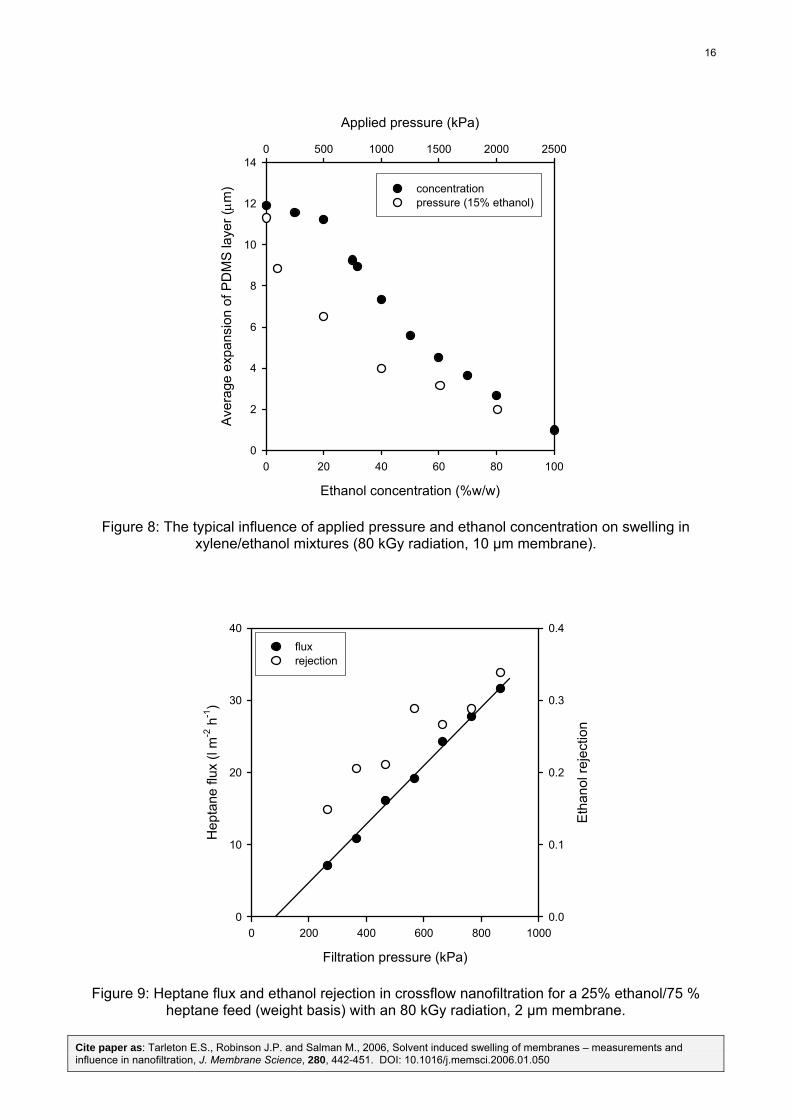
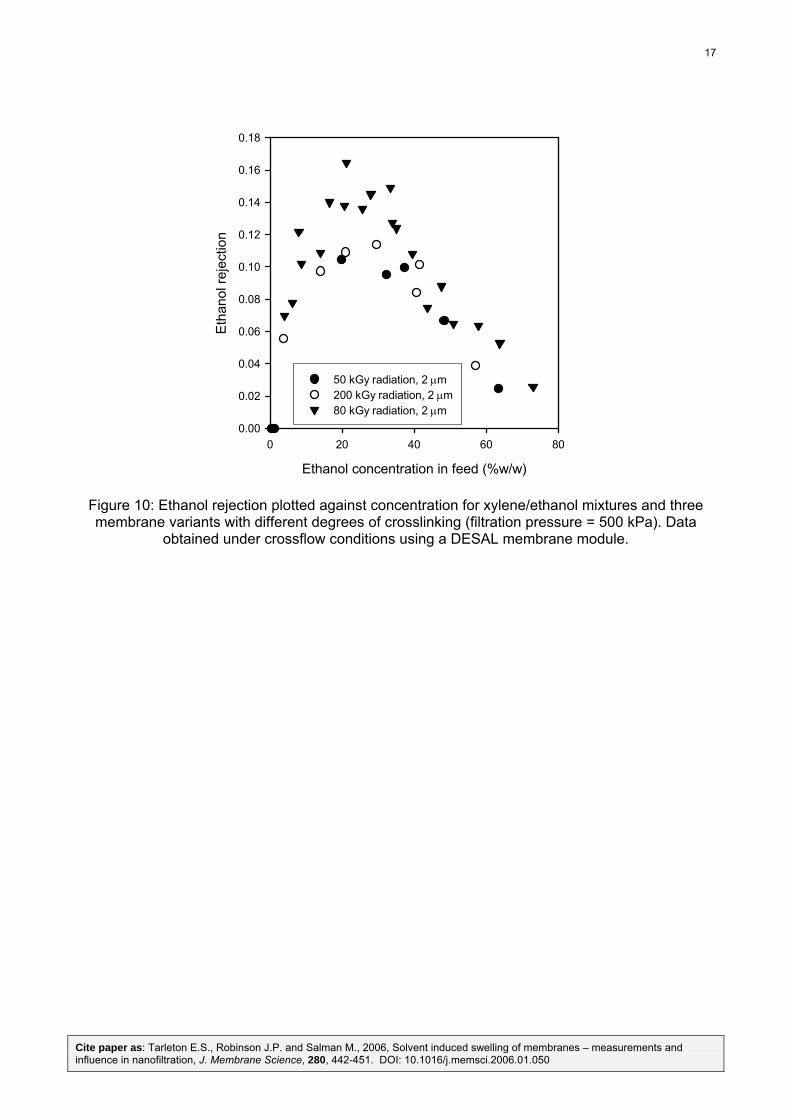
3. A combination of (1.) and (2.). Both (1.) and (2.) are beneficially influenced by the potential enhancements to transport due to the reduced PDMS thickness at raised pressure. That is, respectively, a shorter distance for molecules to diffuse through the membrane or a convective flux increase in accordance with Darcy’s Law. There would need to be significant coincidence for the simultaneously acting factors to induce a linear solvent-flux relationship. Interpreting flux/steady state rejection behaviour in crossflow nanofiltration becomes potentially more complex when polar solvents are considered. Whilst Figure 9, for an ethanol/heptane feed mixture, shows generally similar behaviour to that in Figures 6 and 7 where heptane flux increases with pressure as does ethanol rejection, Figure 10 infers a rather different rejection mechanism (i.e. one that is not based on solute size). Here, rejection data for the 50 and 200 kGy radiation crosslinked membranes are largely superimposed over a wide range of ethanol concentrations which belies the difference in swelling propensity of the two membranes (see Figures 4 and 5). Although Figures 5 and 8 infer that the overall degrees of swelling reduce with increasing ethanol concentration (and pressure), the rejection of ethanol appears to be largely independent of the degree of crosslinking in the PDMS material. Interestingly, the absolute component fluxes of heptane and ethanol were significantly different for each membrane sample but in similar ratios for
Cite paper as: Tarleton E.S., Robinson J.P. and Salman M., 2006, Solvent induced swelling of membranes – measurements and influence in nanofiltration, J. Membrane Science, 280, 442-451. DOI: 10.1016/j.memsci.2006.01.050
7
a given ethanol concentration in the feed. The implication is that the overall degree of swelling affects both alcohol and solvent transport to the same degree which could be seen as evidence that there is little degree of separation during permeation through the depth of the membrane (i.e. coupled flows), and that the majority of the rejection occurs upon sorption into the PDMS layer. The additional data shown on Figure 10 for the 80 kGy radiation, 2 μm membrane, whilst not identical to the membranes subjected to 50 and 200 kGy radiation, show similarities in terms of the position of the peak and the overall levels of rejection. Again, despite very different swelling. CONCLUSIONS A refined method for the in-situ measurement of PDMS layer swelling on composite nanofiltration membranes has been described and data presented that illustrate its capabilities and limitations. The approach offers potential advantages over more conventional techniques including the ability to test membranes in their manufactured state, in a variety of physical arrangements (e.g. clamped, with/without imposed pressure) and the potential to determine transient measurements of swelling (e.g. as solvent progressively wets a membrane or as solvent composition is altered). By extending the measurement range of the technique to membranes with PDMS thicknesses of circa 1 μm then improvements in modelling are likely to ensue in the future. The difficulties of reconciling flux and rejection performance with membrane swelling induced by solvent(s), and the compression induced by an applied filtration pressure, are as yet largely unresolved, however, more realistic measurements of changes in membrane structure can only help to resolve the complex issues facing the membrane community. ACKNOWLEDGEMENTS The authors would like to thank Shell Global Solutions (UK) for supplying some of the solvents and GKSS Forschungszentrum and the University of Twente for supplying the PAN and PAN/PDMS membranes used in the study. REFERENCES 1. Tarleton E.S., Robinson J.P., Smith S.J. and Na J.J.W., 2005, New experimental
measurements of solvent induced swelling in nanofiltration membranes, J. Membrane Science, 261, 129-135.
2. Ho W.S.W. and Sirkar K.K. (Eds.), 1992, Membrane Handbook, Van Nostrand, New York. 3. Stafie N., Stamatialis D.F. and Wessling M., 2003, Insight into the transport of hexane-solute
systems through tailor-made composite membranes, J. Membrane Science, 228, 103-116. 4. Vankelecom I.F.J., De Smet K., Gevers L.E.M., Livingston A., Nair D., Aerts S., Kuypers S. and
Jacobs P.A., 2004, Physico-chemical interpretation of the SRNF transport mechanism for solvents through dense silicone membrane, J. Membrane Science, 231, 99-108.
5. Yoo J.S., Kim S.J. and Choi J.S., 1999, Swelling equilibria of mixed
solvent/polydimethylsiloxane systems, J. Chemical Engineering Data, 44, 16-22. 6. Geens J., van der Bruggen B. and Vandecasteele C., 2004, Characterisation of the solvent
stability of polymeric nanofiltration membranes by measurement of contact angles and swelling, Chemical Engineering Science, 59, 1161-1164.
Cite paper as: Tarleton E.S., Robinson J.P. and Salman M., 2006, Solvent induced swelling of membranes – measurements and influence in nanofiltration, J. Membrane Science, 280, 442-451. DOI: 10.1016/j.memsci.2006.01.050
8
7. Piccinini E., Giacinti Baschetti M. and Sarti G.C., 2004, Use of an automated spring balance for the simultaneous measurement of sorption and swelling in polymeric films, J. Membrane Science, 234, 95-100.
8. Schmidt M., Peinemann K.-V., Scharnagl N., Friese K. and Schubert R., 1996,
Strahlenchemisch modifizieerte Silikonkompositmembran für die Ultrafiltration, German Patent Application DE 96/00336.
9. Dudley C.N., Schöberl B., Sturgill G.K., Beckham H.W. and Rezac M.E., 2001, Influence of
crosslinking technique on the physical and transport properties of ethynyl-terminated monomer/polyetherimide asymmetric membranes. J. Membrane Science, 191, 1-11.
10. Barton A.F.M., 1983, Handbook of solubility parameters and other cohesion parameters, CRC
Press, Boca Raton. 11. Robinson J.P., Tarleton E.S., Millington C.R. and Nijmeijer A., 2004, Evidence for swelling-
induced pore structure in dense PDMS nanofiltration membranes, Filtration, 4(1), 50-56. 12. Tarleton E.S., Robinson J.P., Millington C.R. and Nijmeijer A., 2005, Non-aqueous
nanofiltration: Solute rejection in low-polarity binary systems, J. Membrane Science, 252, 123-131.
13. Robinson J.P., Tarleton E.S., Ebert K., Millington C.R. and Nijmeijer A, 2005, Influence of
cross-linking and process parameters on the separation performance of poly (dimethylsiloxane) nanofiltration membranes, Industrial and Engineering Chemistry Research, 44(9), 3238-3248.
14. Robinson J.P., Tarleton E.S., Millington C.R. and Nijmeijer A., 2004, Solvent flux through
dense polymeric nanofiltration membranes, J. Membrane Science, 230, 29-37. 15. Tarleton E.S., Robinson J.P., Millington C.R., Nijmeijer A. and Taylor M., 2006, The influence
of polarity on flux and rejection behaviour in solvent resistant nanofiltration – experimental observations, J. Membrane Science, 278, 318-327.
16. Scarpello J.T., Nair D., Freitas dos Santos L.M., White L.S. and Livingston A.G., 2002, The
separation of homogeneous organometallic catalysts using solvent resistant nanofiltration, J. Membrane Science, 203, 71-85.
17. Whu J.A., Baltzis B.C. and Sirkar K.K., 2000, Nanofiltration studies of larger organic
microsolutes in methanol solutions, J. Membrane Science, 170(2), 159-172. 18. Bhanushali D., Kloos S. and Bhattacharyya D., 2002, Solute transport in solvent-resistant
nanofiltration membranes for non-aqueous systems: Experimental results and the role of solute-solvent coupling, J. Membrane Science, 208(1-2), 343-359.
19. Porter M.C. (Ed.), 1988, Handbook of industrial membrane technology, pp.161-162, Noyes
Publications, New Jersey. 20. Gibbins E., D’Antonio M., Nair D., White L.S., Freitas dos Santos L.M., Vankelecom I.F.J. and
Livingston A.G., 2002, Observations on solvent flux and solute rejection across solvent resistant nanofiltration membranes, Desalination, 147, 307-313.
21. Paul D.R. and Ebra-Lima O.M., 1970, Pressure-induced diffusion of organic liquids through
highly swollen polymer membranes. J. Applied Polymer Science, 14, 2201-2224.
Cite paper as: Tarleton E.S., Robinson J.P. and Salman M., 2006, Solvent induced swelling of membranes – measurements and influence in nanofiltration, J. Membrane Science, 280, 442-451. DOI: 10.1016/j.memsci.2006.01.050
9
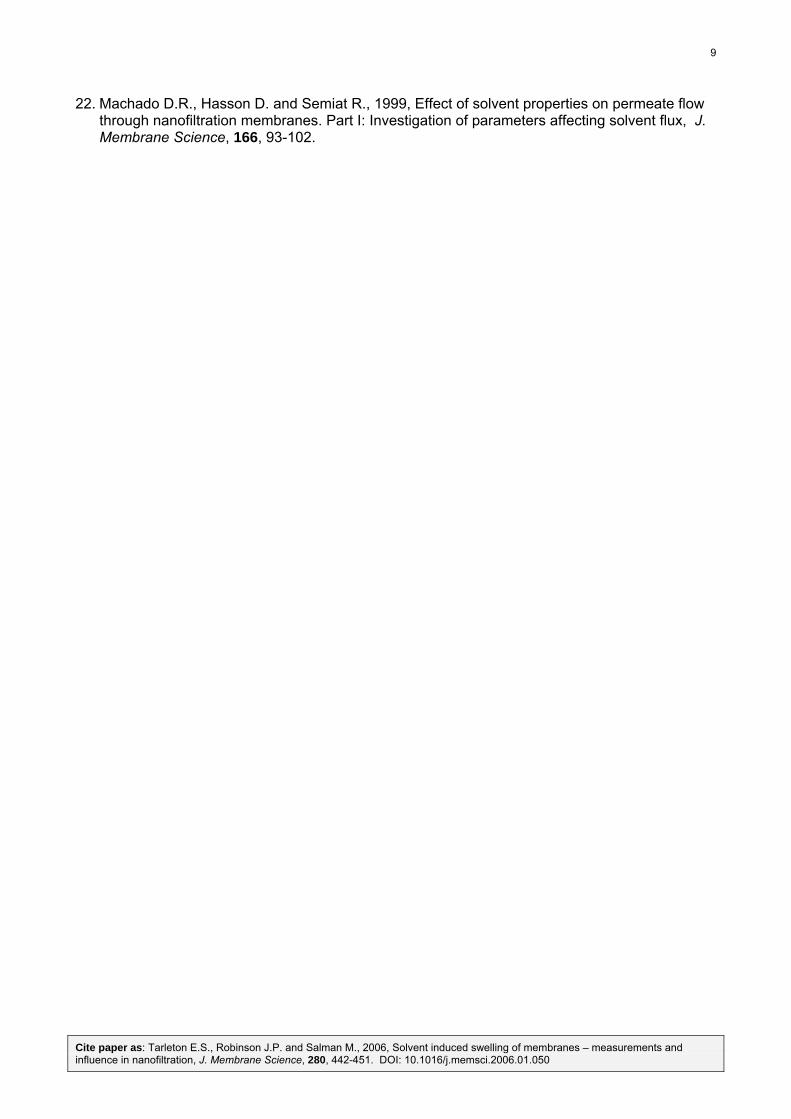
22. Machado D.R., Hasson D. and Semiat R., 1999, Effect of solvent properties on permeate flow through nanofiltration membranes. Part I: Investigation of parameters affecting solvent flux, J. Membrane Science, 166, 93-102.
Cite paper as: Tarleton E.S., Robinson J.P. and Salman M., 2006, Solvent induced swelling of membranes – measurements and influence in nanofiltration, J. Membrane Science, 280, 442-451. DOI: 10.1016/j.memsci.2006.01.050
10
FIGURES AND TABLES
80 kGy radiation, 2 μm (μm)**
Solvent Solubility parameter (δ, MPa0.5)
PAN alone (μm)*
80 kGy radiation,
10 μm (μm)** single double*** triple***
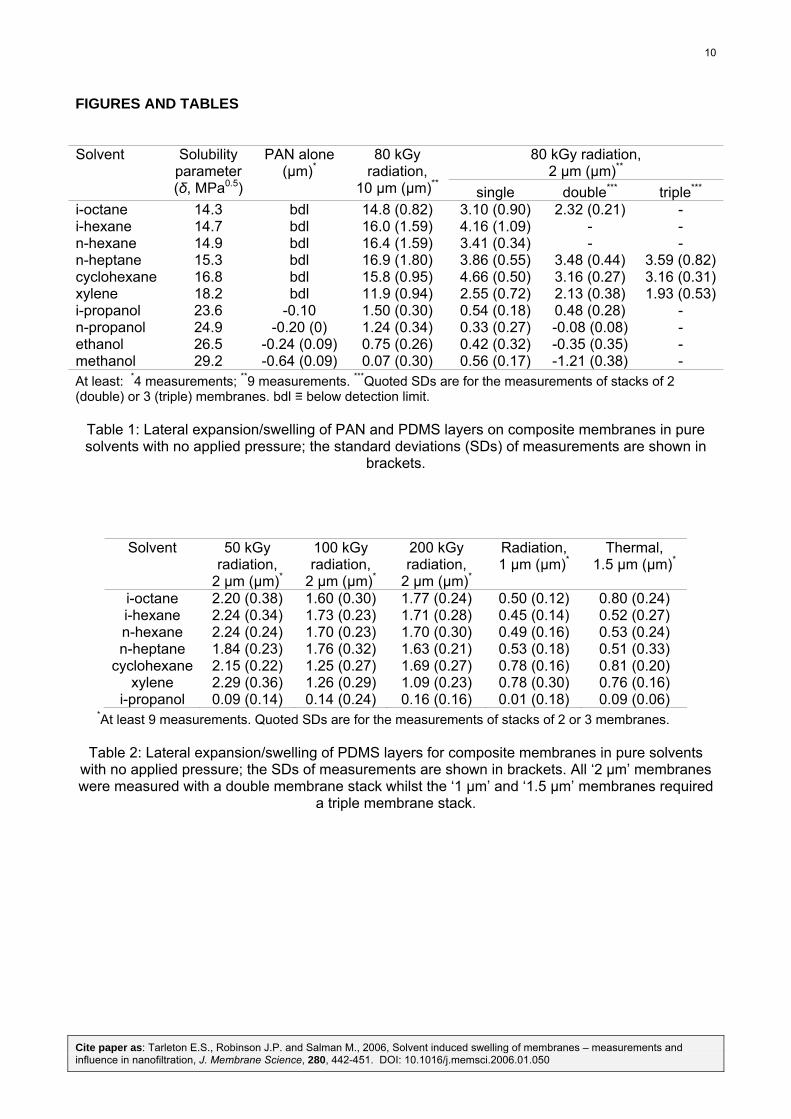
i-octane 14.3 bdl 14.8 (0.82) 3.10 (0.90) 2.32 (0.21) - i-hexane 14.7 bdl 16.0 (1.59) 4.16 (1.09) - - n-hexane 14.9 bdl 16.4 (1.59) 3.41 (0.34) - - n-heptane 15.3 bdl 16.9 (1.80) 3.86 (0.55) 3.48 (0.44) 3.59 (0.82)cyclohexane 16.8 bdl 15.8 (0.95) 4.66 (0.50) 3.16 (0.27) 3.16 (0.31)xylene 18.2 bdl 11.9 (0.94) 2.55 (0.72) 2.13 (0.38) 1.93 (0.53)i-propanol 23.6 -0.10 1.50 (0.30) 0.54 (0.18) 0.48 (0.28) - n-propanol 24.9 -0.20 (0) 1.24 (0.34) 0.33 (0.27) -0.08 (0.08) - ethanol 26.5 -0.24 (0.09) 0.75 (0.26) 0.42 (0.32) -0.35 (0.35) - methanol 29.2 -0.64 (0.09) 0.07 (0.30) 0.56 (0.17) -1.21 (0.38) - At least: *4 measurements; **9 measurements. ***Quoted SDs are for the measurements of stacks of 2 (double) or 3 (triple) membranes. bdl ≡ below detection limit.
Table 1: Lateral expansion/swelling of PAN and PDMS layers on composite membranes in pure solvents with no applied pressure; the standard deviations (SDs) of measurements are shown in
brackets.
Solvent 50 kGy radiation,
2 μm (μm)*
100 kGy radiation,
2 μm (μm)*
200 kGy radiation,
2 μm (μm)*
Radiation, 1 μm (μm)*
Thermal, 1.5 μm (μm)*
i-octane 2.20 (0.38) 1.60 (0.30) 1.77 (0.24) 0.50 (0.12) 0.80 (0.24) i-hexane 2.24 (0.34) 1.73 (0.23) 1.71 (0.28) 0.45 (0.14) 0.52 (0.27) n-hexane 2.24 (0.24) 1.70 (0.23) 1.70 (0.30) 0.49 (0.16) 0.53 (0.24) n-heptane 1.84 (0.23) 1.76 (0.32) 1.63 (0.21) 0.53 (0.18) 0.51 (0.33)
cyclohexane 2.15 (0.22) 1.25 (0.27) 1.69 (0.27) 0.78 (0.16) 0.81 (0.20) xylene 2.29 (0.36) 1.26 (0.29) 1.09 (0.23) 0.78 (0.30) 0.76 (0.16)
i-propanol 0.09 (0.14) 0.14 (0.24) 0.16 (0.16) 0.01 (0.18) 0.09 (0.06) *At least 9 measurements. Quoted SDs are for the measurements of stacks of 2 or 3 membranes.
Table 2: Lateral expansion/swelling of PDMS layers for composite membranes in pure solvents with no applied pressure; the SDs of measurements are shown in brackets. All ‘2 μm’ membranes were measured with a double membrane stack whilst the ‘1 μm’ and ‘1.5 μm’ membranes required
a triple membrane stack.

Cite paper as: Tarleton E.S., Robinson J.P. and Salman M., 2006, Solvent induced swelling of membranes – measurements and influence in nanofiltration, J. Membrane Science, 280, 442-451. DOI: 10.1016/j.memsci.2006.01.050
11
Pressure
(kPa) 80 kGy
radiation, 10 μm (μm)*
80 kGy radiation,
2 μm (μm)**, †
200 kGy radiation,
2 μm (μm)**, †
Thermal, 1.5 μm (μm)**, †
0 16.9 (2.90) 3.48 (0.44) 1.63 (0.22) 0.52 (0.33) 19 - 1.74 (0.27) 1.20 (0.16) 0.39 (0.23) 68 - 1.70 (0.28) 1.19 (0.3) 0.15 (0.11)
100 14.4 (1.40) - - - 131 - 1.69 (0.15) 1.18 (0.09) 0.15 (0.15) 348 - 1.29 (0.16) 1.12 (0.26) 0.11 (0.11) 475 - 1.19 (0.19) 0.94 (0.08) 0.11 (0.20) 500 8.77 (2.30) - - - 985 - 1.10 (0.16) 0.93 (0.44) 0.09 (0.06)
1000 6.50 (0.70) - - - 1500 4.67 (0.90) - - - 1622 - 0.97 (0.15) 0.70 (0.21) 0.09 (0.18) 2100 4.33 (0.50) - - -
At least *9 measurements; **5 measurements. †Quoted SDs are for the measurements of stacks of 2 or 3 membranes. Table 3: Lateral expansion/swelling of PDMS layers on composite membranes in pure heptane as
a function of applied pressure; the standard deviations (SDs) of measurements are shown in brackets.

Cite paper as: Tarleton E.S., Robinson J.P. and Salman M., 2006, Solvent induced swelling of membranes – measurements and influence in nanofiltration, J. Membrane Science, 280, 442-451. DOI: 10.1016/j.memsci.2006.01.050
12
(a) 80 kGy radiation, 10 μm (b) 80 kGy radiation, 2 μm
(c) 200 kGy radiation, 2 μm (d) 100 kGy radiation, 2 μm
(e) 50 kGy radiation, 2 μm (f) Radiation, 1 μm
(g) Thermal, 1.5 μm
Figure 1: Micrographs of the tested membranes. The dimension on a sub-legend refers to the
nominal PDMS thickness in the unswollen state. The size bar represents a length of 60 μm on (a)-(f) and 2 μm on (g).
PDMS
PAN
cellulose fibre
Pore intrusion
Cite paper as: Tarleton E.S., Robinson J.P. and Salman M., 2006, Solvent induced swelling of membranes – measurements and influence in nanofiltration, J. Membrane Science, 280, 442-451. DOI: 10.1016/j.memsci.2006.01.050
13
(1)
(2)
(3)(4) (5)
(7)
(6)
(8)
(9)
(1)
(2)
(3) (4) (5)
(7)
(6)
(8)
(9)
(11)
(12)
(13)
(a) (b)
(10) (10)
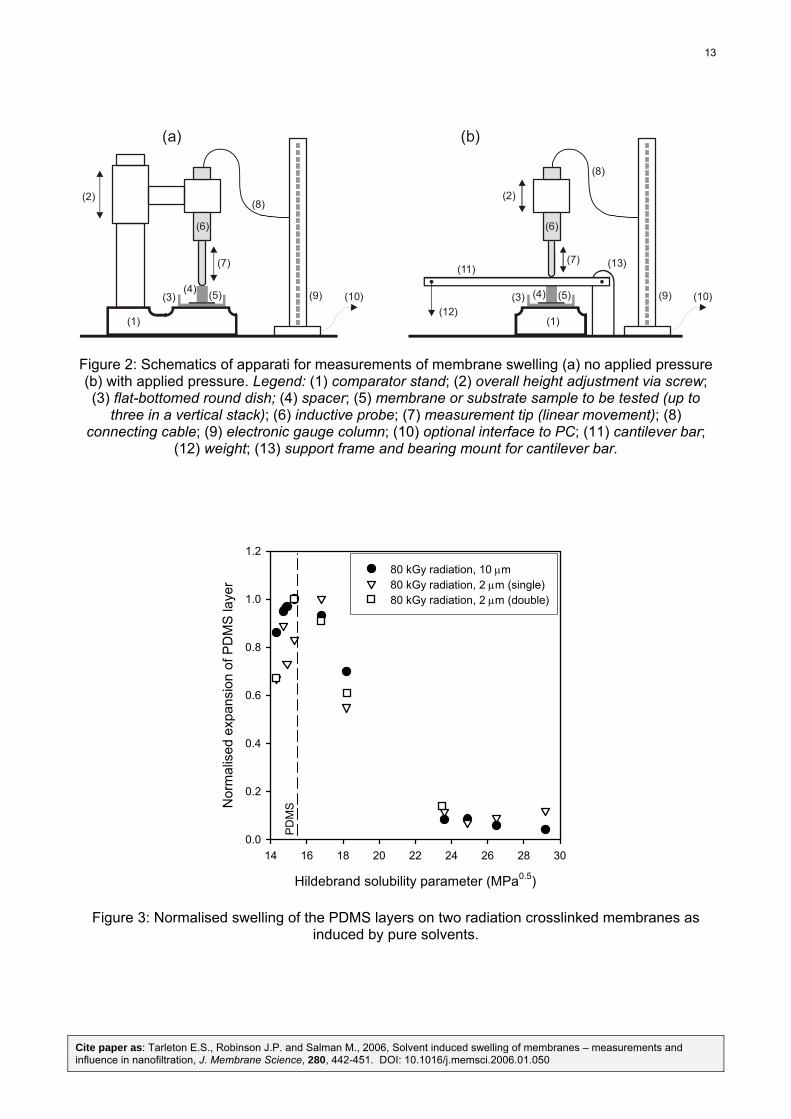
Figure 2: Schematics of apparati for measurements of membrane swelling (a) no applied pressure (b) with applied pressure. Legend: (1) comparator stand; (2) overall height adjustment via screw; (3) flat-bottomed round dish; (4) spacer; (5) membrane or substrate sample to be tested (up to
three in a vertical stack); (6) inductive probe; (7) measurement tip (linear movement); (8) connecting cable; (9) electronic gauge column; (10) optional interface to PC; (11) cantilever bar;
(12) weight; (13) support frame and bearing mount for cantilever bar.
Hildebrand solubility parameter (MPa0.5)
14 16 18 20 22 24 26 28 30
Nor
mal
ised
exp
ansi
on o
f PD
MS
laye
r
0.0
0.2
0.4
0.6
0.8
1.0
1.280 kGy radiation, 10 μm80 kGy radiation, 2 μm (single)80 kGy radiation, 2 μm (double)
PD
MS
Figure 3: Normalised swelling of the PDMS layers on two radiation crosslinked membranes as induced by pure solvents.
Cite paper as: Tarleton E.S., Robinson J.P. and Salman M., 2006, Solvent induced swelling of membranes – measurements and influence in nanofiltration, J. Membrane Science, 280, 442-451. DOI: 10.1016/j.memsci.2006.01.050
14
Hildebrand solubility parameter (MPa0.5)
14 16 18 20 22 24
Ave
rage
exp
ansi
on o
f PD
MS
laye
r (μ m
)
0
1
2
3
480 kGy radiation, 2 μm50 kGy radiation, 2 μm100 kGy radiation, 2 μm200 kGy radiation, 2 μmradiation, 1 μmthermal, 1.5 μm
PD
MS
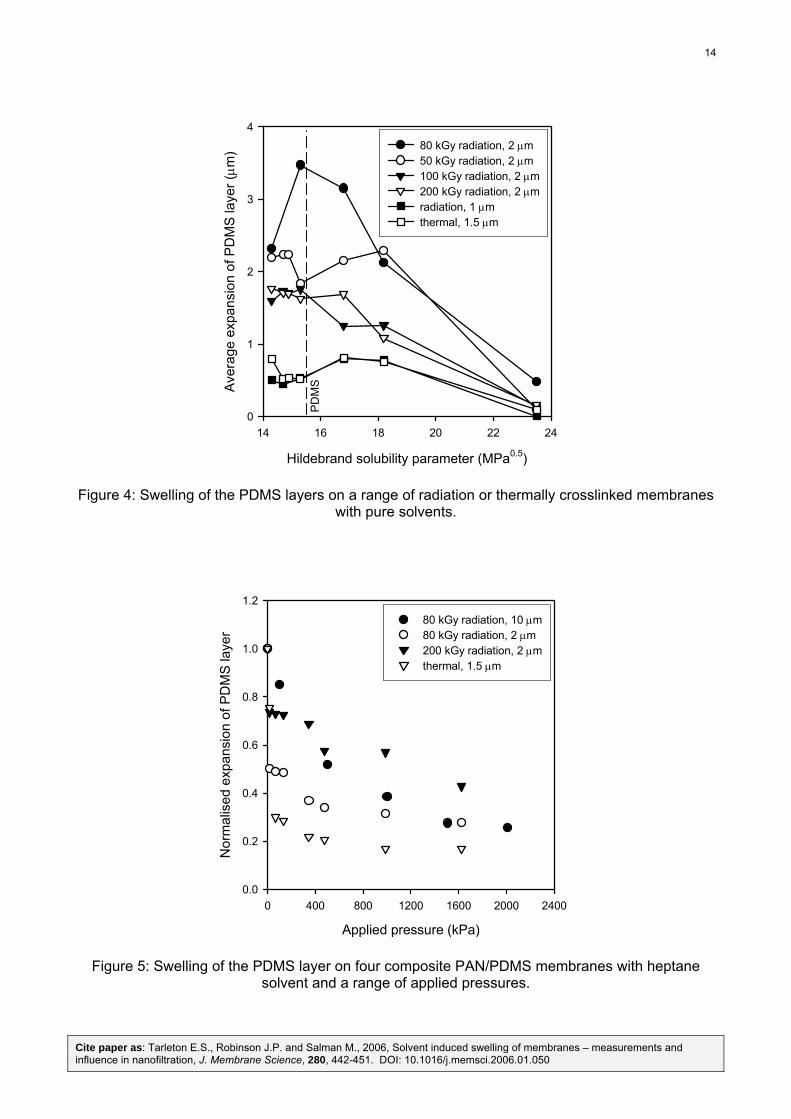
Figure 4: Swelling of the PDMS layers on a range of radiation or thermally crosslinked membranes
with pure solvents.
Applied pressure (kPa)
0 400 800 1200 1600 2000 2400
Nor
mal
ised
exp
ansi
on o
f PD
MS
laye
r
0.0
0.2
0.4
0.6
0.8
1.0
1.2
80 kGy radiation, 10 μm80 kGy radiation, 2 μm200 kGy radiation, 2 μmthermal, 1.5 μm
Figure 5: Swelling of the PDMS layer on four composite PAN/PDMS membranes with heptane solvent and a range of applied pressures.
Cite paper as: Tarleton E.S., Robinson J.P. and Salman M., 2006, Solvent induced swelling of membranes – measurements and influence in nanofiltration, J. Membrane Science, 280, 442-451. DOI: 10.1016/j.memsci.2006.01.050
15
Filtration pressure (kPa)
0 150 300 450 600 750 900
Xyle
ne fl
ux (l
m-2
h-1
)
0
10
20
30
40
50
6080 kGy radiation, 2 μm50 kGy radiation, 2 μm100 kGy radiation, 2 μm200 kGy radiation, 2 μmradiation, 1 μmthermal, 1.5 μm
Figure 6: Flux-pressure relationships in crossflow nanofiltration with xylene solvent for a range of PAN/PDMS composite membranes.
Filtration pressure (kPa)
0 150 300 450 600 750 900
Rej
ectio
n of
9,1
0 di
phen
ylan
thra
cene
0.0
0.2
0.4
0.6
0.8
50 kGy radiation, 2 μm200 kGy radiation, 2 μmthermal, 1.5 μm
Figure 7: Rejection behaviour in crossflow nanofiltration for three membranes with xylene solvent and 9,10 diphenylanthracene (PNA) solute at a feed concentration of 20 ppm. The rejection with
the other membranes showed similar trends but have been omitted for clarity.
Cite paper as: Tarleton E.S., Robinson J.P. and Salman M., 2006, Solvent induced swelling of membranes – measurements and influence in nanofiltration, J. Membrane Science, 280, 442-451. DOI: 10.1016/j.memsci.2006.01.050
16
Ethanol concentration (%w/w)
0 20 40 60 80 100
Ave
rage
exp
ansi
on o
f PD
MS
laye
r (μ m
)
0
2
4
6
8
10
12
14
Applied pressure (kPa)
0 500 1000 1500 2000 2500
concentrationpressure (15% ethanol)
Figure 8: The typical influence of applied pressure and ethanol concentration on swelling in xylene/ethanol mixtures (80 kGy radiation, 10 μm membrane).
Filtration pressure (kPa)
0 200 400 600 800 1000
Hep
tane
flux
(l m
-2 h
-1)
0
10
20
30
40
Etha
nol r
ejec
tion
0.0
0.1
0.2
0.3
0.4fluxrejection
Figure 9: Heptane flux and ethanol rejection in crossflow nanofiltration for a 25% ethanol/75 % heptane feed (weight basis) with an 80 kGy radiation, 2 μm membrane.
Cite paper as: Tarleton E.S., Robinson J.P. and Salman M., 2006, Solvent induced swelling of membranes – measurements and influence in nanofiltration, J. Membrane Science, 280, 442-451. DOI: 10.1016/j.memsci.2006.01.050
17
Ethanol concentration in feed (%w/w)
0 20 40 60 80
Eth
anol
reje
ctio
n
0.00
0.02
0.04
0.06
0.08
0.10
0.12
0.14
0.16
0.18
50 kGy radiation, 2 μm200 kGy radiation, 2 μm80 kGy radiation, 2 μm
Figure 10: Ethanol rejection plotted against concentration for xylene/ethanol mixtures and three membrane variants with different degrees of crosslinking (filtration pressure = 500 kPa). Data
obtained under crossflow conditions using a DESAL membrane module.