soil fertility and nutrient...
TRANSCRIPT
NRCCA Soil Fertility & Nutrient Management – Study Guide – 10/26/2016
1
SOIL FERTILITY
AND NUTRIENT MANAGEMENT
Competency Areas
Competency Area 1: Basic Concepts of Plant Nutrition ................................................... 2
Competency Area 2: Basic Concepts of Soil Fertility ....................................................... 3
Competency Area 3: Soil Testing and Plant Tissue Analysis ........................................... 8
Competency Area 4: Nutrient Sources, Analyses, Application Methods ........................ 18
Competency Area 5: Soil pH and Liming ....................................................................... 26
Competency Area 6: Nutrient Management Planning .................................................... 32
2016 Authors/Instructors for Soil Fertility and Nutrient Management
o Quirine Ketterings, Professor, Nutrient Management Spear Program, Department of Animal Science, Cornell University.
o Karl Czymmek, Senior Extension Associate, PRO-DAIRY Program, Department of Animal Science, Cornell University.
o Doug Beegle, Professor, Department of Plant Sciences, Penn State University.
o Joe Lawrence, Dairy Forage Systems Specialist, PRO-DAIRY Program, Department of Animal Science, Cornell University.
With thanks to our past contributors:
o Tom Buob, Extension Educator, University of New Hampshire Cooperative Extension.
o Patty Ristow, Extension Associate, Nutrient Management Spear Program, Department of Animal Science, Cornell University.
Lead Editors: Nicole Smaranda, NRCCA Intern, and Quirine Ketterings, NRCCA Co-Chair.
Last Updated 10-26-2016
NRCCA Soil Fertility & Nutrient Management – Study Guide – 10/26/2016
2
Competency Area 1: Basic Concepts of Plant Nutrition
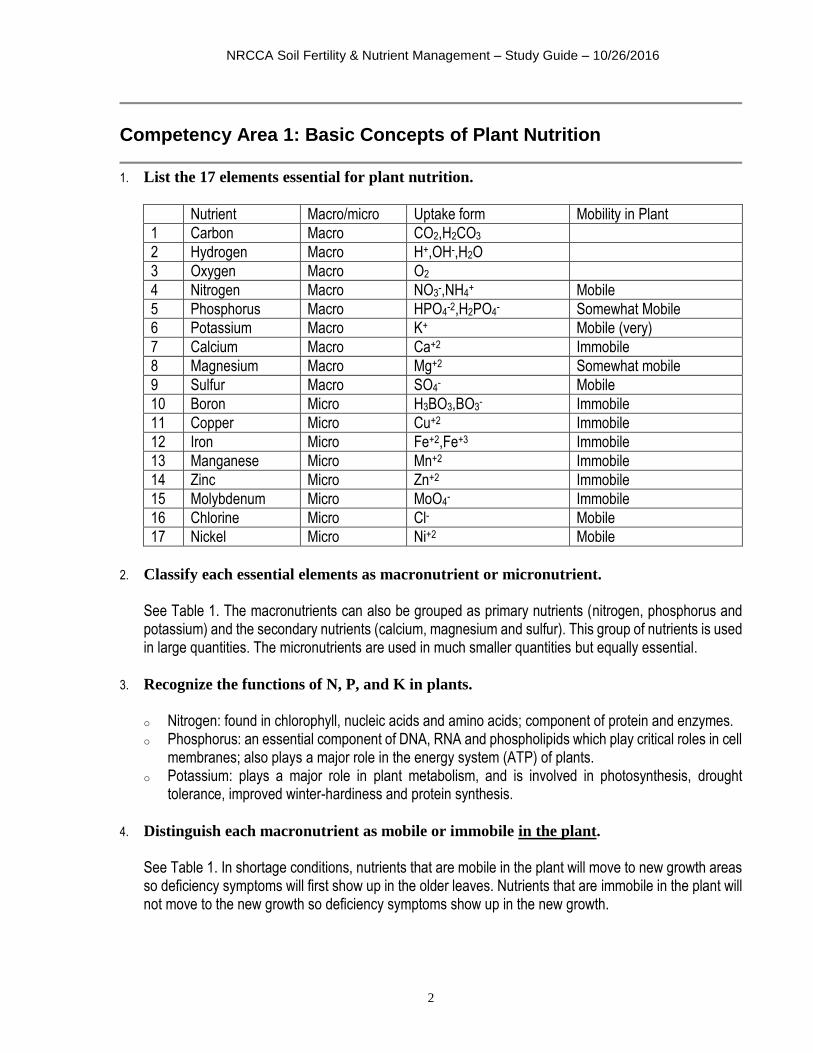
1. List the 17 elements essential for plant nutrition.
Nutrient Macro/micro Uptake form Mobility in Plant
1 Carbon Macro CO2,H2CO3
2 Hydrogen Macro H+,OH-,H2O
3 Oxygen Macro O2
4 Nitrogen Macro NO3-,NH4
+ Mobile
5 Phosphorus Macro HPO4-2,H2PO4
- Somewhat Mobile
6 Potassium Macro K+ Mobile (very)
7 Calcium Macro Ca+2 Immobile
8 Magnesium Macro Mg+2 Somewhat mobile
9 Sulfur Macro SO4- Mobile
10 Boron Micro H3BO3,BO3- Immobile
11 Copper Micro Cu+2 Immobile
12 Iron Micro Fe+2,Fe+3 Immobile
13 Manganese Micro Mn+2 Immobile
14 Zinc Micro Zn+2 Immobile
15 Molybdenum Micro MoO4- Immobile
16 Chlorine Micro Cl- Mobile
17 Nickel Micro Ni+2 Mobile
2. Classify each essential elements as macronutrient or micronutrient.
See Table 1. The macronutrients can also be grouped as primary nutrients (nitrogen, phosphorus and potassium) and the secondary nutrients (calcium, magnesium and sulfur). This group of nutrients is used in large quantities. The micronutrients are used in much smaller quantities but equally essential.
3. Recognize the functions of N, P, and K in plants.
o Nitrogen: found in chlorophyll, nucleic acids and amino acids; component of protein and enzymes. o Phosphorus: an essential component of DNA, RNA and phospholipids which play critical roles in cell
membranes; also plays a major role in the energy system (ATP) of plants. o Potassium: plays a major role in plant metabolism, and is involved in photosynthesis, drought
tolerance, improved winter-hardiness and protein synthesis.
4. Distinguish each macronutrient as mobile or immobile in the plant.
See Table 1. In shortage conditions, nutrients that are mobile in the plant will move to new growth areas so deficiency symptoms will first show up in the older leaves. Nutrients that are immobile in the plant will not move to the new growth so deficiency symptoms show up in the new growth.
NRCCA Soil Fertility & Nutrient Management – Study Guide – 10/26/2016
3
5. List chemical uptake forms for each macronutrient.
See Table 1. Take note: some of the nutrients are taken up in more than one form.
6. Describe how nutrient demands change at different plant growth stages.
In general, nutrient needs increase as the plant grows through the seedling stage into the reproductive stage (silking and tasseling). For nitrogen, the rate of uptake increases rapidly between V8 (knee high typically) and R1 (silking). When plants are young and small, nutrient need is low. As plants enlarge and start to grow rapidly, nutrient needs increase dramatically.
Competency Area 2: Basic Concepts of Soil Fertility
7. Recognize the role of the following in supplying nutrients from the soil:
A. Soil solution
B. Cation exchange sites
C. Organic matter
D. Soil minerals
E. Plant residue
o The soil solution is the liquid in the soil and plant nutrients dissolved in the soil solution can move into the plant as the water is taken up.
o Cations (positively charged ions such as calcium, magnesium and potassium) are held on negatively charged exchange sites in the soil. Cation exchange capacity (CEC) is a measure of the amount of cations that can be held by the soil and released into the soil solution. Soils with a greater cation exchange capacity (see PO#10) are able to hold onto more nutrients. Organic matter contains nutrients that are released for plant uptake through microbial decomposition.
o As soil minerals (clays, carbonates, etc.) weather (breakdown) they release nutrients for plant uptake. A good example of this is potassium.
o As plant residues breakdown, the nutrients in them become available to growing plants. Nitrogen is typically the one we think of, but the other essential nutrients in plant residues will become available for plant uptake as well.
o The speed and degree of the breakdown of residues will depend on environmental factors such as moisture and temperature. Most nutrients are released as the organic molecules in the residue are broken down by microbes. However, some nutrients, like K, are not part of any organic molecules in residues and thus are released much more rapidly.
8. Describe the following nutrient transformations and interactions:
A. Mineralization
B. Immobilization
C. Nutrient uptake antagonism
o Mineralization refers to the conversion of organic N sources (plant residues, manures, and biosolids) to inorganic N sources. This is accomplished by a wide variety of microorganisms.
o Immobilization is the reverse of mineralization as this refers to the conversion of inorganic forms of nitrogen into organic forms, such as microbial cells and organic matter.
NRCCA Soil Fertility & Nutrient Management – Study Guide – 10/26/2016
4
o Mineralization and Immobilization occur at the same time. The net effect of these two processes is typically determined by the ratio of carbon to the nitrogen content in the organic material. For example, a C:N ratio less than ~20 typically results in net mineralization of N and a C:N ratio greater than ~30 typically results in net immobilization of N.
o Nutrient uptake antagonism refers to circumstances where, depending on soil conditions and nutrient form and availability, plant uptake is weighted favorably toward some nutrient(s) over others.
9. Describe how the processes of mass flow, diffusion, and root interception affect nutrient
uptake.
o Mass flow of a nutrient occurs when it is dissolved in the soil solution and flows with water into the plant. This is the major process for uptake of nitrogen, calcium and magnesium.
o Diffusion is the movement of a nutrient from an area of high concentration to one of lower concentration. Typically the nutrient will move from the soil solution (high concentration) to the root surface (low concentration). This is an important process for phosphorus and potassium and is a key theory behind the use of banded or starter fertilizer.
o Root interception occurs when a root grows in to a fresh area or surface of clay or organic matter reducing the distance a nutrient must diffuse and thus increasing absorption of the nutrient. Root interception is extremely important for very immobile nutrients like P and thus having good soil conditions for root growth is essential for good P nutrition.
10. Describe how cation exchange capacity (CEC) influences nutrient mobility and uptake.
Cation exchange capacity (CEC) is a measure of the amount of cations (positively charged ions) that can be held by the soil. As the clay content, organic matter content and pH increase, the CEC will also increase. As CEC increases, so does the ability of the soil to hold nutrients. Since much of the plant uptake (and leaching) of nutrients comes from the soil solution, as the CEC increases, the nutrients in solution decrease and become less mobile in the soil. Having optimum levels of cations on the CEC and having low levels of non-nutrient and potentially harmful cations such as Al on the CEC is important for supplying these essential nutrient cations for plant uptake.
11. Distinguish each macronutrient as mobile or immobile in the soil and recognize
difference in mobility depending on form.
The mobility of nitrogen is dependent on the form it is in. If it is in the nitrate form (NO3-) it is very mobile
with the soil water and can be easily leached. In the ammonium form (NH4+) it can be held on cation
exchange sites and is not susceptible to leaching. Phosphorus is typically immobile in the soil unless soil test levels rise above the soil’s ability to bind it. Calcium, magnesium and potassium are considered immobile in soil since they are held on cation exchange sites. Sulfur (as sulfate SO4
- is an anion and not held on cation exchange sites) is mobile in most soils.
12. Describe how the following soil characteristics affect nutrient uptake:
A. Texture
B. Structure
C. Drainage/aeration
D. Moisture
E. pH
F. Temperature
NRCCA Soil Fertility & Nutrient Management – Study Guide – 10/26/2016
5
o Texture is defined as the proportion of sand, silt and clay in the soil. As the clay content increases, so does the CEC, resulting in a greater ability to hold nutrients. Soils with more sand and less clay have lower CECs and cannot hold as many cations. Since sandy soils also have large pore spaces, leaching of nutrients is greater than on a soil with more silt and clay.
o Soil structure is defined as the arrangement of soil particles into aggregates. Good soil structure is represented by significant aggregation. This allows for optimal root growth and water and nutrient access for any given soil. Destruction of good structure, by compaction or tillage can result in an increase in runoff since water cannot move as readily down through the soil profile.
o Under poor drainage conditions, nitrate nitrogen can be lost through denitrification. With excessively drained soils (sandy) leaching losses are more important. Some nutrients like iron and manganese are more soluble under very wet or flooded conditions.
o Soil moisture is very important for root growth, so adequate moisture will improve uptake of nutrients by diffusion and root interaction. Soil moisture is also important for organic matter decomposition (which releases N, P and S).
o Soil pH affects the availability of most nutrients. For example, at low pH and high pH, phosphorus is less available than when the pH is around 6.5. At a low pH it is bound by aluminum and iron and at a high pH is bound by calcium. Many of the micronutrients are also sensitive to pH, being more available in slightly acid soils. At high pH’s, molybdenum can become too available and be toxic to plants. See #43 for more detailed information.
o Soil pH is important in N transformations including mineralization of organic materials (biological degradation), nitrification (bacteria responsible for this process are pH sensitive) and N fixation.
o Temperature affects the plant’s ability to grow and thus affects nutrient uptake. Temperature also controls the mineralization of organic forms of nutrients to mineral forms that plants can take up. Mineralization and thus nutrient availability is reduced or stopped completely at very low and very high soil temperatures.
13. Describe how the following affect the fate of N in soil:
A. Fixation by clay
B. Ammonification/mineralization
C. Nitrification
D. Volatilization
E. Denitrification
F. Immobilization
G. Leaching
H. Plant uptake
I. Symbiotic fixation
A. Since the soil has a negative charge, the ammonium ion (NH4+) can be bound to soil particles.
Depending on the type of clay, this ion can be trapped in the actual structure of the clay mineral and become unavailable for plant uptake as well.
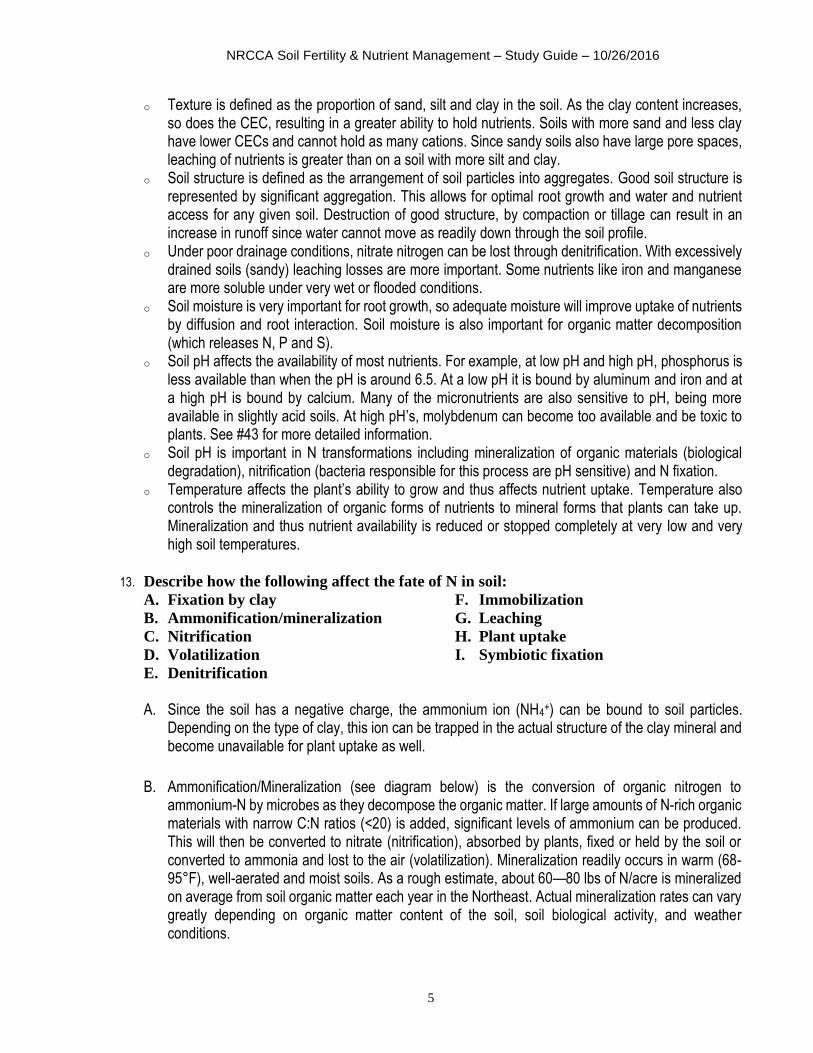
B. Ammonification/Mineralization (see diagram below) is the conversion of organic nitrogen to ammonium-N by microbes as they decompose the organic matter. If large amounts of N-rich organic materials with narrow C:N ratios (<20) is added, significant levels of ammonium can be produced. This will then be converted to nitrate (nitrification), absorbed by plants, fixed or held by the soil or converted to ammonia and lost to the air (volatilization). Mineralization readily occurs in warm (68-95°F), well-aerated and moist soils. As a rough estimate, about 60—80 lbs of N/acre is mineralized on average from soil organic matter each year in the Northeast. Actual mineralization rates can vary greatly depending on organic matter content of the soil, soil biological activity, and weather conditions.
NRCCA Soil Fertility & Nutrient Management – Study Guide – 10/26/2016
6
Ammonification/Mineralization R reflects the (undefined) rest of the molecule.
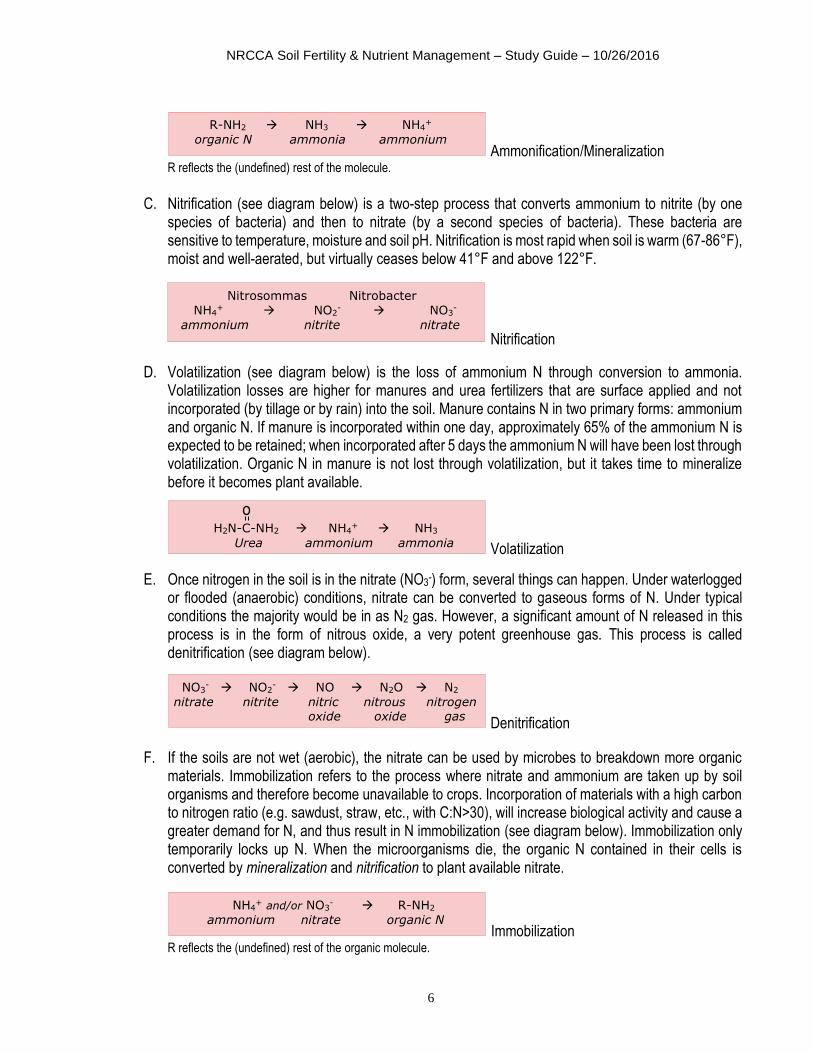
C. Nitrification (see diagram below) is a two-step process that converts ammonium to nitrite (by one species of bacteria) and then to nitrate (by a second species of bacteria). These bacteria are sensitive to temperature, moisture and soil pH. Nitrification is most rapid when soil is warm (67-86°F), moist and well-aerated, but virtually ceases below 41°F and above 122°F.
Nitrification
D. Volatilization (see diagram below) is the loss of ammonium N through conversion to ammonia. Volatilization losses are higher for manures and urea fertilizers that are surface applied and not incorporated (by tillage or by rain) into the soil. Manure contains N in two primary forms: ammonium and organic N. If manure is incorporated within one day, approximately 65% of the ammonium N is expected to be retained; when incorporated after 5 days the ammonium N will have been lost through volatilization. Organic N in manure is not lost through volatilization, but it takes time to mineralize before it becomes plant available.
Volatilization
E. Once nitrogen in the soil is in the nitrate (NO3-) form, several things can happen. Under waterlogged
or flooded (anaerobic) conditions, nitrate can be converted to gaseous forms of N. Under typical conditions the majority would be in as N2 gas. However, a significant amount of N released in this process is in the form of nitrous oxide, a very potent greenhouse gas. This process is called denitrification (see diagram below).
Denitrification
F. If the soils are not wet (aerobic), the nitrate can be used by microbes to breakdown more organic materials. Immobilization refers to the process where nitrate and ammonium are taken up by soil organisms and therefore become unavailable to crops. Incorporation of materials with a high carbon to nitrogen ratio (e.g. sawdust, straw, etc., with C:N>30), will increase biological activity and cause a greater demand for N, and thus result in N immobilization (see diagram below). Immobilization only temporarily locks up N. When the microorganisms die, the organic N contained in their cells is converted by mineralization and nitrification to plant available nitrate.
Immobilization
R reflects the (undefined) rest of the organic molecule.
R-NH2 NH3 NH4+
organic N ammonia ammonium
Nitrosommas Nitrobacter NH4
+ NO2
- NO3
-
ammonium nitrite nitrate
H2N-C-NH2 NH4
+ NH3
Urea ammonium ammonia
NO3- NO2
- NO N2O N2
nitrate nitrite nitric nitrous nitrogen oxide oxide gas
NH4+ and/or NO3
- R-NH2
ammonium nitrate organic N
NRCCA Soil Fertility & Nutrient Management – Study Guide – 10/26/2016
7
G. If sufficient rain occurs nitrate can be lost to groundwater by leaching through the soil profile below the roots of the plants.
H. If conditions are aerobic (not wet or flooded) nitrate can be taken up by the plants.
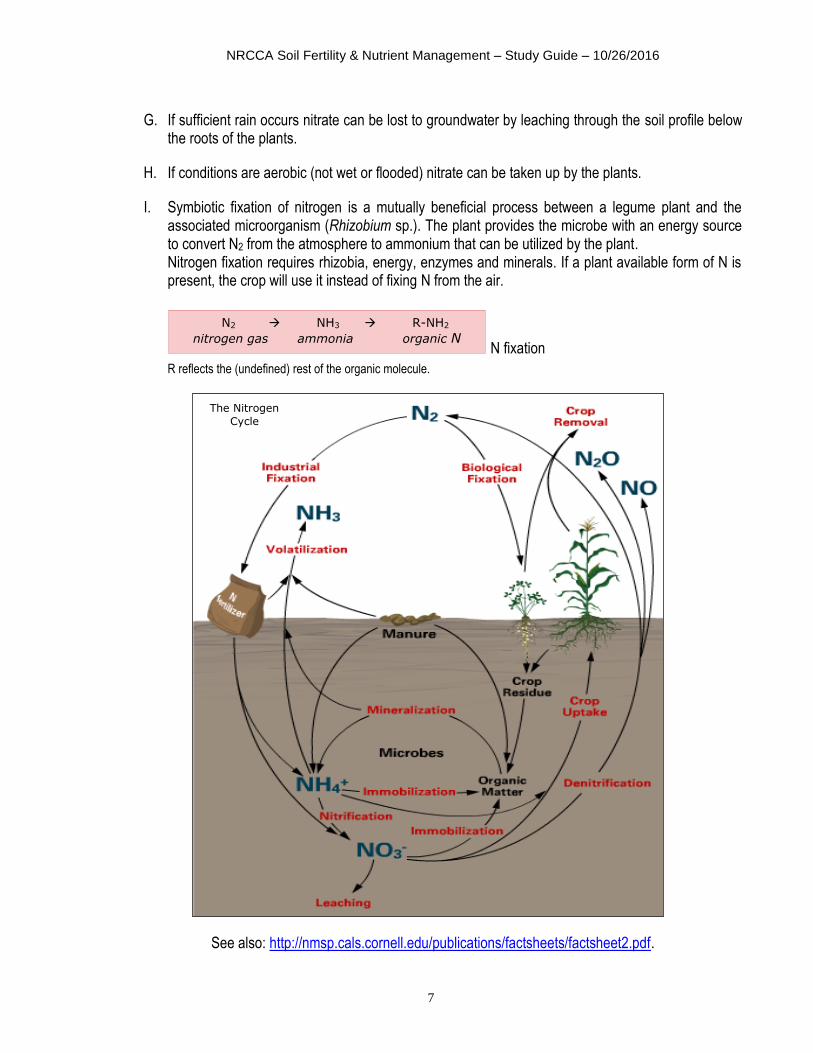
I. Symbiotic fixation of nitrogen is a mutually beneficial process between a legume plant and the associated microorganism (Rhizobium sp.). The plant provides the microbe with an energy source to convert N2 from the atmosphere to ammonium that can be utilized by the plant. Nitrogen fixation requires rhizobia, energy, enzymes and minerals. If a plant available form of N is present, the crop will use it instead of fixing N from the air.
N fixation
R reflects the (undefined) rest of the organic molecule.
See also: http://nmsp.cals.cornell.edu/publications/factsheets/factsheet2.pdf.
N2 NH3 R-NH2
nitrogen gas ammonia organic N
The Nitrogen
Cycle
NRCCA Soil Fertility & Nutrient Management – Study Guide – 10/26/2016
8
14. Describe how the following soil factors affect symbiotic nitrogen fixation:
A. pH
B. Moisture
C. Population of correct Rhizobia species
D. Nitrogen level
E. Aeration
F. Organic matter
o The microbes that are responsible for symbiotic nitrogen fixation are very sensitive to pH. As the pH drops, fixation will slow. Very little will occur below a pH of 5.0.
o The Rhizobia species that are responsible for fixation operate under good moisture conditions. If it gets too wet or dry microbial activity will slow down. Under drought conditions, fixation will stop.
o There are numerous species of Rhizobium, and they each require a specific host. The inoculation of the legume seed with the correct species (especially the first time this legume has been in the field) is extremely important to obtaining good levels of fixation. For example, the symbiotic bacteria for soybean will not fix nitrogen with alfalfa.
o As readily available nitrogen from other sources (fertilizers, manures, biosolids, organic matter) increases, the amount of nitrogen fixed decreases.
o Since the Rhizobia are aerobic bacteria, aeration is very important. Under very wet conditions they will not fix as much nitrogen. Under wet conditions, leaching and denitrification losses may increase as well.
o If the organic matter content is very high, and the supply of available nitrogen is plentiful, the bacteria will not fix as much nitrogen.
15. Recognize how different crops and cropping systems affect soil fertility and fertilization
strategies based on the processes outlined in Competency Area 6 in Crop Management
Fertility management in one year will impact fertility status the next year. Thus, recommendation systems should take into account crop rotations. One example is corn in rotation with hay (alfalfa, alfalfa-grass or grass). First year corn after hay does not need any additional N, aside from potentially 20-30 lbs N/acre of starter fertilizer, as it benefits from the significant pool of N mineralized from the roots and remaining above ground biomass of the hay present before rotation to corn. Also corn after soybeans needs less external N (typically 20-30 lbs N/acre less) as it benefits from the soybean in the rotation. Similarly, when manure is applied to meet N needs of a crop like corn, P and K are typically applied in excess of crop removal, typically eliminating the need for additional P and K for the crop that follows the corn. Often times in wheat and corn rotations, farmers manage fertility for the corn, while the wheat benefits from nutrients not taken up by the corn.
Competency Area 3: Soil Testing and Plant Tissue Analysis
16. Recognize how the following affect soil sampling methods:
A. Method of previous fertilizer application
B. Tillage system
C. Nutrient stratification
D. Within-field soil and crop variability
NRCCA Soil Fertility & Nutrient Management – Study Guide – 10/26/2016
9
A. Banding of fertilizer applications and manure spreading are known to increase spatial variability within a field. Not every inch of surface area receives the same amount of fertilizer and/or manure and the more variability in the field, the more sub-samples should be taken. Avoid sampling in any fertilizer bands where possible.
B. Tillage can impact distribution of nutrients over a field and over depth (deep tillage, zone till, etc.). This can impact sampling density as fewer samples per unit area are needed for less variable fields. However, for practical implications, a reduction in sampling density is not recommended unless intense (grid) sampling shows that a similar reliability can be obtained at a lower sampling density.
C. In no-till systems, nutrient stratification is usually greater than for conventionally tilled fields. Consistent sampling to the recommended depth is critical in no-till systems. For soil pH in no-till systems, two soil samples will be needed, one representing 0-1 inch (for seeding) and another for 1-6 inches depth. If the surface sample (0-1 inch) pH is below 6.0 a limestone application should be made even if the deeper sample does not call for liming.
D. For the best sampling protocol, take 2-3 subsamples per acre and combine into a composite sample. One composite sample should not represent more than 10 acres (unless past sampling shows minimal differences). Also the area to be sampled should be relatively uniform, i.e. similar soil properties and past management. If there are known significant differences within the area to be sampled e.g. old fence rows, manure or lime stockpile areas, wet spots, etc., a modified sampling strategy should be followed. If the areas are too small to manage separately, avoid taking any subsamples from these areas. If they are large enough for the farmer to practically manage them separately, take a separate sample from these areas.
17. Indicate how the following may cause variability in soil test results:
A. Time of sampling
B. Depth of sampling
C. Number of samples taken
D. Sample handling
E. Type of extraction method used
(Morgan, Modified Morgan,
Mehlich-3, Bray, Olson)
Nutrient content of the soil solution and soil matrix vary depending on the time of year. To minimize variability and build the strongest historic records take samples in the same time of the year.
Take samples over a constant depth to minimize additional variability and build the strongest historic records. Depth of soil samples depends on tillage used on the field. Samples are normally taken from the surface to the tillage depth (usually 6-8 inches deep). This depth is important because lime and fertilizer are mixed within the tilled layer. For lime recommendations for no-till or minimum-till crops, take a sample from the 0-1 inch depth and one from 0-6 inches. The two samples should be placed in separate plastic bags labeled clearly with “0-1 inch” and “0-6 inch”.
For the best sampling protocol, one sample should not represent more than 10 acres. One sample should represent one management unit (consider soil type and past management). Test at least once in 3 years or twice in a rotation.
Use the right sampling tool: probe or auger and a clean plastic bucket. Take 2-3 subsamples per acre across a uniform field. Mix subsamples and take a 1 cup subsample. Label the sample and keep a record of the sample and its location. Avoid sampling when the soil is very wet. Scrape away surface litter before inserting the soil probe. Take equal amounts for each subsample. Take cores to plow depth (no-till: 0-1 + 0-6 inches, conventional tillage 0-8 inches). Sample between crop rows, avoid fence rows. Remove stones, wood, trash and other debris.
NRCCA Soil Fertility & Nutrient Management – Study Guide – 10/26/2016
10
Have samples analyzed by a lab that uses soil testing extraction methods that are appropriate and recommended for the area.
Historical records help managers and agronomists track changes over time. For the best comparisons, have the analyses done by the same laboratory (same extraction method) each time you soil test. Conversion equations between different extraction methods and laboratories are not 100% correlated and errors are introduced when conversion equations are used. Furthermore results from one laboratory cannot be combined with another to create a historical record.
18. Compare and contrast the following approaches for making fertilizer
recommendations:
A. Sufficiency level
B. Soil buildup and maintenance
C. Cation saturation ratios
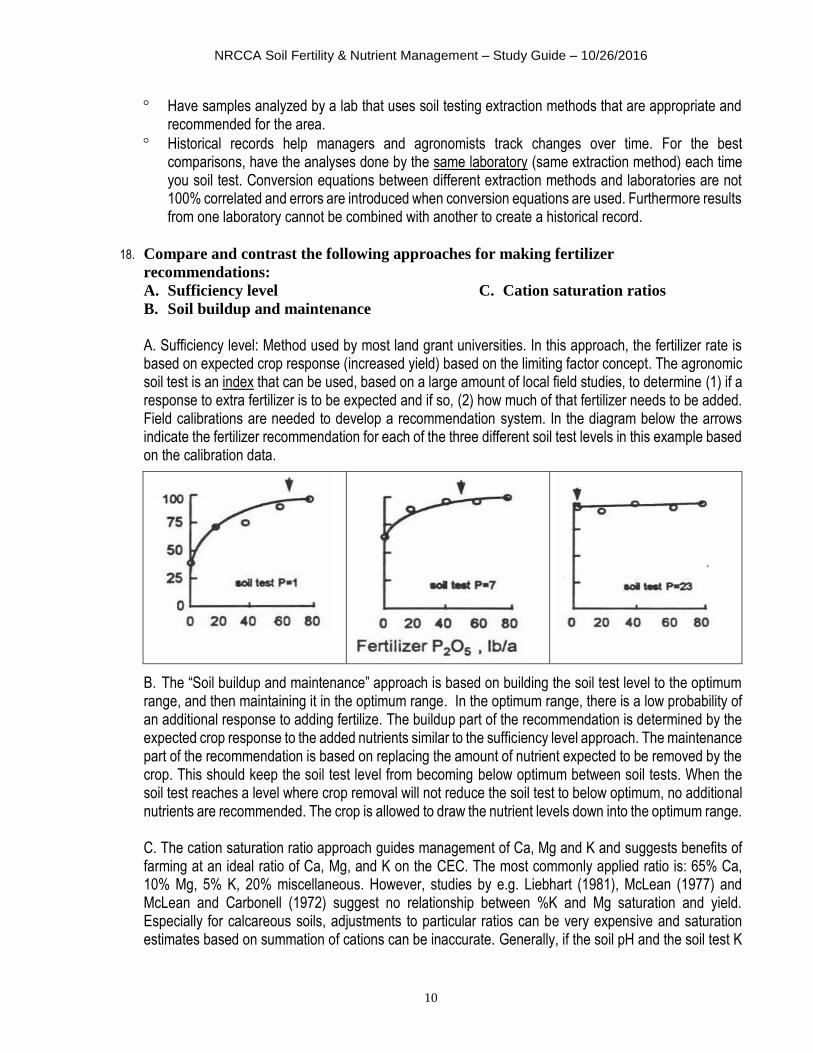
A. Sufficiency level: Method used by most land grant universities. In this approach, the fertilizer rate is based on expected crop response (increased yield) based on the limiting factor concept. The agronomic soil test is an index that can be used, based on a large amount of local field studies, to determine (1) if a response to extra fertilizer is to be expected and if so, (2) how much of that fertilizer needs to be added. Field calibrations are needed to develop a recommendation system. In the diagram below the arrows indicate the fertilizer recommendation for each of the three different soil test levels in this example based on the calibration data.
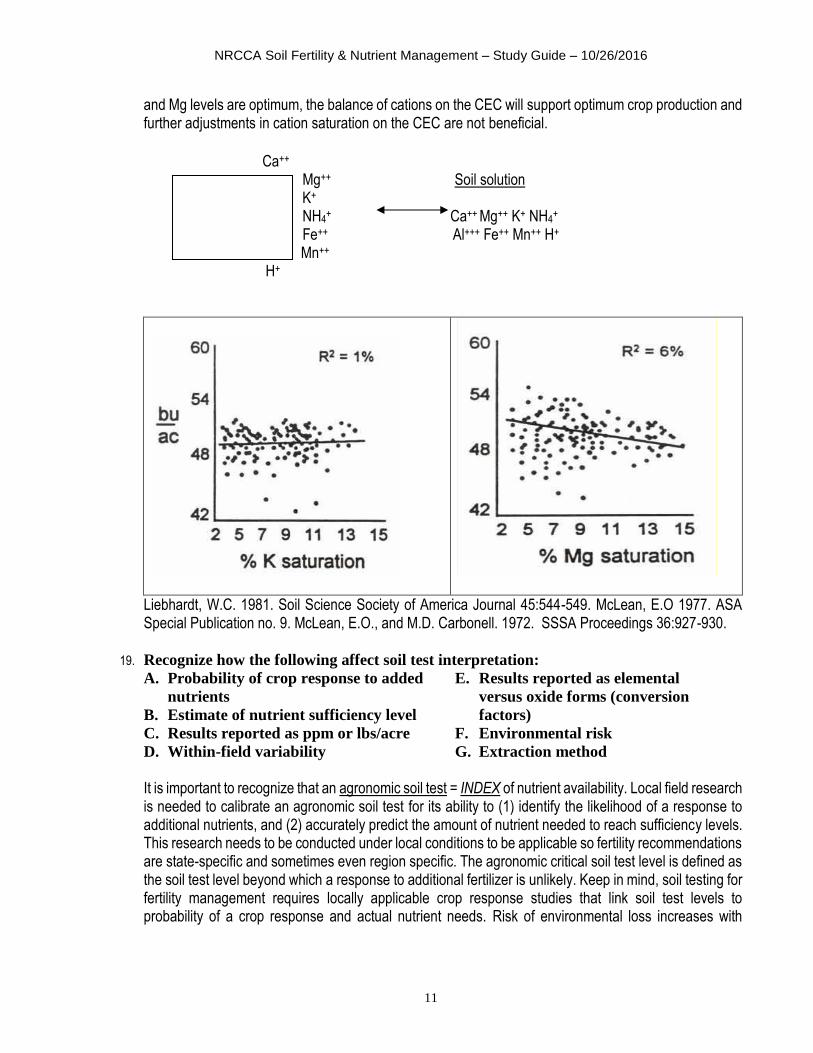
B. The “Soil buildup and maintenance” approach is based on building the soil test level to the optimum range, and then maintaining it in the optimum range. In the optimum range, there is a low probability of an additional response to adding fertilize. The buildup part of the recommendation is determined by the expected crop response to the added nutrients similar to the sufficiency level approach. The maintenance part of the recommendation is based on replacing the amount of nutrient expected to be removed by the crop. This should keep the soil test level from becoming below optimum between soil tests. When the soil test reaches a level where crop removal will not reduce the soil test to below optimum, no additional nutrients are recommended. The crop is allowed to draw the nutrient levels down into the optimum range. C. The cation saturation ratio approach guides management of Ca, Mg and K and suggests benefits of farming at an ideal ratio of Ca, Mg, and K on the CEC. The most commonly applied ratio is: 65% Ca, 10% Mg, 5% K, 20% miscellaneous. However, studies by e.g. Liebhart (1981), McLean (1977) and McLean and Carbonell (1972) suggest no relationship between %K and Mg saturation and yield. Especially for calcareous soils, adjustments to particular ratios can be very expensive and saturation estimates based on summation of cations can be inaccurate. Generally, if the soil pH and the soil test K
NRCCA Soil Fertility & Nutrient Management – Study Guide – 10/26/2016
11
and Mg levels are optimum, the balance of cations on the CEC will support optimum crop production and further adjustments in cation saturation on the CEC are not beneficial.
Ca++
Mg++ Soil solution K+ NH4
+ Ca++ Mg++ K+ NH4+
Fe++ Al+++ Fe++ Mn++ H+ Mn++ H+
Liebhardt, W.C. 1981. Soil Science Society of America Journal 45:544-549. McLean, E.O 1977. ASA Special Publication no. 9. McLean, E.O., and M.D. Carbonell. 1972. SSSA Proceedings 36:927-930.
19. Recognize how the following affect soil test interpretation:
A. Probability of crop response to added
nutrients
B. Estimate of nutrient sufficiency level
C. Results reported as ppm or lbs/acre
D. Within-field variability
E. Results reported as elemental
versus oxide forms (conversion
factors)
F. Environmental risk
G. Extraction method
It is important to recognize that an agronomic soil test = INDEX of nutrient availability. Local field research is needed to calibrate an agronomic soil test for its ability to (1) identify the likelihood of a response to additional nutrients, and (2) accurately predict the amount of nutrient needed to reach sufficiency levels. This research needs to be conducted under local conditions to be applicable so fertility recommendations are state-specific and sometimes even region specific. The agronomic critical soil test level is defined as the soil test level beyond which a response to additional fertilizer is unlikely. Keep in mind, soil testing for fertility management requires locally applicable crop response studies that link soil test levels to probability of a crop response and actual nutrient needs. Risk of environmental loss increases with
NRCCA Soil Fertility & Nutrient Management – Study Guide – 10/26/2016
12
increase in soil test beyond the critical soil test value. Within-field variability needs to be taken into account in soil sampling protocols (see PO#20).
As a first requirement, a good soil testing laboratory needs to have a good quality control system in place. However, high quality laboratories can give different results if individual samples are split and sent to different laboratories. This is because soil testing laboratories can differ in: 1) Nature of the extract used (e.g. Morgen, modified Morgan, Mehlich-3, Bray-1). 2) Shaking time. 3) Solution to soil ratio. 4) Analytical procedure/instruments used. 5) Way of reporting results (ppm or lbs/acre, P or P2O5, K or K2O):
1 ppm = 2 lbs/acre (`7 inches deep)
1 lb P/acre = 2.3 lbs P2O5/acre;
1 lb K/acre = 1.2 lbs K2O/acre
Most common extraction methods used in the Northeast include Morgan (sodium acetate), modified Morgan (ammonium acetate), Mehlich-3, and for P also Bray-1 and Olsen. These various methodologies were developed for specific purposes (Bray for low pH soils, Olsen for calcareous soils, etc.).The recommended test for an area should always be used. Results from one method can only be equated to those from another method (or laboratory) if reliable conversion equations exist. Even then, converted results are not as good as using the recommended test to begin with.
20. Describe soil sampling strategies and know their application:
A. Random sampling
B. Grid-based
C. Soil type based sampling
D. EC or yield map based
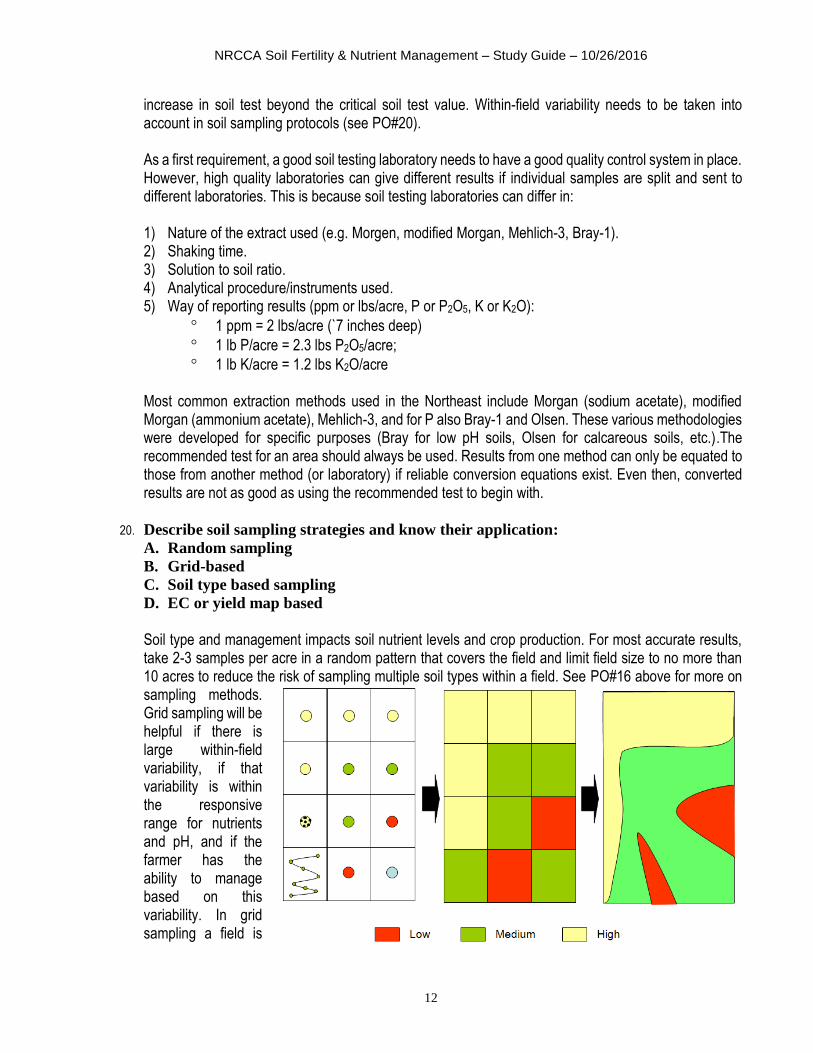
Soil type and management impacts soil nutrient levels and crop production. For most accurate results, take 2-3 samples per acre in a random pattern that covers the field and limit field size to no more than 10 acres to reduce the risk of sampling multiple soil types within a field. See PO#16 above for more on sampling methods. Grid sampling will be helpful if there is large within-field variability, if that variability is within the responsive range for nutrients and pH, and if the farmer has the ability to manage based on this variability. In grid sampling a field is
NRCCA Soil Fertility & Nutrient Management – Study Guide – 10/26/2016
13
divided into small (usually 1-4 acres) blocks (grid cells) and a separate soil sample is taken from each of these grid cells. The sample may be 6-10 subsamples taken from a small area at the center of the grid cell or it may be 6-10 subsamples taken randomly (see above) from throughout the grid cell. Sample results are compiled either directly into a map showing the different soil test levels and recommendations for each grid cell or the test results may be statistically smoothed to create a map (see figure on the right). It is important that appropriate statistical methods are used to create these maps. In recent years, soil sampling based on electrical conductivity mapping or yield mapping has increased in popularity. These approaches both divide fields in zones (typically 2-4 zones) which are then assessed for soil fertility. Such sampling can be more targeted and less time-consuming than grid sampling. Further research is needed to develop management guidelines based on EC or yield zones in the Northeast.
21. Recognize factors that influence the results of the pre-sidedress nitrogen test:
A. Timing of sampling relative to
weather patterns
B. Depth of sampling
C. Field variability
D. Sample processing
The Pre-Sidedress Nitrate Test (PSNT) is an in- season soil nitrate test that can be used to determine if additional fertilizer nitrogen (N) is needed for corn. This test is taken at sidedressing time just before the period of major N demand by corn. It is most useful for fields with a history of manure and/or sod incorporation. The PSNT is not a direct measure of available N, but is designed to: 1) estimate the soil’s nitrate supplying potential, and 2) decide if that is enough N to meet crop needs. The PSNT is particularly useful when it is unclear whether enough manure was actually applied. Over the course of a few years, carefully compare PSNT results with fertilizer and manure inputs and crop performance. When to use: o In corn fields, 2nd year or more after a sod and/or where the manure rate is uncertain. o If not enough manure was applied to meet the expected N needs of the crop. Where not to use the PSNT: o The test is useless for corn fields that received pre-plant or early post-plant broadcast fertilizer N
applications (other than <40 lbs starter N/acre). Any “leftover” nitrate from broadcast fertilizer will be picked up by the PSNT, resulting in an overestimation of the true organic N supply.
o First year corn after a grass and/or alfalfa does not need additional N beyond a small starter N application (20-30 lbs N/acre). So, it is a waste of time and money to sidedress N for first year corn therefore it is not necessary to take a PSNT. In addition, PSNT results of first year corn fields tend to underestimate actual N supply making them less reliable as indicators.
How to take samples? o Limit sampling to areas of 10 acres or less and take a separate sample for areas with different corn
stands (different population densities, stage of development, and/or color, crop histories, fertility management, significant changes in slope, etc.).
o Sample between corn rows to a depth of 12 inches (stay away from the starter band). o Sample when the corn is 6-12 inches tall. o Do not sample too close to a rain event that could have resulted in nitrate leaching (wait for 2-3 days
after significant rainfall). o Samples should be dried immediately (spread the sample thinly and dry in the sun or under a fan) to
stop N mineralization and sent to the laboratory.
NRCCA Soil Fertility & Nutrient Management – Study Guide – 10/26/2016
14
Interpretations can be state-specific. The PSNT guidelines for New York are:
PSNT ppm
nitrate-N
Likeliness of an economic response to extra N
N guideline
≥ 25 Low No additional N needed
21 – 24 About 10% If uncertain, consider sidedressing 25-50 lbs N/acre
<21 High Apply sidedress N according to the Cornell N guidelines for corn*
*The N guidelines for corn as well as the NYS Corn N Calculator can be downloaded from the NMSP website: (nmsp.cals.cornell.edu/nutrient_guidelines). For fields with <21 ppm: o If a PSNT sample is collected from a field expected to need sidedress N (for example a field that
received less manure than needed to meet N needs), add the extra N. o If a PSNT sample is collected from a field not expected to require sidedress N (for example where
manure applications should have supplied sufficient N), make sure the field actually received the planned manure application and that the field history is correctly recorded. Check N needs with the NYS Corn N Calculator. If under the lowest manure application estimates, the calculator still shows that no additional N is needed, despite the PSNT being <21 ppm, organic-N mineralization rates early in the season were likely lower than average but no additional N is needed because the field is expected to supply sufficient nitrogen from organic sources once mineralization conditions improve (warm and moist soils). If the calculator shows that additional N is needed and the PSNT is <21 ppm, consider adding the extra N.
22. Describe how to use plant tissue analysis for:
A. Problem solving/diagnosis
B. Nutrient program monitoring
C. In-season nutrient management
Analyzing plant tissue can indicate the success of a soil fertility program and uncover potential problems. Plant tissue analysis complements soil testing by measuring the nutrients actually taken up by the plant. In addition, secondary nutrients and micronutrients that currently are not routinely measured in soils can be measured reliably in plants. It should be noted, however, that plant nutrient content represents the effects of not only soil nutrient status but also all the factors controlling plant growth. Therefore, a single year’s information may not be useful for planning a soil fertility management program. But as results are accumulate over a period of years, the information will become more valuable. Sample collection is very important. The nutrient concentration in a plant varies with the plant’s age and the part of the plant sampled. If plant analyses are to be meaningful, the appropriate plant part must be collected for the age of the plant, and enough plants must be included to obtain a representative sample. Specific directions on plant sampling generally are available with each sampling kit from the plant analysis laboratory.
Plant tissue analyses may be useful in diagnosing crop nutritional problems. Take samples from the problem area and a nearby “normal” area for comparison. Then, use all available information to interpret the plant analysis for diagnosing a nutrient deficiency. Look carefully at symptoms on the plants, note any patterns in the field, and consider the timing of the problem’s appearance. Keep in mind that not all nutrient deficiencies in plants are the result of nutrient deficiencies in the soil. Soil testing and plant analysis can confirm each other, but they also can indicate when the cause of the problem is something other than a nutrient deficiency in the soil. If the soil test level is adequate but the plants are deficient,
NRCCA Soil Fertility & Nutrient Management – Study Guide – 10/26/2016
15
some other factor is limiting the plant’s ability to take up nutrients. Some areas to consider include: possible interactions with other cultural practices such as tillage or pesticide use; pest injury such as rootworm feeding; differences in varieties or hybrids; or soil physical conditions such as compaction. o Leaf symptoms are only guides to the source of the trouble - don’t use leaf symptoms alone. o Usually under field conditions more than one deficiency symptoms is present; therefore, symptoms
are complicated. o Diseases may enhance nutrient deficiencies and vice-versa. o Stress of any type can produce or enhance plant symptoms, i.e., the purple coloring of corn in spring
is brought on by cold stress, dry conditions or cultivator damage resulting in root pruning can cause K deficiency. Zn deficiency is often the result of poor root growth.
23. Recognize how the following terms relate to plant nutrient level:
A. Critical value
B. Sufficiency range
C. Optimum, below optimum and
above optimum soil nutrient levels
D. Luxury consumption
E. Toxicity level
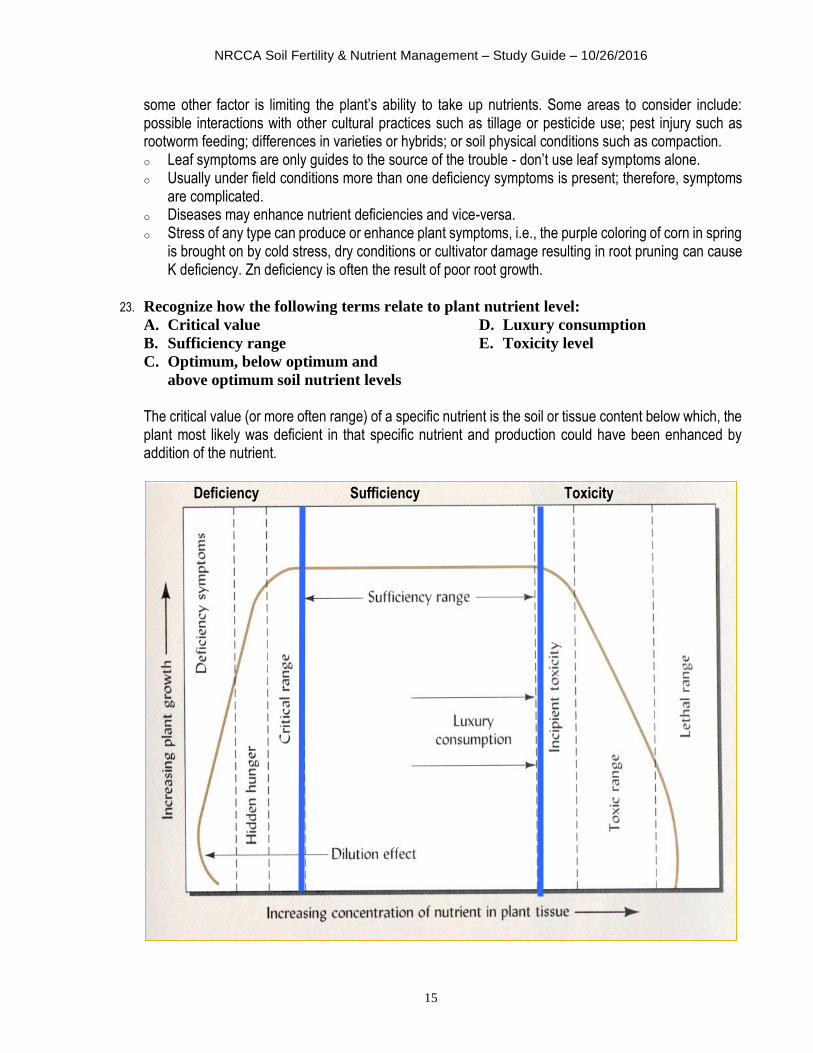
The critical value (or more often range) of a specific nutrient is the soil or tissue content below which, the plant most likely was deficient in that specific nutrient and production could have been enhanced by addition of the nutrient.
Deficiency Sufficiency Toxicity

NRCCA Soil Fertility & Nutrient Management – Study Guide – 10/26/2016
16
Thus, below the critical value, the nutrient levels are below optimum. Luxury consumption occurs when plants take up more of a specific nutrient than needed for optimum functioning and production. An example of a nutrient that can be consumed in excess of crop needs is potassium.
24. Recognize how the following affect plant tissue analysis results:
A. Crop species
B. Growth stage
C. Plant part sampled
D. Crop stress level
E. Time of day sampled
F. Sample handling
Plant tissue nutrient interpretation depends on (1) species sampled, (2) plant part, and (3) time of sampling. Sampling is not recommended when the plant part is soil or dust covered, mechanically injured, damaged by insects, or diseased, or under moisture or temperature stress (early morning sampling is preferred). Plants under long periods of stress can develop unusual concentrations which can be misleading. Samples should be cleaned to remove surface contamination. The washing should be quick to avoid leaching of nutrients like potassium and calcium. Always look up specific sampling instructions prior to sampling. Examples are: Tree fruits: Time: between 60 and 70 days after average petal fall day
Part: the middle of the current season’s terminal shoots Strawberries: Time: within the first 6 weeks after harvest
Part: healthy leaves, well exposed to light Alfalfa: Time: bud to 10% bloom
Part: leaves from the top 1/3 of the plant
25. Recognize factors that influence the results of the corn stalk nitrate test: a. Sampling protocol b. Manure history c. Crop rotation d. Fertilizer rate, method of application and timing
The corn stalk nitrate test (CSNT) is an end-of-season evaluation of the N supply for corn during the growing season. It is useful as a management tool as it helps assess N management at the end of the growing season and can identify if adjustments in N management may be useful in future years. It is recommended for use for 2nd or higher year corn after hay, continuous corn, or corn after soybeans. The interpretations are:
Low (deficient) = less than 250 ppm N
Marginal (possibly deficient in challenging years) = 250 to 750 ppm N
Optimal (target) = 750 to 2000 ppm N
Excess (more than the corn needed) = greater than 2000 ppm N Low (deficient) Plants had difficulty accessing enough nitrogen in the sample area. Nitrogen access was hindered by inadequate supply, root restrictions, lack of moisture, or nutrient deficiency interactions. At harvest time, leaves are dead to or above the ear leaf and/or the entire plant has a light green color.
NRCCA Soil Fertility & Nutrient Management – Study Guide – 10/26/2016
17
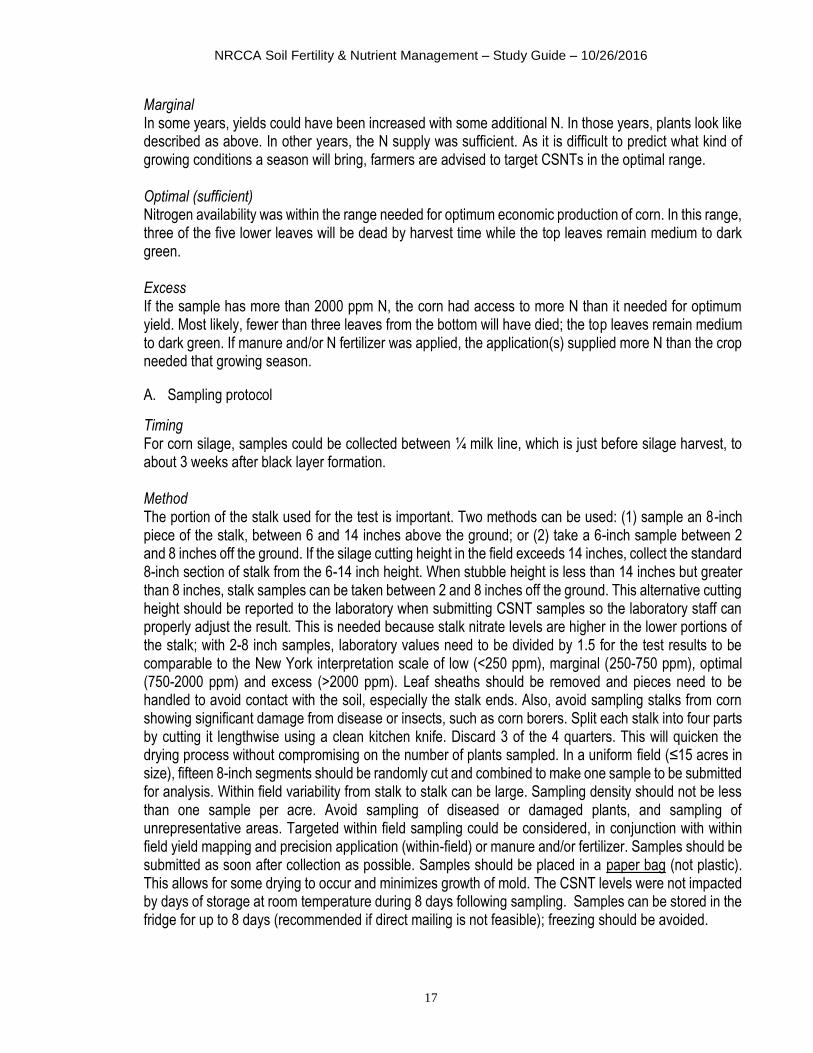
Marginal In some years, yields could have been increased with some additional N. In those years, plants look like described as above. In other years, the N supply was sufficient. As it is difficult to predict what kind of growing conditions a season will bring, farmers are advised to target CSNTs in the optimal range. Optimal (sufficient) Nitrogen availability was within the range needed for optimum economic production of corn. In this range, three of the five lower leaves will be dead by harvest time while the top leaves remain medium to dark green. Excess If the sample has more than 2000 ppm N, the corn had access to more N than it needed for optimum yield. Most likely, fewer than three leaves from the bottom will have died; the top leaves remain medium to dark green. If manure and/or N fertilizer was applied, the application(s) supplied more N than the crop needed that growing season.
A. Sampling protocol
Timing For corn silage, samples could be collected between ¼ milk line, which is just before silage harvest, to about 3 weeks after black layer formation. Method The portion of the stalk used for the test is important. Two methods can be used: (1) sample an 8-inch piece of the stalk, between 6 and 14 inches above the ground; or (2) take a 6-inch sample between 2 and 8 inches off the ground. If the silage cutting height in the field exceeds 14 inches, collect the standard 8-inch section of stalk from the 6-14 inch height. When stubble height is less than 14 inches but greater than 8 inches, stalk samples can be taken between 2 and 8 inches off the ground. This alternative cutting height should be reported to the laboratory when submitting CSNT samples so the laboratory staff can properly adjust the result. This is needed because stalk nitrate levels are higher in the lower portions of the stalk; with 2-8 inch samples, laboratory values need to be divided by 1.5 for the test results to be comparable to the New York interpretation scale of low (<250 ppm), marginal (250-750 ppm), optimal (750-2000 ppm) and excess (>2000 ppm). Leaf sheaths should be removed and pieces need to be handled to avoid contact with the soil, especially the stalk ends. Also, avoid sampling stalks from corn showing significant damage from disease or insects, such as corn borers. Split each stalk into four parts by cutting it lengthwise using a clean kitchen knife. Discard 3 of the 4 quarters. This will quicken the drying process without compromising on the number of plants sampled. In a uniform field (≤15 acres in size), fifteen 8-inch segments should be randomly cut and combined to make one sample to be submitted for analysis. Within field variability from stalk to stalk can be large. Sampling density should not be less than one sample per acre. Avoid sampling of diseased or damaged plants, and sampling of unrepresentative areas. Targeted within field sampling could be considered, in conjunction with within field yield mapping and precision application (within-field) or manure and/or fertilizer. Samples should be submitted as soon after collection as possible. Samples should be placed in a paper bag (not plastic). This allows for some drying to occur and minimizes growth of mold. The CSNT levels were not impacted by days of storage at room temperature during 8 days following sampling. Samples can be stored in the fridge for up to 8 days (recommended if direct mailing is not feasible); freezing should be avoided.
NRCCA Soil Fertility & Nutrient Management – Study Guide – 10/26/2016
18
B. Manure history This test is not meant as a one-time measurement; it is most effective when used for multiple years on the same field (or fields with similar histories) to determine how the fields respond to the way N is being managed. However, if fields test 3000 ppm or higher in CSNT, there will be opportunities to cut N application rates without impacting yield after just one year of results. Crop history, manure history, other N inputs, soil type, and growing conditions all impact CSNT results and crop management records that include these pieces of information can be used to evaluate CSNT results and determine where changes can be made. Manure will release N over time and this N supply will be reflected in the CSNT results.
C. Crop rotation It is not recommended to take CSNT samples for 1st year corn after hay as 1st year corn fields do not need the extra N while the slower release of N from organic sources (such as the roots and biomass of a hay field), typically results in lower CSNT results. To avoid confusion, sample 2nd or higher year corn fields after hay, continuous corn or corn after soybean fields only.
D. Fertilizer rate, method of application and timing Nitrogen supply is reflected in CSNT results (in addition to weather and other possible stress factors) so fertilizer rate, method of application and timing all impact CSNT results. It is important to apply the 4Rs (see PO#52) for optimum yield, quality and reduced risk of N loss to the environment.
Competency Area 4: Nutrient Sources, Analyses, Application Methods
26. Describe the following crop response relationships:
a. Diminishing returns response curve
b. Plateau yield
c. Critical response level
d. Economic optimum nutrient rate
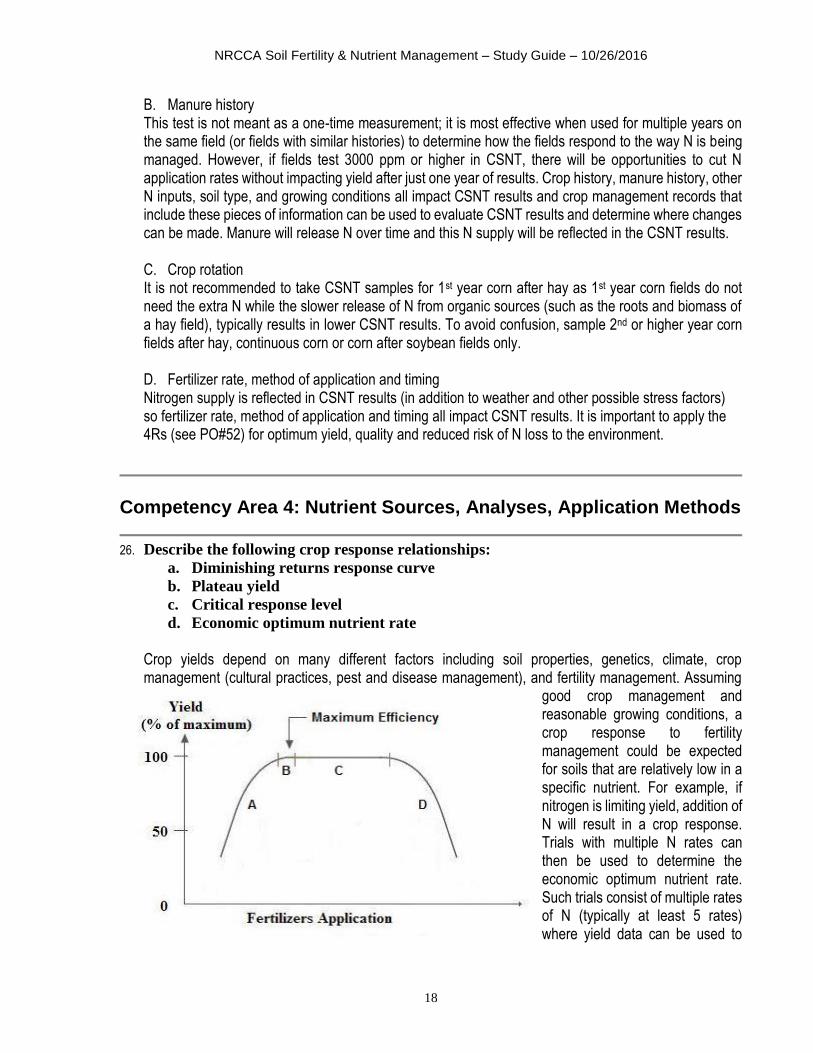
Crop yields depend on many different factors including soil properties, genetics, climate, crop management (cultural practices, pest and disease management), and fertility management. Assuming
good crop management and reasonable growing conditions, a crop response to fertility management could be expected for soils that are relatively low in a specific nutrient. For example, if nitrogen is limiting yield, addition of N will result in a crop response. Trials with multiple N rates can then be used to determine the economic optimum nutrient rate. Such trials consist of multiple rates of N (typically at least 5 rates) where yield data can be used to
NRCCA Soil Fertility & Nutrient Management – Study Guide – 10/26/2016
19
determine the plateau yield, the critical response level and the diminishing returns response curve. An example is shown below. In this example, when fertilizer was applied to a low fertility field, yield increased (phase A) until a plateau was reached (phase B). Applying more fertilizer than needed does not increase yield (phase C) and could, in some situations, cause a yield decline (phase D; not commonly observed in field crops). Often, additions of excess fertilizer also increase the likelihood of losses to the environment (see PO#51). The crop response curve will be different for each crop and field, so development of a crop fertilizer recommendation system requires assembly of data from many field crop response trials. Together such trials result in identification of critical response levels (critical agronomic test levels) beyond which a response to additional fertility is unlikely to result in a yield increase. Going from A to B in the figure above, the economic optimum nutrient rate takes into account the diminishing return to added fertilizer , and is set where the next addition of fertilizer costs more than the return in yield is worth. Thus, the most economic rate of fertilizer is slightly lower than the fertilizer rate at which a maximum yield is obtained.
27. Describe the role of the following in providing plant nutrients:
A. Soil organic matter
B. Commercial fertilizer
C. Soil minerals
D. Animal manure
E. Compost
F. Biosolids
G. Plant residue
Soil organic matter and organic amendments such as animal manure, compost and biosolids release nutrients over time through microbial mineralization.
Soil minerals and organic matter create negatively charged surfaces that attract nutrient cations (cation exchange capacity). Soils differ in their mineral composition and organic matter content, resulting in differences in their capability to provide essential minerals to plants.
Commercial fertilizer is recommended only when nutrient supply from other sources is insufficient.
Plant residues release nutrients back to the soil. Residue coverage of the soil can furthermore result in moisture conservation and added moisture can make nutrients more available.
28. Describe the physical form and analysis of each of the following nitrogen sources:
A. Anhydrous ammonia
B. Urea
C. Ammonium nitrate
D. Urea/ammonium nitrate
solution (UAN)
E. Ammonium sulfate
See 30. 29. Describe the physical form and analysis of each of the following phosphorus sources:
A. Rock phosphate
B. Triple superphosphate
C. Monoammonium phosphate
D. Diammonium phosphate
E. Ammonium polyphosphate
See 30. 30. Describe the physical form and analysis of each of the following potassium sources:
A. Potassium chloride
B. Potassium sulfate
C. Potassium nitrate
D. Potassium magnesium sulfate
NRCCA Soil Fertility & Nutrient Management – Study Guide – 10/26/2016
20
Common forms of N, P and K fertilizers (some have ranges, e.g., UAN is 28-32% N):
N:
anhydrous ammonia (gas) urea (granular) ammonium nitrate (solid or liquid) urea ammonium nitrate (UAN) solution ammonium sulfate (solid)
NH3 (NH2)2CO NH4NO3 Urea+ NH4NO3 (NH4)2SO4
N
82 46 34
28-32 21
P2O5
0 0 0 0 0
K2O
0 0 0 0 0
P2O5:
rock phosphate (solid) triple super phosphate (solid) monoammonium phosphate (solid) diammonium phosphate (solid) ammonium polyphosphate (liquid)
Ca(H2PO4)2 Ca(H2PO4)2 NH4H2PO4
(NH4)2H2PO4
[NH4PO3]n
0 0 13 18 10
18 46 52 46 34
0 0 0 0 0
K2O:
potassium chloride (muriate of potash) (solid) potassium sulfate (solid) potassium nitrate (solid) potassium magnesium sulfate (solid)
KCl K2SO4 KNO3 K2SO4 MgSO4
0 0 13 0
0 0
0 0
61 50 44 22
+11% Mg
31. Describe the physical form and analysis of each of the following calcium and/or
magnesium sources:
A. Calcitic lime
B. Dolomitic lime
C. Gypsum
D. Potassium magnesium sulfate
Chemical name Common Name Chemical Formula Physical form
Calcium carbonate calcitic lime, CaCO3 solid Ca,Mg carbonate dolomitic lime CaMg(CO3)2 solid Calcium oxide lime, burned lime, quick lime CaO solid Calcium sulfate dihydrate
gypsum CaSO₄•2H₂O solid
Potassium magnesium sulfate
Potassium magnesium sulfate (langbeinite)
K2SO4•2MgSO4 solid
Calcium hydroxide hydrated lime, slaked lime Ca(OH)2 Solid
32. Define the following commercial fertilizer terms:
A. Nutrient use efficiency
B. Total availability
C. Water solubility
D. Guaranteed analysis
E. Salt effect
F. Density
Nutrient use efficiency is the yield output per unit input (e.g. bushels of corn per lb of applied N).
Total availability is the total amount of a nutrient that is eventually expected to become plant available (could be over many years).
Water solubility reflects the portion that dissolves in water (more immediately available).
NRCCA Soil Fertility & Nutrient Management – Study Guide – 10/26/2016
21
Guaranteed analysis is the minimum amount of %Total N, Available P labeled as % P2O5, and soluble K labeled as %K2O (etc.) in the fertilizer material. By law, fertilizer analyses are always labeled in these terms regardless of the actual chemical form of the fertilizer materials.
Soluble salts are salts in the soil solution, in direct contact with roots. High soluble salt content (resulting from e.g. large applications of N (ammonium salts) and K sources) can cause seedling damage (dehydration).
For liquid fertilizers where the rate is given in gallons per acre the density of the fertilizer must be known to determine the amount of nutrients applied per acre. For example, if the recommendation calls for 120 lbs N/acre and the source is UAN 30-0-0 that weighs 10.85 lbs/gallon, the application rate is calculated in the following way:
120 lb N/A ÷ 0.30 lb N/lb UAN ÷ 10.85 lb UAN/gallon = 37 gallons of UAN /acre.
33. Define the following nutrient terms:
A. Total Kjeldahl nitrogen (TKN)
B. Organic N
C. Inorganic N
D. Organic P
E. Inorganic P
F. Dissolved P
G. Particulate P
• Total Kjeldahl nitrogen (TKN): – Total N analytical method that includes organic fraction for soils, plants and waters. – Soils range from 0.05 to 0.3 % typically, but can be several % for mucks. – Plants are normally 0.2 to 4 % depending on species, age, plant part, etc.
• Organic N: – Not water soluble, organically bound (e.g. protein), slow to become available. Availability
based on mineralization of organic matter. • Inorganic N:
– e.g. ammonium, urea, nitrite, nitrate. • Organic P:
– P bound in organic form, not soluble, most commonly found as phytate. – Largest P fraction in animal manure, availability based on mineralization of organic matter.
• Inorganic P: – P not associated with carbon (usually P dissolved in solution as PO4
3-, HPO42-, H2PO4
-). • Dissolved P:
– P in the soil solution (PO43-, HPO4
2-, H2PO4-).
• Particulate P: – P attached to soil particles.
34. Calculate fertilizer application rates from fertilizer analysis information.
Example 1: Needed: 45 lb N, 45 lb P2O5, 45 lb K2O per acre Determine ratio: 1:1:1 (N: P2O5: K2O) Apply (example): e.g. 300 lb/acre of 15 – 15 – 15
NRCCA Soil Fertility & Nutrient Management – Study Guide – 10/26/2016
22
Example 2: Needed: 150 lb N, 30 lb P2O5, 120 lb K2O per acre for corn Apply (example): K preplant (broadcast) 150 lb/acre 0 – 0 – 61 = 0 0 91 Starter 200 lb/acre 15 – 15 – 15 = 30 30 30 Sidedress UAN* 37 gallon 30 – 0 – 0 = 120 0 0 This gives us: 150 – 30 –121
* For liquid fertilizers where the rate is given in gallons per acre the density of the fertilizer must be known to determine the amount of nutrients applied per acre. In this example, UAN 30-0-0 weighs 10.85 lb/gal. Therefore, 37 gallons/ acre equals 37 x 10.85 = 401 lb of UAN/acre and thus at 30% N, this equals 401 x 0.30 = 120 lb N/acre.
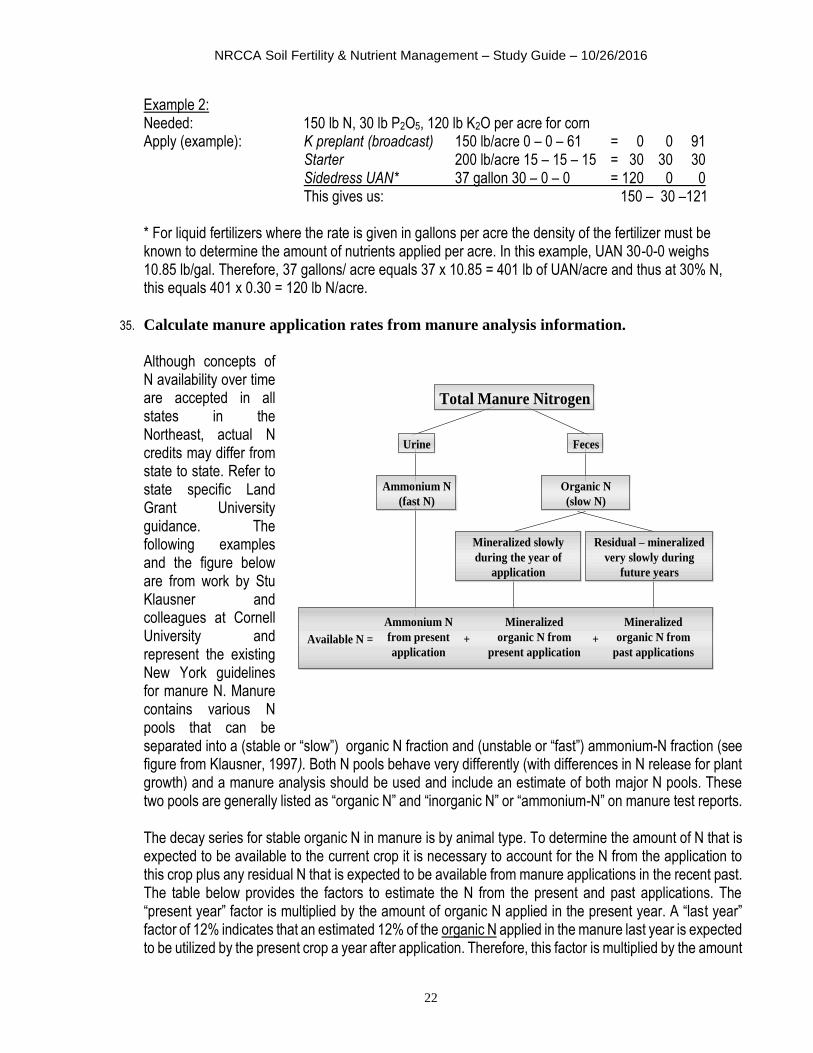
35. Calculate manure application rates from manure analysis information.
Although concepts of N availability over time are accepted in all states in the Northeast, actual N credits may differ from state to state. Refer to state specific Land Grant University guidance. The following examples and the figure below are from work by Stu Klausner and colleagues at Cornell University and represent the existing New York guidelines for manure N. Manure contains various N pools that can be separated into a (stable or “slow”) organic N fraction and (unstable or “fast”) ammonium-N fraction (see figure from Klausner, 1997). Both N pools behave very differently (with differences in N release for plant growth) and a manure analysis should be used and include an estimate of both major N pools. These two pools are generally listed as “organic N” and “inorganic N” or “ammonium-N” on manure test reports. The decay series for stable organic N in manure is by animal type. To determine the amount of N that is expected to be available to the current crop it is necessary to account for the N from the application to this crop plus any residual N that is expected to be available from manure applications in the recent past. The table below provides the factors to estimate the N from the present and past applications. The “present year” factor is multiplied by the amount of organic N applied in the present year. A “last year” factor of 12% indicates that an estimated 12% of the organic N applied in the manure last year is expected to be utilized by the present crop a year after application. Therefore, this factor is multiplied by the amount
Total Manure Nitrogen
Urine Feces
Ammonium N
(fast N)
Organic N
(slow N)
Available N = + +
Ammonium N
from present
application
Mineralized
organic N from
present application
Mineralized
organic N from
past applications
Mineralized slowly
during the year of
application
Residual – mineralized
very slowly during
future years
NRCCA Soil Fertility & Nutrient Management – Study Guide – 10/26/2016
23
of organic N applied in the manure last year. Likewise, if manure was applied 2 years ago. In order to calculate a manure rate for a current crop, once the contribution of N from the past manure applications has been estimated this should be subtracted from the current year N recommendation along with any fertilizer N that may be applied in addition to manure (e.g. starter fertilizer N) and any legume credit from a previous legume crop. The result will be the net N requirement that could still be met with the current manure application.
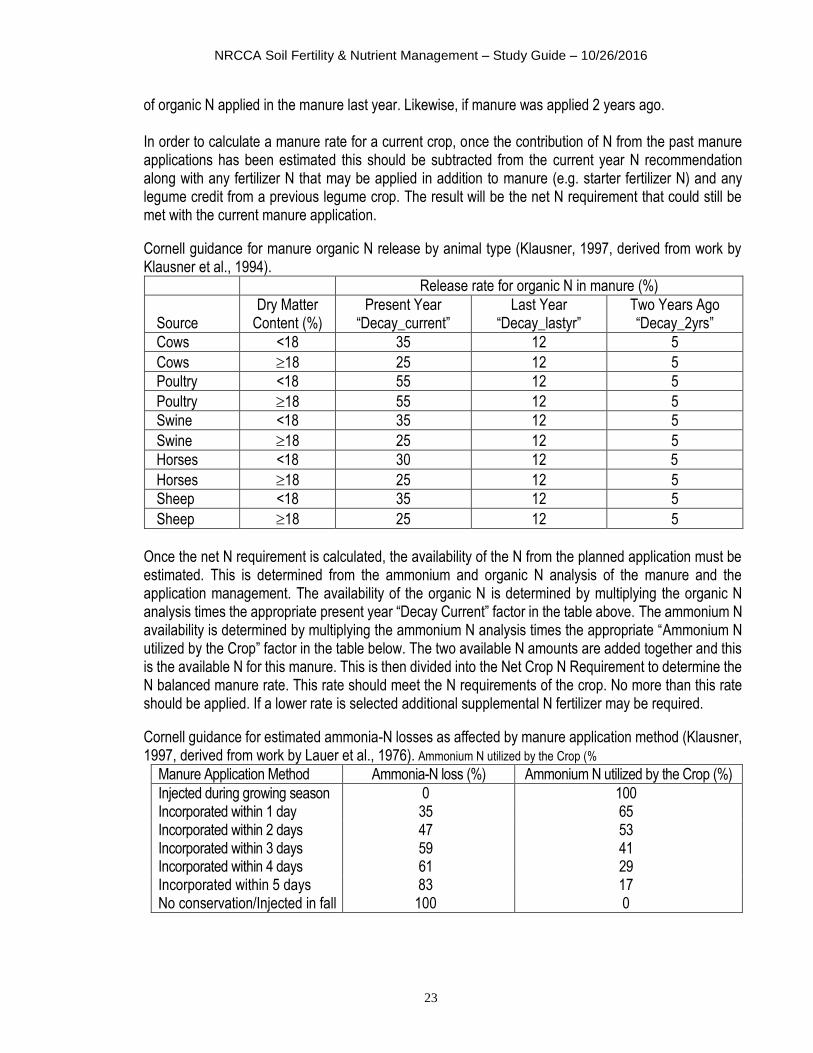
Cornell guidance for manure organic N release by animal type (Klausner, 1997, derived from work by Klausner et al., 1994).
Release rate for organic N in manure (%)
Source Dry Matter
Content (%) Present Year
“Decay_current” Last Year
“Decay_lastyr” Two Years Ago “Decay_2yrs”
Cows <18 35 12 5
Cows 18 25 12 5
Poultry <18 55 12 5
Poultry 18 55 12 5
Swine <18 35 12 5
Swine 18 25 12 5
Horses <18 30 12 5
Horses 18 25 12 5
Sheep <18 35 12 5
Sheep 18 25 12 5
Once the net N requirement is calculated, the availability of the N from the planned application must be estimated. This is determined from the ammonium and organic N analysis of the manure and the application management. The availability of the organic N is determined by multiplying the organic N analysis times the appropriate present year “Decay Current” factor in the table above. The ammonium N availability is determined by multiplying the ammonium N analysis times the appropriate “Ammonium N utilized by the Crop” factor in the table below. The two available N amounts are added together and this is the available N for this manure. This is then divided into the Net Crop N Requirement to determine the N balanced manure rate. This rate should meet the N requirements of the crop. No more than this rate should be applied. If a lower rate is selected additional supplemental N fertilizer may be required.
Cornell guidance for estimated ammonia-N losses as affected by manure application method (Klausner, 1997, derived from work by Lauer et al., 1976). Ammonium N utilized by the Crop (%
Manure Application Method Ammonia-N loss (%) Ammonium N utilized by the Crop (%)
Injected during growing season 0 100 Incorporated within 1 day 35 65 Incorporated within 2 days 47 53 Incorporated within 3 days 59 41 Incorporated within 4 days 61 29 Incorporated within 5 days 83 17 No conservation/Injected in fall 100 0
NRCCA Soil Fertility & Nutrient Management – Study Guide – 10/26/2016
24
Example calculation of manure application rates from manure analysis information:
Crop N Recommendation: 150 lb N/acre. Starter fertilizer: 150 lb/acre 10-10-10 so 15 lb N/acre. Legume N credit from previous soybean crop: 30 lb N/acre. Residual N from previous manure applications: 20 lb N/acre.
Last year: 20 ton dairy manure/acre, 4 lb ammonium N and 6 lb organic N/ton, 15% solids 20 ton/acre x 6 lb org. N/ton x 0.12 = 14 lb N/acre from last year
2 years ago: 20 ton dairy manure/acfre, 4 lb ammonium N and 6 lb organic N/ton, 15% solids 20 ton/acre x 6 lb organic N/ton x 0.05 = 6 lb N/acre from 2 years ago
Net crop N requirement: 150 lb N/acre - 15 lb N/acre - 30 lb N/acre - 20 lb N/acre = 85 lb N/acre
Planned manure management: applied in the spring and incorporated within 3 days Current manure analysis: 10 lb total N, 4 lb ammonium N, 6 lb organic N/ton, 15% solids.
Available ammonium N: 4 lb NH4-N/ton x 0.41 = 1.6 lb NH4-N/ton available. Available organic N: 6 lb organic N/ton x 0.35 = 2.1 lb Organic N/ton available. Total available N: 1.6 lb NH4-N/ton + 2.1 lb organic N/ton = 3.7 lb available N/ton.
N balanced manure rate: 85 lb N/accre ÷ 3.7 lb available N/ton = 23 ton/A.
If the farmer had his spreader calibrated for the 20 ton/acre rate, this would apply: 20 ton/acre x 3.7 lb available N/acre = 74 lb N/acre, about 11 lb N/ acre short (85 lb N/A - 74 lb N/acre = 11 lb N/acre)
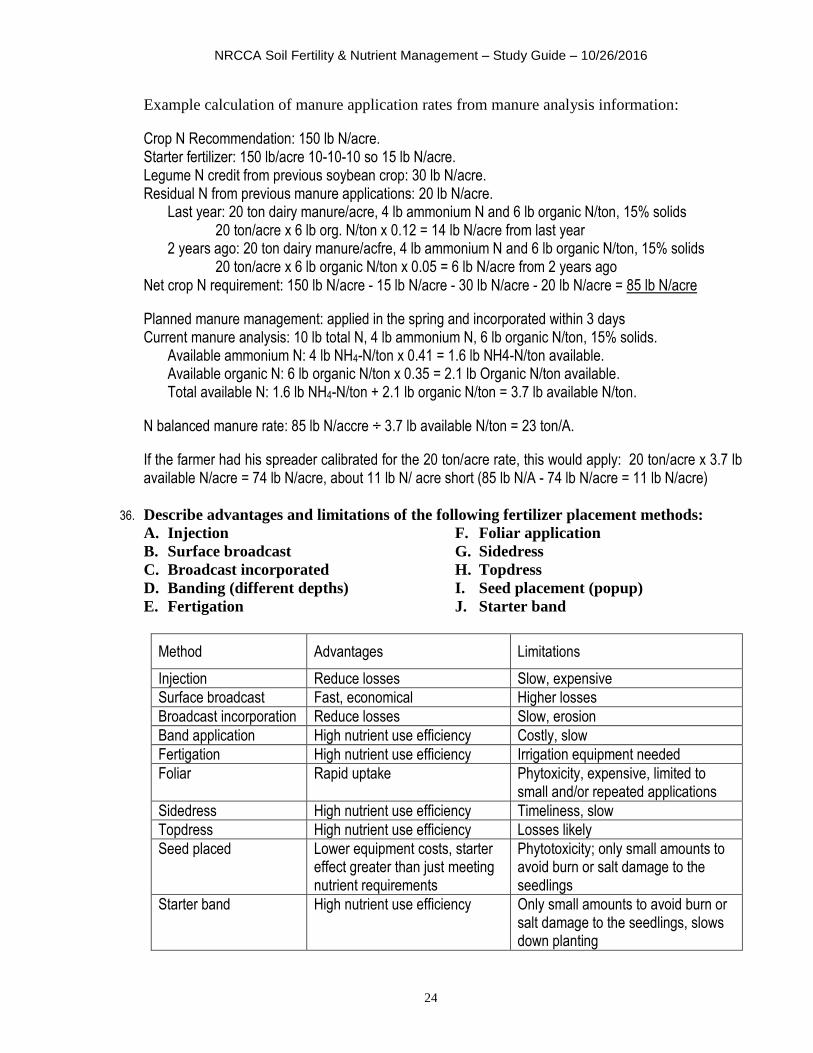
36. Describe advantages and limitations of the following fertilizer placement methods:
A. Injection
B. Surface broadcast
C. Broadcast incorporated
D. Banding (different depths)
E. Fertigation
F. Foliar application
G. Sidedress
H. Topdress
I. Seed placement (popup)
J. Starter band
Method Advantages Limitations
Injection Reduce losses Slow, expensive
Surface broadcast Fast, economical Higher losses
Broadcast incorporation Reduce losses Slow, erosion
Band application High nutrient use efficiency Costly, slow
Fertigation High nutrient use efficiency Irrigation equipment needed
Foliar Rapid uptake Phytoxicity, expensive, limited to small and/or repeated applications
Sidedress High nutrient use efficiency Timeliness, slow
Topdress High nutrient use efficiency Losses likely
Seed placed Lower equipment costs, starter effect greater than just meeting nutrient requirements
Phytotoxicity; only small amounts to avoid burn or salt damage to the seedlings
Starter band High nutrient use efficiency Only small amounts to avoid burn or salt damage to the seedlings, slows down planting
NRCCA Soil Fertility & Nutrient Management – Study Guide – 10/26/2016
25
37. Describe how the following nitrogen additives impact N behavior and management:
a. Urease inhibitors
b. Nitrification inhibitors
c. Controlled release products
In times of high production costs and price volatility for both crop inputs and commodity prices, there is an increasing interest in the use of nitrogen (N) sources that reduce the risk for N loss. Various technologies have been developed to minimize the potential for N loss to the environment, including those that delay nitrification (nitrification inhibitors), delay conversion of urea to ammonium (urease inhibitors), and/or employ sulfur or polymer coatings to allow release N over a longer time period (slow or controlled release). A. Urease inhibitors Urease inhibitors are substances that inhibit conversion (hydrolysis) of urea to ammonia and carbon dioxide, reducing ammonia volatilization losses. Urease inhibitors can be effective for up to ten to fourteen days. Urease inhibitors especially target N sources that have a high volatilization potential (e.g. urea) in situations in which tillage incorporation is not possible (e.g., no-till, pasture, and grass hay production). Adding a urease inhibitor allows more time for rain to incorporate the N fertilizer. An example of a urease inhibitor is Agrotain (Agrotain International LLC) with NBPT (N-butyl thiophosphoric triamide) as the active ingredient. B. Nitrification inhibitors Nitrification inhibitors are substances that inhibit conversion (biological oxidation) of ammonium to nitrate. Nitrification inhibitors work by keeping N in ammonium form, which is done by inhibiting Nitrosomonas bacteria, delaying conversion for four to ten weeks depending on soil temperature and pH. These inhibitors can reduce N loss from leaching and denitrification but are only effective on fertilizers that either contain or are converted to ammonium, including anhydrous ammonia, urea, and ammonium sulfate. In the humid climate of the Northeastern US, nitrification inhibitors have the highest likelihood for a yield response when applied at planting in less well drained soils (where denitrification losses are more likely to occur) or in sandy soils (where the leaching potential is high). They are less likely to prevent loss when N is sidedressed. Examples of commercially available nitrification inhibitors are N-Serve or Instinct (Dow AgroSciences) with nitrapyrin as the active ingredient, and Guardian (Conklin), with dicyandiamide (DCD) as the active ingredient. Nitrification inhibitors can be added to solid fertilizers. The mixture should be applied quickly after mixing to avoid volatilization of the inhibitor. C. Controlled-release fertilizers Controlled-release fertilizers are usually common fertilizers such as urea, coated with a polymer or with sulfur. The coating delays the availability of the nutrients for plant uptake after application and controls nutrient release over time. These enhanced-efficiency fertilizers allow for better timing of N release, consistent with crop growth and N demands. For sulfur-coated fertilizers, N is released upon the physical breakdown of the sulfur coating followed by soil microorganisms completing the degradation and N release process. For polymer-coated fertilizer, N is released when water enters the granule and dissolves the urea or other N forms inside it into a liquid N solution, and the solution diffuses through the coating into the soil solution. The N diffusion rate is influenced by soil temperature; more N is released during warmer, active growing periods and less in cooler, inactive periods. There are advantages and potential disadvantages for the use of controlled-release fertilizers. They can reduce leaching, denitrification and/or volatilization losses, and can result in more uniform growth because of reduced risk of seedling
NRCCA Soil Fertility & Nutrient Management – Study Guide – 10/26/2016
26
burn or salt damage. However, these products tend to be more expensive per unit of N and are not desirable when a quick release is needed, for example, when sidedressing corn at the 6-leaf stage. In addition, some products, if applied on bare soil, should be incorporated to prevent runoff with heavy rains. Some examples of controlled-release urea are ESN (Agrium), Osmocote (Scotts), and Isobutylidene diurea (IBDU, made by Nu-Gro).
38. Recognize nutrient sources that can be certified organic.
Check with the appropriate organic certification agency.
Competency Area 5: Soil pH and Liming
39. Define:
A. Soil pH
B. Buffer pH
C. Exchangeable acidity
D. Alkalinity
Soil pH pH is the negative log of the H+ ion concentration
pH = -Log H+ = log 1/H
+
pH 7.0 = -log 0.0000001 H+
or (H+) = 1 x 10⁻⁷
pH 6.0 = -log 0.000001 H+
or (H+) = 1 x 10⁻⁶
Properties of pH: pH 7 is neutral - neither acid or basic (alkaline). pH < 7 is acid and > 7 is basic (alkaline). 1 pH = A 10 fold increase in acidity. pH 5 is 10 times more acid than 6, 100 times more acid than 7 Soils range between pH 3.5 and 9.
a. Hydrogen and aluminum ions and complexes are the two primary sources of soil acidity. b. pH – Northeastern mineral soils 4.5 – 8.2 c. pH – Northeastern muck soils 3.5 – 8.2
Exchangeable acidity is a measure of the soil’s ability to withstand a change in pH upon lime addition. The higher the exchangeable acidity of a soil, the more lime is needed for a particular pH change.
Buffer pH is used to estimate a soil’s exchangeable acidity; the amount of change in buffer pH is related to lime needs.
Alkalinity is the term used to describe the amount of base in a soil when the pH is above 7.
40. Describe the long-term change in soil pH from applying N.
Nitrification or the conversion of ammonium N to nitrate N produces acidity: 2 NH4
+ + 4 O2 → 2 NO3- + 4 H+ + H2O
2 H+ are produced for every N in the ammonium-N form (NH4
+). This reaction occurs regardless of the source or the NH4
+.
NRCCA Soil Fertility & Nutrient Management – Study Guide – 10/26/2016
27
N source Theoretical lb CaCO3/lb N Official (AOAC) lb CaCO3/lb N
Anhydrous ammonia 3.6 1.8
Urea 3.6 1.8
Ammonium nitrate 3.6 1.8
Ammonium sulfate 7.2 5.4
Monoammonium phosphate 7.2 5.4
Diammonium phosphate 5.4 3.6
The acidity from N fertilizers is often the largest single acidifying addition to agricultural soils. The net amount of acidity created when N fertilizer is applied depends on other reactions that occur with the fertilizer. The acidity created by different fertilizer materials is summarized in the table, above. As an example, if 150 lb N/acre is applied as urea, this will produce the equivalent of 270 lb of lime requirement (150 x 1.8 = 270). Similarly if 150 lb N/acre is applied as ammonium sulfate, 810 lb of lime requirement (150 x 5.4 = 810) will be created.
41. Describe how applying N in a no-till or long-term perennial forage crop results in pH
stratification (acid roof) and how this impacts root growth, herbicide activity, soil
sampling, and liming management.
The reaction of ammonium forming fertilizers (e.g. ammonium nitrate, urea, urea ammonium nitrate, anhydrous ammonia, ammonium sulfate) with oxygen (a process called oxidation) results in the formation of nitrate (NO3
-) and H+ ions which lowers soil pH:
2 NH3 + 4 O2 → 2 NO3- + 2 H+ + 2 H2O
(ammonia) (oxygen) (nitrate) (“acid”) (water)
NH4NO3 + 2 O2 → 2 NO3- + 2 H+ + H2O
(ammonium nitrate) (oxygen) (nitrate) (“acid”) (water)
(NH2)2CO + 2 O2 → 2 NO3- + 2 H+ + H2O
(urea) (oxygen) (nitrate) (“acid”) (water)
(NH4)2SO4 + 4 O2 → 2 NO3- + SO4
2- + 4 H+ + 2 H2O (ammonium sulfate) (oxygen) (nitrate) (sulfate) (“acid”) (water) In no-till situations, the fertilizer is not mixed throughout the soil profile, and consequently, the acidity created by this fertilizer remains at the surface, resulting in the formation of an “acid roof” where the surface inch or two of soil is lower in pH than the subsoil. This can impact root growth, especially for new seedings, as well as impact herbicide activity. Under minimum or no-tillage systems, because the surface inch of the soil may become acid more rapidly than the deeper layer, the pH values of two soil layers (0-1 and 0-6 inches) should be determined. If the pH of the surface 0-1 inches is less than desired, but the pH of the 6-inch core is adequate, a small lime addition (1 to 1 ½ tons of lime per acre) is recommended to raise the pH of the soil surface. If both samples are strongly acidic, do not use no-till methods for the establishment of legumes unless lime has been applied and mixed with the soil for at least 6 to 9 months to permit the lime to react with the soil. If the surface pH is adequate, but the pH of the 6-inch core is lower than desired, legumes might be no-till seeded with a slightly lower overall pH or without waiting so long for the applied lime to react as when both zones have a low
NRCCA Soil Fertility & Nutrient Management – Study Guide – 10/26/2016
28
soil pH. Downward movement of lime to subsurface layers is very slow and only occurs after the surface layer has reached >80% saturation which means the pH of the surface needs to be around 7.0 to let lime to move downward. If a rapid increase in pH is desired, a very finely ground limestone can be used or hydroxide sources (hydrated lime or slaked lime) can be considered. Both will be more expensive than planning ahead and maintaining a good pH level over time. As explained, these sources increase the pH of the soil much faster than calcitic or dolomitic limestones. This could be desirable if a quick increase in pH is needed. However the effects are of shorter duration.
42. Describe how cation exchange capacity (CEC), soil texture, exchangeable acidity and soil
organic matter affect lime requirements.
Lime requirements increase with CEC and a soil’s CEC increases with organic matter and clay content. Thus, clay soils with high organic matter require more lime for a similar pH change than sandy soils low in organic matter. In other words, high CEC soils tend to be well-buffered, meaning they are resistant to pH changes and as a result, require more lime to change the pH. Sandy soils are poorly buffered, requiring less lime per unit pH change. However, because of the greater buffering capacity, the soil pH will decrease slower on higher CEC soils than in poorly buffered sandy soils.
43. Describe how soil pH affects the availability of each nutrient.
o Most plants usually grow best at pH values above 5.5. o Lower pH increase solubility of Al, Mn, Fe.
a. In excess Al, Mn, Fe are toxic to plants. b. A critical effect is that root growth is slowed or stopped by excess soluble Al.
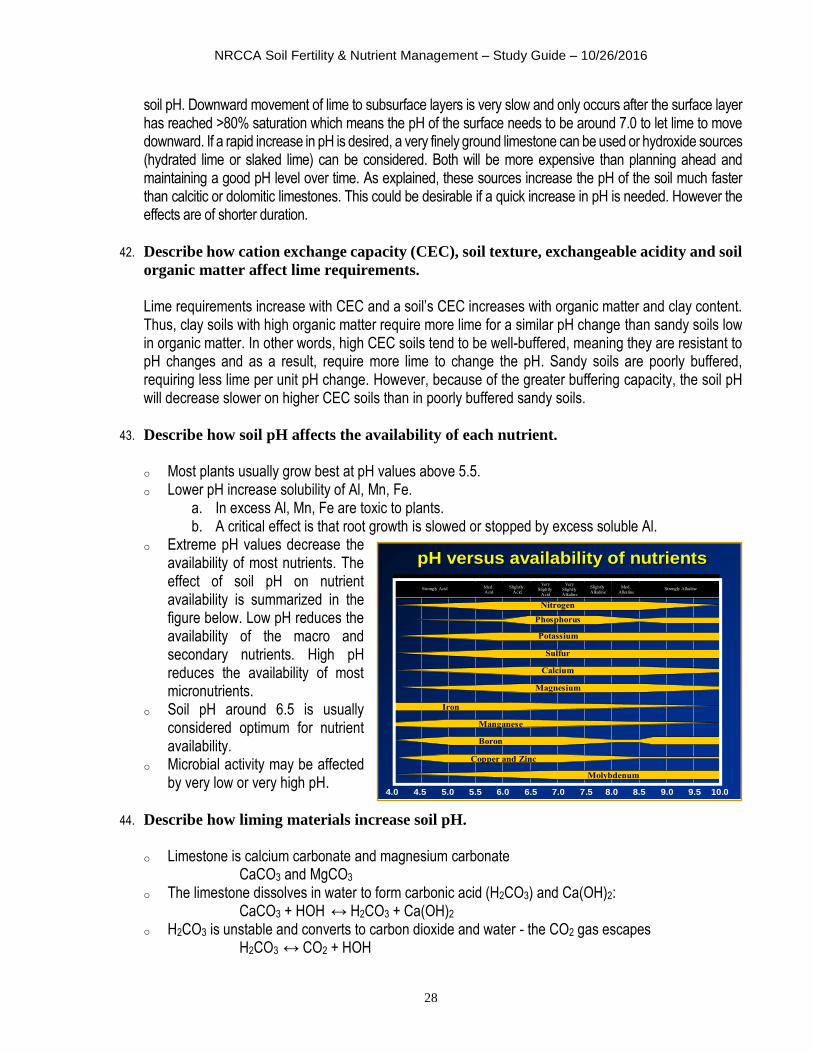
o Extreme pH values decrease the availability of most nutrients. The effect of soil pH on nutrient availability is summarized in the figure below. Low pH reduces the availability of the macro and secondary nutrients. High pH reduces the availability of most micronutrients.
o Soil pH around 6.5 is usually considered optimum for nutrient availability.
o Microbial activity may be affected by very low or very high pH.
44. Describe how liming materials increase soil pH.
o Limestone is calcium carbonate and magnesium carbonate CaCO3 and MgCO3
o The limestone dissolves in water to form carbonic acid (H2CO3) and Ca(OH)2: CaCO3 + HOH ↔ H2CO3 + Ca(OH)2
o H2CO3 is unstable and converts to carbon dioxide and water - the CO2 gas escapes H2CO3 ↔ CO2 + HOH
pH versus availability of nutrientspH versus availability of nutrients
4.0 4.5 5.0 5.5 6.0 6.5 7.0 7.5 8.0 8.5 9.0 9.5 10.0
Strongly Acid Strongly AlkalineMed.
Acid
Slightly.
Acid
Very
Slightly
Acid
Very
Slightly
Alkaline
Slightly
Alkaline
Med.
Alkaline
Phosphorus
Potassium
Calcium
Magnesium
Sulfur
Iron
Manganese
Boron
Copper and Zinc
Molybdenum
Nitrogen
NRCCA Soil Fertility & Nutrient Management – Study Guide – 10/26/2016
29
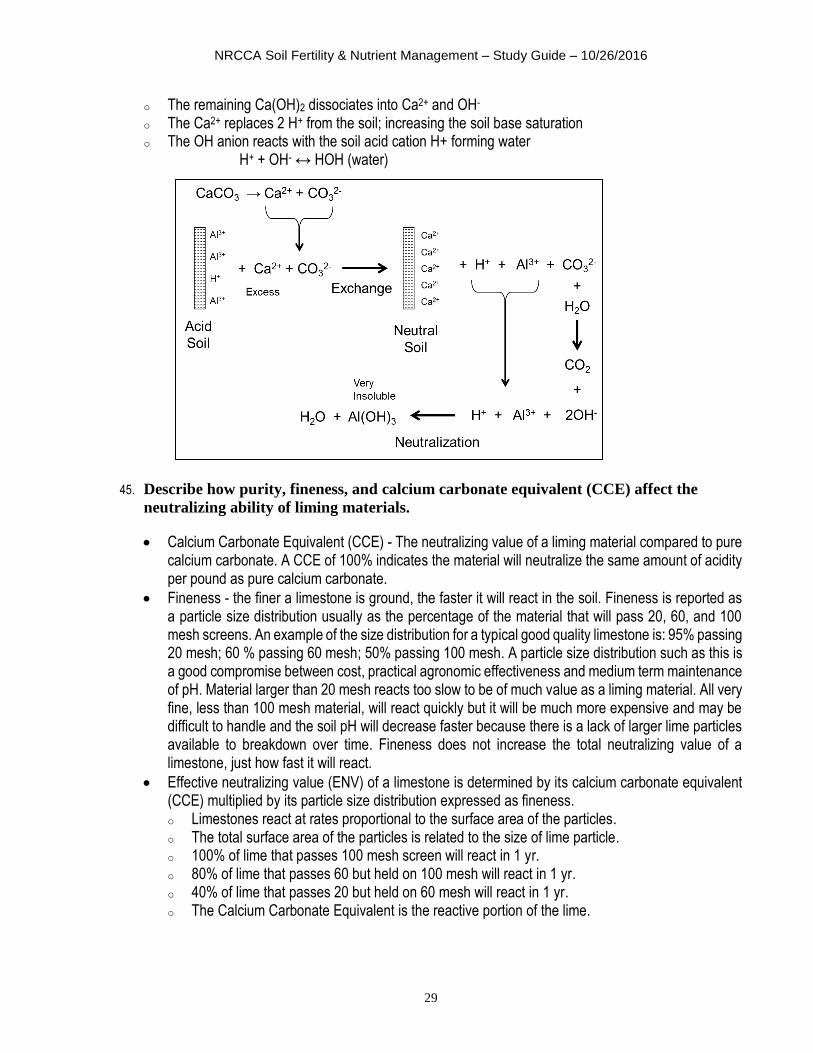
o The remaining Ca(OH)2 dissociates into Ca2+ and OH- o The Ca2+ replaces 2 H+ from the soil; increasing the soil base saturation o The OH anion reacts with the soil acid cation H+ forming water
H+ + OH- ↔ HOH (water)
45. Describe how purity, fineness, and calcium carbonate equivalent (CCE) affect the
neutralizing ability of liming materials.
Calcium Carbonate Equivalent (CCE) - The neutralizing value of a liming material compared to pure calcium carbonate. A CCE of 100% indicates the material will neutralize the same amount of acidity per pound as pure calcium carbonate.
Fineness - the finer a limestone is ground, the faster it will react in the soil. Fineness is reported as a particle size distribution usually as the percentage of the material that will pass 20, 60, and 100 mesh screens. An example of the size distribution for a typical good quality limestone is: 95% passing 20 mesh; 60 % passing 60 mesh; 50% passing 100 mesh. A particle size distribution such as this is a good compromise between cost, practical agronomic effectiveness and medium term maintenance of pH. Material larger than 20 mesh reacts too slow to be of much value as a liming material. All very fine, less than 100 mesh material, will react quickly but it will be much more expensive and may be difficult to handle and the soil pH will decrease faster because there is a lack of larger lime particles available to breakdown over time. Fineness does not increase the total neutralizing value of a limestone, just how fast it will react.
Effective neutralizing value (ENV) of a limestone is determined by its calcium carbonate equivalent (CCE) multiplied by its particle size distribution expressed as fineness. o Limestones react at rates proportional to the surface area of the particles. o The total surface area of the particles is related to the size of lime particle. o 100% of lime that passes 100 mesh screen will react in 1 yr. o 80% of lime that passes 60 but held on 100 mesh will react in 1 yr. o 40% of lime that passes 20 but held on 60 mesh will react in 1 yr. o The Calcium Carbonate Equivalent is the reactive portion of the lime.
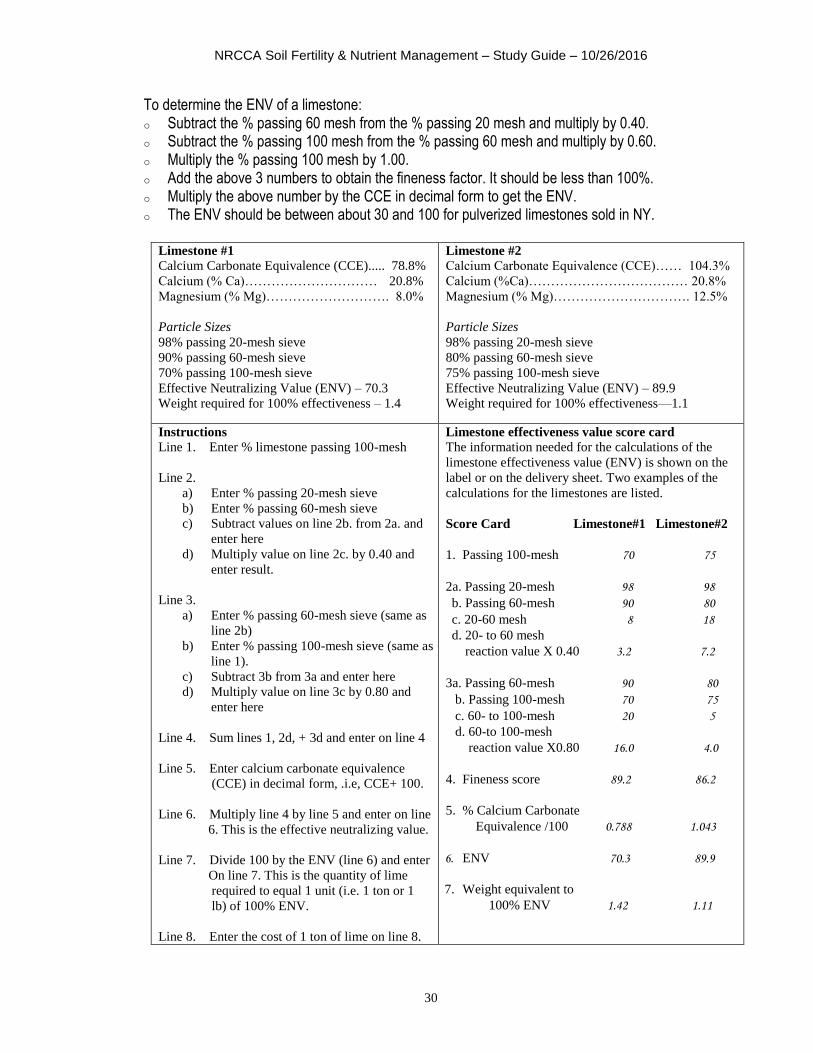
NRCCA Soil Fertility & Nutrient Management – Study Guide – 10/26/2016
30
To determine the ENV of a limestone: o Subtract the % passing 60 mesh from the % passing 20 mesh and multiply by 0.40. o Subtract the % passing 100 mesh from the % passing 60 mesh and multiply by 0.60. o Multiply the % passing 100 mesh by 1.00. o Add the above 3 numbers to obtain the fineness factor. It should be less than 100%. o Multiply the above number by the CCE in decimal form to get the ENV. o The ENV should be between about 30 and 100 for pulverized limestones sold in NY.
Limestone #1
Calcium Carbonate Equivalence (CCE)..... 78.8%
Calcium (% Ca)………………………… 20.8%
Magnesium (% Mg)………………………. 8.0%
Particle Sizes
98% passing 20-mesh sieve
90% passing 60-mesh sieve
70% passing 100-mesh sieve
Effective Neutralizing Value (ENV) – 70.3
Weight required for 100% effectiveness – 1.4
Limestone #2
Calcium Carbonate Equivalence (CCE)…… 104.3%
Calcium (%Ca)……………………………… 20.8%
Magnesium (% Mg)…………………………. 12.5%
Particle Sizes
98% passing 20-mesh sieve
80% passing 60-mesh sieve
75% passing 100-mesh sieve
Effective Neutralizing Value (ENV) – 89.9
Weight required for 100% effectiveness—1.1
Instructions
Line 1. Enter % limestone passing 100-mesh
Line 2.
a) Enter % passing 20-mesh sieve
b) Enter % passing 60-mesh sieve
c) Subtract values on line 2b. from 2a. and
enter here
d) Multiply value on line 2c. by 0.40 and
enter result.
Line 3.
a) Enter % passing 60-mesh sieve (same as
line 2b)
b) Enter % passing 100-mesh sieve (same as
line 1).
c) Subtract 3b from 3a and enter here
d) Multiply value on line 3c by 0.80 and
enter here
Line 4. Sum lines 1, 2d, + 3d and enter on line 4
Line 5. Enter calcium carbonate equivalence
(CCE) in decimal form, .i.e, CCE+ 100.
Line 6. Multiply line 4 by line 5 and enter on line
6. This is the effective neutralizing value.
Line 7. Divide 100 by the ENV (line 6) and enter
On line 7. This is the quantity of lime
required to equal 1 unit (i.e. 1 ton or 1
lb) of 100% ENV.
Line 8. Enter the cost of 1 ton of lime on line 8.
Limestone effectiveness value score card
The information needed for the calculations of the
limestone effectiveness value (ENV) is shown on the
label or on the delivery sheet. Two examples of the
calculations for the limestones are listed.
Score Card Limestone#1 Limestone#2
1. Passing 100-mesh 70 75
2a. Passing 20-mesh 98 98
b. Passing 60-mesh 90 80
c. 20-60 mesh 8 18
d. 20- to 60 mesh
reaction value X 0.40 3.2 7.2
3a. Passing 60-mesh 90 80
b. Passing 100-mesh 70 75
c. 60- to 100-mesh 20 5
d. 60-to 100-mesh
reaction value X0.80 16.0 4.0
4. Fineness score 89.2 86.2
5. % Calcium Carbonate
Equivalence /100 0.788 1.043
6. ENV 70.3 89.9
7. Weight equivalent to
100% ENV 1.42 1.11
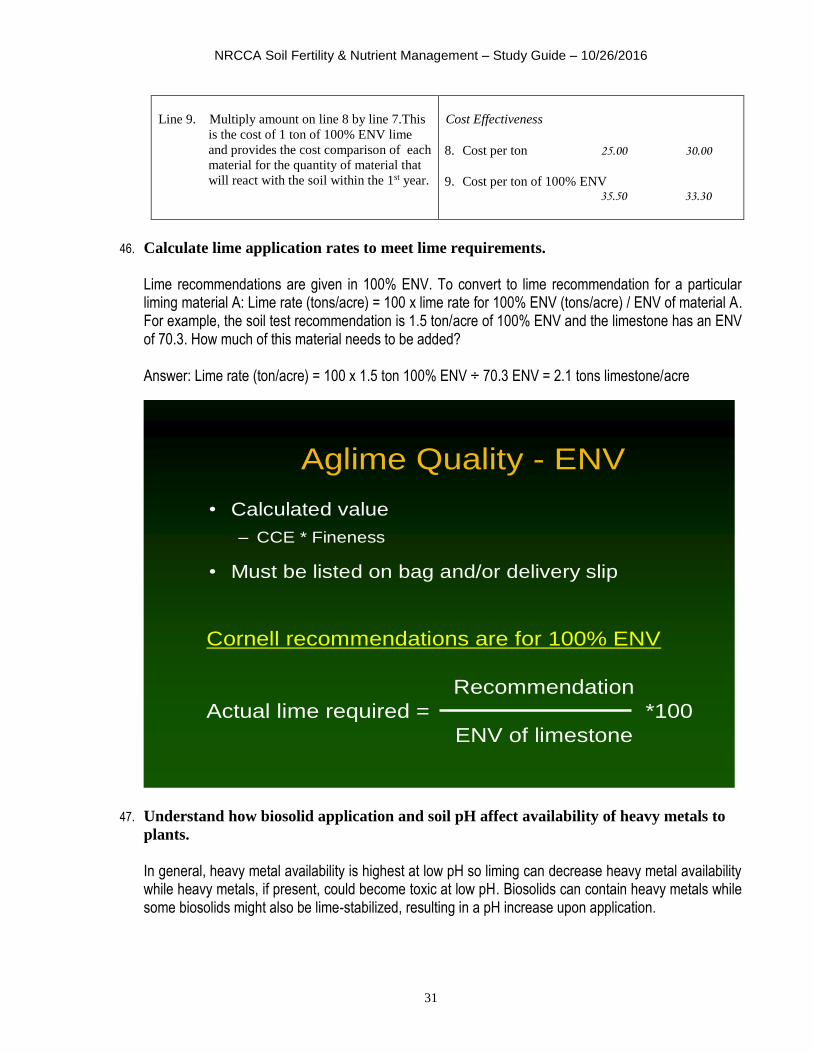
NRCCA Soil Fertility & Nutrient Management – Study Guide – 10/26/2016
31
Line 9. Multiply amount on line 8 by line 7.This
is the cost of 1 ton of 100% ENV lime
and provides the cost comparison of each
material for the quantity of material that
will react with the soil within the 1st year.
Cost Effectiveness
8. Cost per ton 25.00 30.00
9. Cost per ton of 100% ENV 35.50 33.30
46. Calculate lime application rates to meet lime requirements.
Lime recommendations are given in 100% ENV. To convert to lime recommendation for a particular liming material A: Lime rate (tons/acre) = 100 x lime rate for 100% ENV (tons/acre) / ENV of material A. For example, the soil test recommendation is 1.5 ton/acre of 100% ENV and the limestone has an ENV of 70.3. How much of this material needs to be added? Answer: Lime rate (ton/acre) = 100 x 1.5 ton 100% ENV ÷ 70.3 ENV = 2.1 tons limestone/acre
47. Understand how biosolid application and soil pH affect availability of heavy metals to
plants.
In general, heavy metal availability is highest at low pH so liming can decrease heavy metal availability while heavy metals, if present, could become toxic at low pH. Biosolids can contain heavy metals while some biosolids might also be lime-stabilized, resulting in a pH increase upon application.
• Calculated value
– CCE * Fineness
• Must be listed on bag and/or delivery slip
Aglime Quality - ENV
Cornell recommendations are for 100% ENV
Recommendation
Actual lime required = *100
ENV of limestone
NRCCA Soil Fertility & Nutrient Management – Study Guide – 10/26/2016
32
Competency Area 6: Nutrient Management Planning
48. Describe how to set a realistic yield goal by using:
A. Production history
B. Soil productivity
C. Management level
D. Soil type
E. Artificial drainage
F. Soil nutrient use efficiency
Fertility practices should be based on realistic yield goals, also called yield potential, recognizing inherent limitations to yield. Yield potentials take into account production history, soil productivity, management level, soil type and artificial drainage. Artificial draining can increase yields for soils that are, by nature, poorly drained. Yield potentials are obtained by averaging yields obtained 4 out of 5 years, discarding extreme years (e.g. due to severe drought). Realistic yield goals should take into account nutrient use efficiency (ability of the plants to make use of the nutrients in the soil) as it will not be economically or environmentally viable to fertilize fields with very low nutrient use efficiency.
49. Determine crop nutrient needs by using:
A. Yield potential
B. Crop rotation/sequence
C. Soil nutrient supply
D. Soil test information
E. Field history
F. Field-specific N testing (e.g.,
pre-sidedress nitrate test, corn
G. Stalk nitrate test, Illinois soil
nitrogen test)
Nitrogen recommendations in the Northeast are not based on a soil nitrate test as nitrate is very mobile in the soil. For nitrogen, crop nutrient needs are usually derived based on information about the yield potential of a field (ideally based on historic yield data), its place in the crop rotation, estimated soil N supply from mineralization of organic matter, and management history of the field, especially when manure is applied in previous years. The final recommendation needs to be adjusted for N fertilizer uptake efficiency recognizing that not all N applied will end up in the crop.
For example, N requirement for corn in New York is calculated as: N = ([yield potential (bu/acre) x 1.2] – soil N supply – sod N supply)/N uptake efficiency
Example: 3rd year corn after alfalfa – no manure applied in any of the previous 3 years
soil = lima (tiled drained) ● soil N = 75 lbs/acre
yield potential = 140 bu/acre ● sod N = 10 lbs/acre
N uptake efficiency = 70% ● manure N = 0 lbs N = ([140 x 1.2] – 75 - 10) / 0.70 = 119 lbs/acre
Nitrogen from sod becomes available through mineralization and nitrification. N availability from crop residues varies depending on sod composition and year since termination. For example, in New York the following N credits from sod are applied to corn following sod:
55% - 12% - 5% of total N for the 1st, 2nd, and 3rd year, respectively.
NRCCA Soil Fertility & Nutrient Management – Study Guide – 10/26/2016
33
For total amount, multiply the decay series value by the estimated total N pool in the sod (done in the table below).
Expected N credits from plowed down sods.
Available N
Legume in sod Total N pool Year 1* (55%) Year 2 (12%) Year 3 (5%) % lbs N/acre lbs N/acre lbs N/acre lbs N/acre
0 150 83 18 8 1-25 200 110 24 10 26-50 250 138 30 13 50 or more 300 165 36 15
* First year following plow down.
Soil nutrient supply of P, K, Mg, etc., is evaluated using a soil test. For N, several tools can be used to guide decision making beyond the base recommendations developed with the approach outlined above. These tools include the pre-sidedress nitrate test (PSNT), the corn stalk nitrate test (CSNT), and the Illinois soil nitrogen test (ISNT). The PSNT and ISNT are soil-based assessments that guide decisions prior to N application. The CSNT is an end-of-season test equivalent to a report card that allows a producer to evaluate if N applications, as implemented that year, were insufficient, sufficient, or excessive. For more details on PSNT, see PO#21. For details on how to credit past manure applications, see PO#35.
50. Know how to calculate an N or P based manure application rate based on:
a. Crop requirements
b. Manure analysis
c. Planned application method and timing
d. Linkage with supplemental fertilizer application (e.g., starter)
Manure contains all essential nutrients, but in ratios that are not necessarily what plants need. For example, if manure is applied to meet N requirements of a corn crop, P and K will be applied in excess of crop removal (see PO#55). To determine appropriate manure application rates, it is important to first determine the crop’s nutrient needs. The N and P value of the manure can then be determined based on the N and P content of the manure, and the planned application method and timing. Incorporation of manure in spring, prior to planting a corn crop will increase the amount of N that is plant available (due to reduced N volatilization when manure is incorporated). For more details on N credits from manure, see PO#35. To calculate how much P2O5 and/or K2O are applied with a specific rate of manure, multiply the manure application rate in tons or in 1000 gallons by the lbs/ton or lbs/1000 gallons of P2O5 in the manure (as is column on the manure analysis report). If an application, for regulatory reasons, cannot exceed the equivalent of P2O5 removed with the crop (P-based manure management), first estimate crop removal of P2O5 by multiplying the yield goal by the average P content of the crop. For example: Estimated P2O5 removal by a 20 ton/acre corn silage harvest at 35% dry matter amounts to 20*2,000*35*0.61/10,000=85.4 lbs P2O5 (an estimated 4.3 lbs P2O5/ton of silage). See http://nmsp.cals.cornell.edu/publications/factsheets/factsheet28.pdf for more detail and P2O5 contents of various field crops. If insufficient N or P is applied with manure, fertilizer applications can be done to ensure sufficient nutrient supply for the crop. Where initial soil fertility levels are low, a starter application of N, P2O5 and/or K2O should be considered as nutrients from manure are released more slowly over time.
NRCCA Soil Fertility & Nutrient Management – Study Guide – 10/26/2016
34
51. Describe environmental effects from nutrient loss by:
A. Erosion
B. Runoff
C. Volatilization
D. Denitrification
E. Leaching
Erosion and Runoff Because P is held mainly in insoluble forms in the soil the predominant mechanism for P loss is when soil containing these insoluble minerals is eroded. When the eroded soil enters water the dilution effect will solubilize some of this P which can lead to eutrophication. The capacity for a soil to fix P is very large, however it is not infinite. It is possible to add enough P to use up most of the available Fe and Al, at least in the surface soil. When this happens we say the soil is saturated with P. Thus, additional P is not fixed and it remains soluble and can be lost with runoff. This becomes very important when large amounts of P are added to the soil surface. The surface layer of soil can become saturated very quickly and then, when there is runoff over the surface, it interacts with this saturated surface soil layer and picks up significant amount of soluble P and transports it off the field. If this runoff goes into a water body the P is immediately available to cause eutrophication. In very sandy soils with little natural Fe and Al, there is little capacity to hold the P and thus it becomes saturated more quickly. In these soils soluble P loss is an even greater concern and even P leaching can be significant. Management to minimize P loss is a compromise. Incorporating the P positions it so that surface runoff and erosion will not have access to the added P thus reducing the potential for loss. Also the mixing that occurs spreads the P out so that it contacts more soils; as a result the soil does not saturate with P as rapidly. However, tillage to incorporate P usually increases the potential for erosion which is the major loss mechanism for P. The ideal is to place P below the soil surface in a way that minimizes soil and residue disturbance. Direct injection of manure or fertilizer P can be very effective in reducing P loss. Finally, timing can help. Most P sources are highly soluble when first applied. If a runoff or erosion event occurs immediately following application, loss can be very high. However, with time P reacts with the soil and becomes less soluble. Thus timing P applications when it is less likely that you will have significant runoff or erosion events can reduce losses. Finally, soil properties which control water movement can play a very important role. If a soil is compacted or crusted or has a low amount of residue cover, more water will runoff increasing the potential for P loss. Managing soil drainage can have a similar impact. Volatilization Urea nitrogen (Urea fertilizer, UAN solution fertilizer, and manure all contain urea N) is unique in that the available ammonium N (NH4
+) from urea can be rapidly converted to ammonia (NH3) which is a gas. If this reaction occurs on the soil surface the ammonia is lost into the atmosphere. Losses of over 1/3 of the N from urea can occur within one week of surface application of a urea containing material. Tillage or ½ inch of rain that incorporates the urea will minimize this loss. The sooner tillage or rain occurs after application the smaller losses will be; immediate incorporation or timing application just before rain are important to reducing this loss. Other common N sources such as ammonium sulfate and ammonium nitrate are not susceptible to volatilization loss. Urease inhibitors have been developed as an additive to urea to effectively reduce the risk of volatilization loss (for up to 14 days) when incorporation is not possible. Denitrification. When soils become saturated with water, another N loss called denitrification occurs. This is especially a problem in poorly drained soils. Denitrification occurs when organisms in a saturated soil begin to run out of oxygen. Some of these organisms have developed the ability to extract the oxygen from nitrate (NO3
-) to survive. In the process, N from nitrate is released as either dinitrogen (N2) or nitrous oxide (N2O), gases which are unavailable to plants while N2O is a greenhouse gas with serious environmental implications.
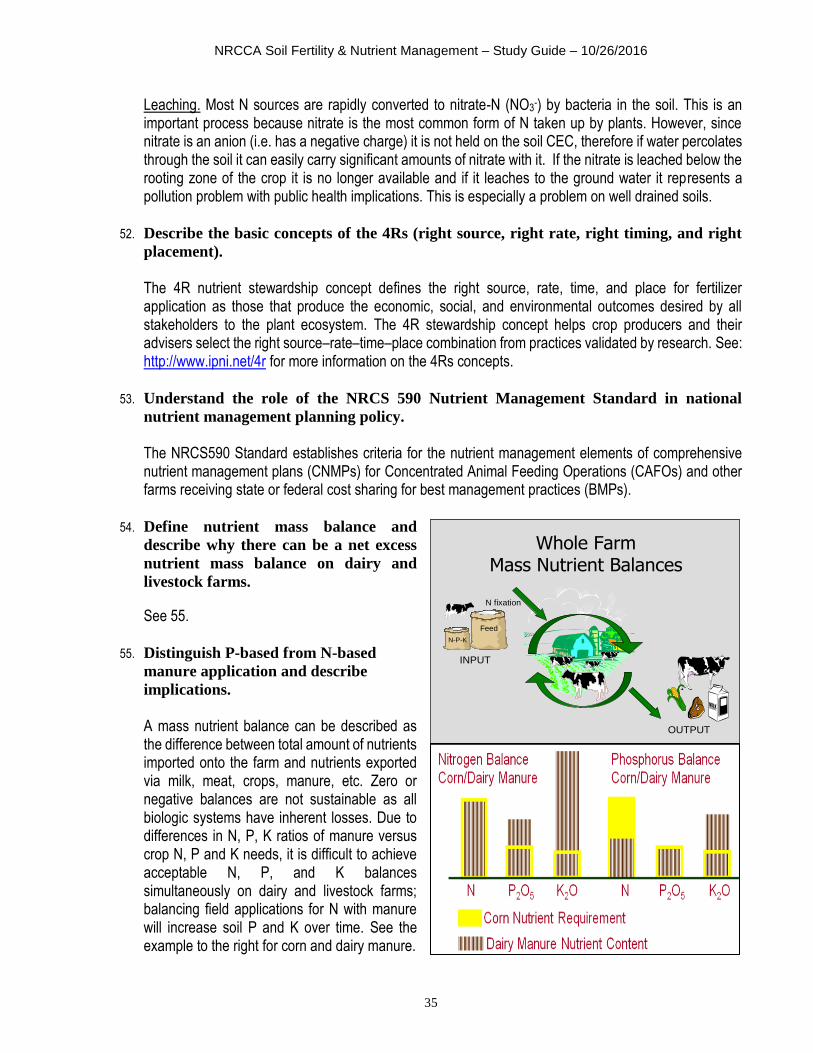
NRCCA Soil Fertility & Nutrient Management – Study Guide – 10/26/2016
35
Leaching. Most N sources are rapidly converted to nitrate-N (NO3-) by bacteria in the soil. This is an
important process because nitrate is the most common form of N taken up by plants. However, since nitrate is an anion (i.e. has a negative charge) it is not held on the soil CEC, therefore if water percolates through the soil it can easily carry significant amounts of nitrate with it. If the nitrate is leached below the rooting zone of the crop it is no longer available and if it leaches to the ground water it represents a pollution problem with public health implications. This is especially a problem on well drained soils.
52. Describe the basic concepts of the 4Rs (right source, right rate, right timing, and right
placement).
The 4R nutrient stewardship concept defines the right source, rate, time, and place for fertilizer application as those that produce the economic, social, and environmental outcomes desired by all stakeholders to the plant ecosystem. The 4R stewardship concept helps crop producers and their advisers select the right source–rate–time–place combination from practices validated by research. See: http://www.ipni.net/4r for more information on the 4Rs concepts.
53. Understand the role of the NRCS 590 Nutrient Management Standard in national
nutrient management planning policy.
The NRCS590 Standard establishes criteria for the nutrient management elements of comprehensive nutrient management plans (CNMPs) for Concentrated Animal Feeding Operations (CAFOs) and other farms receiving state or federal cost sharing for best management practices (BMPs).
54. Define nutrient mass balance and
describe why there can be a net excess
nutrient mass balance on dairy and
livestock farms.
See 55.
55. Distinguish P-based from N-based
manure application and describe
implications.
A mass nutrient balance can be described as the difference between total amount of nutrients imported onto the farm and nutrients exported via milk, meat, crops, manure, etc. Zero or negative balances are not sustainable as all biologic systems have inherent losses. Due to differences in N, P, K ratios of manure versus crop N, P and K needs, it is difficult to achieve acceptable N, P, and K balances simultaneously on dairy and livestock farms; balancing field applications for N with manure will increase soil P and K over time. See the example to the right for corn and dairy manure.
Feed
N-P-K
INPUT
OUTPUT
N fixation
Whole FarmMass Nutrient Balances
NRCCA Soil Fertility & Nutrient Management – Study Guide – 10/26/2016
36
56. Understand the importance of precision feeding for whole farm nutrient management.
The largest amount of nutrient imported by dairy and livestock farms tends to be from feed imports. Better forage quality and matching diets with animal needs can improve animal nutrient use efficiency, reducing nutrients in manure and thus reduce feed nutrient imports, improving the farm’s nutrient balance.
57. Describe various conditions and environmentally sensitive areas associated with an
elevated risk for nutrient loss from crop fields.
Phosphorus can be lost from agricultural fields as runoff that may be dissolved or sediment bound. Dissolved P (mostly orthophosphate) is available immediately for uptake by algae while sediment-bound P is a more long-term source of P to algae in water bodies. Erosion control is needed to reduce sediment-bound P loss but it is critical to understand how water moves and where surface runoff occurs as P is lost as dissolved P as well. The total amount of P lost through runoff is typically very small, but it only requires a small amount to cause water quality problems. High risk spreading conditions are likely when:
1. Significant rainfall or snowmelt is predicted within the next 48 hours. 2. Concrete frost, ice layer on soil or in snow pack, deep or dense snow, or water saturated soil is
present. 3. Tile drains are flowing at least moderately from field drainage (as opposed to ground water
interception). Manure application under the conditions outlined above have a high probability of causing water
pollution. Thus, during these conditions, it is generally recommended to avoid spreading on fields with: 1. past runoff problems or groundwater/well problems; 2. significant surface runoff or subsurface flow that can reach a stream or ditch; 3. an orientation toward a stream or watercourse with a slope greater than 3-5%; and or 4. concentrated flows.
58. Describe the importance of the following steps of an economically and environmentally
sound nutrient management plan:
A. Location of facilities and fields on maps
Enhances communication between planner, producer, farm staff and custom applicators.
B. Identify environmentally sensitive areas, including wells
Allows for careful management of nutrients to minimize offsite environmental impacts, often involving the 4Rs and setbacks from sensitive areas.
C. Specify crop rotation
Drives fertility guidelines, especially N.
D. Determine expected yields
Drives fertility guidelines, especially N, and helps with overall assessment of forage production.
NRCCA Soil Fertility & Nutrient Management – Study Guide – 10/26/2016
37
E. Obtain results of soil, plant, and water analyses
Soil tests drive P, K, Mg, etc. guidelines and manure application rates. Plant and water analysis can be done as diagnostic tools.
F. Quantification of nutrients from all sources available to the farm
We must know what nutrient sources are present to allocate them properly across the farm and to know if export of manure nutrients is needed. Nutrient sources include: manure, compost, biosolids, fertilizer, legume N, residual manure N, etc.
G. Develop a nutrient budget for each field
A field-specific nutrient budget is the amount of each nutrient required for optimum yield. Once it is known what crop needs are, fertilizer and manure can be allocated to meet crop needs and not exceed other environmental goals.
H. Make recommendations of nutrient rate, timing, form, and application method
(4Rs) based on both agronomic guidelines and environmental risk assessments
(NRCS 590).
Rate, timing, form and method affect nutrient availability and risk of environment loss.
I. Review and modify plan as needed
Annual updates are needed to reflect actual application rates, timing, method etc., rotation shifts, purchase of new land, and other changes that that could impact management in the next year.
59. Know how to calculate total animal manure production on a livestock farm:
A. Animal units
B. Load records and manure spreader calibration
Manure quantities and analyses are needed to properly allocate manure to cropland on an annual basis. Manure production can be measured based on the size of the storage, from records of how many loads of manure of a given size are hauled each year, or from animal inventories and production levels on the farm. The table on page 40 from the Penn State Agronomy Guide gives estimates of daily manure production for different animals. To use these factors you need to determine the number of animal units that are producing manure and the number of days in the manure collection period. You may need to divide the animals in to groups based on different size, age, storage or handling systems, etc. Animal units are determined using the following formula: AU = Number of animals x Average weight ÷ 1000. For growing animals use the average weight during the collection period. For example, if you are working with finishing pigs that are growing from 45 lb to 245 lb you would use an average weight of 145 lb. Therefore if you had 500 pigs you would have: 500 animals x 145 lb/animal ÷ 1000 lb/AU = 72.5 AU.
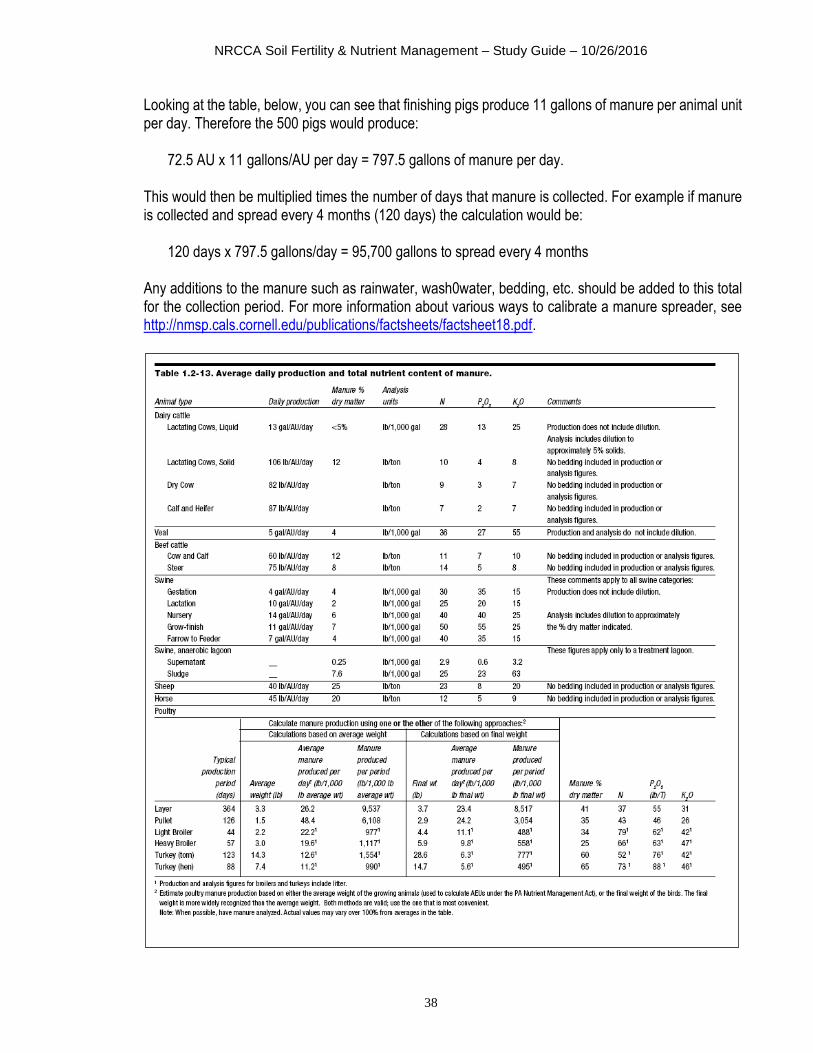
NRCCA Soil Fertility & Nutrient Management – Study Guide – 10/26/2016
38
Looking at the table, below, you can see that finishing pigs produce 11 gallons of manure per animal unit per day. Therefore the 500 pigs would produce: 72.5 AU x 11 gallons/AU per day = 797.5 gallons of manure per day. This would then be multiplied times the number of days that manure is collected. For example if manure is collected and spread every 4 months (120 days) the calculation would be: 120 days x 797.5 gallons/day = 95,700 gallons to spread every 4 months Any additions to the manure such as rainwater, wash0water, bedding, etc. should be added to this total for the collection period. For more information about various ways to calibrate a manure spreader, see http://nmsp.cals.cornell.edu/publications/factsheets/factsheet18.pdf.

NRCCA Soil Fertility & Nutrient Management – Study Guide – 10/26/2016
39
60. Recognize production, environmental and management factors that determine the
capacity/duration of manure storage needed on a livestock farm.
Size, type and number of animals affect the amount of manure generated. Land-base and weather determine accessibility in various times of the year. Equipment and labor force might restrict the ability to apply manure in short time frame.
61. Explain the purpose of the P index and list the four management categories of the P index.
The P index is designed to identify fields at high risk for P runoff by combining sources of phosphorus (soil, fertilizer, manure) with factors contributing to runoff (distance to streams, erosion, flooding frequency, drainage, etc.). The P index scores are linked to four management categories: low, medium, high or very high. Actual scores will differ for states in the Northeast (and nationally) but management guidance in each of the four categories will be the same. For state-specific P index calculations, contact the local Land Grant University. The table below reflects management categories as applied in New York. Similar tables are available for other states. NY P Index scores, vulnerability rankings and management implications.
Ranking Values Site Vulnerability Management
< 50 Low N based management. 50 – 74 Medium N based management with best management practices. 75 – 99 High P applications to crop removal.
100 Very High No P fertilizer or manure application.
62. Describe the impacts of the following manure application practices on the P runoff
index score of a field:
A. Application rate
B. Application method
C. Application timing
D. Location relative to streams
o Greater application rate = greater P index score o Incorporation lowers the P index score o Application in summer is less risky (lower score) than application early spring o Application close to streams carries greater risk (higher score) o Lower erosion means lower P index score
63. Calculate crop P removal given yield and P concentration.
To determine crop removal, multiply yield (in lbs) times the dry matter content times the P content of the dry matter. For example, 20 tons silage yield at 35% DM and 0.62% P2O5 results in a crop P2O5 removal of: 20*2000*0.35*0.62/100=87 lbs P2O5 (or 87/20=4.35 lbs P2O5 per ton silage) See http://nmsp.cals.cornell.edu/publications/factsheets/factsheet28.pdf for crop removal estimates for the most common field crops.
NRCCA Soil Fertility & Nutrient Management – Study Guide – 10/26/2016
40
64. Understand the nitrate leaching index principles and interpretations.
The Nitrate Leaching Index (LI) is an indicator of the potential for nitrate to reach groundwater. The current LI rates leaching potential based on soil hydrologic group and precipitation data. An LI below 2 indicates that the potential for nitrate leaching below the root zone is low. An LI greater than 10 indicates that the potential for nitrate leaching below the root zone is high while LI’s between 2 and 10 are considered intermediate. To meet the N leaching requirements of the NRCS Nutrient Management Standard (590), producers are expected to implement best management practices (BMP) if the LI score for a field is high (>10) and to consider BMPs if the LI score for a field is intermediate (2-10). See http://nmsp.cals.cornell.edu/publications/factsheets/factsheet11.pdf for more detail for New York.
65. Describe and understand practices that reduce the risk of nitrate leaching.
Example of practices based on New York guidelines: o Unless the New York P Index identifies the need for P based fertility management, manure and
fertilizer application rates should be based on Cornell guidelines for meeting crop N needs. o For corn, pre-plant (other than starter fertilizer) and early post plant broadcast applications of
commercial nitrogen without the use of nitrification inhibitors are not recommended. o Sidedress applications should be made after the corn has at least four true leaves. o For row and cereal crops, including corn, maintain starter fertilizer N rates below 50 lbs/acre actual
N under normal conditions. o Manure and fertilizer applications should be adjusted based on information provided in “Nitrogen
Recommendations for Field Crops in New York” (see additional resources). o Evaluate the need for sidedress N applications based on PSNT or other soil nitrogen tests. o Sod crops should not be incorporated in the fall. Chemical sod killing may be carried out when the
soil temperature at four-inch depth is approaching 45oF. o Minimize fall and/or winter manure application on good grass and/or legume sod fields that are to be
rotated the following spring. o Appropriate ammonia conservation is encouraged. Losses can either be reduced by immediately
incorporating manure or eliminated by directly injecting manure as a sidedress application to growing crops.
o Plant winter hardy cover crops whenever possible, especially when fall manure is applied (e.g., rye, winter wheat, or interseed ryegrass in summer).
o Manure may be applied in the fall where there is a growing crop. Judicious amounts of manure can be applied to or in conjunction with perennial crops or winter hardy cover crops. Applications should generally not exceed 50 lbs/acre of first year available N or 50% of the expected N needs of next year’s crop.
o Frost incorporation/injection is acceptable when soil conditions are suitable, but winter applications should be made in accordance with the NY Phosphorus Index.
o Manure N application on legumes is acceptable to satisfy agronomic requirements when legumes represent less than 50% of the stand. When legumes represent more than 50% of the stand, manure application should be limited to no more than 150 lbs of available N/acre.
66. Describe and understand practices that reduce manure odor issues.
Manure treatment and incorporation are two main ways to reduce odor.
Leaching Index for Hydrologic Group B
Leaching Index for Hydrologic Group B

NRCCA Soil Fertility & Nutrient Management – Study Guide – 10/26/2016
41
67. Describe and understand practices that reduce agricultural impacts on air quality.
Manure incorporation is one way to reduce air emissions of ammonia from fields.
68. Describe and understand practices that reduce pathogen concerns from manure.
Improved calf care, herd management factors that reduce pathogen loading, cold temperatures, long storage, methane digestion and composting can reduce pathogen loads.
69. Understand the concepts of adaptive nutrient management and associated tools:
a. Corn stalk nitrate test, Illinois soil nitrogen test, standard soil fertility testing b. Nutrient mass balance c. Record keeping d. Analysis and adaptation over multiple seasons based on field-specific observations e. Precision agriculture equipment (crop sensors/soil sensors and models)
Adaptive nutrient management (ANM) is a process where farmers can test input response and adjust field management over time. The ANM process is based on a recognition that optimizing both yield and input levels will help maximize return per acre and minimize the overall environmental footprint of crop production. The process promotes ongoing refinement of nutrient application emphasizing the use of “the right nutrients, at the right rate, timing, and placement” to minimize nutrient losses to the environment (4Rs). The ANM process requires the use of assessment tools (measurements, record keeping) combined with learning and adapting management over time. The NRCS gives the following definition: “Adaptive nutrient management is a process used to evaluate and adjust nutrient application and utilization strategies over time (multiple seasons). The process allows for continued adjustments of the NRCS-assisted Conservation Practice Standard (CPS) Code 590, Nutrient Management, to achieve better nutrient use efficiency. Adaptive nutrient management promotes the coordination of amount (rate), source, timing, and placement (method of application) of plant nutrients to minimize nutrient losses. State-approved adaptive nutrient management activities are considered in compliance with the operation and maintenance requirements of the CPS Code 590, Nutrient Management, and step 9 (plan evaluation) of Title 180, National Planning Procedures Handbook (NPPH), Part 600 (Subpart A, Section 600.11).” (NRCS Technical Note #6; See Additional Resources).” The ANM process has five steps:
1. characterize the current condition; 2. develop a plan for evaluation of an alternative practice; 3. implement a comparison of the current practice and a management change; 4. evaluate results, learn and identify potential management changes; and 5. adjust management based on lessons learned.
Step 1: Characterize the current status Current farm management and conditions are the starting point for ANM. For example, if ANM is applied to a nutrient management decision, the starting point relates to farm’s current application rates, methods and timing of various nutrient sources. Annual whole farm mass nutrient balance assessments (see: http://nmsp.cals.cornell.edu/publications/factsheets/factsheet25.pdf) can be used to monitor progress in nutrient use efficiency at the whole farm level.
NRCCA Soil Fertility & Nutrient Management – Study Guide – 10/26/2016
42
Step 2: Develop a plan for evaluation In this step, a solid research question needs to be developed. This is where management alternatives are discussed and 2-3 comparisons are selected for evaluation; for example, a comparison of different starter N rates, or a comparison of manure application methods. The exact comparison needs to be decided (rates, timing, sources etc.) and a design for the comparison needs to be developed. It is important that the different treatments are replicated within the field (at least 4 times) and that within each replication, each treatment is randomly assigned. For more details on setting up practical on-farm trials, see http://nmsp.cals.cornell.edu/publications/factsheets/factsheet68.pdf. It is also important to decide what to measure. In addition to yield and dry matter, regular soil, tissue or forage quality tests may be advisable. Other potential measurements include the corn stalk nitrate test (CSNT; see: http://nmsp.cals.cornell.edu/publications/factsheets/factsheet31.pdf) and Illinois soil nitrogen test (ISNT; see http://nmsp.cals.cornell.edu/publications/factsheets/factsheet36.pdf).
Step 3: Implement a comparison Before an on-farm trial is implemented, it is important to decide trial location(s). Practical considerations that affect suitability are distance to farm scales, size, field uniformity, management history, and nutrient status. For example, to test 2-3 different P fertilizers for their impact on yield a low P field should be used as high P fields will not respond to extra P no matter what the source is. Keep good records as the season goes along as records will be needed to try to learn from the results. Agricultural technologies such as crop sensing and precision agriculture tools (autosteer,yield monitors, etc.) can greatly enhance on-farm experimentation and collection of relevant data.
Step 4: Evaluate and learn from results The review of the data is to evaluate how well the alternative practice worked, and to make adjustments as needed to improve nutrient use efficiency and reduce nutrient losses in future years. For replicated on-farm trials, rely on university staff to help with statistical analyses. Trials are important for individual farmers, but there is great advantage of being part of a larger group of farmers who all conducted similar trials. The latter has the advantage of discussing results as a group, the data can be used to improve Land Grant University guidelines, and with a larger number of trials, we can build confidence in the results much quicker. Keep in mind that often multiple years of data are needed for a reliable answer so the same research should be repeated until the farmers are comfortable with the results under varying conditions. Step 5: Adjust management Once the farmer is confident that a management alternative is improving the farm’s profitability, productivity, and/or environmental stewardship, it is time to implement the new management. In addition to an individual practice evaluation, a whole farm nutrient balance can show the impact of the management change on the farm’s nutrient use efficiency while also allowing for tracking of milk production and other farm productivity indicators.