single plasmonic nanoparticle tracking studies of solid...
TRANSCRIPT

Single Plasmonic Nanoparticle Tracking Studies of Solid SupportedBilayers with Ganglioside LipidsLaura B. Sagle,† Laura K. Ruvuna,† Julia M. Bingham,§ Chunming Liu,‡ Paul S. Cremer,‡
and Richard P. Van Duyne*,†
†Department of Chemistry, Northwestern University, Evanston, Illinois 60208, United States‡Department of Chemistry, Texas A&M University, College Station, Texas 77843, United States§Department of Chemistry, Saint Xavier University, Chicago, Illinois 60655, United States
*S Supporting Information
ABSTRACT: Single-particle tracking experiments were car-ried out with gold nanoparticle-labeled solid supported lipidbilayers (SLBs) containing increasing concentrations ofganglioside (GM1). The negatively charged nanoparticleselectrostatically associate with a small percentage of positivelycharged lipids (ethyl phosphatidylcholine) in the bilayers. Thesamples containing no GM1 show random diffusion in 92% ofthe particles examined with a diffusion constant of 4.3(±4.5) ×10−9 cm2/s. In contrast, samples containing 14% GM1 showeda mixture of particles displaying both random and confined diffusion, with the majority of particles, 62%, showing confineddiffusion. Control experiments support the notion that the nanoparticles are not associating with the GM1 moieties but insteadmost likely confined to regions in between the GM1 clusters. Analysis of the root-mean-squared displacement plots for all of thedata reveals decreasing trends in the confined diffusion constant and diameter of the confining region versus increasing GM1concentration. In addition, a linearly decreasing trend is observed for the percentage of randomly diffusing particles versus GM1concentration, which offers a simple, direct way to measure the percolation threshold for this system, which has not previouslybeen measured. The percolation threshold is found to be 22% GM1 and the confining diameter at the percolation threshold only∼50 nm.
■ INTRODUCTION
Single-particle tracking experiments utilizing plasmonic nano-particles have gained popularity in recent years for studyingbiological phenomena ranging from the motion of motorproteins to membrane fusion in live cells.1,2 Unlike fluorescencedyes, plasmonic nanoparticles have large scattering crosssections and do not photobleach or blink, which allows formeasurements over long time periods.3 Single-particle trackinghas proven particularly useful for studying cellular membranes,since it enables direct characterization of the type of motion ofdifferent components in the membrane.4,5 For example, single-particle tracking of lipids in cellular membranes have greatlyincreased our understanding of the steps involved in membranefusion as well as lipid−cytoskeleton interactions.6,7 In addition,single-particle tracking has been used to study protein−proteininteractions in membrane environments.8 These measurementshave allowed for a better understanding of the compartmen-talization of proteins in the cell membrane.9,10
One of the more prominent ganglioside lipids present in theplasma membranes of mammalian cells, GM1 is a receptor forboth cholera toxin and Escherichia coli heat-labile enter-otoxin.11,12 The binding of cholera toxin involves all five Bsubunits of the protein binding GM1 and has been extensivelystudied as a multivalent binding system in cellular mem-
branes.13−15 Interestingly, unlike other multivalent bindingsystems in which an increase in binding strength is observed(the Kd value is smaller) with an increase in ligandconcentration,16 the cholera toxin−GM1 system shows theopposite effect. Mainly, the binding of cholera toxin actuallydecreases with increasing GM1 concentration.
17,18 A systematicstudy of cholera toxin binding to GM1 was recently carried outusing solid supported lipid bilayers (SLBs), a cell membranemimetic.19 A model was introduced in which the higher GM1
concentrations induce clustering of the gangliosides in thebilayer. This clustering of GM1 within the SLBs is believed toinhibit the binding of cholera toxin. Additional studies usingAFM and fluorescence imaging also lend substantial weight tothe idea of GM1 clustering.
20−23
In addition to the recruitment of bacterial and viral toxins,GM1 has also been implicated as one of the key componentspresent in lipid rafts domains of cellular membranes, whichhave a profound influence on cell signaling and trafficking.24−26
Clusters rich in GM1 that form in membranes are oftenmodeled as liquid ordered phases, with substantially reducedmobility of their constituent lipids.27 In addition, the clusters
Received: June 4, 2012Published: August 31, 2012
Article
pubs.acs.org/JACS
© 2012 American Chemical Society 15832 dx.doi.org/10.1021/ja3054095 | J. Am. Chem. Soc. 2012, 134, 15832−15839
promote lipid segregation, with little exchange of lipids betweenphases.28 Thus, increasing the GM1 concentration in amembrane will eventually lead to a percolation threshold, inwhich the GM1 clusters are the major component and the fluidphase becomes discontinuous. This has a significant effect onthe cell’s ability to interact and respond to its environment,since protein components in the fluid part of the membrane arethen isolated from each other. Phase behavior of many differenttypes of mixed lipid bilayer systems, such as the liquid/gelphase DMPC/DSPC,29 liquid/solid phase DPPC/LigGalCer,30
and DMPC/cholesterol31,32 have been carried out usingtechniques such as NMR, ESR, and DSC. Recently,fluorescence recovery after photobleaching (FRAP) has beenused to study the connectivity of different components in amixed lipid bilayer and provided a measurement of thepercolation threshold of these systems.33,34 Unfortunately,trends observed using FRAP are often a result of manyunderlying mechanisms and further modeling is often requiredto understand the percolation behavior of the system.Alternatively, a more direct way of measuring a percolationthreshold in a mixed lipid system is to carry out single-particletracking studies, in which the molecule being tracked is onlysoluble in one component of the mixture.Herein, we revisit fundamental questions concerning the
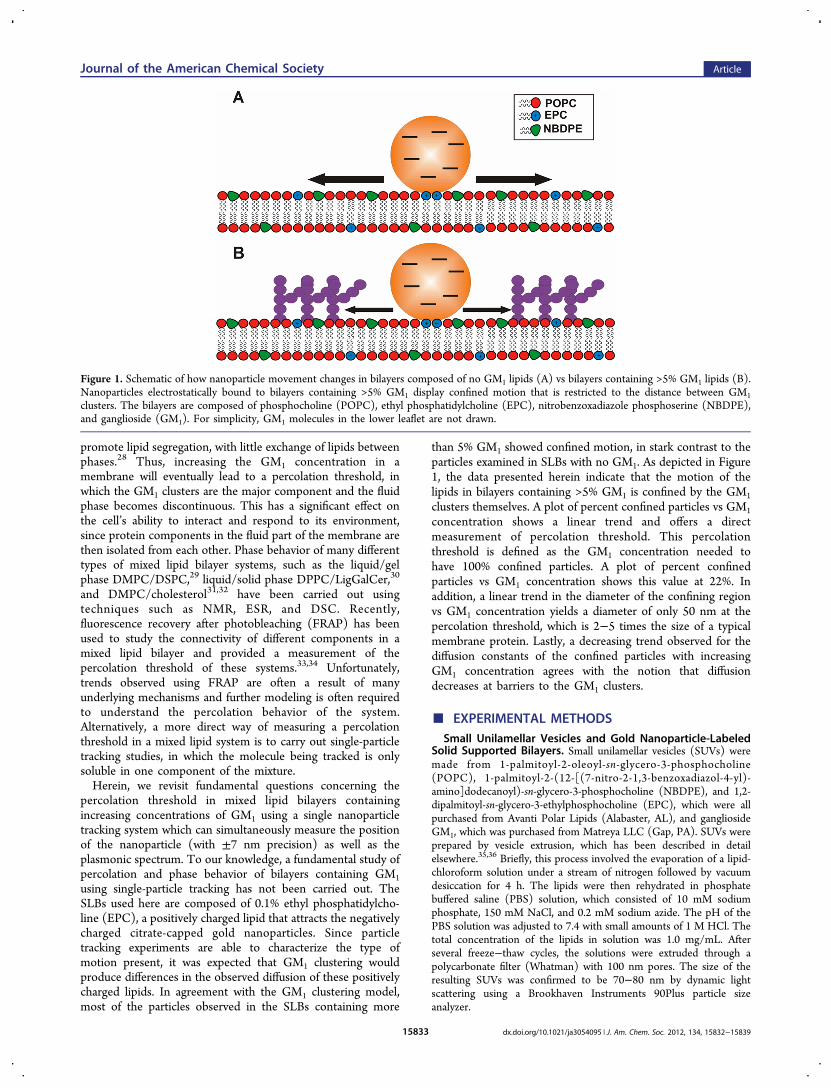
percolation threshold in mixed lipid bilayers containingincreasing concentrations of GM1 using a single nanoparticletracking system which can simultaneously measure the positionof the nanoparticle (with ±7 nm precision) as well as theplasmonic spectrum. To our knowledge, a fundamental study ofpercolation and phase behavior of bilayers containing GM1using single-particle tracking has not been carried out. TheSLBs used here are composed of 0.1% ethyl phosphatidylcho-line (EPC), a positively charged lipid that attracts the negativelycharged citrate-capped gold nanoparticles. Since particletracking experiments are able to characterize the type ofmotion present, it was expected that GM1 clustering wouldproduce differences in the observed diffusion of these positivelycharged lipids. In agreement with the GM1 clustering model,most of the particles observed in the SLBs containing more
than 5% GM1 showed confined motion, in stark contrast to theparticles examined in SLBs with no GM1. As depicted in Figure1, the data presented herein indicate that the motion of thelipids in bilayers containing >5% GM1 is confined by the GM1clusters themselves. A plot of percent confined particles vs GM1concentration shows a linear trend and offers a directmeasurement of percolation threshold. This percolationthreshold is defined as the GM1 concentration needed tohave 100% confined particles. A plot of percent confinedparticles vs GM1 concentration shows this value at 22%. Inaddition, a linear trend in the diameter of the confining regionvs GM1 concentration yields a diameter of only 50 nm at thepercolation threshold, which is 2−5 times the size of a typicalmembrane protein. Lastly, a decreasing trend observed for thediffusion constants of the confined particles with increasingGM1 concentration agrees with the notion that diffusiondecreases at barriers to the GM1 clusters.
■ EXPERIMENTAL METHODSSmall Unilamellar Vesicles and Gold Nanoparticle-Labeled
Solid Supported Bilayers. Small unilamellar vesicles (SUVs) weremade from 1-palmitoyl-2-oleoyl-sn-glycero-3-phosphocholine(POPC), 1-palmitoyl-2-(12-[(7-nitro-2-1,3-benzoxadiazol-4-yl)-amino]dodecanoyl)-sn-glycero-3-phosphocholine (NBDPE), and 1,2-dipalmitoyl-sn-glycero-3-ethylphosphocholine (EPC), which were allpurchased from Avanti Polar Lipids (Alabaster, AL), and gangliosideGM1, which was purchased from Matreya LLC (Gap, PA). SUVs wereprepared by vesicle extrusion, which has been described in detailelsewhere.35,36 Briefly, this process involved the evaporation of a lipid-chloroform solution under a stream of nitrogen followed by vacuumdesiccation for 4 h. The lipids were then rehydrated in phosphatebuffered saline (PBS) solution, which consisted of 10 mM sodiumphosphate, 150 mM NaCl, and 0.2 mM sodium azide. The pH of thePBS solution was adjusted to 7.4 with small amounts of 1 M HCl. Thetotal concentration of the lipids in solution was 1.0 mg/mL. Afterseveral freeze−thaw cycles, the solutions were extruded through apolycarbonate filter (Whatman) with 100 nm pores. The size of theresulting SUVs was confirmed to be 70−80 nm by dynamic lightscattering using a Brookhaven Instruments 90Plus particle sizeanalyzer.
Figure 1. Schematic of how nanoparticle movement changes in bilayers composed of no GM1 lipids (A) vs bilayers containing >5% GM1 lipids (B).Nanoparticles electrostatically bound to bilayers containing >5% GM1 display confined motion that is restricted to the distance between GM1clusters. The bilayers are composed of phosphocholine (POPC), ethyl phosphatidylcholine (EPC), nitrobenzoxadiazole phosphoserine (NBDPE),and ganglioside (GM1). For simplicity, GM1 molecules in the lower leaflet are not drawn.
Journal of the American Chemical Society Article
dx.doi.org/10.1021/ja3054095 | J. Am. Chem. Soc. 2012, 134, 15832−1583915833

Solid supported bilayers (SLBs) were formed by incubating the 1.0mg/mL lipid vesicle solution on glass coverslips (Corning, NY, 22 ×22 mm, No. 2), which were cleaned with boiling 7× detergent andincubated at 500 °C for 5 h. Bilayer formation was assumed to becomplete after 10 min incubations at room temperature. The SLBswere washed with copious amounts of deionized (DI) water to removevesicles not associated with the glass coverslip. The SLBs were thenincubated with a solution of 100 nm citrate-capped gold colloids (TedPella No. 157113) that was diluted 10× for ca. 1 h. The gold-labeledSLBs were then washed with DI water to remove non-associatednanoparticles.Fluorescence Recovery after Photobleaching. Confirmation
of SLB formation was carried out using FRAP. FRAP experimentswere done with a 2.5 W mixed gas argon/krypton ion laser (Stabilite2018, Spectra Physics). Lipid bilayers were irradiated at 488 nm with100 mW of power for 2 s. A bleach spot was made on the bilayer usinga 10× objective, and fluorescence recovery of the bleached spots wasmeasured as a function of time. The mobile fraction and the half-timeof recovery t1/2 of NBDPE lipids were determined from singleexponential fitting of fluorescence recovery curves. The lateraldiffusion coefficient of NBDPE lipids is calculated as follows:37
γ=Dwt4
2
1/2D
(1)
where w is the radius of the circle disk profile of the bleaching light,and γD is a correction factor that depends on the bleach time and thegeometry of the laser beam. The value of γD and w used were 1.2 and17.7 μm, respectively. Fitting the data shown in Figure S2a(Supporting Information) for bilayers containing no GM1 resulted ina diffusion coefficient of 2.5 × 10⁻⁸ cm2/s and 100% mobile fraction.Fitting of the data shown in Figure S2b for bilayers containing 8%GM1 yielded a diffusion coefficient of 1.9 × 10⁻⁸ cm2/s and 91%mobile fraction.Single-Particle Tracking. As shown in Figure 2, single-particle
tracking experiments were carried out with an inverted microscope
(Nikon, Eclipse Ti-U) equipped with a dark-field condenser (Nikon,NA = 0.8−0.95) and a 100× variable-aperture oil immersion objective(Nikon, NA 0.5−1.3) which was set to NA = 0.5 to collect only thescattered light from the gold nanoparticles. The scattered light from allthe nanoparticles in the field of view (80 × 80 μm) was collected andsent through an acoustic-optical tunable filter (Gooch and Housego,His-300 hyperspectral imaging system) which has continuouslytunable transmission from 500 to 800 nm and a spectral bandwidthof 1−6 nm. The scattered light was then directed into an EM-CCDcamera (Princeton Instruments, proEM512), and the images werestored and analyzed using the LightView (Princeton Instruments) andMatlab (Mathworks, Inc.) software. This allows for one to not only
track moving particles with time, but also for the simultaneouscollection of the visible spectra. The bandwidth for these experimentswas set to 3 nm, and the time resolution of the measurements, 62 ms,was determined by the shutter of the EM-CCD camera plus thereadout time. The spatial resolution was determined by approximatingthe point spread function of a still particle as a two-dimensionalGaussian function and measuring the standard deviation in thecentroid of the Gaussian over 300 frames of data (see Figure S3).38
Briefly, a linescan of a still particle in the x direction was fit to aGaussian function at each frame. The variance for the centroid of theGaussian was then calculated for all 300 frames of data. Likewise, alinescan of the same particle in the y direction was fit to a Gaussianfunction at each frame and the variance calculated for the centroidover 300 frames. The variance in two dimensions was then calculatedaccording to
σ σ σ σ σ= +/xy x y yx (2)
and the standard deviation associated with determining the center ofthe two-dimensional Gaussian, which determines the spatial resolution,was taken as the square root of the variance. The measured spatialresolution was found to be 6.7 nm. Single nanoparticle trajectorieswere obtained by marking the x−y centroid position of each particle ateach intensity image over time using Matlab.
As noted above, instrumentation recently developed in ourlaboratory allows for the measurements involved to not only trackparticles in real time but also acquire a visible spectrum of eachparticle.39 The gold nanoparticles used herein contain plasmonresonances in the visible region, which are very sensitive to the localindex of refraction.40,41 Thus, tracking both the LSPR spectral featuresand motion of the nanoparticles should allow for complex biologicalinteractions to be discerned. To obtain LSPR spectra, the intensitiescollected for the nanoparticles in the field of view from 500 to 800 nmwas divided by a spectrum collected with no sample (dark) and the fulllamp intensity over the same wavelength values and time scales inMatlab. Representative LSPR spectra for the gold nanoparticles usedare shown in Figures 3 and 4.
■ RESULTS
Single nanoparticle trajectories were collected in thirty to fortydifferent areas of SLB samples containing no GM1. Each 80 ×80 μm area contained several moving nanoparticles enablingthe acquisition of close to 100 different trajectories. It isimportant to note that many of the nanoparticles in the field ofview (approximately 20−40%) were stationary and it wasassumed that these particles were bound to the glass via defectspresent in the SLBs. Of the particles examined, 92% showedrandom diffusion, with the other 8% of particles displayingconfined diffusion. Due to defects in the bilayer, the smallamount of confined diffusion observed here could be the resultof particles trapped between two defect sites. The trajectoriesand mean squared displacement plots of three representativeparticles is shown in Figure 3. The plots for the particles shownare linear, indicating the diffusion is random, Brownian motionand can be fit to the expression, ⟨r2⟩ = 4Dt, where ⟨r2⟩ is themean-squared displacement, D the diffusion constant, and t thetime lag. Fitting the plots shown in Figure 3 with a linearregression yields diffusion constants of 8.0 × 10⁻⁹, 2.8 × 10⁻⁹,and 6.5 × 10⁻⁹ cm2/s for particles 1, 2, and 3, respectively.Taking into account all the particles (at different GM1concentrations) that also showed the same linear behavior, anaverage value of the diffusion constant was found to be4.3(±4.5) × 10−9 cm2/s. This value is consistent with otherliterature studies, which used single-particle tracking of 50 nmgold nanoparticles on SLBs and fall within the range of 1 ×10⁻⁸−1 × 10⁻⁹ cm2/s.42−44 Additionally, Figure 3C shows
Figure 2. Setup used to carry out single nanoparticle trackingexperiments. Samples are mounted on an inverted microscope andviewed through a 100× oil immersion objective. A dark field condenseris placed on top of the sample so that only the scattered light ismeasured. The scattered light at all wavelengths then passes throughthe objective, a coupling lens and into a set of acousto-optical tunablefilters (AOTF) where only one wavelength of light goes through to theEMCCD camera at a given time. This allows for the simultaneousacquisition of the particles position as well as the scattering spectrum.
Journal of the American Chemical Society Article
dx.doi.org/10.1021/ja3054095 | J. Am. Chem. Soc. 2012, 134, 15832−1583915834
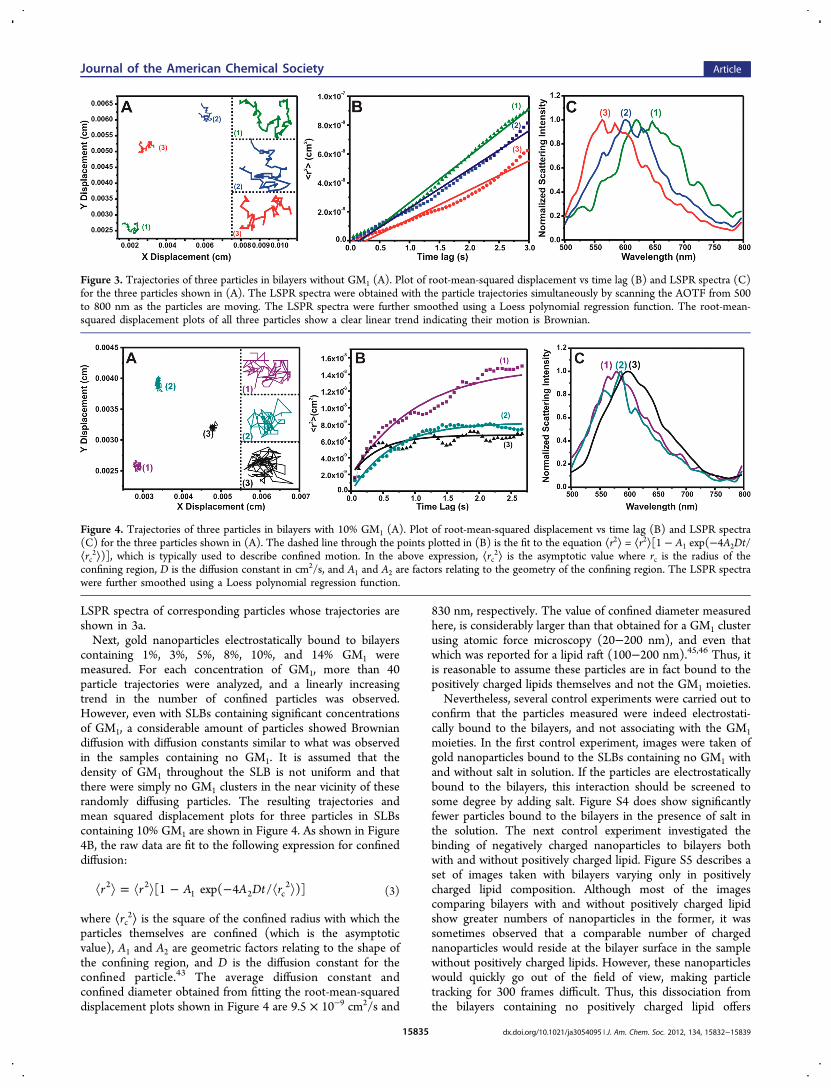
LSPR spectra of corresponding particles whose trajectories areshown in 3a.Next, gold nanoparticles electrostatically bound to bilayers
containing 1%, 3%, 5%, 8%, 10%, and 14% GM1 weremeasured. For each concentration of GM1, more than 40particle trajectories were analyzed, and a linearly increasingtrend in the number of confined particles was observed.However, even with SLBs containing significant concentrationsof GM1, a considerable amount of particles showed Browniandiffusion with diffusion constants similar to what was observedin the samples containing no GM1. It is assumed that thedensity of GM1 throughout the SLB is not uniform and thatthere were simply no GM1 clusters in the near vicinity of theserandomly diffusing particles. The resulting trajectories andmean squared displacement plots for three particles in SLBscontaining 10% GM1 are shown in Figure 4. As shown in Figure4B, the raw data are fit to the following expression for confineddiffusion:
= − −r r A A Dt r[1 exp( 4 / )]2 21 2 c
2(3)
where ⟨rc2⟩ is the square of the confined radius with which the
particles themselves are confined (which is the asymptoticvalue), A1 and A2 are geometric factors relating to the shape ofthe confining region, and D is the diffusion constant for theconfined particle.43 The average diffusion constant andconfined diameter obtained from fitting the root-mean-squareddisplacement plots shown in Figure 4 are 9.5 × 10⁻⁹ cm2/s and
830 nm, respectively. The value of confined diameter measuredhere, is considerably larger than that obtained for a GM1 clusterusing atomic force microscopy (20−200 nm), and even thatwhich was reported for a lipid raft (100−200 nm).45,46 Thus, itis reasonable to assume these particles are in fact bound to thepositively charged lipids themselves and not the GM1 moieties.Nevertheless, several control experiments were carried out to
confirm that the particles measured were indeed electrostati-cally bound to the bilayers, and not associating with the GM1moieties. In the first control experiment, images were taken ofgold nanoparticles bound to the SLBs containing no GM1 withand without salt in solution. If the particles are electrostaticallybound to the bilayers, this interaction should be screened tosome degree by adding salt. Figure S4 does show significantlyfewer particles bound to the bilayers in the presence of salt inthe solution. The next control experiment investigated thebinding of negatively charged nanoparticles to bilayers bothwith and without positively charged lipid. Figure S5 describes aset of images taken with bilayers varying only in positivelycharged lipid composition. Although most of the imagescomparing bilayers with and without positively charged lipidshow greater numbers of nanoparticles in the former, it wassometimes observed that a comparable number of chargednanoparticles would reside at the bilayer surface in the samplewithout positively charged lipids. However, these nanoparticleswould quickly go out of the field of view, making particletracking for 300 frames difficult. Thus, this dissociation fromthe bilayers containing no positively charged lipid offers
Figure 3. Trajectories of three particles in bilayers without GM1 (A). Plot of root-mean-squared displacement vs time lag (B) and LSPR spectra (C)for the three particles shown in (A). The LSPR spectra were obtained with the particle trajectories simultaneously by scanning the AOTF from 500to 800 nm as the particles are moving. The LSPR spectra were further smoothed using a Loess polynomial regression function. The root-mean-squared displacement plots of all three particles show a clear linear trend indicating their motion is Brownian.
Figure 4. Trajectories of three particles in bilayers with 10% GM1 (A). Plot of root-mean-squared displacement vs time lag (B) and LSPR spectra(C) for the three particles shown in (A). The dashed line through the points plotted in (B) is the fit to the equation ⟨r2⟩ = ⟨r2⟩[1 − A1 exp(−4A2Dt/⟨rc
2⟩)], which is typically used to describe confined motion. In the above expression, ⟨rc2⟩ is the asymptotic value where rc is the radius of the
confining region, D is the diffusion constant in cm2/s, and A1 and A2 are factors relating to the geometry of the confining region. The LSPR spectrawere further smoothed using a Loess polynomial regression function.
Journal of the American Chemical Society Article
dx.doi.org/10.1021/ja3054095 | J. Am. Chem. Soc. 2012, 134, 15832−1583915835

additional proof of this electrostatic interaction betweennanoparticles and the bilayer. The third control experimentwas performed to look at the localized surface plasmonresonance (LSPR) spectra of the particles in H2O, bound toSLBs containing no GM1, and bound to SLBs containing 10%GM1. The LSPR spectra of these particles are extremelysensitive to the refractive index of the surrounding media andshould be a measure of how the particles are associating andinteracting with the SLBs. As shown in Figure S6, the maximumin the LSPR spectrum does shift slightly upon binding SLBs,but no further shift is observed when binding to SLBscontaining GM1, also supporting the notion that the particlesthemselves are not associating with GM1. Lastly, we wished toconfirm that the binding of the nanoparticles to the SLBs is notaffected by the size or capping agent of the particles. Thus,single-particle tracking experiments were carried out using 50nm citrate-capped gold nanoparticles purchased from CABOT(instead of Ted Pella) with SLBs containing 1% GM1. Thesedata showed diffusion constants for both the confined andrandomly diffusing particles to be similar to that observed withthe Ted Pella particles, 1.1(±1.3) × 10−8 and 6.5(±6.1) × 10−9
cm2/s, respectively. In addition, the percent randomly diffusingparticles, 86%, is also similar to what was observed with the TedPella particles.The parameters obtained from fitting the root-mean-squared
displacement plots for all the particles measured in bilayerscontaining 0%, 1%, 3%, 5%, 8%, 10%, and 14% GM1 are shownin Table 1. As shown in column 3 of Table 1, the percentage ofrandomly diffusing particles decreases with GM1 concentrationin a linear fashion. The diffusion constants for the randomlydiffusing particles, column 4, show little change with increasingGM1 in the bilayers. In contrast, diffusion constants forconfined particles show a marked decrease with GM1concentration. Lastly, the diameter of the confining region forthe confined particles also shows a decreasing trend with GM1concentration. To further illustrate the trends observed incolumns 5 and 6 of Table 1, histogram plots were generatedwhich tallied the diffusion constants and confining diameter foreach confined particle at all the GM1 concentrations measured,Figure 5.
■ DISCUSSION
McConnell and co-workers47 first established in 1975 thatbiological membranes consist of many components that canexist in a variety of phases. The connection between theexistence of liquid condensed regions in membranes and theirpossible effects on cellular processes relies on their ability tocompartmentalize membrane components through selectivepermeability and reduced mobility. Indeed, several recentstudies involving FRAP, single-particle tracking, and fluores-
cence correlation spectroscopy show greatly decreased mobilityin clustered domains.48,49 Additionally, selective permeability oflipids and membrane components in and out of raft-likedomains has also been studied extensively.28,50 Our resultssupport a model of GM1 clustering into domains atconcentrations above 5% GM1. Moreover, the nanoparticles
Table 1. Measured Diffusion Parameters for Individual Particles
diffusion constant (cm2/s)
GM1 concn (%) no. of particles measuredrandom
diffusion (%) random confined confined diameter (nm)
0 95 92 4.3(±4.5) × 10−9 1.3(±0.8) × 10−8 1300(±1100)1 63 84 3.8(±3.9) × 10−9 2.0(±0.7) × 10−8 1100(±1100)3 81 77 9.6(±5.6) × 10−10 1.1(±0.5) × 10−8 1500(±410)5 45 56 2.9(±4.4) × 10−9 7.9(±3.9) × 10−9 870(±470)8 51 59 2.1(±4.5) × 10−9 9.6(±8.3) × 10−9 680(±570)10 43 42 2.3(±2.8) × 10−9 1.7(±1.4) × 10−10 820(±500)14 52 38 9.4(±6.7) × 10−10 1.8(±1.8) × 10−10 560(±210)
Figure 5. Series of histogram plots showing how the diffusion constantof the confined particles decreases with increasing GM1 concentration(A). Histogram plots showing a decreasing trend in the confinedradius with increasing GM1 concentration (B). Histogram plots for 0%and 1% GM1 are not shown since the number of confined particles wassmall.
Journal of the American Chemical Society Article
dx.doi.org/10.1021/ja3054095 | J. Am. Chem. Soc. 2012, 134, 15832−1583915836

associated with the lipids in the fluid phase are not observed topartition into the GM1 clusters, indicating selective perme-ability. Instead, the GM1 clusters themselves act as barriers tothe nanoparticles whose motion is confined to smaller domainsof the fluid phase at high concentrations of GM1. This notion issupported by all the trends shown in Table 1 with increasingGM1 concentrations; increasing amounts of confined particles,decreasing diameters for the confining regions and a decrease inthe diffusion constants of the confined particles.If the function of a cluster with decreased mobility is to
physically compartmentalize the membrane components andcontrol, to some degree, membrane partitioning, the inter-connectivity of the condensed and liquid phase is extremelyimportant for cellular function. A parameter that describes theconnectivity of two phases that make up a membrane is thepercolation threshold. Below the percolation threshold, thefluid phase, making up the majority of the bilayer, isinterconnected and consists of small island-like structures ofGM1-rich domains (similar to what has previously beenobserved for metallic films).51 At and above the percolationthreshold, this fluid phase is broken up by the GM1-richdomains, creating an obstacle to a membrane componentsoluble in the fluid phase that is attempting to diffuse from onepart of the membrane to another. In the simple modelmembrane systems studied here, anomalous diffusion wasobserved in less than 1% of the particles examined, and in orderto focus on the majority of the particles, these data wereexcluded from the paper. Therefore, 99% of the particlesexamined simply showed either random or confined diffusion,making the analysis quite straightforward. It is also important tonote that the time scales of the measurements described hereinare quite short (only 3 s) and possibly not long enough toobserve events involving hopping between adjacent domains.Since the particles are restricted solely to the fluid phasewithout GM1, a percolation threshold value is defined as theconcentration of GM1 needed to have 100% confined particles.Thus, if all of the fluid phase particles are confined, the clusterscontaining GM1 must be interconnected. Percolation thresholdvalues have been obtained for mixed bilayer systems, typicallyusing FRAP, but these values rely on a knowledge of thegeometry of the confining region as well as the geometry of thebleach spot.29,52,53 Our value of percolation threshold does notrely on a priori knowledge of the growth of the confiningregions and their geometry and is therefore a more directmeasurement. The value for percolation threshold for thissystem is simply obtained from plotting the % randomlydiffusing particles versus GM1 concentration. As shown inFigure 6, this plot shows a linear trend and through linearextrapolation, a percolation threshold value of 22% is obtained.This value is similar to what has been observed using FRAPwith mixed bilayer systems containing liquid and gel phaselipids, such as DLPC/DSPC and DMPC/DSPC, which are alsobelieved to segregate into domains.29 The percolation thresholdvalue of 22% GM1 is higher than that observed in biologicalcells, with a value of 10−12% GM1 observed in neurons beingthe highest.54 However, it should be noted that the GM1moieties are most likely asymmetrically distributed among thetwo leaflets of the membrane giving rise to higherconcentrations on the outer surface of the cell.55 It shouldalso be noted that there is a growing number of studies thatshow using charged probe molecules can affect the distributionand mobility of lipids within the bilayer.49,56,57 In addition, cellscontain other ganglioside components, such as GM2, GM3, and
GD3, that would most likely co-cluster with GM1 creating largerclusters from smaller concentrations of GM1.
11,58 Thissomewhat low percolation threshold value is often associatedwith the solid-like and fluid-like domains being asymmetric.59,60
The value for percolation threshold obtained herein describesthe amount of GM1 required to inhibit the movement of amembrane component confined to the mobile phase.Another interesting question addresses the size of these
confining regions at the percolation threshold that perhapscontain membrane proteins vital for cellular function. Single-particle tracking measurements allow for a direct measurementof the confined diameter for each confined particle through theasymptotic value in the root-mean-squared displacement plot.As expected, the confined diameter for the particles in the fluidphase is reduced as more GM1 are added to the bilayer,increasing the surface area of the solid phase. A plot of theaverage confined diameter for the particles versus GM1concentration shows a steeply descending linear trend (seeFigure 7). Extrapolation of this line to the percolation thresholdvalue yields a confined diameter of only 50 nm. Given the largeerror in measuring this value on a per particle basis, the value ofthe confined diameter at the percolation threshold most likely
Figure 6. Plot of percent confined particles vs GM1 concentration,showing a linear trend. It is expected that at the percolation threshold,100% of the particles would show confined behavior, thus thepercolation threshold is defined as the GM1 concentration at 0%randomly diffusing particles. Linear extrapolation (dashed line)through the points reveals a percolation threshold value of 22% GM1.
Figure 7. Plot of confined diameter for the particles exhibitingconfined behavior vs GM1 concentration, showing a linear trend.Linear extrapolation (dashed line) through the points reveals aconfined diameter of only 50 nm at the percolation threshold.
Journal of the American Chemical Society Article
dx.doi.org/10.1021/ja3054095 | J. Am. Chem. Soc. 2012, 134, 15832−1583915837
varies between 0 and 200 nm. Even so, this value is the sameorder of magnitude of membrane protein complexes andindicates a surprisingly restricted fluid phase.The last trend of interest shown in Table 1 is the diffusion
constant values for confined particles decreases with increasingGM1 concentrations. This trend is further illustrated in Figure5A, where the histograms center around smaller values athigher GM1 concentrations. Saxton et al. have calculated thatlateral diffusion in the fluid phase should slow down in a linearfashion as more solid obstacles are added.61 Interestingly, alinearly decreasing trend is observed here, but only for theconfined particles. The randomly diffusing particles, even athigh concentrations of GM1, still show diffusion constantssimilar to those with no GM1 present, possibly indicating thatthe GM1 clusters are not evenly dispersed throughout thebilayers. This notion is also supported by the possibility of anasymmetric distribution of domains suggested by the lowpercolation threshold value. In addition, AFM and fluorescencemicroscopy measurements of GM1 domains in phosphtidylcho-line bilayers made through vesicle fusion also support thisidea.23 The linearly decreasing trend in diffusion coefficientswith increasing concentrations of an immiscible phase has beenobserved previously when the two phases have drasticallydifferent mobilites.62 Thus, the linear trend observed is inagreement with the notion that the GM1 clusters havesubstantially reduced mobility. This is also in agreement withsingle molecule measurements showing that the lipid moleculeswithin GM1 clusters are significantly less mobile.63 For particlesconfined in the fluid phase, as the GM1 concentration isincreased, larger amounts of immobile clusters appear, whichtake up a larger percentage of surface area. In turn, the fluidphase contains a smaller surface area, with each confinedparticle surrounded by an increased solid phase boundary. Theslowed diffusion measured for particles in smaller confinedregions is in agreement with both experimental and theoreticalresults, and supports the existence of a boundary layer aroundthe solid-like obstacles.33,64,65 Thus, the data indicate that theGM1 clusters most likely contain boundary regions in contactwith the fluid phase where diffusion is considerably slower.
■ CONCLUSIONSThis study reports single-particle tracking experiments for goldnanoparticle-labeled SLBs containing increasing concentrationsof GM1. The SLBs used in this paper are a model system for acellular membrane containing many different componentswhose communication relies, to a large degree, on membranefluidity. Upon addition of increasing amounts of GM1 to theSLBs, higher percentages of particles showed confineddiffusion. Since it has been shown that GM1 clusters exist inSLBs containing greater than 5% GM1, our data indicate thatthese particles are most likely confined to the regions betweenGM1 clusters. Values for the diffusion constants for bothrandom and confined particles as well as an estimate of theradius of the confined region are obtained from root-mean-squared displacement plots. The data show that although thediffusion constants for the randomly diffusing particles does notsignificantly change upon addition of GM1, both the diffusionconstants and the confined radius markedly decrease with GM1concentration for the confined particles. One question ofbiological importance is the concentration of GM1 needed toproduce a bilayer in which the fluid phase is no longerinterconnected, resulting in confined behavior for all of itsconstituents, and is referred to as the percolation threshold. A
plot of the percent of randomly diffusing particles versus GM1concentration shows a simple linear trend, which whenextrapolated to 0% randomly diffusing particles gives apercolation threshold value of 22% GM1. When a plot ofconfined diameter versus GM1 concentration is extrapolated tothe value of 22%, it is revealed that the confined diameter of thefluid phase at the percolation threshold is only ∼50 nm. Thus,at the percolation threshold, membrane components in thefluid phase are drastically confined to regions that are the sameorder of magnitude as the membrane proteins themselves.This single-particle tracking study can be expanded to further
explore membrane fluidity and binding interactions using SLBsin which the motion of the nanoparticle and its LPSR spectrumcan be simultaneously monitored. In addition, aggregation ofperipheral membrane components in real time can be studiedthrough both their diffusion trajectories and LSPR spectralfeatures.
■ ASSOCIATED CONTENT*S Supporting InformationDetails on FRAP measurements and various control experi-ments described in the Results section. This material is availablefree of charge via the Internet at http://pubs.acs.org.
■ AUTHOR INFORMATIONCorresponding [email protected] authors declare no competing financial interest.
■ ACKNOWLEDGMENTSR.P.V.D. thanks the National Science Foundation (EEC-0647560, CHE-1025947, HDTRA1-09-1-0007), and P.S.C.thanks the National Institutes of Health (GM070622) forfunding.
■ REFERENCES(1) Cai, D.; Verhey, K. J.; Meyhofer, E. Biophys. J. 2007, 201a−202a.(2) Floyd, D. L.; Ragains, J. R.; Skehel, J. J.; Harrison, S. C.; vanOijen, A. M. Proc. Natl. Acad. Sci. U.S.A. 2008, 105, 15382−15387.(3) Nallathamby, P. D.; Lee, K. J.; Xu, X. H. N. ACS Nano 2008, 2,1371−1380.(4) Saxton, M. J.; Jacobson, K. Annu. Rev. Biophys. Biomol. Struct.1997, 26, 373−399.(5) Garcia-Saez, A. J.; Schwille, P. Biochim. Biophys. Acta-Biomembranes 2010, 1798, 766−776.(6) Wessels, L.; Elting, M. W.; Scimeca, D.; Weninger, K. Biophys. J.2007, 93, 526−538.(7) Brown, F. L. H.; Leitner, D. M.; McCammon, J. A.; Wilson, K. R.Biophys. J. 2000, 78, 2257−2269.(8) Fujiwara, T.; Ritchie, K.; Murakoshi, H.; Jacobson, K.; Kusumi, A.J. Cell Biol. 2002, 157, 1071−1081.(9) Simson, R.; Sheets, E. D.; Jacobson, K. Biophys. J. 1995, 69, 989−993.(10) Day, C. A.; Kenworthy, A. K. Biochim. Biophys. Acta-Biomembranes 2009, 1788, 245−253.(11) Mocchetti, I. Cell. Mol. Life Sci. 2005, 62, 2283−2294.(12) Chen, J. C.; Chang, Y. S.; Wu, S. L.; Chao, D. C.; Chang, C. S.;Li, C. C.; Ho, T. Y.; Hsiang, C. Y. J. Ethnopharmacol. 2007, 113, 233−239.(13) Holmgren, J.; Lonnroth, I.; Mansson, J. E.; Svennerholm, L.Proc. Natl. Acad. Sci. U.S.A. 1975, 72, 2520−2524.(14) Merritt, E. A.; Sarfaty, S.; Vandenakker, F.; Lhoir, C.; Martial, J.A.; Hol, W. G. J. Protein Sci. 1994, 3, 166−175.
Journal of the American Chemical Society Article
dx.doi.org/10.1021/ja3054095 | J. Am. Chem. Soc. 2012, 134, 15832−1583915838
(15) Blank, N.; Schiller, M.; Krienke, S.; Wabnitz, G.; Ho, A. D.;Lorenz, H. M. Immunol. Cell Biol. 2007, 85, 378−382.(16) Yang, T. L.; Baryshnikova, O. K.; Mao, H. B.; Holden, M. A.;Cremer, P. S. J. Am. Chem. Soc. 2003, 125, 4779−4784.(17) MacKenzie, C. R.; Hirama, T.; Lee, K. K.; Altman, E.; Young, N.M. J. Biol. Chem. 1997, 272, 5533−5538.(18) Lencer, W. I.; Chu, S. H. W.; Walker, W. A. Infect. Immun. 1987,55, 3126−3130.(19) Shi, J. J.; Yang, T. L.; Kataoka, S.; Zhang, Y. J.; Diaz, A. J.;Cremer, P. S. J. Am. Chem. Soc. 2007, 129, 5954−5961.(20) Reed, R. A.; Shipley, G. G. Biophys. J. 1996, 70, 1363−1372.(21) Thompson, T. E.; Allietta, M.; Brown, R. E.; Johnson, M. L.;Tillack, T. W. Biochim. Biophys. Acta 1985, 817, 229−237.(22) Wang, R.; Shi, J.; Parikh, A. N.; Shreve, A. P.; Chen, L. H.;Swanson, B. I. Colloids Surf. B-Biointerfaces 2004, 33, 45−51.(23) Yuan, C. B.; Johnston, L. J. Biophys. J. 2001, 81, 1059−1069.(24) Korade, Z.; Kenworthy, A. K. Neuropharmacology 2008, 55,1265−1273.(25) Pike, L. J. J. Lipid Res. 2009, 50, S323−S328.(26) Simons, K.; Ikonen, E. Nature 1997, 387, 569−572.(27) Kaiser, H. J.; Lingwood, D.; Levental, I.; Sampaio, J. L.;Kalvodova, L.; Rajendran, L.; Simons, K. Proc. Natl. Acad. Sci. U.S.A.2009, 106, 16645−16650.(28) Kahya, N.; Scherfeld, D.; Bacia, K.; Poolman, B.; Schwille, P. J.Biol. Chem. 2003, 278, 28109−28115.(29) Vaz, W. L. C.; Melo, E. C. C.; Thompson, T. E. Biophys. J. 1989,56, 869−876.(30) Almeida, P. F. F.; Vaz, W. L. C.; Thompson, T. E. Biochemistry1992, 31, 7198−7210.(31) Vist, M. R.; Davis, J. H. Biochemistry 1990, 29, 451−464.(32) Sankaram, M. B.; Thompson, T. E. Proc. Natl. Acad. Sci. U.S.A.1991, 88, 8686−8690.(33) Almeida, P. F. F.; Vaz, W. L. C.; Thompson, T. E. Biochemistry1992, 31, 6739−6747.(34) Vaz, W. L. C.; Almeida, P. F. F. Curr. Opin. Struct. Biol. 1993, 3,482−488.(35) Brian, A. A.; Mcconnell, H. M. Proc. Natl. Acad. Sci. U.S.A.-Biol.Sci. 1984, 81, 6159−6163.(36) Cremer, P. S.; Groves, J. T.; Kung, L. A.; Boxer, S. G. Langmuir1999, 15, 3893−3896.(37) Axelrod, D.; Koppel, D. E.; Schlessinger, J.; Elson, E.; Webb, W.W. Biophys. J. 1976, 16, 1055−1069.(38) Yildiz, A.; Forkey, J. N.; McKinney, S. A.; Ha, T.; Goldman, Y.E.; Selvin, P. R. Science 2003, 300, 2061−2065.(39) Bingham, J. M.; Willets, K. A.; Shah, N. C.; Andrews, D. Q.; VanDuyne, R. P. J. Phys. Chem. C 2009, 113, 16839−16842.(40) Willets, K. A.; Van Duyne, R. P. Annu. Rev. Phys. Chem. 2007,58, 267−297.(41) Sagle, L. B.; Ruvuna, L. K.; Ruemmele, J. A.; Van Duyne, R. P.Nanomedicine 2011, 6, 1447−1462.(42) Lee, G. M.; Ishihara, A.; Jacobson, K. A. Proc. Natl. Acad. Sci.U.S.A. 1991, 88, 6274−6278.(43) Sheets, E. D.; Lee, G. M.; Simson, R.; Jacobson, K. Biochemistry1997, 36, 12449−12458.(44) Pinaud, F.; Michalet, X.; Iyer, G.; Margeat, E.; Moore, H. P.;Weiss, S. Traffic 2009, 10, 691−712.(45) Coban, O.; Burger, M.; Laliberte, M.; Ianoul, A.; Johnston, L. J.Langmuir 2007, 23, 6704−6711.(46) Hancock, J. F. Nat. Rev. Mol. Cell Biol. 2006, 7, 456−462.(47) Wu, S. H. W.; Mcconnell, H. M. Biochemistry 1975, 14, 847−854.(48) Simons, K.; Vaz, W. L. C. Annu. Rev. Biophys. Biomol. Struct.2004, 33, 269−295.(49) Burns, A. R.; Frankel, D. J.; Buranda, T. Biophys. J. 2005, 89,1081−1093.(50) Rietveld, A.; Simons, K. Biochim. Biophys. Acta-Rev. Biomem-branes 1998, 1376, 467−479.(51) Morris, J. E.; Coutts, T. J. Thin Solid Films 1977, 47, 3−65.
(52) Bar, L. K.; Barenholz, Y.; Thompson, T. E. Biochemistry 1997,36, 2507−2516.(53) Schram, V.; Lin, H. N.; Thompson, T. E. Biophys. J. 1996, 71,1811−1822.(54) Saqr, H. E.; Omran, O.; Dasgupta, S.; Yu, R. K.; Oblinger, J. L.;Yates, A. J. J. Neurochem. 2006, 96, 1301−1314.(55) Shreve, A. P.; Howland, M. C.; Sapuri-Butti, A. R.; Allen, T. W.;Parikh, A. N. Langmuir 2008, 24, 13250−13253.(56) Kasbauer, M.; Junglas, M.; Bayerl, T. M. Biophys. J. 1999, 76,2600−2605.(57) Klymchenko, A. S.; Duportail, G.; Demchenko, A. P.; Mely, Y.Biophys. J. 2004, 86, 2929−2941.(58) Livingston, P. O.; Ritter, G.; Calves, M. J. Cancer Immunol.Immun. 1989, 29, 179−184.(59) Xia, W.; Thorpe, M. F. Phys. Rev. A 1988, 38, 2650−2656.(60) Garboczi, E. J.; Thorpe, M. F.; Devries, M. S.; Day, A. R. Phys.Rev. A 1991, 43, 6473−6482.(61) Saxton, M. J. Biophys. J. 1982, 39, 165−173.(62) Saxton, M. J. Biophys. J. 1987, 52, 989−997.(63) Lagerholm, B. C.; Weinreb, G. E.; Jacobson, K.; Thompson, N.L. Annu. Rev. Phys. Chem. 2005, 56, 309−336.(64) Saxton, M. J. Biophys. J. 1989, 56, 615−622.(65) Blackwell, M. F.; Whitmarsh, J. Biophys. J. 1990, 58, 1259−1271.
Journal of the American Chemical Society Article
dx.doi.org/10.1021/ja3054095 | J. Am. Chem. Soc. 2012, 134, 15832−1583915839