research article research on methods for...
TRANSCRIPT
Research ArticleResearch on Methods for Discovering and Selecting CloudInfrastructure Services Based on Feature Modeling
Huamin Zhu Lifa Wu Kangyu Huang and Zhenji Zhou
Institute of Command Information System PLA University of Science and Technology Nanjing China
Correspondence should be addressed to Lifa Wu wulifavip163com
Received 15 December 2015 Revised 24 July 2016 Accepted 24 August 2016
Academic Editor Zhimin Huang
Copyright copy 2016 Huamin Zhu et al This is an open access article distributed under the Creative Commons Attribution Licensewhich permits unrestricted use distribution and reproduction in any medium provided the original work is properly cited
Nowadays more and more cloud infrastructure service providers are providing large numbers of service instances which are acombination of diversified resources such as computing storage and network However for cloud infrastructure services the lackof a description standard and the inadequate research of systematic discovery and selection methods have exposed difficulties indiscovering and choosing services for users First considering the highly configurable properties of a cloud infrastructure servicethe feature model method is used to describe such a service Second based on the description of the cloud infrastructure service asystematic discovery and selection method for cloud infrastructure services are proposedThe automatic analysis techniques of thefeature model are introduced to verify the modelrsquos validity and to perform the matching of the service and demandmodels Finallywe determine the critical decision metrics and their corresponding measurement methods for cloud infrastructure services wherethe subjective and objective weighting results are combined to determine the weights of the decision metrics The best matchinginstances from various providers are then ranked by their comprehensive evaluations Experimental results show that the proposedmethods can effectively improve the accuracy and efficiency of cloud infrastructure service discovery and selection
1 Introduction
The Infrastructure as a Service (IaaS) is an important servicemodel in cloud computing and it can provide users withfundamental computing resources for example processingstorage and network where users are able to deploy thedesired operating systems and applications without payingattention to the management and control of the underlyingcloud infrastructure [1] IaaS is provided to users by a serviceinstance that may be a different combination of processingstorage and network resources that satisfies the diversifiedneeds of the users Cloud computing with potentially hugebusiness opportunities has attracted a growing number of ITservice providers to build infrastructures that can providedozens hundreds or even tens of thousands of IaaS instancesCurrently there are over 100 public IaaS providers and justfor Amazonrsquos Elastic Compute Cloud (EC2) the number ofservice instances is over 16000 [2] How to select the best IaaSinstance from these large numbers of alternatives has becomea serious challenge to users
Different IaaSs showdifferences in resource configurationand service quality and thus the discovery and selection ofthe IaaS instances not only need to perform fine-grainedmatching on the resource configuration according to userneeds but also need to find the optimal instance based oncomparison of the quality of service (QoS) of the matchinginstances It is obviously a difficult and error-prone task tosearch thematching instances in the huge configuration spaceof an IaaS which necessitate automatic searching methods tosupport it Moreover a set of scientific QoS metrics and aneffective multicriterion decision-making method for rankingthe matching instances are also needed At present althoughmany scholars have done extensive research on the discoveryand selection of IaaSs [3ndash10] the following challenges remain(1) There exists a lack of customized description methodsfor IaaSs and the prevalent natural language descriptioncannot be used for automatic processing by computers (2)The existing methods are unable to describe or formalizethe configuration space of an IaaS completely thus thesemethods can only handle a subset of the entire configuration
Hindawi Publishing CorporationMathematical Problems in EngineeringVolume 2016 Article ID 8194832 19 pageshttpdxdoiorg10115520168194832
2 Mathematical Problems in Engineering
spaces when discovering and selecting an IaaS which resultsin a suboptimal service instance (3) Due to the existingcoarse-grained description of IaaSs the matching betweenthe user request and the IaaS offerings can only be done ina coarse-grained way so that some service details such ascost cannot be accurately calculated (4) Also lacking aresystematic theory and method for describing discoveringand selecting IaaSs (5) There is no scientific and unifiedmeasurement metric system for the QoS evaluation of IaaSsThe existing IaaS decision-making methods assign metricweight mainly based on the subjective weighting methodwhich is likely to lead to an inaccurate evaluation of QoS
From the above analysis it is not difficult to see that theformalization and fine-grained description of the completeconfiguration space of an IaaS is the key to discoveringand selecting a truly optimal IaaS instance In general theconfiguration space of an IaaS comprises a large numberof service instances and there are two ways of providingIaaS instances The first is to provide great many standardinstances from which users can choose for example in EC2there are m4large c3large and r3xlarge instances of thevirtual server and each instance has some basic options withfixed values aswell as some configurable options for examplem4large (24GHz Intel Processor 2 vCPU 8GB RAM EBS-only 450Mbps bandwidth) has configurable location costmodel and operating system (OS) options [11] The secondway of providing an IaaS instance is to specify the value rangeof the configurable options and any combination of all theoption values within the range is an IaaS instance There aresome configurable service options in an IaaS using eitherapproach such as virtual machine (VM) type RAM OS costmodel location network bandwidth and any combination ofthese options is an IaaS instance such that all the instancesform the complete configuration space Therefore an IaaScan be regarded as a variability-intensive system and itis pivotal to deal with the variability of an IaaS to fullyobtain the fine-grained description of its entire configurationspace
Kang et al [12] proposed a feature-oriented domain anal-ysis method (FODA) in 1990 Here features and the featuremodel (FM) are first introduced to capture and organizechanging software requirements in special fields [13] In aFM features are used to represent the system functionaland nonfunctional characteristics and feature relations areused to depict the organizational structure and internalrelations of these characteristics Such an ldquoentity-relationrdquodescription structure in a FM exhibits highly customizableproperties which has led FMs to become a very effectivedomain commonalityvariability description method Withthe continuous development of software reuse research FMshave become the de facto standard for software product linecommonalityvariability modeling and they can be used asa good description model for variability-intensive systems[14 15] Therefore it is very appropriate to use a FM todescribe an IaaS In this paper we design a formal descriptionmethod for IaaSs bymeans of featuremodeling and propose asystematic discovery and selectionmethod for IaaSs based onthe descriptionmethodThemain contributions in this paperare as follows
(i) A formal IaaS description method based on FMsis designed which is able to describe the completeconfiguration space of an IaaS in a standard wayWe define the metamodel of an IaaS using theunified modeling language (UML) on the basis ofexisting methods and then define the IaaS domainmodel based on the metamodel and the IaaS domainknowledge Next we present themethods for creatingservice and demand models based on the metamodeland the domain model In addition an equivalentconcept ontology of IaaS FMs is also given to copewith the heterogeneous expressions in different FMs
(ii) Based on the designed IaaS description model wepropose a method to realize the automatic process ofdiscovery and selection of the best IaaS instance Theautomatic analysis techniques of a FM are introducedto extract the service configuration information in theFM check the validity of an IaaS FM and performthe searching for the matching IaaS instance based onuser needs
(iii) The important nonfunctional metrics and their mea-surement methods for IaaSs are studied and deter-mined and the metrics weighting method basedon the combination of the subjective and objec-tive weights is proposed which makes the weight-assignment process of the decision metrics more rea-sonable The multicriteria decision-making methodfor the matching IaaS instances is also introduced
The remainder of this paper is organized as followsSection 2 describes related work Section 3 presents theformal IaaS description method based on FMs Section 4introduces the proposed discovery and selection method ofIaaSs Section 5 describes the automatic analysis techniquesand thematchingmethod of IaaS FMs Section 6 presents themethod of ranking IaaSs Section 7 presents an experimentto evaluate the feasibility and effectiveness of the methodsintroduced in this paper Finally the last section concludesthe paper and proposes future work
2 Related Work
In addition to lots of studies there are some commercialservices to support the discovery and selection of IaaSsAmazon [16] and RackSpace [17] provide exclusive IaaSconfiguration platforms to support comparisons betweentheir own different service instances CloudScreener [18]CloudHarmony [2] Cloudorado [19] and PlanForCloud [20]are able to provide a commercial service for the configurationand comparison of IaaS instances but they can only coverthe main IaaS providers and can only support comparisonsof a specified QoS metric such as fee Research also indicatesthat the recommended results from the commercial servicesor platforms are sometimes suboptimal [21] In academicresearches the related methods for discovering and selectingan IaaS can be divided into the following categories
(1) Semantic-Technique-Based Description and MatchingMethods for IaaSs Dastjerdi et al [3] used the web service
Mathematical Problems in Engineering 3
modeling ontology (WSMO) as the description model ofvirtual appliances and virtual units in cloud computing andpresented the semantic matching method of the supply anddemand on IaaSs Zhang et al [22] created an IaaS knowledgeontology including functional and nonfunctional conceptsattributes and relationships among them and proposed asemantic search model for heterogeneous IaaSs Rodrıguez-Garcıa et al [4] created semantic IaaS service vectors byimplementing text processing and adding semantics to theIaaS description and then sorted the IaaSs according to theresults of semantic matching on IaaS service vectors anduser demands A similar method was given in [23] Liu etal [24] created an IaaS function ontology and presentedthe semantic matching method of IaaSs and the method ofselecting IaaSs based on the QoS metrics Kang and Sim [5]created a cloud service ontology and presented the semanticmatching method of IaaSs from three aspects includingthe concept the object attributes of concepts and the dataattributes of concepts The above studies described IaaSsand performed the matching of supply and demand onIaaSs by means of semantic technologies used commonly intraditional web services Although these approaches can dealwell with the heterogeneous descriptions of IaaSs they canonly describe the static IaaS information and cannot dealwith the numerical service parameters and structured serviceinformation thus the IaaS configuration space cannot beaccurately and completely described Under this conditionthe discovery method based on the semantic matching canonly be match to providers and cannot be matched to specificIaaS instances making it difficult to accurately obtain thereal optimal IaaS instance In this paper we use a FM todescribe an IaaS in a structured complete and accuratemanner and then use the automatic analysis techniques of aFM to search the matching instances of an IaaS so that a realoptimal solution can be obtained
(2) QoS-Evaluation-Based IaaS Selection Method The CloudService Measurement Index Consortium (CSMIC) ofCarnegie Mellon University [25] presented a service meas-urement index for evaluating and comparing cloud servicesin general including the accountability agility cost per-formance assurance security privacy and usability Garg etal [6] developed 15 evaluation metrics for IaaSs by selectingand refining the CSMIC index and used these metrics toevaluate the IaaS QoS by means of the AHP However somemetric measurement methods given by them are not feasibleand the AHP can only deal with a small amount of alternativeIaaS instances Li et al [7] divided the QoS metrics of IaaSsinto three categories performance economy and securityand then designed the corresponding evaluation metrics forcomputing services storage services and comprehensiveservices They provided some good metric directories forevaluating the IaaS QoS but the security measurement wastoo simple In [6 26] the authors determined the weightsof QoS metrics only according to the subjective comparisonand judgment and thus it is hard to guarantee the objectivityof evaluations of the IaaS QoS In this paper we evaluatethe IaaS security in a systematic and objective manner andpresent a combination weighting method by which the
weight distribution can not only be more objective but alsoreflect the subjective preference of decision makers
(3) FM-Based IaaS Description and Selection Methods Wit-tern et al [8] proposed a method of selecting an IaaSbased on variability modeling However the authors onlygave a very simple domain model and did not provide amethod of coping with the heterogeneous expressions ofIaaSs Garcıa-Galan et al [9] also proposed the use of a FMto describe an IaaS The authors took EC2 as an exampleto introduce the specific methods of creating an IaaS FMQuinton et al [14] introduced attributes to extend a BooleanFM and then used the extended FM to describe an IaaSThe authors also defined a domain knowledge ontology tocope with the heterogeneous expressions in FMs Finallythey realized the automatic IaaS configuration Garcıa-Galanet al [10] proposed a method founded on software productline to configure the Amazon IaaS The authors describedthe Amazon EC2 EBS S3 and RDS services by means ofFMs and used an offline solver to find the most appro-priate configuration instance Dougherty et al [27] alsodescribed an IaaS as a FM They used ldquofeaturerdquo to representthe main functional units and ldquoattributerdquo to represent theenergy consumption of each functional unit Their goal is toautomate the IaaS configuration in the most energy-efficientand economical way However in [9 10 14 27] the authorsdid not present a standardized definition for the IaaS FMand thus the universally applicable methods of creating IaaSservice and demand models could not be achieved Witternand Zirpins [28] only provided a general conceptual FMadapted to various web services without considering thespecial requirements of IaaSs In this paper we define themetamodel and the domainmodel for IaaSs in a standardizedmanner and provide the general method for creating the IaaSservice and demand models and then propose the automaticdiscovery and selection methods of IaaSs based on them
3 Feature-Model-Based IaaSDescription Method
31 Feature Model Basics FMs are treelike data structureswhere each node represents a product feature and the edgebetween two nodes represents the relationship between thecorresponding features The root of a FM represents thedomain object that is described Features are bound bymeansof vertical and cross-tree relationships which define howfeatures can be grouped in a product The father featureand its child features are usually constrained by mandatoryoptional or cardinality vertical relationships and the cross-tree relations mainly include REQUIRES and EXCLUDES[13 15] In a FM features can represent specific functionalor nonfunctional characteristics of a demand service com-ponent or platform and so forth and can also be used asabstract features that represent domain decisions such asLinux-based features The mandatory relationship betweenthe father feature and its childrenmeans that the child featuremust be selected when its parent feature is selected whilethe optional relationship between them means that the child
4 Mathematical Problems in Engineering
feature can be selected or not selected when its father featureis selected In addition cardinality is primarily used to definethe range of the child features that can be selected whentheir parent feature is selected A FM that only containsfeatures and feature relationships is called a Boolean FM ABoolean FM can be extended as an attributed FM by defin-ing feature attributes which can represent more complexdomain requirements and product models All functionaland nonfunctional property parameters of a product can bedescribed as feature attributes For an attributed FM productcustomization can be realized by feature selection attributeassignment and the definition of constraint relationshipsamong the selected features and their attributes A correctand reasonable FM should be able to completely describethe product configuration space and any semantic conflictsshould not exist in all defined relationships
32 Feature Modeling Method for IaaSs The goal of IaaSfeaturemodeling is to describe IaaSs and user demands for anIaaS effectively and accurately We first define the metamodelof an IaaS to regulate the concepts in IaaS FMs and therelations among these concepts in a standardized mannerin order to provide the grammar fundamentals for creatingIaaS FMs Then we define the domain model of an IaaSbased on the metamodel and the IaaS domain knowledgeThe advanced and abstract characteristics of an IaaS areclassified and unified by the domain model which providesthe conceptual basis for establishing IaaS FMs Finally thespecific methods of creating the IaaS service and demandmodels are presented
321 Metamodel First the metamodel of an IaaS is definedusing UML as illustrated in Figure 1 A metamodel is adescription model of the model which is the semanticdescription of the concepts and concept relationships in themodel The defined metamodel mainly includes three kindsof concepts features attributes and relationships
The main functional and nonfunctional characteristicsof an IaaS instance are defined as features such as VMOS location and cost model Features can be dividedinto a root feature group features and solitary featuresaccording to their organizational structures Features canalso be divided into a root feature abstract features andleaf features according to the feature abstract level Amongthese leaf features represent the most specific functional ornonfunctional characteristics Feature group is an abstractfeature used to accommodate the group features of the sametype and it can be the child of a solitary feature or anotherfeature group Features in the feature group are called groupfeatures which are used to represent a series of features withcommon characteristics For example an OS feature groupmay contain two group features Windows and Linux All thefeatures that are not included in the feature group are calledsolitary features which are used to describe the relativelysimple object characteristics A solitary feature can be usedas a feature group containing a series of group features asits children For instance OS is a solitary feature whichcontains WINDOWS LINUX and other group features as
its children Solitary features can be defined as mandatory oroptional type while feature cardinality is defined to constrainthe range of group features that can be selected at the sametime Abstract feature and leaf feature and group feature andsolitary feature are two independent feature classificationswhich means that not only can abstract feature and leaffeature be defined as group feature or solitary feature butgroup feature and solitary feature can also be defined asabstract feature or leaf feature
The second kind of main concept in the metamodel isfeature relationship which is divided into two categoriesThefirst is the refinement relationships in the vertical directionof the feature tree that is features are gradually refined(including decomposition specialization and characteriza-tion) from the root feature down to the leaf features andthe features between the root and the leaves represent thedifferent abstract levels of characteristics Each IaaS instancersquosconfiguration options must be refined to leaf features Thesecond is the horizontal cross-tree constraint relationshipswhich mainly contain three kinds of relationships namelyREQUIRES EXCLUDES and COMPLEX CONSTRAINTSThe cross-tree constraints are generally used to describe theconstraint relationships among the features of different cate-gories and their attributes in an IaaS instance configurationfor example price features are commonly constrained bylocation features (eg the prices of IaaS instances in Asiaand North American are likely to be different) The thirdkind of main concept in the metamodel is feature attributewhich is usually used to describe the common propertiesof IaaS functions or nonfunctional characteristics such asthe numbers of vCPU memory and hard disk capacity Bydefining the constraint relationships among the features andtheir attributes we can accurately describe the configurationoptions of an IaaS instance Several important definitions inthe metamodel are as follows
Definition 1 (FEATURE GROUP CARDINALITY) Assum-ing that 0 le 119899 le 119899
1015840le 119896 where 119899 1198991015840 and 119896 are nonnegative
integers and 119896 is the number of all group features we define⟨119899 minus 119899
1015840⟩ as a feature group cardinality in which 119899 is thelower bound and 1198991015840 is the upper bound and ⟨119899 minus 1198991015840⟩ meansthat when the feature group is selected at least 119899 groupfeatures must be selected simultaneously while at most 1198991015840group features can be selected simultaneously
Definition 2 (REQUIRES) Assuming that features A and Bare from the same FM if feature A is selected at any time itmeans that feature B is selected simultaneously and then wesay that feature A REQUIRES feature B
Definition 3 (EXCLUDES) Assuming that features A and Bare from the same FM if feature A is selected at any time itmeans that feature B is not selected simultaneously and thenwe say that feature A EXCLUDES feature B
Definition 4 (COMPLEX CONSTRAINTS) By means ofarithmetic symbols such as + minus lowast and mod and rela-tionship symbols such as gt gt= lt= lt == and = andlogical symbols such asANDORNOT IMPLIES and IFF (if
Mathematical Problems in Engineering 5
1
1
+CardinalityGroupedfeature
+optional
Solitaryfeature
1
1
1
1
1
22
1
REQUIRES
EXCLUDES
ComplexContraint
Decomposition
Specialization
Characterization
Constraints
Relationship
Refine
Leaffeature
Abstractfeature
Rootfeature
Attribute
FeatureGroupFeature
nameDescription
lowast
lowast
lowast
lowast
lowastlowast
Figure 1 Metamodel of an IaaS
only if) we can associate certain features with certain featureattributes in the FM to form a variety of logical expressionswhich are used to describe a particular relationship thatmust be met among these features and feature attributes Wecall this type of relationship among the features and featureattributes COMPLEX CONSTRAINTS
In summary we perform a design of the metamodelthat provides the grammar supports for creating a structuredIaaS FM We give the definition of the feature attributerelation and other key concepts in an IaaS FM In additionwe introduce the roles and usage of various features and alsodescribe the vertical refinement relations and the cross-treeconstraints in an IaaS FM
322 Domain Model Because the current IaaS descriptionhas no uniform information structure and terminology theinformation structure and terminology of IaaS FMs willappear random if they are created relying only on the syntaxbasis of the metamodel Thus it will be difficult to performthe matching of the IaaS service and demand models Infact there is a consistent functional and nonfunctionalcharacteristics category existing in IaaSs Therefore an IaaSdomain model is created based on the metamodel and theIaaS field knowledge so as to unify IaaS FMsrsquo informationstructure and terminology The domain model classifies andregulates the advanced and abstract features of IaaSs anddefines all necessary attributes thus providing a conceptualbasis for the creation of IaaS FMs The major structure ofthe domain model is illustrated in Figure 2 A summary ofimportant attributes of the main IaaS features is shown asTable 1
The definition of the domainmodel follows the principlesbelow first those features and feature directories that aremore definite and widely recognized should be included ascompletely as possible as such based on the domain modelthe IaaS service and demandmodels can be created in a moreunified and consistent structural form Second it is necessaryto avoid too much refinement of the abstract features thatmay have a variety of representations so as to meet the actualneeds for describing IaaSs Third the important commonattributes of the IaaS function characteristics should be
Table 1 Summary of important attributes of the main IaaS features
Feature Attribute Type Remarks
IaaS
periodcost real Periodic costavailability realsecuritylevel real Security levelnetdelay int Network latency
VM
HDD string Solid state or magneticmemory real
SPECCPU2006 int CPU benchmark valuescaling latency int Scaling resource latency
LoadBalancer costmonth real Cost per monthnum int Load balancer number
Networkavailability realsupportipv6 bool Support for IPv6estimatetraffic real Estimate traffic per month
Storage availability realpersistence real Storage persistence
Freetraffic freelimit real Free traffic per monthextraprice real Extra traffic price
defined in a uniform manner because these attributes willbe the main parameters that are evaluated and comparedwhen performing the supply and demand matching andhorizontal comparison of IaaSs Fourth the domain modelshould maintain good extensibility because of the constantlydevelopment and updating of IaaSs in cloud computing
323 Service Model As an example Figure 3 illustrates themajor structure of the created IaaS service model fromDigitalOcean [29] Based on the metamodel and the domainmodel defined above the service model of an IaaS canbe created to represent the actual IaaS offerings The keypoints of creating an IaaS service model are as followsfirst select features from the domain model and refine theabstract features among them according to the original IaaSdescription Second because the service model has inheritedall the attributes of the related features in the domain modelit only needs to select the required feature attributes to specify
6 Mathematical Problems in Engineering
IaaS
OS
Windows
Linux
MaxOS
VM
Instance 1
Instance 2
Instance n
Network
Freetraffic
Ladderprice
Bybandwidth
Ladder 1
Ladder 2
Ladder n
Loadbalancer
Storage
RDS
NoSQL
CDN
ObjectStorage
Purchase
Hour
Month
Year
Twoyear
Threeyear
Loctaion
Asia
Europe
Oceania
SouthAmerica
NorthAmerica
Africa
Region 1
Region 2
Region n
CentOS
Ubuntu
Debian
RedHat
periodcostavailabiltysecuritylevelelasticitynetdelay
availabiltiythroughoutsupportipv6costestimatetraffic
memoryvCPUHDD SSDNoSSDHDDcapabilitycosthourcostmonthcostyearavailabiltiySPECCPU2006num
availabiltycosthourcostmonthcostyearpersistence
availabiltycosthourcostmonthcostyearnum
freelimitextraprice
middot middot middot
middot middot middot
middot middot middot⟨0-1⟩
⟨0-1⟩
⟨1-1⟩
⟨1-1⟩
⟨1-1⟩
⟨1-1⟩
⟨1-1⟩
⟨1-1⟩
⟨1-1⟩
Figure 2 Major structure of the IaaS domain model
their value ranges Finally the entire IaaS configuration spaceis described by defining many COMPLEX CONSTRAINTSand in general each of the COMPLEX CONSTRAINTS canrepresent an IaaS configuration instance These COMPLEXCONSTRAINTS are included in the plain-text file of the IaaSservice model see Section 713 for details
324 DemandModel Figure 4 illustrates themajor structureof a demand model for computing services The demandmodel is used to describe user needs in an IaaS which iscreated by using a similar method of creating the IaaS servicemodel Similarly the first thing that should be done is toselect features from the domainmodel and refine the abstractfeatures among them according to user needs The demandmodel has also inherited all the attributes of the relatedfeatures in the domain model It is also necessary to selectthe required feature attributes to specify their values or valueranges The demand model represents a minimum of servicerequirements meaning that the IaaS instances satisfying userneeds usually number more than one Therefore when the
IaaS supply and demand matching is completed choosingthe best IaaS instance is required For example when it isnecessary to optimize service cost we can select the IaaSinstance satisfying user needs that has the minimum cost
33 Concept Ontology of IaaS FMs While the domain modelhas achieved a unified classification and specification of theadvanced and abstract features in IaaS FMs it is still necessaryto refine the abstract features into the leaf features in theprocess of creating an IaaS FM which may lead to the use ofdifferent terms to represent the same concept for examplegiven geographical region feature the terms ldquoregionrdquo orldquolocationrdquomay be used in different IaaS FMs In order tomakeall IaaS FMs mutually ldquounderstoodrdquo so that matching theIaaS supply and demand can be carried out we have createdan IaaS concept ontology to realize the mutual mapping ofequivalent feature concepts some parts of this are illustratedin Figure 5 The concepts of ldquoVMrdquo and ldquoVirtualmachinerdquoldquoRegionrdquo and ldquoLocationrdquo ldquoWindowserver 2003rdquo and ldquoWin-dowsServer2003rdquo and ldquoLadderpricerdquo and ldquoMultilevelpricerdquo
Mathematical Problems in Engineering 7
DigitalOceanServer
OSLinux
VM
Server 0
Network Freetraffic
Loadbalancer
Purchase
Hour
Month
Loctaion
Asia
Europe
NorthAmerica
Singapore
Amsterdam
CentOS
Ubuntu
Debian
Fedora
securitylevel01307
availabiltiy 09999supportipv6 1
HDD SSDavailabiltiy 09999
availabilty 09999costhour 002costmonth 15
CoreOS
FreeBSD
London
Frankfurt
NewYork
Francisco
Server 1G
Server 16 GServer 8 G
Server 48G
5G
Server 64 G
Server 4 G
Server 32G
Server 2 G
⟨1-1⟩
⟨1-1⟩
⟨1-1⟩
⟨1-1⟩⟨1-1⟩⟨1-1⟩
extraprice 2centG
Figure 3 Major structure of the DigitalOceanServer service model
IaaSRequest
OS Linux
VM
Network
Purchase Month
Loctaion Asia
CentOS
Supportipv6 1
vCPU 2HDD SSD
num 2
Loadbalancer
num 1
HDDcapability 30 G
memory 2G
estimatetraffic 2 TB
Figure 4 Major structure of an IaaS demand model
are all equivalent In addition it should be noted that thedomain model has unified and defined all important featureattributes considering the consistency of the IaaS featureattributes therefore when the IaaS FMs are created it mustbe done using the unified feature attributes specified by thedomain model
34 Characteristics Analysis of the Description Method Firstit is not difficult to create and maintain an IaaS FM withthe metamodel and domain model acting as the grammaticaland concept bases Graphical tools or customized machinelanguages can be developed to create and edit an IaaS FMSecond our IaaS description method has good extensibilityand compatibility and can continuously update the domainmodel to improve the conceptual repository according tothe development of IaaSs The concept ontology of IaaSFMs acts as the bridge between the different terms with thesame meaning in different IaaS FMs Finally the metamodel
provides strict grammatical norms for the creation of an IaaSFM and this paper will check the validity of an IaaS FMbasedon the automatic analysis operations of a FM (see Section 51)
4 IaaS Discovery and Selection Method
Based on the formal IaaS description presented in Section 3we propose a systematic discovery and selection methodfor IaaSs An architecture of the system implementing themethod is designed as Figure 6
Four roles are managed in the architecture User BrokerIaaS Provider and MTCCAs (cloud service monitoring test-ing certificating and comparing agencies)The IaaS Providerusually publishes the IaaS service information on its portalwebsite and sometimes chooses to perform a service certi-fication or registration via MTCCAs For example the IaaSProvider may submit a security assessment report or performa security certification in Cloud Security Alliance [30] (CSA)
8 Mathematical Problems in Engineering
IaaS
Region
Virtualmachine
OS
Network
Loadbalancer
Purchase
Storage
VM
Location
Linux
Windows
MaxOS
Ladderprice
Bybandwidth
is-a
Freetraffic
Windowserver_2003WindowServer2003
WindowServer2008
Windowserver_2008
Multilevelprice
is-ais-
a
is-a
is-ais-a
is-ais-a
is-a
is-ais-ais-a
is-ais-a
is-a
is-a
is-ais-ais-a
is-ais-a
is-a
is-ais-ais-
a
is-ais-a
is-a
is-a
is-a
Figure 5 Concept ontology of IaaS FMs
Define demand model
Metamodel Domain model
User
Map all feature concepts in demand model
Service models Createservicemodels
Conceptontology
IaaS providers
MTCCA
Match the IaaS FMs
Domain modelGenerate the configuration input
Analyze service model search forthe best matching instance
Indicator weights
The number of the best matching
Calculate objective weights
Assign subjective weights
Perform combination
weighting
Sort the best matching instancesReturn the sorting result
Return failure No
YesNonfunc index
Output the best matching instances
Success
Match servicemodels one by one
Service discoveryService sorting
Broker
I Sinstances ge1
Figure 6 Architecture of the discovery and selection system of IaaSs
MTCCAs such as CloudHarmony CloudScreener CSA andCloudorado mainly perform the monitoring performancetesting security certification or synthetic comparison ofcloud services The entirety of IaaS service information canbe obtained by combining the IaaS information from theprovider portal and the information fromMTCCAsThe userneeds to create and submit the IaaS demand model and per-form the subjective weighting for important nonfunctionalmetrics The Broker is used as the functional core of thearchitecture
The Brokerrsquos main functions are divided into two partsservice discovery and service ranking Regarding servicediscovery the Broker first needs to regularly maintain theIaaS domain model based on the IaaS domain knowledge
by adding new features and feature directories Second theBroker uses the IaaS related information from the IaaSProviders and MTCCAs to create the IaaS service modelsThe Broker is also responsible for the regular maintenanceof the concept ontology of IaaS FMs Finally the Brokertakes the user demand model the concept ontology and theIaaS service models as the inputs of the IaaS FM matchingmodule
Thematching of supply and demand on IaaS FMs consistsmainly of two steps The first step is to map the featureconcepts in the demand model into the feature concepts inthe current IaaS service model If the related concepts cannotbe completely mapped successfully the matching processwill proceed to the next IaaS service model to continue If
Mathematical Problems in Engineering 9
the mapping is successful all the feature concepts in thedemandmodel are converted into the feature concepts in thisIaaS service FM and then the IaaS demand configurationsuitable for this service FM can be generated according tothe user demand model The second step is to search forthe best matching instance by automatically analyzing thecurrent service model If no instances satisfying user needsare searched the matching of supply and demand on thecurrent IaaS service model fails Otherwise it needs to findthe best one from the IaaS configuration instances satisfyinguser needs by optimizing the cost and then terminate thematching process on the current IaaS service model andproceed to the next IaaS service model to continue until thematching with all IaaS service models is completed Finallythe IaaS FM matching module returns all the best matchinginstances as the output resultsThis service discoverymethodwill be detailed in Section 5
Another main function of the Broker is to rank all thebest matching instances If the number of the best matchinginstances returned by the IaaS FM matching module is 0it shows that there is no IaaS instance satisfying the userdemand and then failure information will be returned Ifthe number is 1 then the single instance will be returneddirectly When the number exceeds 1 the system will auto-matically start the next stage namely service sorting Thesorting process takes the critical nonfunctional metric setand the metric weight vectors as inputs and sorts all thebest matching instances by calculating their comprehen-sive evaluations Finally the ranking list is delivered tothe user This service sorting method will be detailed inSection 6
5 Automated Analysis andMatching of IaaS FMs
FMs unify the descriptions of the IaaS services and demandswhich paves the way for automated IaaS discovery IaaSdiscovery is the process of searching for the IaaS instancesthat satisfy the user demand from many IaaS offers throughmatching the IaaS supply and demand To complete match-ing the supply and demand on IaaS FMs it is necessaryto analyze the IaaS service models automatically Usuallythere are many features feature attributes and COMPLEXCONSTRAINTS in an IaaS servicemodel moreover the IaaSconfiguration space is also largeTherefore it is impossible touse an artificial method to analyze the IaaS service modeland thus an automatic mechanism is needed In fact theautomated analysis of feature model (AAFM) has become aspecial technique it is a set of automated analysis operationsthat extract information from the FMs [31] Each analysisoperation can be regarded as a black-box process with theFM and the specific operation parameters as inputs andit can retrieve and output the corresponding results basedon the different goals of analysis These analysis operationsmainly include checking whether the FM syntax is correctjudging whether there is a semantic conflict and verifyingwhether the input product configuration information isvalid
51 Automated Service FM Analysis
511 Checking the Service FM Validity Before performingother analysis operations on an IaaS service model it isnecessary to determine its validity by checking its syntacticalcorrectness and semantic conflicts Semantic conflict check-ing is necessary because some semantic conflicts are veryprone to be introduced when COMPLEX CONSTRAINTSon features and attributes are created in a FMThe validationoperations of an IaaS service model mainly include thefollowing
(1) Judging the syntactical correctness of an IaaS servicemodel text file In Section 3 we have described themethod of creating an IaaS service model in graphicsIn fact in order to perform the automated analysison a service model we have to choose a language toexpress the service model such as XML or a customlanguage [15]We just have to define the XML schemaor the syntax of the language chosen before usingthem We must comply with the relevant syntacticalconstraints of the language used when creating theservice model text file
(2) Checking whether the service FM is empty It shouldbe noted that any contradictions among the relationsand constraints of an IaaS service model could leadto the failure of the representation of the IaaS and wecan discover the possible contradictions by analyzingthe IaaS service model
(3) Checking whether the type definitions of all featuresare reasonable and whether there are semantic con-flicts in the cross-tree constraints For example whenthe parent feature is a mandatory type the only childfeature is naturally a mandatory type Otherwisean error is generated The cross-tree constraints arealso prone to semantic conflicts for example if aREQUIRES constraint between a mandatory featureand another optional feature is created a semanticconflict occurs
(4) Checking whether the feature cardinalities are rea-sonably set For example there might be a conflictbetween the min value of feature group cardinalityand the type of feature groupWhen the feature groupis mandatory type the min value of its cardinalitymust be no less than 1 When the feature groupis of optional type the min value of its cardinalitymust be 0 In addition the maximum value of groupcardinality should be no more than the number offeatures in the feature group Otherwise a semanticconflict occurs
512 Checking the IaaS Configuration Validity An IaaS con-figuration is defined as a set of options for running an IaaSinstance For a computing instance these options correspondto the predefined configuration points such as OS resourcelocation purchase mode CPU size and memory size If atleast one instance satisfying the user needs can be found in theIaaS service model according to the submitted configuration
10 Mathematical Problems in Engineering
then the submitted configuration can be considered validotherwise it is invalid For an attributed FMwhen the featureselection and attribute values assignment are completed andthe relationship constraints among the selected features andtheir attributes are satisfied the service instances satisfyingthe configuration needs are determined
513 Searching for the Best IaaS Instance Usually after auser configuration demand is inputted many IaaS instancessatisfying the demand will be searched from the servicemodel however only the best one will be returned TheIaaS instances from the same provider are generally verysimilar in terms of availability network latency securityand other nonfunctional properties while the cost differenceis relatively large Therefore we choose to optimize thematching instances based on cost that is to search for theone with the least cost among all instances satisfying the userneeds from the same provider
52 Matching between the Service and Demand Models Thesupply and demandmatching operations between the serviceand demand models include the following
(1) Generating the configuration input suitable for theservice model from the demand model First all ofthe feature concepts in the demandmodel aremappedinto the feature concepts in the service model basedon the IaaS concept ontology such that the demandmodel becomes completely consistent with the ser-vice model conceptually Second the configurationinput suitable for the service model will be generatedby the mapped demand model The configurationinput represents the user needs whichmainly containthree aspects of information features attributes andconstraints
(2) Searching for the configuration instance with optimalcost by analyzing the IaaS servicemodelThis stepwilluse the IaaS demand configuration generated in step(1) as an input and perform the automated analysison each service model to search for the best con-figuration instance based on the method outlined inSection 513 If the analysis results show that the inputconfiguration is invalid then the matching of supplyand demand on IaaS FMs fails If the results show theinput configuration is valid and many configurationinstances satisfying the user needs are found then theminimum-cost instance will be returned
6 IaaS Ranking
According to our IaaS discovery and selection method aseries of best matching instances will be returned aftercompleting the matching between the demand model andall service models (otherwise service discovery fails) Thesebest matching instances are the minimum-cost instancesfrom different providers that can meet the usersrsquo functionaldemands Users will choose the most satisfactory one fromthese instances The usual approach is to evaluate andcompare synthetically the important nonfunctional metricsaffecting the IaaS QoS and then make a choice It is amulticriteria decision-making problem
61 Important Nonfunctional Metrics of IaaSs The establish-ment of a unified and effective QoS-evaluating metric systemis the premise of scientific decision-making However theexisting measurement metric systems for IaaSs are eitherinadequate [32 33] or short of operational measurementmethods [6 25]The important nonfunctional metrics affect-ing the IaaS QoS fall into three categories performanceeconomy and security [7] We study and determine themain metrics affecting the IaaS QoS and their measurementmethods
(1) Cost The economy of cloud computing is its prominentadvantage and it is also one of the factors the user is mostconcerned about The cost of an IaaS instance depends onits resource allocation If the configuration parameters of theIaaS instance are uncertain then its cost cannot be obtainedIf the service and demandmodelsmatch successfully the costoptimization of the matching instances will be performedThus the best instance and its cost can be obtained
(2) Availability This is a parameter usually promised by mostproviders in their service level agreement (SLA) In a certainperiod the availability of the IaaS functional unit can begenerally calculated in the following ways
virtual machine availability = uptime(uptime + downtime)
storage availability
=number of successful requests
(number of successful requests + number of failed requests)
(1)
Availability can be aggregated in the following ways
computing type IaaS availability
=
virtual machine availability times network availability (where virtual machine number = 1)
load balancer availability times (119899
sum119894=1
((1
119899) times virtual machine availability)) times network availability (where virtual machine number gt 1)
(2)
(3) VM Performance Metric The VM is the most impor-tant computing functional unit in cloud computing and
its performance has a direct impact on the quality of thecomputing service Different IaaSs having the same VM
Mathematical Problems in Engineering 11
configuration usually show a significant difference in per-formance testing results The Standard Performance Evalu-ation Corporation [34] (SPEC) is a nonprofit organizationconsisting of computer manufacturers system integratorsuniversities research institutions and so forth SPEC aimsat establishing and maintaining the standards for evaluatingcomputer systems CPU2006SPEC is a CPU system testingsuite introduced by SPEC which is the general standard ofCPU testing at present including the SPECint and SPECfpsubtesting modules SPECint tests CPU integer processingperformance while SPECfp tests CPU float point processingperformance In this paper we use the sum of the SPECintand SPECfp test scores as the final score of the VM perfor-mance test
(4) Data-Storage Persistence This is used to evaluate thepossibility that the stored data is lost or damaged whichis represented by calculating the percentage of the lost ordamaged data in a certain period intact disk number(intactdisk number + lost or damaged disk number)
(5) Elasticity The load of cloud computing applications isusually dynamic such as e-commerce applications whichrequires the IaaS resources to have prominent elasticityPerfect elasticity enables users to adjust resources quicklyaccording to load changes so as to better meet the require-ments of applications and avoid the purchase of redundantresources to save costs Time is a crucial aspect in elasticitywhich can be measured by the speed of response to thedynamic workload [33] Considering that the differencesin the resource release speeds of computing instances arerelatively small we have learned from the method proposedin [32] which tests VM scaling latency to measure resourceelasticity Scaling latency includes VM provisioning latencyand system booting latency
(6) Network Latency This means the network delay froman IaaS resource to a target user area which also has animportant impact on the IaaS QoS If there is an average of20 s of network latency the target users will face unendurableservice response delay when they access the applicationsdeployed on the IaaS resources
(7) Security Cloud computing is facingmany security threatssuch as data destruction network attacks privacy leaks andVM attacks so security is also a very important metric In[35] we proposed a systematic method for measuring andevaluating cloud security (referred to as MMECS in thispaper) MMECS measures and evaluates cloud security bycalculating the security advantage of each cloud providerbased on the Consensus Assessment Initiative Questionnaire(CAIQ) reports on cloud security which have been submittedto the CSA by the cloud providers CAIQ is a cloud securityassessment questionnaire based on the Cloud ControlMatrix(CCM) while the CCM is proposed by the CSA and defines alist of security control requirements that the cloud providersand their services should fulfill The CCM references author-ity security standards and frameworks in the industry such asSP800-53 R3 FedRAMP ISOIEC 27001 COBIT and ENISA
IAF First the evidences of security compliance provided bythe CAIQ report are scored and then the obtained score isused to measure the credibility of the CAIQ report Secondwe use the credibility of the CAIQ report to correct theoriginal score of each security control domain in the CAIQreport Finally the security advantage of each IaaS Provider iscalculated based on the corrected scores of control domainsThe results are relatively objective and convincing so we usethe MMECS method to calculate the security metric of eachIaaS Provider
(8) ReputationThis is an important attribute of an IT serviceand it is also a metric usually compared when users chooseservices such as e-commerce services Although many cloudservice reputation calculation models have been proposedin the academic community they are still in the theoreticalresearch stage and not yet commercially available Thereforeit is very difficult to obtain available reputations for IaaSsAlthough the market share of an IaaS cannot substitute for itsreputation it can basically reflect the userrsquos choice tendencyand the service credibility to a certain extent so we use themarket-share data provided by CloudHarmony as a measureof the IaaS reputation
62 Combination Weighting Method for Decision MetricsThe scientific and rational allocation of metric weights is ofgreat importance to multicriteria decision-making problemsAccording to the data sources for calculating weights themetric weightingmethods fall mainly into two categories thesubjective and objective weighting methods The subjectiveweightingmethod assignsmetric weights based on a decisionmakerrsquos subjective preference such as the analytic hierarchyprocess (AHP) and Delphi The objective weighting methodcalculates the metric weights based on their actual valuessuch as the maximizing deviations method the entropymethod and principal component analysis [36] The sub-jective weighting method reflects the decision makerrsquos per-sonal preference however this method is easily influencedby the knowledge and experiences of the decision makerFor the objective weighting method there is an objectivestandard for the weight distribution but it ignores thedecision makerrsquos subjective preferences metric weights thatare calculated totally based on the original metric data maydeviate markedly from the subjective desires of the decisionmaker
For acquiring more reasonable and scientific evaluationresults some researchers combine the two methods togetherto carry out the combination weighting [36ndash39]The existingresearch mainly uses two representative ways of combin-ing the subjective and objective weights the multiplicativesynthesis and weighted linear combination methods [36ndash39] The multiplicative synthesis method generally uses theformula 119902
119895= 119886119895119908119895sum119899
119895=1119886119895119908119895(where 119886
119895 119908119895 and 119902
119895are the
subjective weight objective weight and combination weightof the 119895th metric resp and 119899 is the number of metrics)However this approach tends to make the large results evenlarger and the small ones even smaller and sometimes itmay lead to a very unreasonable result For example given
12 Mathematical Problems in Engineering
the subjective weights (06 03 01) and the objective weights(07 02 01) using the multiplicative synthesis method wecan see from the combination result (0857 0122 002) thatthe first metric is obviously enlarged while the thirdmetric isdecreased to the point where it can be ignored which is obvi-ously unreasonable Research suggests that the multiplicativesynthesis method is more suitable for the case in which thenumber ofmetrics is large and theweight distribution ismoreuniform [36 37] Regarding the weighted linear combinationmethod the general formula is 119902
119895= 120575119886119895+ (1 minus 120575)119908
119895(where
119886119895 119908119895 and 119902
119895are the subjective weight objective weight
and combination weight of the 119895th metric resp and 0 le
120575 le 1) This method overcomes the shortcomings of themultiplicative synthesis method and thus is more widely used[36ndash39] The key of this method is how to determine thecombination coefficient of the two weightingmethods Basedon the above analysis we plan to use the weighted linearcombinationmethod to combine the results of subjective andobjective weighting The methods proposed in [40] are usedto do the subjective weighting while the entropy method isadopted to do the objective weighting
621 Improved AHP Weighting Method Based on SortingThe AHP is originally conceived as a multicriteria decision-making method and is widely used as a subjective weightingmethod for decision metrics The top-down hierarchicalstructure is used to model the relationship among decisionelements in the AHP The top node of the hierarchicalstructure represents the decision goal such as QoS and thefollowing layer nodes are the related metrics affecting thedecision goal such as security availability and cost whichcan be further dividedThe lowest layer nodes are the alterna-tives The AHP has a unique method for determining metricweights which defines 1ndash9 scales to measure the relativeimportance degree of two metrics by combining the quali-tative and quantitative ways to measure them The relativeimportance degree is defined as the ratio between the weightscorresponding to two metrics related to the same goal Therelative importance degree of any two metrics is determinedby paired comparisons after that the judgment matrix isobtained Next to check the consistency of the judgmentmatrix is unavoidable For example if the relative importancedegree of A and B equals 2 the relative importance degreeof B and C equals 2 and the relative importance degree ofA and C equals 4 and then the weight distribution of A Band C is consistent otherwise it is inconsistent When theweight distribution of metrics is not consistent the relativeimportance degrees must be adjusted continuously until thejudgment matrix becomes consistent Finally the weights ofall metrics will be obtained by solving the judgment matrixHow to adjust the inconsistent judgment matrix is a difficultproblem in the AHP We have improved the AHP weightingmethod by referencing the method proposed by Li andWang[40] so that the obtained judgment matrix fully meets therequirement of consistency as follows
(1) Definition of the Relative Importance Degree Scale Thescale 15
120573 (120573 = 0 05 1 15 2 25 3 35 4) is defined to
Table 2 Distribution of metric relative importance degrees for thecases of 120573 and 119899 depicted
120573 0 05 1 15 2 25 3 35 4119899 = 1 119886
3mdash 119886
2mdash 119886
1mdash mdash mdash 119886
4
119899 = 2 mdash mdash 1198865
mdash mdash mdash mdash mdash mdash
depict the relative importance degree between metrics Therelative importance degree is 150 meaning that the twometrics are equally importantThe value of 15 means that theformer metric is slightly more important than the latter Thevalue of 152 means that the former metric is more importantthan the lattermetricThe value of 153means that the formeris obviously more important than the latter The value of 154means that the former is absolutely more important than thelatter When 120573 take values of 05 15 25 and 35 it indicatesthe intermediate state of the two adjacent relative importancedegrees respectively
(2) Determination of the Subjective Weights There are threesteps in calculating the subjective weights first the metricsare divided into several groups according to importance fromlow to high Each group represents a level of importanceand the weights of metrics in the same group are all equalor have only small differences while the weights of metricsin the different groups have significant differences The mainpurpose of grouping metrics is to determine the rationalityof the results of objective weighting when the combinationweighting is carried out in the future Second the metrics ineach group are sorted according to their importance rangingfrom low to high while themetrics with the same importanceare sorted by their numbers Finally the subjective weights ofdecision metrics are determined according to the followingmethodThe left-hand first one of the sorted metric sequenceis taken as the main reference and the left-hand adjacent oneof the current metric is taken as the auxiliary reference thenthe relative importance degree between the current metricand the main reference metric and the relative importancedegree between the currentmetric and the auxiliary referencemetric are determined According to this method the relativeimportance degree of eachmetric in the sequence is assignedin turn from the left-hand to right-hand order Finally thesubjective weight of each metric can be obtained based on allthe relative importance degree values Table 2 shows the caseof the distribution of relative importance degrees in which120573 represents the relative importance degree index for eachmetric and the maximum 119899 in each column represents thenumber of metrics with the same weight The determinationprocess of the relative importance degree is as follows
First the metric with the smallest degree of importancenamely the left-hand first one in the sorted metric sequenceis placed in the cell where 120573 = 0 and 119899 = 1 In turn othermetrics in the sequence are compared with the left-hand firstmetric and its left-hand adjacent metric and then it is placedinto the corresponding cell based on the comparison resultsFor example for the metric sequence 119886
3 (1198862 1198865) 1198861 and 119886
4
the process in detail is as follows At first 1198863is placed into
the cell where 120573 = 0 and 119899 = 1 Meanwhile 1198862is placed
Mathematical Problems in Engineering 13
into the cell where 120573 = 1 and 119899 = 1 because 1198862is slightly
more important than 1198863 Considering that 119886
5is slightly more
important than 1198863and is as equally important as 119886
2 1198865is
placed into the cell where 120573 = 1 and 119899 = 2 In addition 1198861
is placed into the cell where 120573 = 2 and 119899 = 1 because 1198861is
more important than 1198863and is slightly more important than
1198865 Finally 119886
4is placed into the cell where 120573 = 4 and 119899 = 1
because 1198864is absolutely more important than 119886
3and is more
important than 1198861
It has been proved that the judgment matrixes deter-mined by the above method are consistent [40] The subjec-tive weight of each metric can be calculated according to theformula119908
119894= 15120573119894sum
119899
119895=115120573119895 where120573
119894and120573119895are the relative
importance degree indexes of metrics 119894 and j respectively
622 Calculation of the Objective Weights The entropymethod is a commonly used objective weightingmethod thatobtains the objective weight of each metric by calculatingits entropy based on the raw metric data Entropy is ameasurement of system uncertainty the higher the entropyvalue of a system the greater its uncertainty and the lessits information and vice versa [41] We assume that themulticriteria decision-making problem has 119898 alternativesand 119899 decision metrics and any metric can be expressed as119909119894119895(1 le 119894 le 119898 1 le 119895 le 119899) The objective weights of decision
metrics are then calculated according to the following stepsThe first step is to achieve the normalized decisionmatrix
P = (119901119894119895)119898times119899
by normalizing the decision matrix X =
(119909119894119895)119898times119899
so that each decision metric is the profit type andits value is between 0 and 1
The second step is to calculate the entropy of each metricThe uncertainty of the importance degree of any decisionmetric can be measured by calculating its entropy accordingto the following formula
119864119895= minus
119898
sum119894=1
119901119894119895ln119901119894119895
(119895 = 1 2 119899) (3)
From the above formula when a certain metric in allalternatives tends to be equal the entropy of the very metricapproaches its maximum value and thus the uncertainty ofthe importance degree of the metric tends to be greater Themaximum entropy 119864max = ln119898 so 119864
119895can be normalized by
119864max as follows
119890119895= minus (ln119898)minus1
119898
sum119894=1
119901119894119895ln119901119894119895
(119895 = 1 2 119899) (4)
The third step is to calculate the difference coefficient ofeach decision metric by the following formula
119889119895= 1 minus 119890
119895(119895 = 1 2 119899) (5)
The smaller the metricrsquos entropy the greater the metricrsquosdifference and the greater the role of the very metric inevaluating services and vice versa
The fourth step is to calculate the objective weight of eachmetric as follows
119908119895=
119889119895
sum119899
119895=1119889119895
(6)
623 Combination Weighting Method Based on Comprehen-sive Analysis Although the subjective weight is subjectiveand less accurate it reflects the preference of the decisionmaker and has a superior rationality in sorting decisionmetrics by their importance Therefore the combinationweighting should be mainly based on the subjective weightsand the combination coefficient of the subjective and objec-tive weight vectors can be determined by analyzing thedifference between the metric weight rankings obtained bythe two weighting methods Assuming that the subjectiveand objective weight vectors are identified as w
119904and w
119900
respectively then any linear combinations of them can beexpressed as
w = 119886w119904+ (1 minus 119886)w
119900 0 le 119886 le 1 (7)
Assuming that the decision metrics are identified as1198751 1198752 119875
119899 after subjective weighting the decision met-
rics are divided into 119896 groups by importance that is1198771 1198772 119877
119896 in which the group 119877
2is more important
than the group 1198771and the group 119877
3is more important than
the group 1198772and so on The method of determining the
coefficient 119886 is as follows
(1) If there is a relatively uniform distribution and noessential difference in the weights of all decisionmetrics then take 119886 = 0 and the result of theobjective weighting can be directly used as the resultof combination weighting
(2) If the metric weight rankings obtained by the subjec-tive and objective weighting methods are exactly thesame in order to eliminate the influence of subjectivefactors it should take only the objective weightingmethod to obtain the weights which indicates that119886 = 0
(3) If the metric weight rankings obtained by the subjec-tive and objective weighting methods are not exactlythe same while the metric group rankings obtainedby the two methods are the same then take 119886 = 05For example the metric weight ranking obtained bythe subjective weighting method is 119875
1 (1198752 1198753) and
(1198754 1198755) while the weight ranking of metrics obtained
by the objective weighting method is 1198751 (1198753 1198752) and
(1198755 1198754) Obviously the two orders of metric weights
are not the same but the orders of metric groups arethe same and in such circumstances 119886 = 05
(4) If the weight rankings of metrics obtained by the twoweighting methods are different and the orders ofmetric groups obtained by the two methods are alsodifferent then take 119886 = 1 This situation indicatesthat the results obtained by the objective weightingmethod deviate markedly from the subjective prefer-ences of the decision maker so the obtained objec-tive weights have no reference value The subjectiveweighting results will be directly used as the finalmetric weights
63 Ranking Alternative Instances Based on ComprehensiveEvaluations For an alternative IaaS instance 119868
119894 it is assumed
14 Mathematical Problems in Engineering
that 119868119894has 119896 important nonfunctional metrics that are
expressed as 1199091198941 1199091198942 119909
119894119896 and the metric weight vector
obtained by the combination weighting method is w =
(1199081 1199082 119908
119896) thus the comprehensive evaluation 119880
119894of
119868119894can be obtained by formula (8) The comprehensive
evaluations of all the best instances returned by the matchingof supply and demand on IaaS FMs can be calculated inthis way Finally these instances are sorted based on theircomprehensive evaluation We have
119880119894= 11990911989411199081+ 11990911989421199082+ sdot sdot sdot + 119909
119894119896119908119896 (8)
7 Experiment and Analysis
71 Experimental Scenario Data Sources andExperimental Tools
711 Experimental Scenario This experiment evaluates thefeasibility and effectiveness of the IaaS discovery and selec-tion method presented in this paper Considering that acomputing service acts as the main cloud infrastructureservice having a wide range of applications we speciallyformulate the following experimental requirements
A user plans to buy a computing service from an IaaSProvider and the customers are mainly located in southeast-ern China The specific requirements of the computing ser-vice include the following two virtual servers with identicalconfiguration a load balancer two virtual CPUs per virtualserver 2 G memory a solid-state hard disk 30G hard diskcapacity CentOS operating system and support for IPv6 theestimated network traffic per month is 2 TB and all serviceresources are located in Asia
Three moderate-size and well-known IaaS providerswhich are very representative and can provide the computingservices in the Asia area are selected as the IaaS providersin the experiment The three providers are DigitalOcean[29] RackSpace [42] and Linode [43] which are all fromthe United States and have built their own cloud infrastruc-ture centers in Europe America and Asia Among themDigitalOcean was founded in 2012 and currently has morethan 15000 servers RackSpace was founded in 1998 and hashundreds of thousands of servers Linode was founded in2003 and has tens of thousands of servers
712 Data Sources The service-related data of the threeproviders mainly derives from their portals In addition wehave selected the following critical nonfunctional metrics forcomparison according to Section 61Thesemetrics have beencalculated or obtained in the following ways
Cost We obtain the best matching instances from the threeIaaSs and their costs by matching the IaaS service anddemand models
Security According to our measurement and evaluationmethod of cloud security MMECS we first download theprovidersrsquo CAIQ reports from the CSA site and then calculate
the security advantage of each provider based on thesereports
SPECCPU2006 CloudHarmony carries out periodic per-formance testing on the service instances of several majorcloud providers in the industry and their testing resultsare relatively objective and fair We directly download theSPECCPU2006 results of related instances from the Cloud-Harmony site
Availability We obtain the availability of each computingservice instance by formula (2)
Network Latency Under an 8M bandwidth network envi-ronment in Nanjing by means of network testing servicesprovided by CloudHarmony we test the network latency ofthe best matching instance from each provider ten times Weremove the minimum andmaximum values and then use theaverage value of the remaining eight tests as the final result
Market Share We directly download the market-share datafrom the CloudHarmony site
Scaling Latency We measure scaling latency by recordingthe time from when the instance is requested to when itis available to be used We test the scaling latency for eachinstance ten times and remove the minimum and maximumvalues and then use the average value of the remaining eighttests as the final result
713 Editing andAnalysis Tools of IaaS FMs Wehave selectedthe FaMa [44] framework to create and analyze the IaaSFM The FaMa framework is an open-source automatedanalysis tool for FMs with four different reasoners whichsupport more than 20 different analysis operations FaMasupports creating a FM containing attributes and featuregroup cardinality FaMa is implemented as an Eclipse plug-inwhich supports the following analysis operations verifyinga FM product number analysis verifying configurationproduct searching and so forth FaMa can accept two formsof FM file formats namely XML and plain text The plain-text format is the simplest and clearest among all the formatsso we select it to express the IaaS FMThe syntax of the plain-text format is defined as follows
As illustrated in Figure 7 a FM is expressed as threesections the ldquoRelationshipsrdquo section the ldquoAttributesrdquosection and the ldquoConstraintsrdquo section The hierarchicalfeatures and the vertical relationships among featuresare defined in the ldquoRelationshipsrdquo section The featuresafter the colon are the children of the feature before thecolon By default features are of mandatory type whileoptional features are presented in the form of [featurename] The feature group is represented by cardinality anda set of features in the form [minmax]FeatA FeatB The feature attributes are defined in the ldquoAttributesrdquosection the definition of each attribute contains attributetype range default value and null value The attributescan be an enumeration type and defined in the formldquoFeatNameAttName[val1 val2 val119873] defaultVal
Mathematical Problems in Engineering 15
RelationshipsLinodeServer Virtualmachine OS Network [Loadbalancer] Purchase LocationVirtualmachine [11]Linode1G Linode2G Linode4G Linode8G Linode16GLinode32G Linode48G Linode64GOS LinuxLinux [11]Arch Debian centos Ubuntu OpenSUSE gentoo SlackwareFedora AttributesLinodeServerperiodcostreal[0 to 10000000]00 Period cost ($)LinodeServeravailabilityreal[0 to 1]00LinodeServerSecuritylevelreal[0 to 1]013960VirtualmachineHDD [SSD NoSSD]SSD0 ConstraintsLinode1GB AND Month AND (Networkestimatetraffic gt Freetrafficfreelimit)IMPLIES(VirtualmachineRAM == 1 GB) AND (VirtualmachinevCPU == 1) AND (VirtualmachineHDDcapabiltiy ==AND (Freetrafficfreelimit == 204 8G) AND(VirtualmachinecostMONTh == 10$) AND(LinodeServercostmonth = VMcostmonth + Freetrafficextraprice times (Networkestimatetraffic minus Freetrafficfreelimit))
middot middot middot
middot middot middot
24 GB
Figure 7 Linode service model in plain-text format
nullValrdquo the horizontal relationships among features and theCOMPLEX CONSTRAINTS among multiple features andattributes are defined in the ldquoConstraintsrdquo section
72 Creation andMatching of the Service andDemandModelsAccording to the requirement description in this experimentand the collected related information about the three IaaSservices we have created the demand model as illustratedin Figure 4 the DigitalOcean service model as illustrated inFigure 3 the Linode service model as illustrated in Figure 8and the plain-text format of the Linode service modelas illustrated in Figure 7 Owing to space limitations theRackSpace service model is omitted
We take Linode as an example to demonstrate the conceptmapping between the service and demandmodels alongwiththe supply and demand matching
First according to the concept ontology of IaaS FMsthe concept ldquoVMrdquo in the demand model is mapped intothe concept ldquoVirtualmachinerdquo in the service model ldquoLoca-tionrdquo is mapped into ldquoRegionrdquo ldquoCentOSrdquo is mapped intoldquocentosrdquo and so forth Therefore the input configurationfor the Linode service model can be easily generated bythe demand model including features such as Virtualma-chine CentOS Network Loadbalancer Month and Asiaas well as attributes such as Virtualmachinememory = 2GVirtualmachinevCPU = 2 Second the plain-text format ofthe Linode service model and the input configuration aresubmitted to the FaMa platform the analysis operation codeis presented in Figure 9 FaMa first verify the validity of theLinode service model and the input configuration and thenthe best matching instance is obtained as follows by searchingthe Linode service model
Linode2GB AND LoadBalancer AND Month ANDSingapore AND (Networkestimatetraffic lt= FreetrafficFreelimit times VMnum) IMPLIES (VirtualmachineRAM ==2GB) AND (VirtualmachinevCPU == 2) AND (Virtualma-chineHDDcapabiltiy == 48GB) AND (Freetrafficfreelimit
LinodeServer
OSLinux
Virtualmachine
Network Freetraffic
Loadbalancer
Purchase
Hour
Month
Region
Asia
Europe
Singapore
centos
Ubuntu
Debian
Fedora
securitylevel01396
availabiltiy 0999Supportipv6 1
HDD SSDavailabiltiy 0999
availabilty 0999costhour 003costmonth 20
Arch
OpenSUSE
LondonFrankfurt
USEast USWest
Slackware
gentoo
Tokyo
USCentralUSSouthNorthAmerica
Server 16 GServer 8 G
Server 48G
Server 96GServer 64 G
Server 4 G
Server 32G
Server 2 GLinode 1 G
⟨1-1⟩
⟨1-1⟩
⟨1-1⟩
⟨1-1⟩
⟨1-1⟩
⟨1-1⟩
Extraprice 2centG
Figure 8 Major structure of the Linode service model
== 3072G) AND (Virtualmachinecostmonth == $20) AND(LinodeServerperiodcost = Virtualmachinecostmonth times
Virtualmachinenum + LoadBalancermonthcost times LoadBal-ancernum)
LinodeServerperiodcost = 20 times 2 + 20 = $60We have verified the validity of the DigitalOcean service
model the RackSpace servicemodel and their input configu-rations using similarmethods and obtained the bestmatching
16 Mathematical Problems in Engineering
import esusisaFAMAReasonerQuestionTraderimport IaaSCustomOperationProductSetOpt Matching instances are optimized in itPublic AttributedFMoperationclasspublic static void main(String[] args) QuestionTrader qt = new QuestionTrader () GenericAttributedFeatureModel afm = (GenericAttributedFeatureModel)qtopenFile (ldquoIaaSFMLinodeafmrdquo)qtsetVariabilityModel (afm)ValidQuestion (vq)qtask(ldquoValidrdquo)qtcreateQuestion(ValidQuestion)vq=Systemoutprintln (ldquoThe validity of the model isrdquo + vqisValid())if (vqisValid()) Configuration p = new Configuration() GeneriAttributedFeature f1 = afmsearchFeatureByName (ldquoVMrdquo)f1addAttribute(f1searchAttributeByName(ldquomemoryrdquo) ldquo2rdquo)paddElement (f11)ValidConfigurationQuestion vcq= (ValidConfigurationQuestion)qtcreateQuestion (ldquoValidConfigurationrdquo)vcqsetConfiguration (vcq)qtask(p)Systemoutprintln (ldquoThe validity of the configurationisrdquo + vcqisValid())if (p)qtaddStagedConfiguration(vcqisValid())Questionq = qtcreateQuestion (ldquoProductsrdquo) qtask(q)ProductsQuestion pq= (ProductQuestion) q if (pqgetNumberOfProcucts() == 0) systemoutprintln (ldquon No valid productrdquo) else
pqgetAllProducts()iterator()=itGenericProductgtextendsIteratorltif ProductSetOpt(it)new=poProductSetOpt(ithasNext())
pofindBestProductAndprint ()
middot middot middot
middot middot middot
Figure 9 Source code of verifications of the Linode service model and the input configuration and searching for the best instance
Table 3Main nonfunctionalmetrics of the bestmatching instances
Metric name RackSpace DigitalOcean Linode1198861 cost 10744 55 60
1198862 security index 01478 01307 01396
1198863 SPECCPU2006 111 101 118
1198864 availability 09989 09980 09998
1198865 scaling latency 123 55 118
1198866 network latency 109ms 398ms 260ms
1198867 market share 5 1 2
instances The costs of the best instances from DigitalOceanand RackSpace are $55 and $10744 respectively
73 Ranking of the Best Matching Instances The steps inranking the best matching instances are as follows
(1) Measurement of the Main Nonfunctional Metrics for theBest Matching Instances According to Section 712 the mainnonfunctional metrics are obtained as shown in Table 3
Accordingly the following decision matrix X is created
X =[[
[
10744 01478 111 09989 123 109 005
55 01307 101 09980 55 398 001
60 01396 118 09998 118 260 002
]]
]
(9)
In order to facilitate comparison of the above metricsof these instances we utilize the method given in [45] tostandardize all evaluationmetrics through the formula ldquo119909
119894119895=
(max 119909119894119895minus 119909119894119895) + min119909
119894119895 119894 = 1 rarr 119898rdquo All evaluation
metrics are converted into profit metrics by the formulaldquomax 119909
119894119895minus 119909119894119895rdquo and then a coordinate translation is carried
out by ldquo+min119909119894119895rdquo so that the values of these metrics can be
restored to their original size level Second we normalize theconverted matrix by the formula 119910
119894119895= 119909119894119895sum119898
119894=1119909119894119895 1 le 119894 le
119898 1 le 119895 le 119899 where 119898 is the number of alternative serviceinstances and 119899 is the number of evaluation metrics Finallythe standardized decision matrix R is obtained
R
=[[
[
0208 0353 0336 0333 0231 0528 0625
0405 0313 0306 0333 0517 0145 0125
0387 0334 0358 0334 0252 0327 0250
]]
]
(10)
(2) Determination of the Subjective Weights According toSection 621 we first divide all evaluation metrics into fourgroups and sort them by ascending importance The metricsequence 119886
5 (1198864 1198866) (1198862 1198867) and (119886
1 1198863) is obtained The
importance of each metric in the sequence is greater thanor equal to its left-hand closest metric Next the metricweight distribution is carried out and the results are shownin Table 4
According to the formula 119908119894
= 15120573119894sum7
119895=115120573119895
sum7
119895=115120573119895 = 1525 the subjective weight vector w
119904is
calculated
w119904= (0221 0148 0221 0098 0066 0098 0148)
119879 (11)
Mathematical Problems in Engineering 17
Table 4 Distribution of the metric relative importance degree
120573 0 05 1 15 2 25 3 35 4119899 = 1 119886
5mdash 119886
4mdash 119886
2mdash 119886
1mdash mdash
119899 = 2 mdash mdash 1198866
mdash 1198867
mdash 1198863
mdash mdash
(3) Calculation of the Objective Weights According toSection 622 the entropy of an evaluation metric is obtainedby formula (4) and the results are as follows
1198901= 096494
1198902= 09989
1198903= 099813
1198904= 099999
1198905= 093473
1198906= 089452
1198907= 081945
(12)
The metric variation coefficients are obtained by theformula 119889
119895= 1 minus 119890
119895 and the results are as follows
1198891= 003506
1198892= 00011
1198893= 000187
1198894= 000001
1198895= 006527
1198896= 010548
1198897= 018055
(13)
The objective weight vector is obtained as follows by theformula 119908
119895= 119889119895sum119899
119895=1119889119895
w119900
= (0090 0003 0005 0001 0168 0270 0463)119879(14)
(4) Combination Weighting After the completion of thesubjective weighting metrics are sorted by ascending impor-tance as follows
(1198865) (1198864 1198866) (1198862 1198867) (1198861 1198863) (15)
From the results of the subjective weighting 1198864and 1198866 1198862
and 1198867 and 119886
1and 1198863are equally important therefore there
are some equivalent results of sorting metrics
(1198865) (1198864 1198866) (1198862 1198867) (1198863 1198861)
(1198865) (1198864 1198866) (1198867 1198862) (1198861 1198863)
(1198865) (1198864 1198866) (1198867 1198862) (1198863 1198861)
(1198865) (1198866 1198864) (1198862 1198867) (1198861 1198863)
(1198865) (1198866 1198864) (1198862 1198867) (1198863 1198861)
(1198865) (1198866 1198864) (1198867 1198862) (1198861 1198863)
(1198865) (1198866 1198864) (1198867 1198862) (1198863 1198861)
(16)
After completion of the objective weighting metrics aresorted by ascending importance as follows
1198864 1198862 1198863 1198861 1198865 1198866 1198867 (17)
The results show that the sorting results of metricsobtained by the two weighting methods are not exactly thesame the sorting results of metric groups are also not thesame Therefore we take the linear combination coefficient119886 = 1 According to formula (7) the combination weightvector is calculated as w = w
119904= (0221 0148 0221
0098 0066 0098 0148)T The result can be explained asfollows The metric weight sorting obtained by the objectiveweighting methods deviates markedly from the subjectivepreferences of the user Therefore the result obtained by theobjective weighting method has no reference value Basedon the main nonfunctional metrics and their weights wehave obtained the comprehensive evaluations of the threebest instances from the RackSpace DigitalOcean and Linodeservice models as follows
119880Best-instance-from-RackSpace = 0364592
119880Best-instance-from-DigitalOcean = 0302921
119880Best-instance-from-Linode = 0332487
(18)
Thus the best matching instances from the threeproviders are sorted as follows
119880Best-instance-from-RackSpace gt 119880Best-instance-from-Linode
gt 119880Best-instance-from-DigitalOcean(19)
74 Results Analysis First the IaaS discovery process imple-ments the matching of supply and demand on IaaSs witha configuration instance granularity in which the searchfor the matching instances covers the complete configu-ration space for each IaaS Therefore the QoS metrics ofall matching instances can be obtained accurately so thatthe QoS of these instances can be objectively evaluatedand compared which ensures that the decision results areaccurate Second the IaaS discovery and selection processrealized in this paper is systematic and automatic After
18 Mathematical Problems in Engineering
the user submits the demand of an IaaS and the subjectiveweight vector of the decision metrics the entire processwill be completed automatically Thus the efficiency of IaaSdiscovery and selection is greatly improved Finally theperformance of our methods is good The repository of IaaSservice models is updated andmaintained periodically by thesystem Thus the main processing part of our methods liesin the matching of supply and demand on IaaS FMs Thisprocessing part takes out the IaaS service model from therepository sequentially and then searches the best matchinginstances from the IaaS configuration space represented bythe service mode Assuming there are 119898 IaaS services eachprovides about 119899 configuration instances and the COMPLEXCONSTRAINTS representation of each instance involvesabout 119897 conditional options the time complexity is then119874(119899times119898times119897)The experimental result shows that the searches for thebest matching instances from the three IaaS service modelsare accomplished within 1 s
8 Conclusions and Future Work
This paper systematically studied the description discoveryand selection methods of IaaSs in cloud computing Firstwe designed a standard description method for IaaSs thatuses a fine-grained and structured way to describe the entireconfiguration space of an IaaS The method overcomes theshortcomings of existing methods which can only describethe macro information of IaaSs and provides the conditionsfor the automated discovery and selection of IaaSs Secondwe proposed a systematic discovery and selectionmethod forIaaSs which introduces the automated analysis techniquesof FMs to analyze the service model and search for the bestmatching instance from each IaaSThe discovery efficiency isgreatly improvedMoreover due to the fine-grainedmatchingof supply and demand on IaaSs the matching results directlypoint to the specific configuration instances so the accuracyof service discovery is effectively improved Finally we uni-fied the decision metrics for service selection and presentedeffective and feasible metric measurement methods We alsopresented a combination weighting method for decisionmetrics based on the subjective and objective weightingmethods As such the ranking result of alternative IaaSinstances is more objective and reliable
In reality a combination of multiple IaaSs can sometimesmeet the needs of some applications better such as global e-commerce If a combination of multiple IaaSs from differentregions is used the user requests will be effectively dispersedso that the system pressure can be greatly reduced and userexperience can be improved In addition some applicationshave to be deployed on the combination of multiple IaaSssuch as a medical-related and big-data-analysis applicationwhich needs to collect the original data from multiple coun-tries for analysis and processing If the laws of the relevantcountries strictly prevent such original data flowing out oftheir territories then users will have to buy a combination ofmultiple IaaSs located in the licensed areas Therefore thereis a strong realistic significance in studying how to discoverand select the best IaaS composition based on user needs
Competing Interests
The authors declare that they have no competing interests
Acknowledgments
This work was supported by the Nature Science Foundationof Jiangsu China under Grant no BK20131069
References
[1] M Armbrust A Fox R Griffith et al ldquoA view of cloudcomputingrdquo Communications of the ACM vol 53 no 4 pp 50ndash58 2010
[2] Cloudharmony 2015 httpscloudharmonycom[3] A V Dastjerdi S G H Tabatabaei and R Buyya ldquoAn effec-
tive architecture for automated appliance management systemapplying ontology-based cloud discoveryrdquo in Proceedings of the10th IEEEACM International Symposium on Cluster Cloud andGrid Computing (CCGrid rsquo10) pp 104ndash112 May 2010
[4] M A Rodrıguez-Garcıa R Valencia-Garcıa F Garcıa-Sanchezand J J Samper-Zapater ldquoOntology-based annotation andretrieval of services in the cloudrdquoKnowledge-Based Systems vol56 no 3 pp 15ndash25 2014
[5] J Kang and K M Sim ldquoOntology and search engine forcloud computing systemrdquo in Proceedings of the InternationalConference on System Science and Engineering (ICSSE rsquo11) pp276ndash281 Macau China June 2011
[6] S K Garg S Versteeg and R Buyya ldquoA framework for rankingof cloud computing servicesrdquo Future Generation ComputerSystems vol 29 no 4 pp 1012ndash1023 2013
[7] Z Li L OrsquoBrien H Zhang and R Cai ldquoOn a catalogue ofmetrics for evaluating commercial cloud servicesrdquo in Proceed-ings of the 13th ACMIEEE International Conference on GridComputing (GRID rsquo12) pp 164ndash173 Beijing China November2012
[8] E Wittern J Kuhlenkamp and M Menzel ldquoCloud serviceselection based on variability modelingrdquo in Service-OrientedComputing pp 127ndash141 Springer Berlin Germany 2012
[9] J Garcıa-Galan P Trinidad O F Rana and A Ruiz-CortesldquoAutomated configuration support for infrastructure migrationto the cloudrdquo Future Generation Computer Systems vol 55 pp200ndash212 2016
[10] J Garcıa-Galan O F Rana P Trinidad and A Ruiz-CortesldquoMigrating to the cloud a software product line based analysisrdquoin Proceedings of the 3rd International Conference on CloudComputing and Services Science (CLOSER rsquo13) pp 416ndash426Aachen Germany May 2013
[11] Amazon 2015 httpawsamazoncom[12] K Kang S Cohen J Hess et al ldquoFeature-oriented domain anal-
ysis feasibility studyrdquo Tech Rep CMUSEI-90-TR-21 SoftwareEngineering Institute Carnegie Mellon University 1990
[13] G Shen W Zhang Z Huang et al ldquoDescription-logic-based feature modeling and verificationrdquo Journal of ComputerResearch and Development vol 50 no 7 pp 1501ndash1512 2013
[14] C Quinton D Romero and L Duchien ldquoAutomated selectionand configuration of cloud environments using software prod-uct lines principlesrdquo in Proceedings of the 7th IEEE InternationalConference on Cloud Computing (CLOUD rsquo14) pp 144ndash151Anchorage Alaska USA June 2014
Mathematical Problems in Engineering 19
[15] J Zhou D Zhao and J Liu ldquoTEFL a textual feature modelinglanguagerdquo Journal of Chinese Computer Systems vol 33 no 10pp 2133ndash2140 2012
[16] Amazon ldquoAWS Total Cost of Ownership (TCO) Calculatorrdquo2015 httpsawstcocalculatorcom
[17] Rackspace 2015 httpwwwrackspacecouksolutions-config-urator
[18] Cloudscreener 2015 httpwwwcloudscreenercom[19] Cloudorado 2015 httpswwwcloudoradocom[20] Planforcloud 2015 httpwwwplanforcloudcom[21] S Frey F Fittkau and W Hasselbring ldquoSearch-based genetic
optimization for deployment and reconfiguration of software inthe cloudrdquo in Proceedings of the 35th International Conferenceon Software Engineering (ICSE rsquo13) pp 512ndash521 San FranciscoCalif USA May 2013
[22] M Zhang R Ranjan A Haller et al ldquoAn ontology-based sys-tem for cloud infrastructure servicesrsquo discoveryrdquo in Proceedingsof the International Conference onCollaborative ComputingNet-working Applications and Worksharing pp 524ndash530 WuhanChina November 2012
[23] T Han and K M Sim ldquoAn ontology-enhanced cloud servicediscovery systemrdquo in Proceedings of the International MultiConference of Engineers and Computer Scientists (IMECS rsquo10)vol 2180 HongKong March 2010
[24] L Liu X Yao L Qin and M Zhang ldquoOntology-based servicematching in cloud computingrdquo in Proceedings of the IEEEInternational Conference on Fuzzy Systems (FUZZ-IEEE rsquo14) pp2544ndash2550 IEEE Beijing China July 2014
[25] Cloud ServiceMeasurement IndexConsortium (CSMIC) ldquoSMIframeworkrdquo 2015 httpwwwcsmicorg
[26] S K Garg S Versteeg and R Buyya ldquoSMICloud a frameworkfor comparing and ranking cloud servicesrdquo in Proceedings of theIEEE International Conference on Utility and Cloud Computingpp 210ndash218 Melbourne Australia December 2011
[27] B Dougherty J White and D C Schmidt ldquoModel-drivenauto-scaling of green cloud computing infrastructurerdquo FutureGeneration Computer Systems vol 28 no 2 pp 371ndash378 2012
[28] E Wittern and C Zirpins ldquoService feature modeling modelingand participatory ranking of service design alternativesrdquo Soft-ware amp Systems Modeling vol 15 no 2 pp 553ndash578 2016
[29] DigitalOcean 2015 httpswwwdigitaloceancom[30] CSA ldquoCSA Security Trust and Assurance Registry (STAR)rdquo
2015 httpscloudsecurityallianceorgstar[31] D Benavides S Segura and A Ruiz-Cortes ldquoAutomated
analysis of feature models 20 years later a literature reviewrdquoInformation Systems vol 35 no 6 pp 615ndash636 2010
[32] A Li X Yang S Kandula and M Zhang ldquoCloudCmpcomparing public cloud providersrdquo in Proceedings of the 10thACM SIGCOMM Conference on Internet Measurement (IMCrsquo10) pp 1ndash14 ACM Melbourne Australia November 2010
[33] S Islam K Lee A Fekete and A Liu ldquoHow a consumercan measure elasticity for cloud platformsrdquo in Proceedings ofthe 3rd ACMSPEC International Conference on PerformanceEngineering (ICPE rsquo12) pp 85ndash96 Boston Mass USA April2012
[34] Spec 2015 httpwwwspecorg[35] H Zhu L Wu and H Kang ldquoResearch of cloud provider
selection method based on SecLArdquo Computer Science vol 43no 5 pp 100ndash108 2016
[36] MWang ldquoA comprehensive analysis method for determinatingthe weight coefficients in comprehensive evaluation of multipleindexesrdquo Systems Engineering vol 17 no 2 pp 56ndash61 1999
[37] J-X Liu Y-J Tan and H-P Cai ldquoStudy of the methods of thelinear combination weighting for multiple attribute decision-makingrdquo Journal of National University of Defense Technologyvol 27 no 4 pp 121ndash124 2005
[38] HChen ldquoCombination determiningweightsmethod formulti-ple attribute decisionmaking based onmaximizing deviationsrdquoSystems Engineering and Electronics vol 26 no 2 pp 194ndash1972004
[39] D Song C Liu C Shen et al ldquoMultiple objective and attrib-ute decision making based on the subjective and objectiveweightingrdquo Journal of Shandong University vol 45 no 4 pp1ndash9 2015
[40] Y Li and J Wang ldquoMethod for deriving AHP weight based onsortingrdquoOrdnance Industry Automation no 11 pp 42ndash44 2013
[41] W Chen and J Xia ldquoOptimal combined weighting methodbased on the subjective and objective weightsrdquo Mathematics inPractice andTheory vol 37 no 1 pp 17ndash22 2007
[42] RackSpace 2015 httpwwwrackspacecom[43] Linode 2015 httpswwwlinodecom[44] ISA Research Group ldquoFAMA tool suiterdquo 2015 httpwwwisa
usesfama[45] M Li G Chen and Y Chen ldquoResearch on the method of index
standardization in comprehensive evaluationrdquo Chinese Journalof Management Science no 12 pp 45ndash48 2004
Submit your manuscripts athttpwwwhindawicom
Hindawi Publishing Corporationhttpwwwhindawicom Volume 2014
MathematicsJournal of
Hindawi Publishing Corporationhttpwwwhindawicom Volume 2014
Mathematical Problems in Engineering
Hindawi Publishing Corporationhttpwwwhindawicom
Differential EquationsInternational Journal of
Volume 2014
Applied MathematicsJournal of
Hindawi Publishing Corporationhttpwwwhindawicom Volume 2014
Probability and StatisticsHindawi Publishing Corporationhttpwwwhindawicom Volume 2014
Journal of
Hindawi Publishing Corporationhttpwwwhindawicom Volume 2014
Mathematical PhysicsAdvances in
Complex AnalysisJournal of
Hindawi Publishing Corporationhttpwwwhindawicom Volume 2014
OptimizationJournal of
Hindawi Publishing Corporationhttpwwwhindawicom Volume 2014
CombinatoricsHindawi Publishing Corporationhttpwwwhindawicom Volume 2014
International Journal of
Hindawi Publishing Corporationhttpwwwhindawicom Volume 2014
Operations ResearchAdvances in
Journal of
Hindawi Publishing Corporationhttpwwwhindawicom Volume 2014
Function Spaces
Abstract and Applied AnalysisHindawi Publishing Corporationhttpwwwhindawicom Volume 2014
International Journal of Mathematics and Mathematical Sciences
Hindawi Publishing Corporationhttpwwwhindawicom Volume 2014
The Scientific World JournalHindawi Publishing Corporation httpwwwhindawicom Volume 2014
Hindawi Publishing Corporationhttpwwwhindawicom Volume 2014
Algebra
Discrete Dynamics in Nature and Society
Hindawi Publishing Corporationhttpwwwhindawicom Volume 2014
Hindawi Publishing Corporationhttpwwwhindawicom Volume 2014
Decision SciencesAdvances in
Discrete MathematicsJournal of
Hindawi Publishing Corporationhttpwwwhindawicom
Volume 2014 Hindawi Publishing Corporationhttpwwwhindawicom Volume 2014
Stochastic AnalysisInternational Journal of
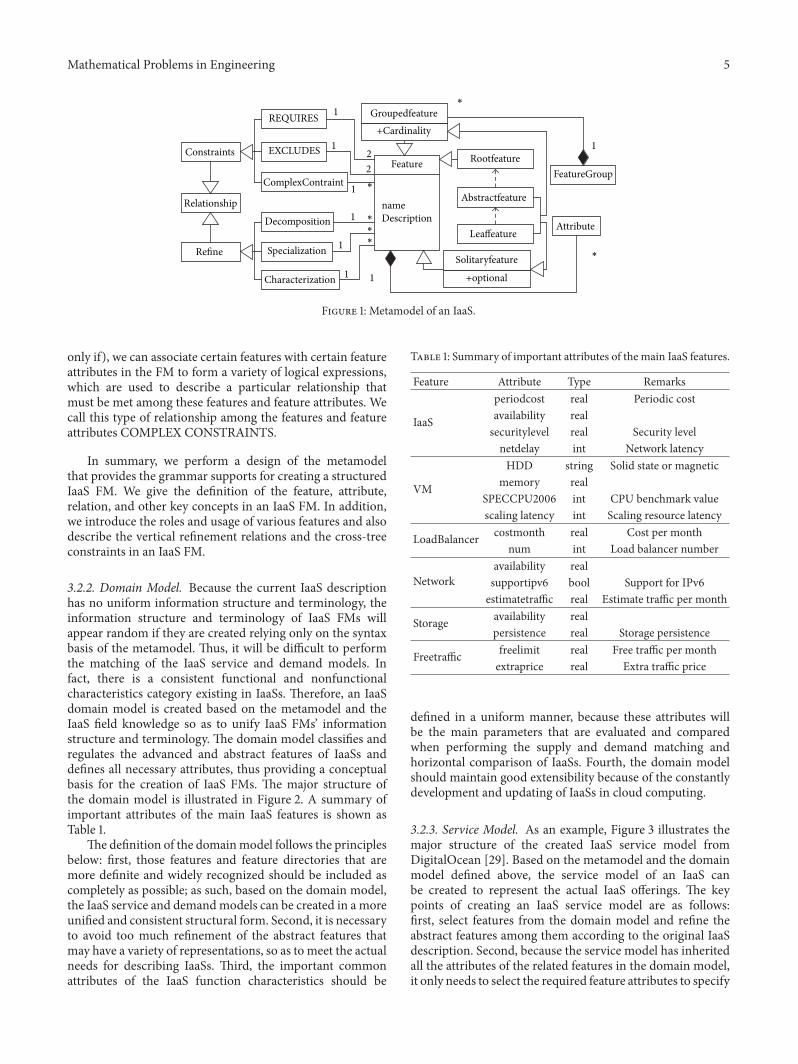
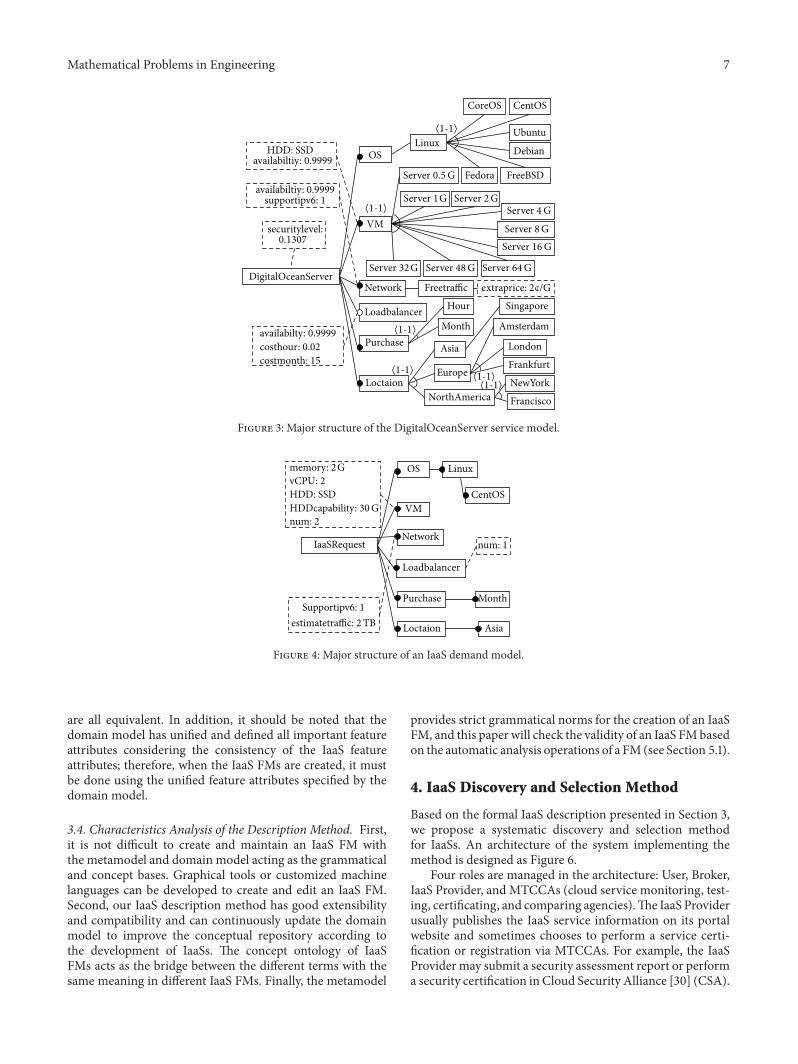
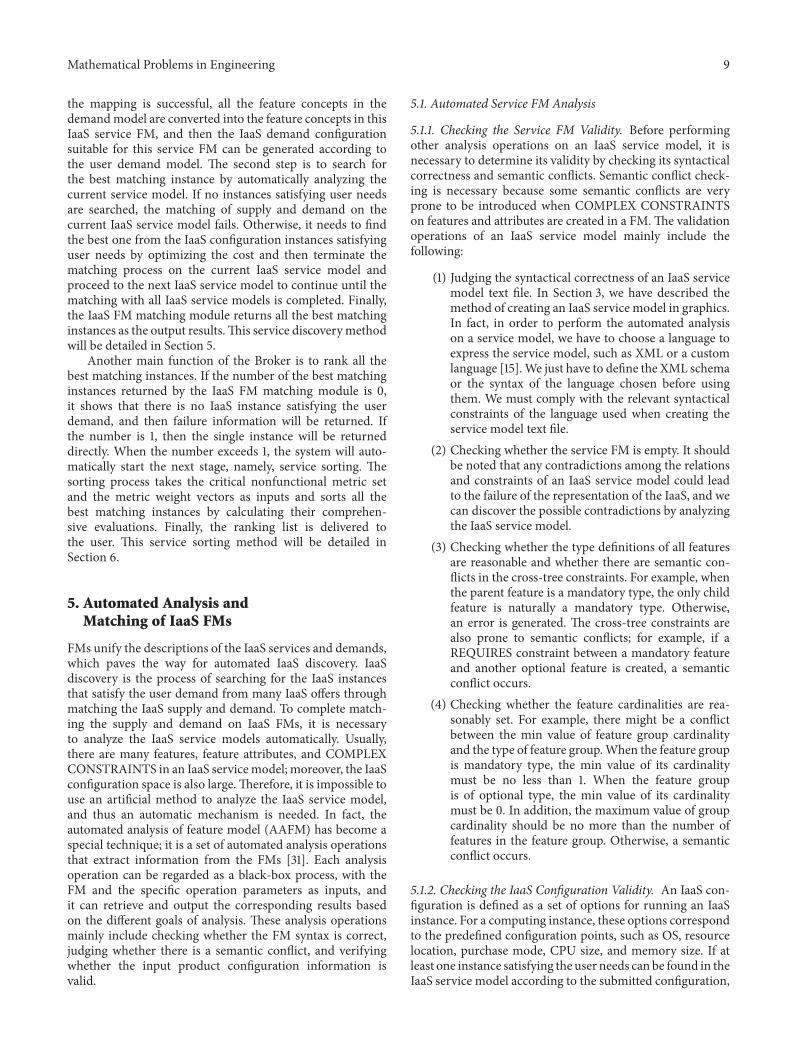
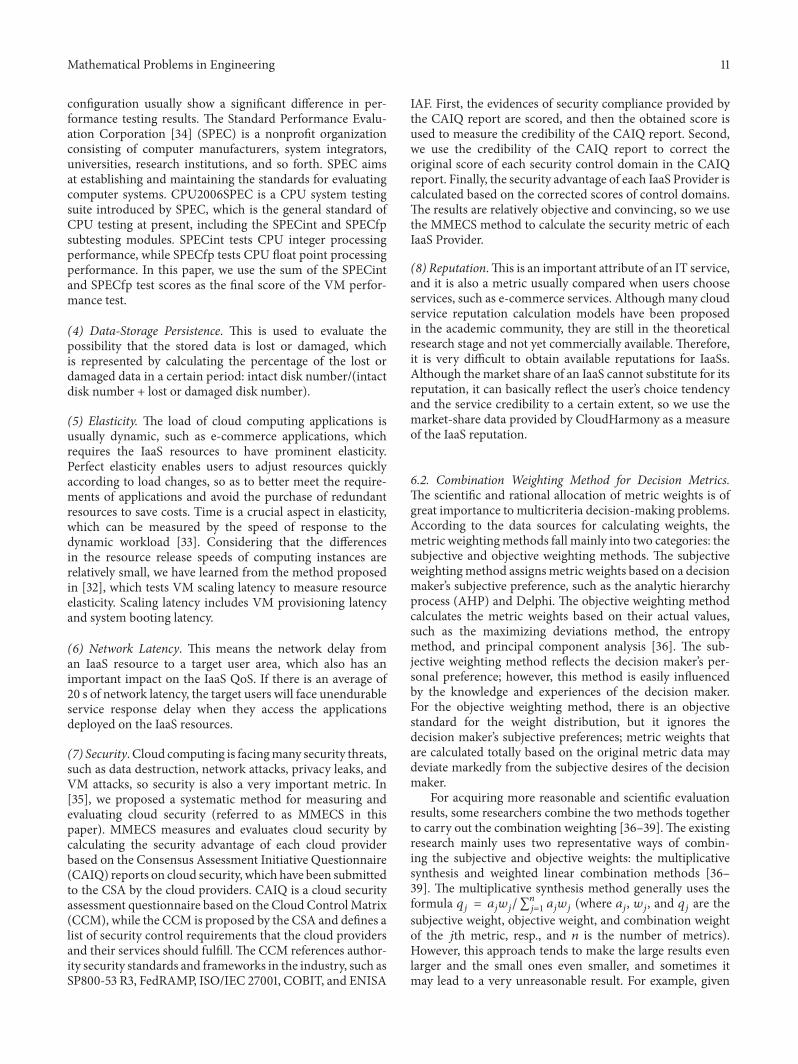
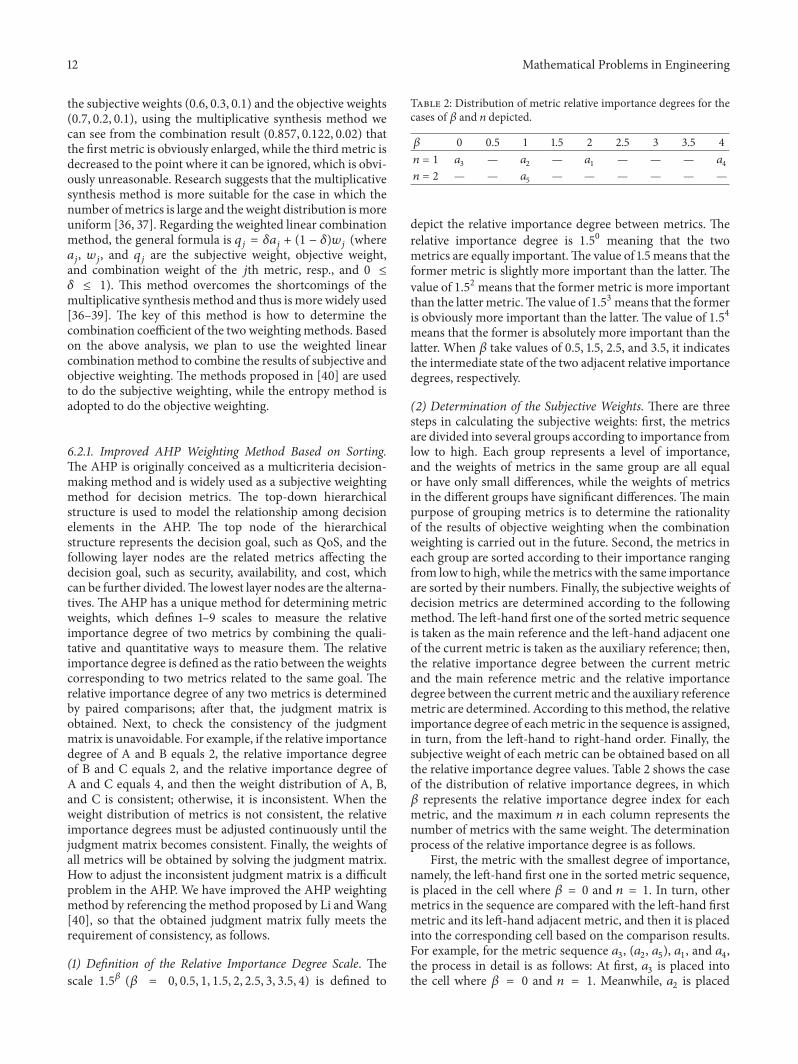
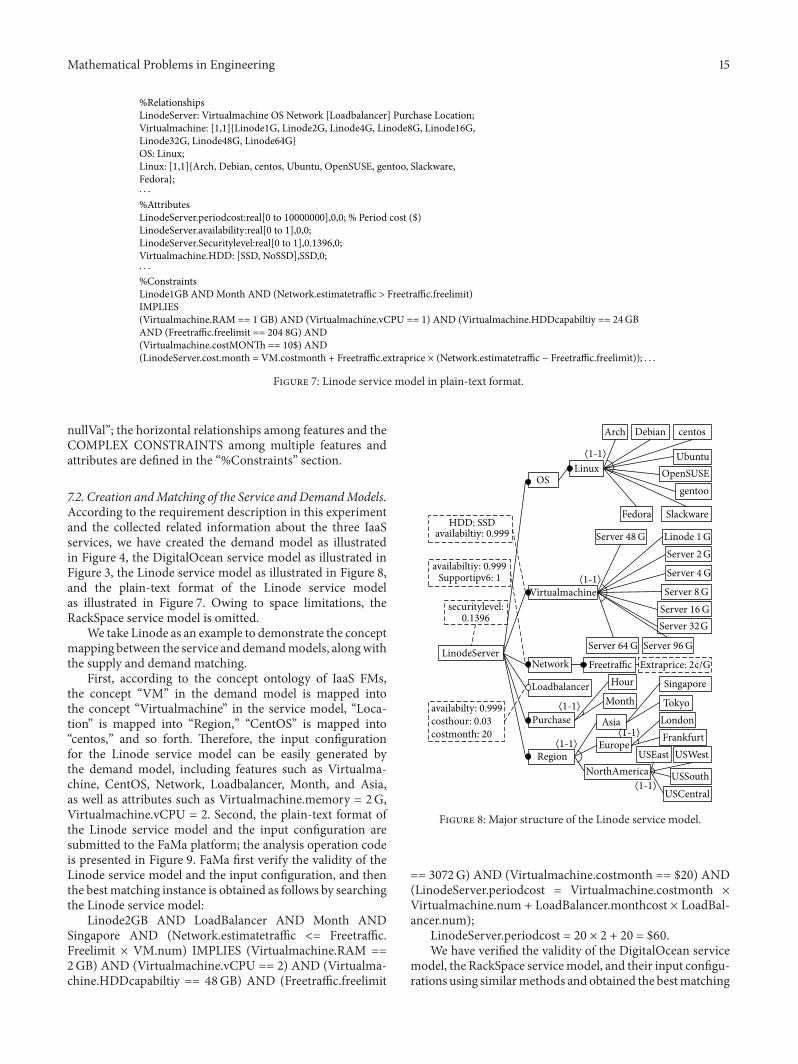
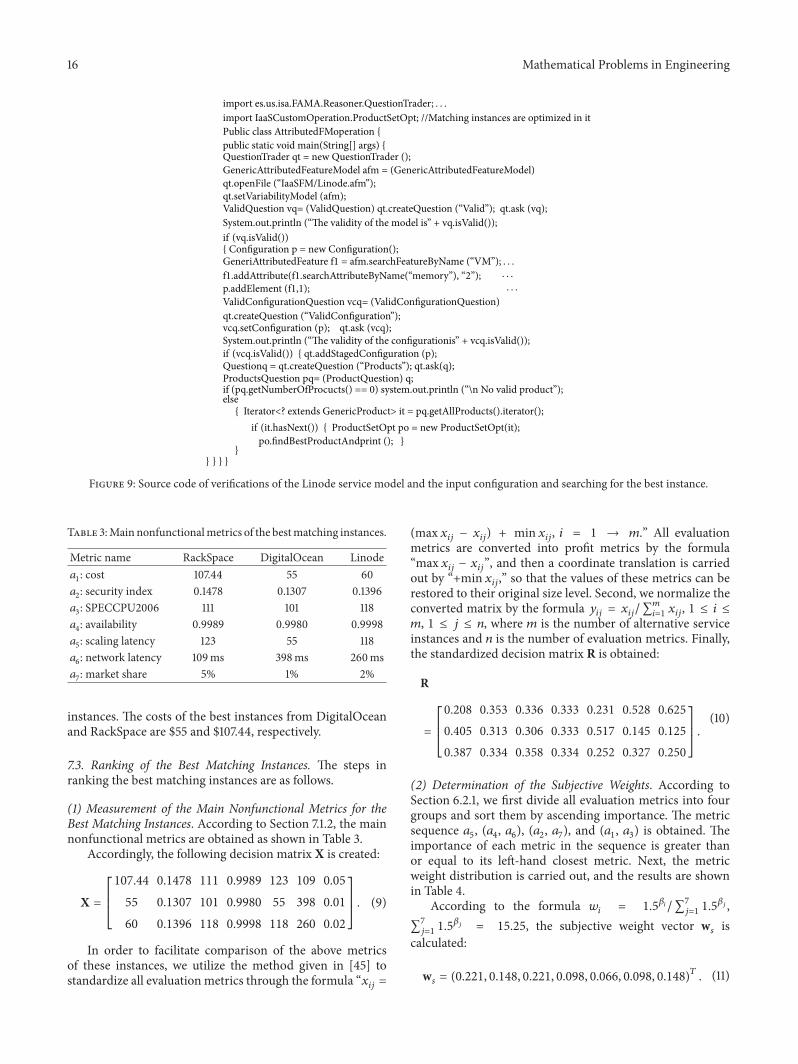
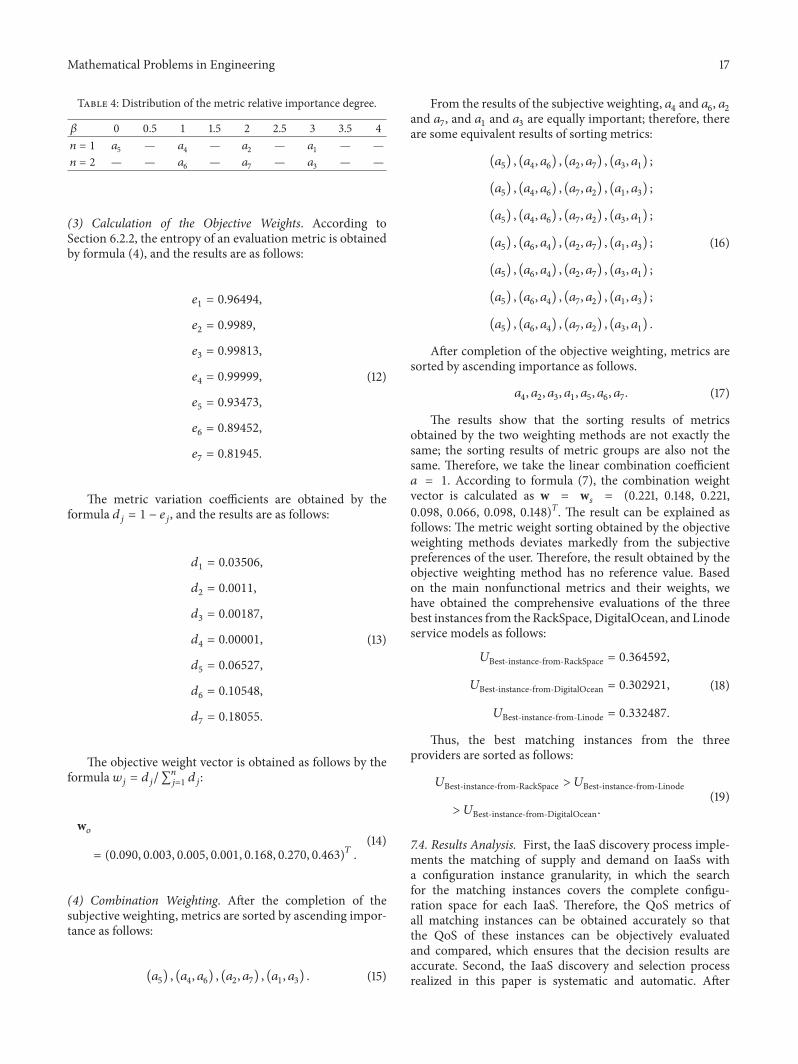
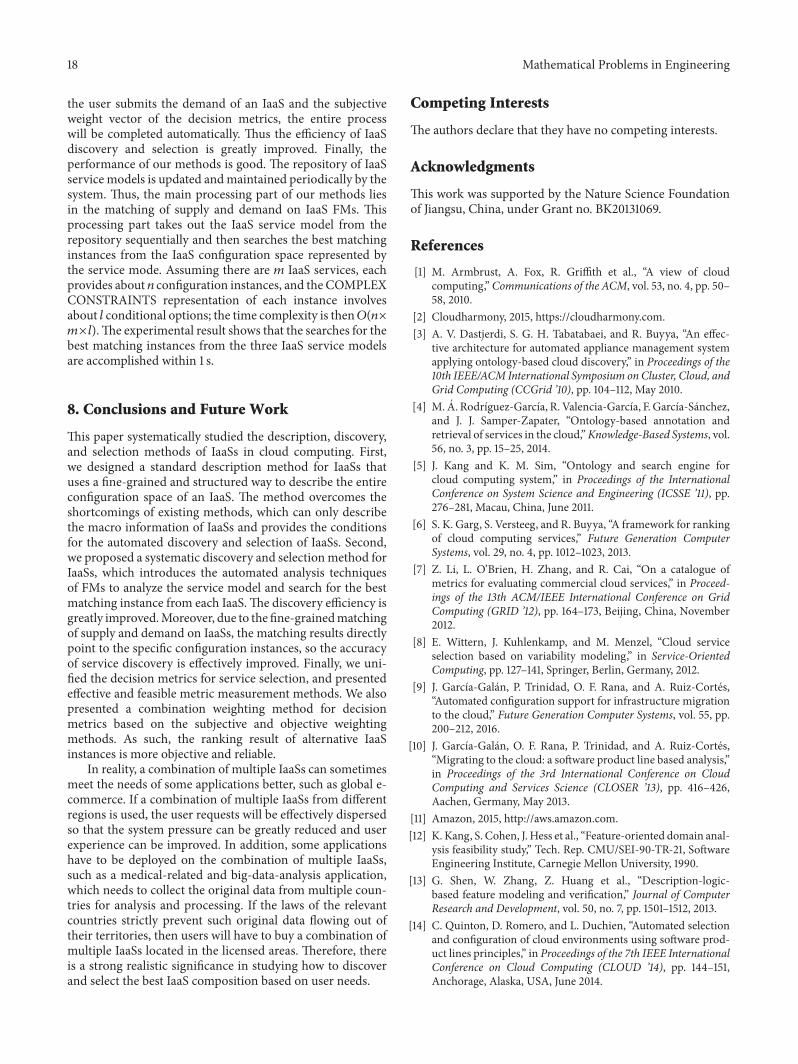