real time chemical characterization ... - atmos-chem-phys.net · the european directive 1999/30/ce...
TRANSCRIPT
Atmos. Chem. Phys., 9, 3709–3720, 2009www.atmos-chem-phys.net/9/3709/2009/© Author(s) 2009. This work is distributed underthe Creative Commons Attribution 3.0 License.
AtmosphericChemistry
and Physics
Real time chemical characterization of local and regionalnitrate aerosols
M. Dall’Osto 1,*, R. M. Harrison 1, H. Coe2, P. I. Williams2, and J. D. Allan2
1National Centre for Atmospheric Science, Division of Environmental Health & Risk Management, School of Geography,Earth & Environmental Sciences, University of Birmingham, Edgbaston, Birmingham B15 2TT, UK2National Centre for Atmospheric Science, School of Earth, Atmospheric & Environmental Sciences, The University ofManchester, Simon Building Oxford Road, Manchester M13 9PL, UK* currently at: School of Physics & Centre for Climate & Air Pollution Studies, Environmental Change Institute NationalUniversity of Ireland, Galway, Ireland
Received: 4 August 2008 – Published in Atmos. Chem. Phys. Discuss.: 17 November 2008Revised: 7 April 2009 – Accepted: 20 May 2009 – Published: 9 June 2009
Abstract. Nitrate aerosols make a very major contributionto PM2.5 and PM10 in western Europe, but their sourcesand pathways have not been fully elucidated. An AerosolTime-of-Flight Mass Spectrometer (ATOFMS) and a Com-pact Time of Flight Aerosol Mass Spectrometer (C-ToF-AMS) were deployed in an urban background location inLondon, UK, collecting data as part of the REPARTEE-I ex-periment. During REPARTEE-I, daily PM10 concentrationsranged up to 43.6µg m−3, with hourly nitrate concentrations(measured by AMS) of up to 5.3µg m−3. The applicationof the ART-2a neural network algorithm to the ATOFMSdata characterised the nitrate particles as occurring in twodistinct clusters (i.e. particle types). The first (33.6% of par-ticles by number) appeared to be locally produced in urbanlocations during nighttime, whilst the second (22.8% of par-ticles by number) was regionally transported from continen-tal Europe. Nitrate in locally produced aerosol was presentmainly in particles smaller than 300 nm, whilst the regionalnitrate presented a coarser mode, peaking at 600 nm. In bothaerosol types, nitrate was found to be internally mixed withsulphate, ammonium, elemental and organic carbon. Nitratein regional aerosol appeared to be more volatile than that lo-cally formed. During daytime, a core of the regionally trans-ported nitrate aerosol particle type composed of organic car-bon and sulphate was detected.
Correspondence to:R. M. Harrison([email protected])
1 Introduction
Nitrate aerosol is a major component of the total aerosolmass in western Europe. It is formed chemically in the at-mosphere from the precursor species ammonia (NH3) andnitric acid (HNO3). Sources of ammonia include agricul-tural sources such as livestock housing and the storage andspreading of manures as well as oceans, biomass burning,crops and soil (Bouwman et al., 1997). Typical sources ofnitrogen oxides (NOx), which are the main precursor of ni-tric acid, include fossil fuel combustion, soils, biomass burn-ing and lighting. During the day, NOx is oxidized by OHto form HNO3, whilst during night time the NO3 radical(which is photolysed during the day) may be formed by reac-tion between NO2 and ozone and can be converted to nitricacid via its thermal equilibrium with N2O5 (Carslaw et al.,1997; Brown et al., 2005). Sub-micrometre nitrate aerosolis predominantly present in the form of ammonium nitrate(NH4NO3), a semi-volatile compound.
The equilibrium between ammonium nitrate and itsgaseous precursors is relatively well understood. The gas-aerosol partitioning of nitrate depends strongly on the avail-ability of its precursor gases and on the ambient condi-tions. Atmospheric ammonia may also be neutralized irre-versibly by sulphuric acid (H2SO4) to form ammonium sul-phate ((NH4)2SO4). If excess NH3 is available then it maycombine with HNO3 to form NH4NO3 (Allen et al., 1989).
Coarse particle nitrate also arises from the surface reactionof nitric acid with sea salt aerosol. The coarse mode of ni-trate typically exhibits a mass median diameter of ca 2.5µm
Published by Copernicus Publications on behalf of the European Geosciences Union.
3710 M. Dall’Osto et al.: Characterization of nitrate aerosols
(Abdalmogith et al., 2006b). An analysis of air mass backtrajectories clearly indicates the importance of long-rangetransport as a source of nitrate in the UK atmosphere (Ab-dalmogith and Harrison, 2005). However, a careful analysisof the spatial distribution of measured concentrations of ni-trate in air reveals a clear urban excess in London over thesurrounding region (Abdalmogith et al., 2006a).
Airborne particulate matter (PM) has environmental,health and climate effects. Despite the fact that research onPM is intense, much remains to be learned about PM com-position and physico-chemical properties. Nitrate aerosolinfluences global climate. A number of modeling studieshave identified nitrate and ammonium as significant compo-nents of aerosol load (Adams et al., 2001), but most globalmodels of direct aerosol radiative forcing do not directlyaccount for ammonium nitrate. Other studies have shownthat increases in NOx emissions could produce sufficient ni-trate aerosol to off-set the expected decline in sulphate ra-diative forcing (Liao et al., 2004, 2006). Moreover, ammo-nium nitrate aerosol exhibits a large hygroscopic growth fac-tor, and its high water uptake for a given relative humiditycould contribute significantly to the total magnitude of theaerosol direct radiative forcing (Bauer et al., 2007). Aircraftmeasurements made above the Po Valley, Italy, have previ-ously shown that ammonium nitrate can dominate the sub-micrometre aerosol composition on a regional scale mak-ing a significant contribution to the regional radiative budget(Crosier et al., 2007).
Recently, nitrate aerosol has attracted more attention notonly in relation to global effects, but also in relation to localair quality. In a UK site comparison of data for days withPM10 above the EU 24-h Limit Value of 50µg m−3 withdata from all days, the component showing the greatest ra-tio between high pollution days and all days was fine par-ticle nitrate (Harrison et al., 2003; 2004; Yin and Harrison,2008). Also recently, the contribution of nitrate-rich region-ally transported aerosol to episodes breaching the daily LimitValue was highlighted (Charron et al., 2007). Nitrate aerosol,with its strongly bound water, accounted for on average 39%of PM10, and 46% of PM2.5 during episode conditions wherethe PM10 concentrations exceeded the EU 24-h Limit Value(Yin and Harrison, 2008). In Utah (USA), PM2.5 concen-trations were dominated by the formation of ammonium ni-trate, accounting for over 50% of the non-refractory aerosolmatter throughout the study and 80% on the highest pollu-tion days (Silva et al., 2007). These findings suggest thatinternational abatement of secondary aerosol precursors maybe the most effective measure to fulfill the requirements ofthe European Directive 1999/30/CE by lowering the regionalbackground. In spite of its importance, there have been fewstudies of the formation of nitrate aerosol in the nocturnal at-mosphere. Moreover, there is very little information on thechemical composition and the mixing state of nitrate aerosol.Brown et al. (2006) for example reported aircraft measure-ments showing that the N2O5 uptake coefficient on aerosol
particles is highly variable and depends strongly on aerosolcomposition. Brown et al show that the uptake coefficient ofN2O5 to a mixed sulphate-organic aerosol is very dependenton the sulphate content and its acidity.
In recent years aerosol mass spectrometry has becomeavailable as a powerful tool for the on-line chemical char-acterization of individual aerosol particles (Murphy, 2007;Noble and Prather, 2000) or small aerosol ensembles (Cana-garatna et al., 2007). Here we report the measurement andcharacterization of aerosol particles detected in an urbanbackground location in London by using two types of on-lineaerosol mass spectrometers, i.e. C-ToF-AMS and ATOFMS,as well as a variety of other on-line aerosol instrumentation.
This paper investigates the characteristics of nitrate-containing aerosols detected in an urban background lo-cation, including aerosols locally produced and regionallytransported. Moreover, their mass loading, size distributions,mixing state and diurnal variation will be presented and dis-cussed.
2 Experimental
2.1 Aerosol sampling
Sampling took place in Regents Park, one of the Royal Parksof London between the 4 and the 22 October 2006. RegentsPark is located in the northern part of central London. Thepark has an outer ring road called the Outer Circle (4.3 km)and an inner ring road called the Inner Circle. Apart fromtwo link roads between these two, the park is reserved forpedestrians. The 487 acre (about 2 km2) park is mainly openparkland. The sampling site chosen was inside the inner cir-cle, in an open area usually reserved for parking and garden-ing purposes. All the instruments were housed in a mobilelaboratory.
The site was operated as part of a UK experiment calledREPARTEE-I (Regent’s Park and Tower Environmental Ex-periment) aiming to study atmospheric chemical processes,and particularly those affecting atmospheric aerosol, in Lon-don. Other papers are also submitted (Dall’Osto et al., 2009)or in preparation.
Meteorological, gas-phase and aerosol measurementswere conducted from the top of a 10 m high tower con-structed on site. To minimize sampling losses, air was drawndown a vertical sample pipe approximately 150 mm in di-ameter, which allowed air to be drawn from above the sur-rounding tree line. Air was sub-sampled from the main sam-ple flow in an iso-kinetic manner through a 40 mm diame-ter stainless steel pipe with a knife edge forward facing tip,and was taken via a gentle 90◦ bend into the air conditionedmobile laboratory. At 293 K and assuming a gas densityof 1.2 kg m−3, the Reynolds number for the sub-sample is∼1,400 indicating laminar flow. Pui et al. (1987) derivedtransport efficiency for particles travelling through such a
Atmos. Chem. Phys., 9, 3709–3720, 2009 www.atmos-chem-phys.net/9/3709/2009/
M. Dall’Osto et al.: Characterization of nitrate aerosols 3711
bend based on a fit to data. Using their fit suggests that par-ticles as large as 20–30µm will be transmitted with nearly100% efficiency. A similar result is obtained from the sim-plified Crane and Evans (1977) model. It must be stressedthat these fits and models are approximations and can onlybe used as such. They do however suggest that large parti-cles will be sampled efficiently by the sub-sampling system.
Local meteorological conditions were measured by hu-midity and temperature probes, and a sonic anemometerwhich measured the 3-D wind field at the sampling site.
2.2 Instrumentation
Two on-line aerosol mass spectrometers were operated at themeasurement site, an ATOFMS (Model 3800-100, TSI, Inc.)and a C-ToF-AMS (Aerodyne Research, Inc.).
The ATOFMS collects bipolar mass spectra of individ-ual aerosol particles. Ambient aerosol is focused into anarrow particle beam for sizes between 100 nm and 3µm.Using a 2-laser velocimeter particle sizes are determinedfrom particle velocity after acceleration into the vacuum.In addition, the light scattered by the particles is used totrigger a pulsed high power desorption and ionization laser(λ=266 nm, 1 mJ/pulse) which evaporates and ionizes theparticle in the centre of the ion source of a bipolar reflectronToF-MS. Thus, a positive and negative ion spectrum of a sin-gle particle are obtained. The mass spectrum is qualitativein that the intensities of the mass spectral peaks are not di-rectly proportional to the component mass but are dependenton the particle matrix, the coupling between the laser andthe particle and the shot to shot semi-variability of the laser.However, the ATOFMS can provide quantitative informationon particle number as a function of composition; providinga measure of all particle components and can be used to as-sess mixing state. The ATOFMS provides information on theabundance of different types of aerosol particles as a functionof particle size with high time resolution (Suess and Prather,1999).
The Aerodyne Time-of-Flight Aerosol Mass Spectrometer(C-ToF-AMS) (Drewnick et al., 2005) focuses aerosol parti-cles in the size range 50–600 nm quantitatively onto a hot sur-face (∼600◦C) using an aerodynamic lens assembly (Jayne etal., 2000). Smaller and larger particles are also collected withlower efficiency. Non-refractory particle components flash-evaporate on the hot surface; the evolving vapour is electronimpact (70 eV) ionized and the ions are transported into anorthogonal extraction ToF-MS for mass analysis. Particlesize information is obtained by chopping the particle beamand collecting mass spectra as a function of particle flighttime. The instrument provides 5-min averages of mass con-centrations of the non-refractory aerosol components as wellas species-resolved size distributions. A detailed descriptionof the instrument and its operation is given in Drewnick etal. (2005). The instrument provides quantitative mass load-ing information on sub-micrometre non refractory compo-
nents using a well characterised series of calibrations anderror estimations (Jimenez et al., 2003; Allan et al., 2003,2004).
The AMS was run under standard operating conditionsand calibrated using 350 nm monodisperse ammonium ni-trate particles, selected using a DMA. Based on the fact thatthe recorded composition was always a mixture of nitrate,sulphate and organics, a collection efficiency of around 0.5was expected, based on the characterisation work of Matthewet al. (2008). This was validated by deriving a total partic-ulate volume concentration (assuming the component den-sities reported by Cross et al., 2008) and comparing witha volume concentration derived from a differential mobil-ity particle sizer (DMPS, Williams et al., 2000), assumingspherical particles and only including particles up to 600 nmin mobility diameter (this is to eliminate particles of an aero-dynamic size too great to be effectively measured using theAMS). When compared, the AMS-derived volume concen-tration is either in good agreement or slightly less than theDMPS-derived equivalent. Given that a certain fraction ofthe submicron particulate volume (such as elemental carbon)is not detected by the AMS, this is the expected behaviour. Acollection efficiency greater than 0.5 would result in periodswhere the MS-derived volume concentration would exceedthat of the DMPS. Although it shows that the CE could nothave exceeded 0.5 for all of the time, it is still possible thatCE was temporally variable and exceeded 0.5 in high nitrateconditions (Matthew et al., 2008).
In addition to the aerosol mass spectrometers a variety ofon-line aerosol instruments was deployed to measure dif-ferent physical characteristics of the ambient aerosol. AMulti-Angle Absorption Photometer (MAAP, Thermo Elec-tron) (Petzold and Schonlinner, 2004) was used to measure1-min averages of the ambient black carbon concentrations.Moreover, (R&P) Dichotomous Partisol-Plus Model 2025sequential air samplers, fitted with PM10 inlets were de-ployed for collecting fine (PM0−2.5) and coarse (PM2.5−10)fractions. A number of other instruments were used duringthe REPARTEE-I campaign but are not listed here since theirdata are not discussed in this paper.
2.3 Data analysis
The ATOFMS was deployed at Regents Park for 19 days,between 4 October 2006 at 17:00 and 22 October 2006 at23:00. In total, 153 595 particles were hit by the ATOFMS.The TSI ATOFMS dataset was imported into YAADA (YetAnother ATOFMS Data Analyzer) and single particle massspectra were grouped with Adaptive Resonance Theory neu-ral network, ART-2a (Song et al., 1999). The parametersused for ART-2a in this experiment were: learning rate 0.05,vigilance factor 0.85, and iterations 20. Further details of theparameters can be found elsewhere (Dall’Osto and Harrison,2006; Rebotier and Prather, 2007). An ART-2a area matrix(AM) of a particle cluster represents the average intensity for
www.atmos-chem-phys.net/9/3709/2009/ Atmos. Chem. Phys., 9, 3709–3720, 2009
3712 M. Dall’Osto et al.: Characterization of nitrate aerosols
50
40
30
20
10
0
μg m
-3
5/10 8/10 11/10 14/10 17/10 20/10 23/10
PM2.5 PM2.5-10
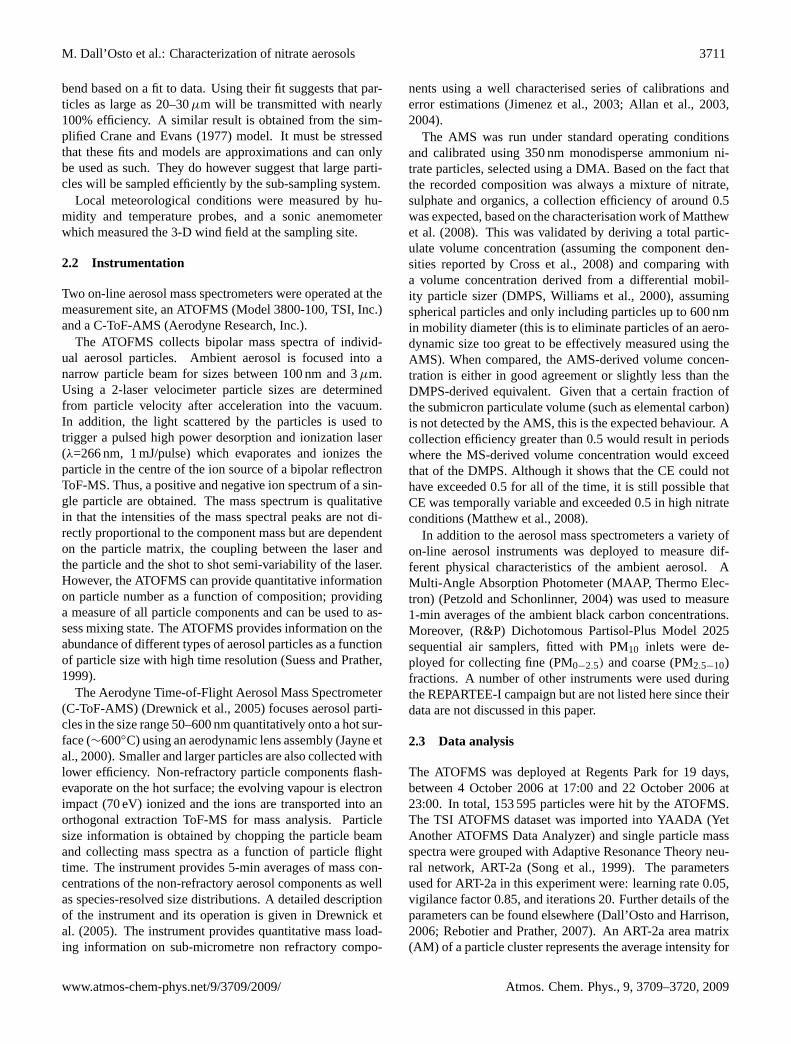
Fig. 1. PM2.5, PM2.5−10 and PM10 daily mean concentrations dur-ing REPARTEE.
eachm/z for all particles within a group. An ART-2a AMtherefore reflects the typical mass spectrum of the particleswithin a group. The ART-2a algorithm generated 306 clus-ters used to describe the dataset. By manually merging sim-ilar clusters (Dall’Osto and Harrison, 2006), the total num-ber of clusters describing the whole database was reducedto about 20. Common particle types including sea salt, soildust, biomass burning and lubricating oil were attributed toother sources. However, the objective of this paper is not topresent an overview of all the ATOFMS classes, but to focuson the nitrate containing aerosol which accounted for about65% of the total particles classified.
3 Results and discussion
3.1 Overview
The weather during the field study was characterized by un-usually warm conditions for the month of October in the UK(temperature 14.1±2.8◦C, relative humidity 82.6±10.7%;mean ±1 s.d. of hourly data) with several small rainfallevents (about a dozen). Back trajectories of the air massesarriving at the measurement site were calculated for 00:00and 12:00 for each day of the campaign, depicting the pathtaken by the air mass reaching the sampling site over the pre-vious five days. The back trajectories were run using theon-line HYSPLIT model (Draxler and Rolph, 2003) devel-oped by the National Oceanic and Atmospheric Administra-tion (NOAA). The predominant origin of air masses arriv-ing at the receptor was westerly, with Atlantic air masses notstrongly influenced by anthropogenic pollution.
However, during two periods, air masses arriving at oursite had previously travelled from the east over Europeanindustrialized regions. Air masses arriving from mainlandEurope (mainly France and Poland) were detected on 10–11October 2006 and on 14–20 October 2006. These two mainperiods were characterised by the highest particulate massloading, as shown in Fig. 1. PM10 reached a maximum con-
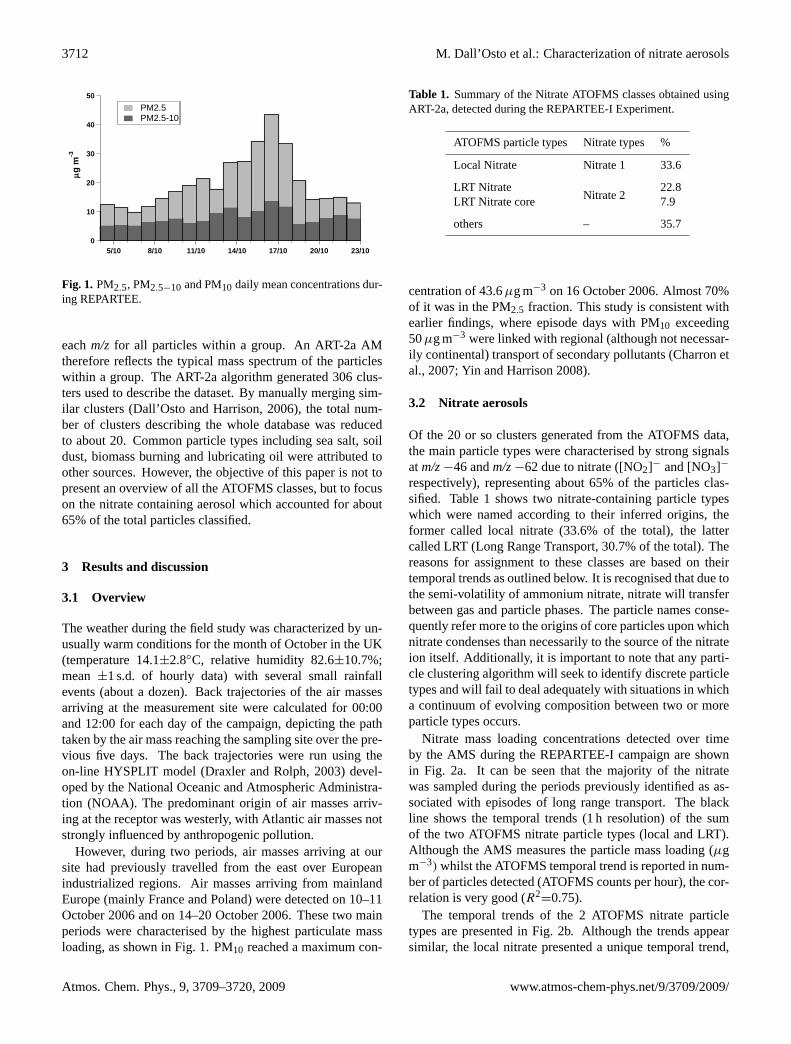
Table 1. Summary of the Nitrate ATOFMS classes obtained usingART-2a, detected during the REPARTEE-I Experiment.
ATOFMS particle types Nitrate types %
Local Nitrate Nitrate 1 33.6
LRT NitrateNitrate 2
22.8LRT Nitrate core 7.9
others – 35.7
centration of 43.6µg m−3 on 16 October 2006. Almost 70%of it was in the PM2.5 fraction. This study is consistent withearlier findings, where episode days with PM10 exceeding50µg m−3 were linked with regional (although not necessar-ily continental) transport of secondary pollutants (Charron etal., 2007; Yin and Harrison 2008).
3.2 Nitrate aerosols
Of the 20 or so clusters generated from the ATOFMS data,the main particle types were characterised by strong signalsat m/z−46 andm/z−62 due to nitrate ([NO2]− and [NO3]−
respectively), representing about 65% of the particles clas-sified. Table 1 shows two nitrate-containing particle typeswhich were named according to their inferred origins, theformer called local nitrate (33.6% of the total), the lattercalled LRT (Long Range Transport, 30.7% of the total). Thereasons for assignment to these classes are based on theirtemporal trends as outlined below. It is recognised that due tothe semi-volatility of ammonium nitrate, nitrate will transferbetween gas and particle phases. The particle names conse-quently refer more to the origins of core particles upon whichnitrate condenses than necessarily to the source of the nitrateion itself. Additionally, it is important to note that any parti-cle clustering algorithm will seek to identify discrete particletypes and will fail to deal adequately with situations in whicha continuum of evolving composition between two or moreparticle types occurs.
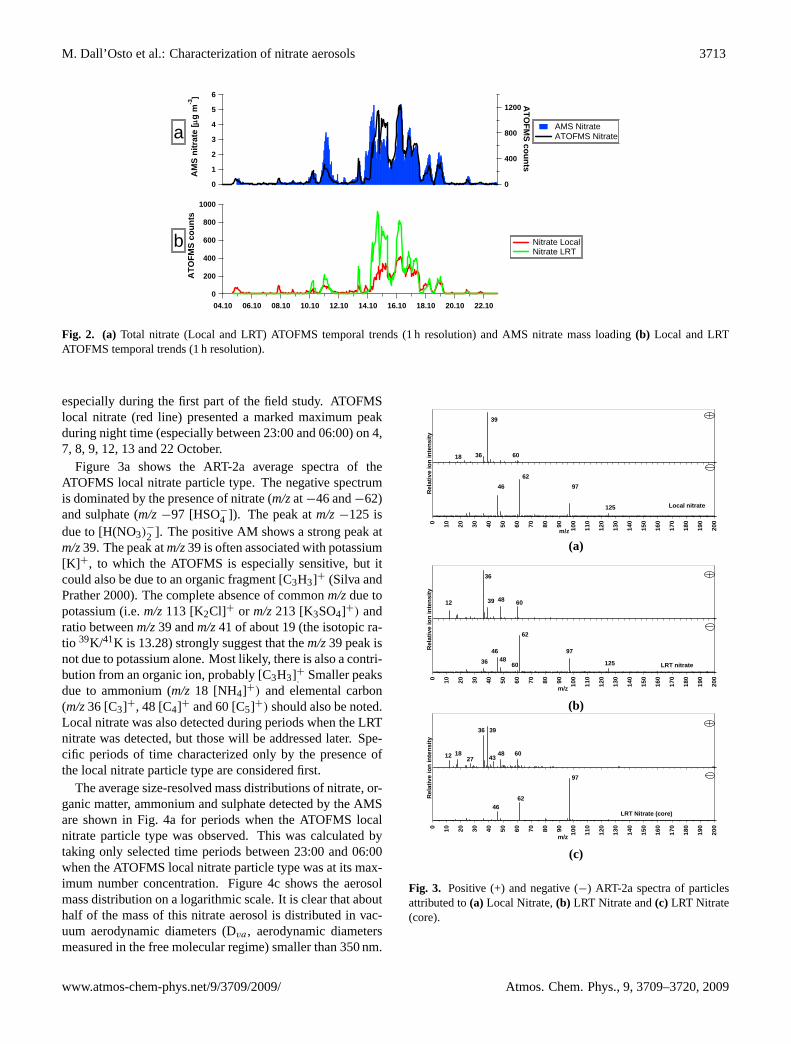
Nitrate mass loading concentrations detected over timeby the AMS during the REPARTEE-I campaign are shownin Fig. 2a. It can be seen that the majority of the nitratewas sampled during the periods previously identified as as-sociated with episodes of long range transport. The blackline shows the temporal trends (1 h resolution) of the sumof the two ATOFMS nitrate particle types (local and LRT).Although the AMS measures the particle mass loading (µgm−3) whilst the ATOFMS temporal trend is reported in num-ber of particles detected (ATOFMS counts per hour), the cor-relation is very good (R2
=0.75).The temporal trends of the 2 ATOFMS nitrate particle
types are presented in Fig. 2b. Although the trends appearsimilar, the local nitrate presented a unique temporal trend,
Atmos. Chem. Phys., 9, 3709–3720, 2009 www.atmos-chem-phys.net/9/3709/2009/
M. Dall’Osto et al.: Characterization of nitrate aerosols 3713
6
5
4
3
2
1
0 A
MS
nitr
ate
[μg
m-3
]
04.10 06.10 08.10 10.10 12.10 14.10 16.10 18.10 20.10 22.10
1200
800
400
0
ATO
FMS counts
1000
800
600
400
200
0
ATO
FMS
coun
ts
AMS Nitrate ATOFMS Nitrate
Nitrate Local Nitrate LRT
a
b
Fig. 2. (a) Total nitrate (Local and LRT) ATOFMS temporal trends (1 h resolution) and AMS nitrate mass loading(b) Local and LRTATOFMS temporal trends (1 h resolution).
especially during the first part of the field study. ATOFMSlocal nitrate (red line) presented a marked maximum peakduring night time (especially between 23:00 and 06:00) on 4,7, 8, 9, 12, 13 and 22 October.
Figure 3a shows the ART-2a average spectra of theATOFMS local nitrate particle type. The negative spectrumis dominated by the presence of nitrate (m/zat−46 and−62)and sulphate (m/z−97 [HSO−
4 ]). The peak atm/z−125 isdue to [H(NO3)
−
2 ]. The positive AM shows a strong peak atm/z39. The peak atm/z39 is often associated with potassium[K] +, to which the ATOFMS is especially sensitive, but itcould also be due to an organic fragment [C3H3]+ (Silva andPrather 2000). The complete absence of commonm/zdue topotassium (i.e.m/z113 [K2Cl]+ or m/z213 [K3SO4]+) andratio betweenm/z39 andm/z41 of about 19 (the isotopic ra-tio 39K/41K is 13.28) strongly suggest that them/z39 peak isnot due to potassium alone. Most likely, there is also a contri-bution from an organic ion, probably [C3H3]+. Smaller peaksdue to ammonium (m/z 18 [NH4]+) and elemental carbon(m/z36 [C3]+, 48 [C4]+ and 60 [C5]+) should also be noted.Local nitrate was also detected during periods when the LRTnitrate was detected, but those will be addressed later. Spe-cific periods of time characterized only by the presence ofthe local nitrate particle type are considered first.
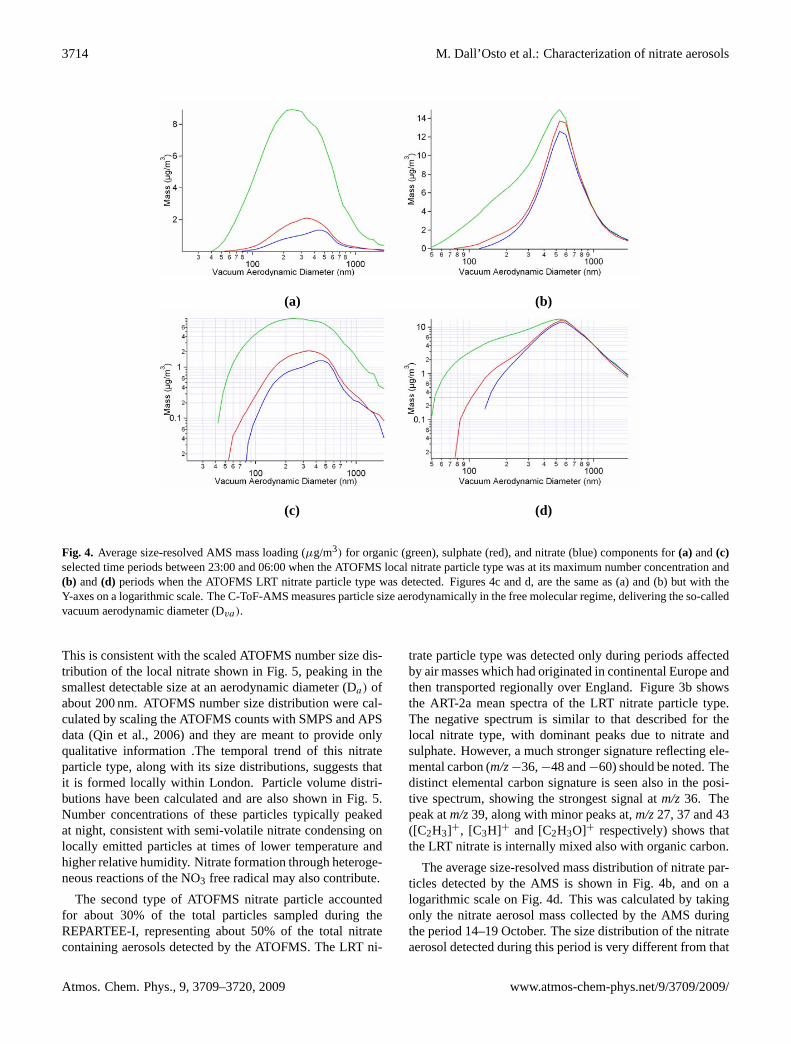
The average size-resolved mass distributions of nitrate, or-ganic matter, ammonium and sulphate detected by the AMSare shown in Fig. 4a for periods when the ATOFMS localnitrate particle type was observed. This was calculated bytaking only selected time periods between 23:00 and 06:00when the ATOFMS local nitrate particle type was at its max-imum number concentration. Figure 4c shows the aerosolmass distribution on a logarithmic scale. It is clear that abouthalf of the mass of this nitrate aerosol is distributed in vac-uum aerodynamic diameters (Dva , aerodynamic diametersmeasured in the free molecular regime) smaller than 350 nm.
m/z
Rel
ativ
e io
n in
tens
ity0 10 20 30 40 50 60 70 80 90 100
110
120
130
140
150
160
170
180
190
200
46
Local nitrate
36
39
9762
125
18 60
(a)
m/z
Rel
ativ
e io
n in
tens
ity0 10 20 30 40 50 60 70 80 90 100
110
120
130
140
150
160
170
180
190
200
48LRT nitrate36
36
48 6039
9746
62
60
12
125
(b)
m/z
Rel
ativ
e io
n in
tens
ity0 10 20 30 40 50 60 70 80 90 100
110
120
130
140
150
160
170
180
190
200
LRT Nitrate (core)
12
36
48 60
39
97
4662
1827 43
(c)
Fig. 3. Positive (+) and negative (−) ART-2a spectra of particlesattributed to(a) Local Nitrate,(b) LRT Nitrate and(c) LRT Nitrate(core).
www.atmos-chem-phys.net/9/3709/2009/ Atmos. Chem. Phys., 9, 3709–3720, 2009
3714 M. Dall’Osto et al.: Characterization of nitrate aerosols
(a) (b)
(c) (d)
Fig. 4. Average size-resolved AMS mass loading (µg/m3) for organic (green), sulphate (red), and nitrate (blue) components for(a) and(c)selected time periods between 23:00 and 06:00 when the ATOFMS local nitrate particle type was at its maximum number concentration and(b) and(d) periods when the ATOFMS LRT nitrate particle type was detected. Figures 4c and d, are the same as (a) and (b) but with theY-axes on a logarithmic scale. The C-ToF-AMS measures particle size aerodynamically in the free molecular regime, delivering the so-calledvacuum aerodynamic diameter (Dva).
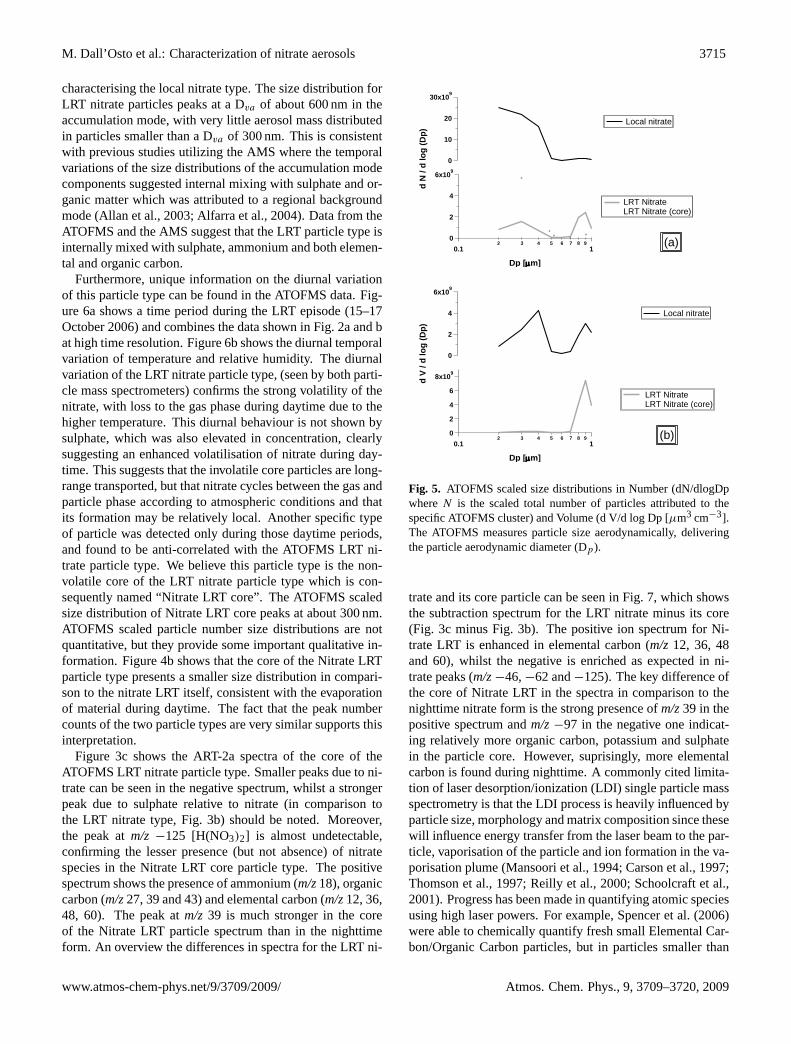
This is consistent with the scaled ATOFMS number size dis-tribution of the local nitrate shown in Fig. 5, peaking in thesmallest detectable size at an aerodynamic diameter (Da) ofabout 200 nm. ATOFMS number size distribution were cal-culated by scaling the ATOFMS counts with SMPS and APSdata (Qin et al., 2006) and they are meant to provide onlyqualitative information .The temporal trend of this nitrateparticle type, along with its size distributions, suggests thatit is formed locally within London. Particle volume distri-butions have been calculated and are also shown in Fig. 5.Number concentrations of these particles typically peakedat night, consistent with semi-volatile nitrate condensing onlocally emitted particles at times of lower temperature andhigher relative humidity. Nitrate formation through heteroge-neous reactions of the NO3 free radical may also contribute.
The second type of ATOFMS nitrate particle accountedfor about 30% of the total particles sampled during theREPARTEE-I, representing about 50% of the total nitratecontaining aerosols detected by the ATOFMS. The LRT ni-
trate particle type was detected only during periods affectedby air masses which had originated in continental Europe andthen transported regionally over England. Figure 3b showsthe ART-2a mean spectra of the LRT nitrate particle type.The negative spectrum is similar to that described for thelocal nitrate type, with dominant peaks due to nitrate andsulphate. However, a much stronger signature reflecting ele-mental carbon (m/z−36,−48 and−60) should be noted. Thedistinct elemental carbon signature is seen also in the posi-tive spectrum, showing the strongest signal atm/z36. Thepeak atm/z39, along with minor peaks at,m/z27, 37 and 43([C2H3]+, [C3H]+ and [C2H3O]+ respectively) shows thatthe LRT nitrate is internally mixed also with organic carbon.
The average size-resolved mass distribution of nitrate par-ticles detected by the AMS is shown in Fig. 4b, and on alogarithmic scale on Fig. 4d. This was calculated by takingonly the nitrate aerosol mass collected by the AMS duringthe period 14–19 October. The size distribution of the nitrateaerosol detected during this period is very different from that
Atmos. Chem. Phys., 9, 3709–3720, 2009 www.atmos-chem-phys.net/9/3709/2009/
M. Dall’Osto et al.: Characterization of nitrate aerosols 3715
characterising the local nitrate type. The size distribution forLRT nitrate particles peaks at a Dva of about 600 nm in theaccumulation mode, with very little aerosol mass distributedin particles smaller than a Dva of 300 nm. This is consistentwith previous studies utilizing the AMS where the temporalvariations of the size distributions of the accumulation modecomponents suggested internal mixing with sulphate and or-ganic matter which was attributed to a regional backgroundmode (Allan et al., 2003; Alfarra et al., 2004). Data from theATOFMS and the AMS suggest that the LRT particle type isinternally mixed with sulphate, ammonium and both elemen-tal and organic carbon.
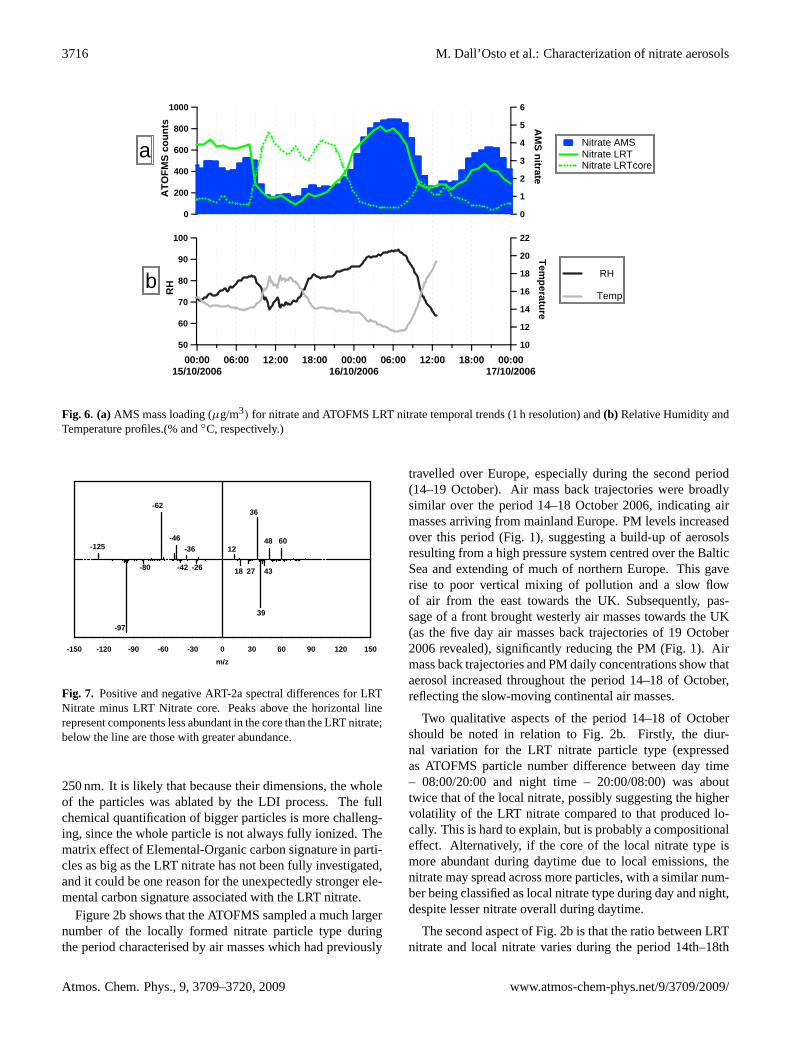
Furthermore, unique information on the diurnal variationof this particle type can be found in the ATOFMS data. Fig-ure 6a shows a time period during the LRT episode (15–17October 2006) and combines the data shown in Fig. 2a and bat high time resolution. Figure 6b shows the diurnal temporalvariation of temperature and relative humidity. The diurnalvariation of the LRT nitrate particle type, (seen by both parti-cle mass spectrometers) confirms the strong volatility of thenitrate, with loss to the gas phase during daytime due to thehigher temperature. This diurnal behaviour is not shown bysulphate, which was also elevated in concentration, clearlysuggesting an enhanced volatilisation of nitrate during day-time. This suggests that the involatile core particles are long-range transported, but that nitrate cycles between the gas andparticle phase according to atmospheric conditions and thatits formation may be relatively local. Another specific typeof particle was detected only during those daytime periods,and found to be anti-correlated with the ATOFMS LRT ni-trate particle type. We believe this particle type is the non-volatile core of the LRT nitrate particle type which is con-sequently named “Nitrate LRT core”. The ATOFMS scaledsize distribution of Nitrate LRT core peaks at about 300 nm.ATOFMS scaled particle number size distributions are notquantitative, but they provide some important qualitative in-formation. Figure 4b shows that the core of the Nitrate LRTparticle type presents a smaller size distribution in compari-son to the nitrate LRT itself, consistent with the evaporationof material during daytime. The fact that the peak numbercounts of the two particle types are very similar supports thisinterpretation.
Figure 3c shows the ART-2a spectra of the core of theATOFMS LRT nitrate particle type. Smaller peaks due to ni-trate can be seen in the negative spectrum, whilst a strongerpeak due to sulphate relative to nitrate (in comparison tothe LRT nitrate type, Fig. 3b) should be noted. Moreover,the peak atm/z −125 [H(NO3)2] is almost undetectable,confirming the lesser presence (but not absence) of nitratespecies in the Nitrate LRT core particle type. The positivespectrum shows the presence of ammonium (m/z18), organiccarbon (m/z27, 39 and 43) and elemental carbon (m/z12, 36,48, 60). The peak atm/z 39 is much stronger in the coreof the Nitrate LRT particle spectrum than in the nighttimeform. An overview the differences in spectra for the LRT ni-
6x10⁹
4
2
0
d N
/ d
lo
g (
Dp
)
0.12 3 4 5 6 7 8 9
1
Dp [m]
30x109
20
10
0
LRT Nitrate LRT Nitrate (core)
Local nitrate
(a)
8x10⁹
6
4
2
0
d V
/ d
lo
g (
Dp
)
0.12 3 4 5 6 7 8 9
1
Dp [m]
6x10⁹
4
2
0
LRT Nitrate LRT Nitrate (core)
Local nitrate
(b)
Fig. 5. ATOFMS scaled size distributions in Number (dN/dlogDpwhereN is the scaled total number of particles attributed to thespecific ATOFMS cluster) and Volume (d V/d log Dp [µm3 cm−3].The ATOFMS measures particle size aerodynamically, deliveringthe particle aerodynamic diameter (Dp).
trate and its core particle can be seen in Fig. 7, which showsthe subtraction spectrum for the LRT nitrate minus its core(Fig. 3c minus Fig. 3b). The positive ion spectrum for Ni-trate LRT is enhanced in elemental carbon (m/z12, 36, 48and 60), whilst the negative is enriched as expected in ni-trate peaks (m/z−46,−62 and−125). The key difference ofthe core of Nitrate LRT in the spectra in comparison to thenighttime nitrate form is the strong presence ofm/z39 in thepositive spectrum andm/z−97 in the negative one indicat-ing relatively more organic carbon, potassium and sulphatein the particle core. However, suprisingly, more elementalcarbon is found during nighttime. A commonly cited limita-tion of laser desorption/ionization (LDI) single particle massspectrometry is that the LDI process is heavily influenced byparticle size, morphology and matrix composition since thesewill influence energy transfer from the laser beam to the par-ticle, vaporisation of the particle and ion formation in the va-porisation plume (Mansoori et al., 1994; Carson et al., 1997;Thomson et al., 1997; Reilly et al., 2000; Schoolcraft et al.,2001). Progress has been made in quantifying atomic speciesusing high laser powers. For example, Spencer et al. (2006)were able to chemically quantify fresh small Elemental Car-bon/Organic Carbon particles, but in particles smaller than
www.atmos-chem-phys.net/9/3709/2009/ Atmos. Chem. Phys., 9, 3709–3720, 2009
3716 M. Dall’Osto et al.: Characterization of nitrate aerosols
6
5
4
3
2
1
0
AM
S nitrate
00:0015/10/2006
06:00 12:00 18:00 00:0016/10/2006
06:00 12:00 18:00 00:0017/10/2006
1000
800
600
400
200
0
ATO
FMS
coun
ts
100
90
80
70
60
50
RH
22
20
18
16
14
12
10
Temperature
Nitrate AMS Nitrate LRT Nitrate LRTcore
RH
Temp
a
b
Fig. 6. (a)AMS mass loading (µg/m3) for nitrate and ATOFMS LRT nitrate temporal trends (1 h resolution) and(b) Relative Humidity andTemperature profiles.(% and◦C, respectively.)
-150 -120 -90 -60 -30 0 30 60 90 120 150m/z
-125
-62
-46-36
-97
-80
12
36
48 60
39
18 27 43-26-42
Fig. 7. Positive and negative ART-2a spectral differences for LRTNitrate minus LRT Nitrate core. Peaks above the horizontal linerepresent components less abundant in the core than the LRT nitrate;below the line are those with greater abundance.
250 nm. It is likely that because their dimensions, the wholeof the particles was ablated by the LDI process. The fullchemical quantification of bigger particles is more challeng-ing, since the whole particle is not always fully ionized. Thematrix effect of Elemental-Organic carbon signature in parti-cles as big as the LRT nitrate has not been fully investigated,and it could be one reason for the unexpectedly stronger ele-mental carbon signature associated with the LRT nitrate.
Figure 2b shows that the ATOFMS sampled a much largernumber of the locally formed nitrate particle type duringthe period characterised by air masses which had previously
travelled over Europe, especially during the second period(14–19 October). Air mass back trajectories were broadlysimilar over the period 14–18 October 2006, indicating airmasses arriving from mainland Europe. PM levels increasedover this period (Fig. 1), suggesting a build-up of aerosolsresulting from a high pressure system centred over the BalticSea and extending of much of northern Europe. This gaverise to poor vertical mixing of pollution and a slow flowof air from the east towards the UK. Subsequently, pas-sage of a front brought westerly air masses towards the UK(as the five day air masses back trajectories of 19 October2006 revealed), significantly reducing the PM (Fig. 1). Airmass back trajectories and PM daily concentrations show thataerosol increased throughout the period 14–18 of October,reflecting the slow-moving continental air masses.
Two qualitative aspects of the period 14–18 of Octobershould be noted in relation to Fig. 2b. Firstly, the diur-nal variation for the LRT nitrate particle type (expressedas ATOFMS particle number difference between day time– 08:00/20:00 and night time – 20:00/08:00) was abouttwice that of the local nitrate, possibly suggesting the highervolatility of the LRT nitrate compared to that produced lo-cally. This is hard to explain, but is probably a compositionaleffect. Alternatively, if the core of the local nitrate type ismore abundant during daytime due to local emissions, thenitrate may spread across more particles, with a similar num-ber being classified as local nitrate type during day and night,despite lesser nitrate overall during daytime.
The second aspect of Fig. 2b is that the ratio between LRTnitrate and local nitrate varies during the period 14th–18th
Atmos. Chem. Phys., 9, 3709–3720, 2009 www.atmos-chem-phys.net/9/3709/2009/
M. Dall’Osto et al.: Characterization of nitrate aerosols 3717
(a) (b)
(c) (d)
1
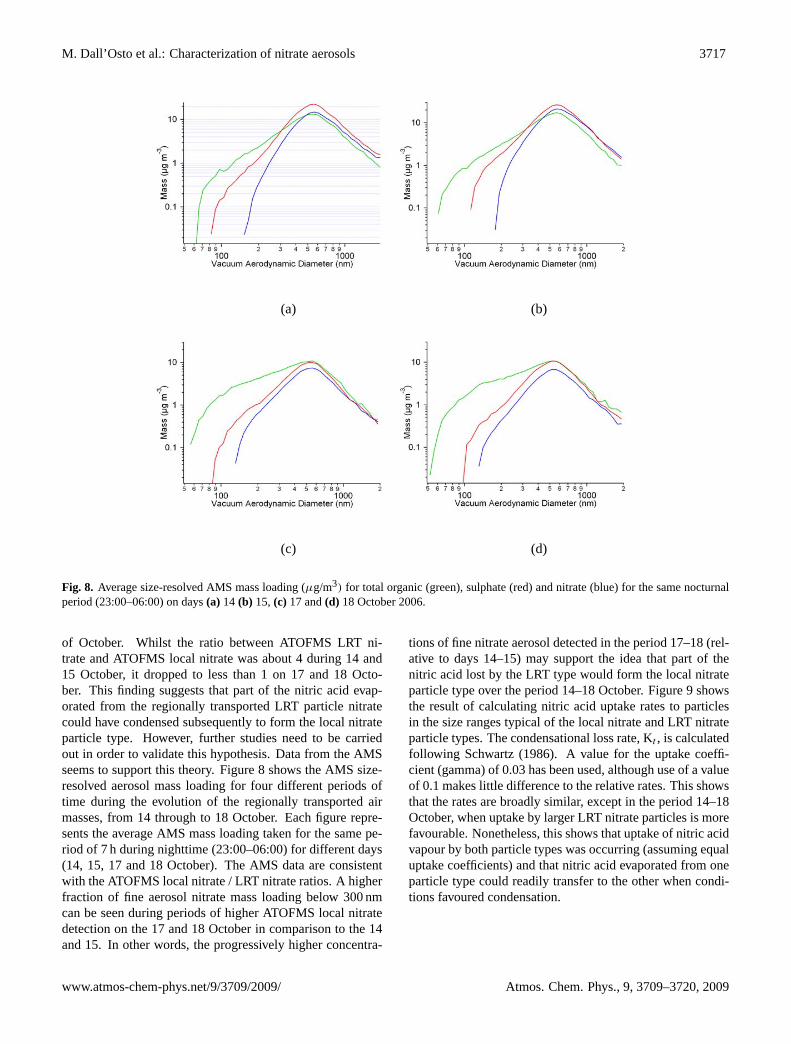
Fig. 8. Average size-resolved AMS mass loading (µg/m3) for total organic (green), sulphate (red) and nitrate (blue) for the same nocturnalperiod (23:00–06:00) on days(a) 14 (b) 15, (c) 17 and(d) 18 October 2006.
of October. Whilst the ratio between ATOFMS LRT ni-trate and ATOFMS local nitrate was about 4 during 14 and15 October, it dropped to less than 1 on 17 and 18 Octo-ber. This finding suggests that part of the nitric acid evap-orated from the regionally transported LRT particle nitratecould have condensed subsequently to form the local nitrateparticle type. However, further studies need to be carriedout in order to validate this hypothesis. Data from the AMSseems to support this theory. Figure 8 shows the AMS size-resolved aerosol mass loading for four different periods oftime during the evolution of the regionally transported airmasses, from 14 through to 18 October. Each figure repre-sents the average AMS mass loading taken for the same pe-riod of 7 h during nighttime (23:00–06:00) for different days(14, 15, 17 and 18 October). The AMS data are consistentwith the ATOFMS local nitrate / LRT nitrate ratios. A higherfraction of fine aerosol nitrate mass loading below 300 nmcan be seen during periods of higher ATOFMS local nitratedetection on the 17 and 18 October in comparison to the 14and 15. In other words, the progressively higher concentra-
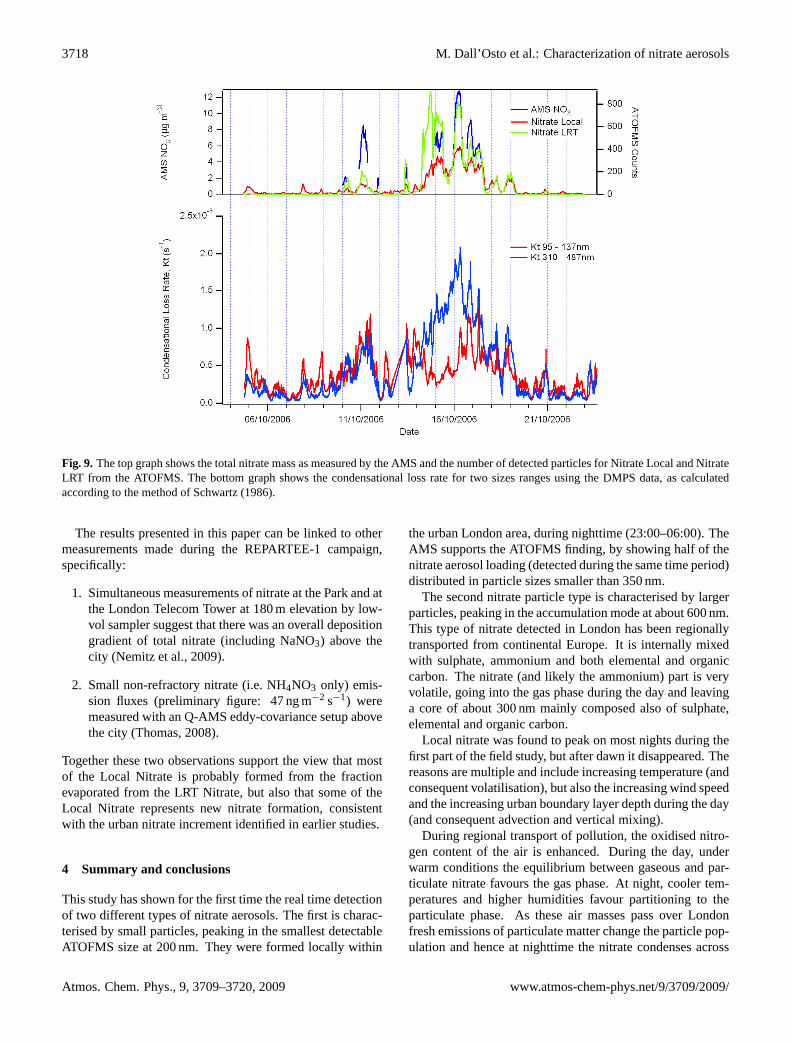
tions of fine nitrate aerosol detected in the period 17–18 (rel-ative to days 14–15) may support the idea that part of thenitric acid lost by the LRT type would form the local nitrateparticle type over the period 14–18 October. Figure 9 showsthe result of calculating nitric acid uptake rates to particlesin the size ranges typical of the local nitrate and LRT nitrateparticle types. The condensational loss rate, Kt , is calculatedfollowing Schwartz (1986). A value for the uptake coeffi-cient (gamma) of 0.03 has been used, although use of a valueof 0.1 makes little difference to the relative rates. This showsthat the rates are broadly similar, except in the period 14–18October, when uptake by larger LRT nitrate particles is morefavourable. Nonetheless, this shows that uptake of nitric acidvapour by both particle types was occurring (assuming equaluptake coefficients) and that nitric acid evaporated from oneparticle type could readily transfer to the other when condi-tions favoured condensation.
www.atmos-chem-phys.net/9/3709/2009/ Atmos. Chem. Phys., 9, 3709–3720, 2009
3718 M. Dall’Osto et al.: Characterization of nitrate aerosols
Fig. 9. The top graph shows the total nitrate mass as measured by the AMS and the number of detected particles for Nitrate Local and NitrateLRT from the ATOFMS. The bottom graph shows the condensational loss rate for two sizes ranges using the DMPS data, as calculatedaccording to the method of Schwartz (1986).
The results presented in this paper can be linked to othermeasurements made during the REPARTEE-1 campaign,specifically:
1. Simultaneous measurements of nitrate at the Park and atthe London Telecom Tower at 180 m elevation by low-vol sampler suggest that there was an overall depositiongradient of total nitrate (including NaNO3) above thecity (Nemitz et al., 2009).
2. Small non-refractory nitrate (i.e. NH4NO3 only) emis-sion fluxes (preliminary figure: 47 ng m−2 s−1) weremeasured with an Q-AMS eddy-covariance setup abovethe city (Thomas, 2008).
Together these two observations support the view that mostof the Local Nitrate is probably formed from the fractionevaporated from the LRT Nitrate, but also that some of theLocal Nitrate represents new nitrate formation, consistentwith the urban nitrate increment identified in earlier studies.
4 Summary and conclusions
This study has shown for the first time the real time detectionof two different types of nitrate aerosols. The first is charac-terised by small particles, peaking in the smallest detectableATOFMS size at 200 nm. They were formed locally within
the urban London area, during nighttime (23:00–06:00). TheAMS supports the ATOFMS finding, by showing half of thenitrate aerosol loading (detected during the same time period)distributed in particle sizes smaller than 350 nm.
The second nitrate particle type is characterised by largerparticles, peaking in the accumulation mode at about 600 nm.This type of nitrate detected in London has been regionallytransported from continental Europe. It is internally mixedwith sulphate, ammonium and both elemental and organiccarbon. The nitrate (and likely the ammonium) part is veryvolatile, going into the gas phase during the day and leavinga core of about 300 nm mainly composed also of sulphate,elemental and organic carbon.
Local nitrate was found to peak on most nights during thefirst part of the field study, but after dawn it disappeared. Thereasons are multiple and include increasing temperature (andconsequent volatilisation), but also the increasing wind speedand the increasing urban boundary layer depth during the day(and consequent advection and vertical mixing).
During regional transport of pollution, the oxidised nitro-gen content of the air is enhanced. During the day, underwarm conditions the equilibrium between gaseous and par-ticulate nitrate favours the gas phase. At night, cooler tem-peratures and higher humidities favour partitioning to theparticulate phase. As these air masses pass over Londonfresh emissions of particulate matter change the particle pop-ulation and hence at nighttime the nitrate condenses across
Atmos. Chem. Phys., 9, 3709–3720, 2009 www.atmos-chem-phys.net/9/3709/2009/
M. Dall’Osto et al.: Characterization of nitrate aerosols 3719
both populations of particles, processing the fresh particu-late matter. In addition, NOx is emitted over the urban air-shed and can form nitrate rapidly through NO3 and N2O5.This rapid conversion enhances the available nitrate and mayadd significantly to the nitrate available for condensation,enhancing night-time concentrations compared to those ob-served in the day. The role of the NO3 radical pathway com-pared to daytime processing of NO2 by OH in particulatenitrate formation needs to be quantified.
Acknowledgements.This research was supported by the UK Nat-ural Environment Research Council as part of the programme ofthe National Centre for Atmospheric Science and through the CityFlux project. The authors are grateful also to the BOC Foundationfor financial support of campaign expenses and to British Telecomand the Royal Parks for facilitating access to measurement sites.The assistance of Alistair Thorpe in the field measurements is alsogratefully acknowledged.
Edited by: E. Nemitz
References
Abdalmogith, S. S. and Harrison R. M..: An analysis of spatial andtemporal properties of daily sulphate, nitrate and chloride con-centrations at UK urban and rural sites, J. Environ. Monitor., 8,691–699, 2006a.
Abdalmogith, S. S., Harrison, R. M., and Derwent, R. G.: Partic-ulate sulphate and nitrate in southern England and Northern Ire-land during 2002/3 and its formation in a photochemical trajec-tory model, Sci. Total. Environ., 368, 769–780, 2006b.
Abdalmogith, S. S. and Harrison, R. M.: The use of trajectory clus-ter analysis to examine the long-range transport of secondaryinorganic aerosol in the UK, Atmos. Environ., 39, 6686–6695,2005.
Adams, P. J., Seinfeld, J. H., Koch, D., Mickley, L., and Jacob, D.:General circulation model assessment of direct radiative forcingby the sulfate-nitrate-ammonium-water inorganic aerosol sys-tem, J. Geophys. Res.-Atmos., 106(D1), 1097–1111, 2001.
Alfarra, M. R., Coe, H., Allan, J. D., Bower, K. N., Boudries, H.,Canagaratna, M. R., Jimenez, J. L., Jayne, J. T., Garforth, A.A., Li, S. M., and Worsnop, D. R.: Characterization of urbanand rural organic particulate in the lower Fraser valley using twoaerodyne aerosol mass spectrometers, Atmos. Environ., 38(34),5745–5758, 2004.
Allan, J. D., Alfarra, M. R., Bower, K. N., Williams, P. I., Gal-lagher, M. W., Jimenez, J. L., McDonald, A. G., Nemitz, E.,Canagaratna, M. R., Jayne, J. T., Coe, H., and Worsnop, D. R.:Quantitative sampling using an aerodyne aerosol mass spectrom-eter: 2. Measurements of fine particulate chemical compositionin two UK cities (108, 4091, 2003), J. Geophys.Res.-Atmos.,108(D9), 4091, doi:10.1029/2002JD002359, 2003.
Allan, J. D., Coe, H., Bower, K. N., Alfarra, M. R., Delia, A. E.,Jimenez, J. L., Middlebrook, A. M., Drewnick, F., Onasch, T. B.,Canagaratna, M. R., Jayne, J. T., and Worsnop, D. R.: Technicalnote: Extraction of chemically resolved mass spectra from aero-dyne aerosol mass spectrometer data, J. Aerosol Sci., 35, 909–922, 2004.
Allen, A. G., Harrison, R. M., and Erisman, J. W.: Field measure-ments of the dissociation of ammonium nitrate and ammoniumchloride aerosols, Atmos. Environ., 23, 1591–1599, 1989
Bauer, S. E., Koch, D., Unger, N., Metzger, S. M., Shindell, D.T., and Streets, D. G.: Nitrate aerosols today and in 2030: aglobal simulation including aerosols and tropospheric ozone, At-mos. Chem. Phys., 7, 5043–5059, 2007,http://www.atmos-chem-phys.net/7/5043/2007/.
Bouwman, A. F., Lee, D. S., Asman, W. A. H., Dentener, F.J., VanderHoek, K. W., and Olivier, J. G. J.: A global high-resolution emission inventory for ammonia, Global Biogeochem.Cy., 11(4), 561–587, 1997.
Brown, S. S., Ryerson, T. B., Wollny, A. G., Brock, C. A., Peltier, R.Sullivan, A. P., Weber, R. J., Dube, W. P., Trainer, M., Meagher,J. F., Fehsenfeld, F. C., and Ravishankara, A. R.: Variability innocturnal nitrogen oxide processing and its role in regional airquality, Science, 311(5757), 67–70, 2006.
Canagaratna, M. R., Jayne, J. T., Jimenez, J. L., Allan, J. D., Al-farra, M. R., Zhang, Q., Onasch, T. B., Drewnick, F., Coe, H.,Middlebrook, A., Delia, A., Williams, L. R., Trimborn, A. M.,Northway, M. J., DeCarlo, P. F., Kolb, C. E., Davidovits, P., andWorsnop, D. R.: Chemical and microphysical characterizationof ambient aerosols with the aerodyne aerosol mass spectrome-ter, Mass Spectrom. Rev., 26(2), 185–222, 2007.
Carslaw, N., Carpenter, L., Plane, J. M. C., Allan, B., Burgess, R.A., Clemitshaw, K. C., Coe, H., and Penkett, S. A.: Simultaneousmeasurements of nitrate and peroxy radicals in the marine bound-ary layer, J. Geophys. Res., 102, (D15), 18917–18933, 1997.
Carson, P. G., Johnston, M. V., and Wexler, A. S.: Laser des-orption/ionization of ultrafine aerosol particles, Rapid Commun.Mass Sp., 11(9), 993–996, 1997.
Charron, A., Harrison, R. M., and Quincey, P.: What are the sourcesand conditions responsible for exceedences of the 24 h PM10limit value (50µg m-3) at a heavily trafficked London site?, At-mos. Environ., 41(9), 1960–1975, 2007.
Cozic, J., Verheggen, B., Mertes, S., Connolly, P., Bower, K., Pet-zold, A., Baltensperger, U., and Weingartner, E.: Scavengingof black carbon in mixed phase clouds at the high alpine siteJungfraujoch, Atmos. Chem. Phys., 7, 1797–1807, 2007,http://www.atmos-chem-phys.net/7/1797/2007/.
Crane, R. I. and Evans, R. L.: Inertial deposition of particles in abent pipe, J. Aerosol Sci., 8, 161–170, 1977.
Crosier, J., Allan, J. D., Coe, H., Bower, K. N., Formenti, P., andWilliams, P. I.: Chemical composition of summertime aerosol inthe Po Valley (Italy), northern Adriatic and Black Sea, Q. J. Roy.Meteor. Soc., 133, 61–75, 2007.
Cross, E. S., Slowik, J. G., Davidovits, P., Allan, J. D., Worsnop, D.R., Jayne, J. T., Lewis, D. K., Canagaratna, M., and Onasch, T.B.: Laboratory and ambient particle density determinations usinglight scattering in conjunction with aerosol mass spectrometry,Aerosol Sci. Tech., 41(4), 343–359, 2007.
Dall’Osto, M. and Harrison, R. M.: Chemical characterisation ofsingle airborne particles in Athens (Greece) by ATOFMS, At-mos. Environ., 40, 7614–7631, 2006.
Dall’Osto, M., Harrison, R. M., Coe, H., and Williams, P.: Real-time secondary aerosol formation during a fog event in London,Atmos. Chem. Phys., 9, 2459–2469, 2009,http://www.atmos-chem-phys.net/9/2459/2009/.
Draxler, R. R. and Rolph, G. D.: HYSPLIT (Hybrid Single-Particle
www.atmos-chem-phys.net/9/3709/2009/ Atmos. Chem. Phys., 9, 3709–3720, 2009
3720 M. Dall’Osto et al.: Characterization of nitrate aerosols
Lagrangian Integrated Trajectory) model access via NOAA ARLREADY website (http://www.arl.noaa.gov/ready/hysplit4.html),NOAA Air Resources Laboratory, Silver Spring, MD.
Drewnick, F., Hings, S. S., DeCarlo, P., Jayne, J. T., Gonin, M.,Fuhrer, K., Weimer, S., Jimenez, J. L., Demerjian, K. L., Bor-rmann, S., Worsnop, D. R.: A new Time-of-Flight Aerosol MassSpectrometer (TOF-AMS) – instrument description and first fielddeployment, Aerosol Sci. Tech., 39, 637–658, 2005.
Hallquist, M., Stewart, D. J., Stephenson, S. K., and Cox, R. A.:Hydrolysis of N2O5 on sub-micron sulfate aerosols, Phys. Chem.Chem. Phys., 5(16), 3453–3463, 2003.
Harrison, R. M., Jones, A. M. and Lawrence, R. G.: A pragmaticmass closure model for airborne particulate matter at urban back-ground and roadside sites, Atmos. Environ., 37(35), 4927–4933,2003.
Harrison, R. M., Jones, A. M., and Lawrence, R. G.: Major compo-nent composition of PM10 and PM2.5 from roadside and urbanbackground sites, Atmos. Environ., 38(27), 4531–4538, 2004.
Jayne, J. T., Leard, D. C., Zhang, X. F., Davidovits, P., Smith, K.A., Kolb, C. E., and Worsnop, D. R.: Development of an aerosolmass spectrometer for size and composition analysis of submi-cron particles, Aerosol Sci. Tech., 33(1–2), 49–70, 2000.
Liao, H., Chen, W. T., and Seinfeld, J. H.: Role of cli-mate change in global predictions of future tropospheric ozoneand aerosols, J. Geophys. Res.-Atmos., 111(D12), D1230,doi:10.1029/2005JD006852, 2006.
Liao, H., Seinfeld, J. H., Adams, P. J., and Mickley, L. J.: Globalradiative forcing of coupled tropospheric ozone and aerosols ina unified general circulation model, J. Geophys. Res.-Atmos.,109(D16), D24204, doi:10.1029/2004JD005476, 2004.
Mansoori, B. A., Johnston, M. V., and Wexler, A. S.: Quantitationof ionic species in single microdroplets by online laser desorp-tion/ionization, Anal. Chem., 66(21), 3681–3687, 1994.
Matthew, B. M., Middlebrook, A. M., and Onasch, T. B.: Collec-tion efficiencies in an Aerodyne Aerosol Mass Spectrometer asa function of particle phase for laboratory generated aerosols,Aerosol Sci. Tech., 42(11), 884–898, 2008.
Mentel, T. F., Sohn, M., and Wahner, A.: Nitrate effect in the hetero-geneous hydrolysis of dinitrogen pentoxide on aqueous aerosols,Phys. Chem. Chem. Phys., 1(24), 5451–5457, 1999.
Murphy, D. M.: The design of single particle laser mass spectrom-eters, Mass Spectrom. Rev., 26(2), 150–165, 2007.
Nemitz, E., Phillips G. J., Dall’Osto, M., Harrison, R. M., Williams,P. I., and Coe, H.: Concentrations and Fluxes of Inorganic Re-active Gases and Aerosols above London, Atmos. Chem. Phys.Discuss., in preparation, 2009.
Noble, C. A. and Prather, K. A.: Real-time single particle massspectrometry: A historical review of a quarter century of thechemical analysis of aerosols, Mass Spectrom. Rev., 19(4), 248–274, 2000.
Qin, X. Y., Bhave, P. V., and Prather, K. A.: Comparison of twomethods for obtaining quantitative mass concentrations fromaerosol time-of-flight mass spectrometry measurements, Anal.Chem., 78(17), 6169–6178, 2006.
Petzold, A. and Schonlinner, K.: Multi-angle absorption photome-try – a new method for the measurement of aerosol light absorp-tion and atmospheric black carbon, Aerosol Sci., 35, 421–441,2004.
Pui, D. Y. H., Romay-Novas, F., and Liu, B. Y. H.: Experimentalstudy of particle deposition in bends of circular cross section,Aerosol Sci. Tech., 7, 301–15, 1987.
Rebotier, T. P. and Prather, K. A.: Aerosol time-of-flight mass spec-trometry data analysis: A benchmark of clustering algorithms,Anal. Chim. Acta, 585(1), 38–54, 2007.
Reilly, P. T. A., Lazar, A. C., Gieray, R. A., Whitten, W. B., andRamsey, J. M.: The elucidation of charge-transfer-induced ma-trix effects in environmental aerosols via real-time aerosol massspectral analysis of individual airborne particles, Aerosol Sci.Tech., 33(1–2), 135–152, 2000
Schoolcraft, T. A., Constable, G. S., Jackson, B., Zhigilei, L. V., andGarrison, B. J.: Molecular dynamics simulations of laser disinte-gration of amorphous aerosol particles with spatially nonuniformabsorption, Nucl. Instrum. Meth. A, 180, 245–250, 2001.
Silva, P. J. and Prather, K. A.: Interpretation of mass spectra fromorganic compounds in aerosol time-of-flight mass spectrometry,Anal. Chem., 72(15), 3553–3562, 2000.
Silva, P. J., Vawdrey, E. L., Corbett, M., and Erupe, M.: Fineparticle concentrations and composition during wintertime in-versions in Logan, Utah, USA, Atmos. Environ., 41(26), 5410–5422, 2007.
Song, X. H., Hopke, P. K., Fergenson, D. P., and Prather, K. A.:Classification of single particles analyzed by ATOFMS using anartificial neural network, ART-2A, Anal. Chem., 71(4), 860–865,1999.
Spencer, M. T., Shields, L. G., Sodeman, D. A., Toner, S. M., andPrather, K. A.: Comparison of oil and fuel particle chemical sig-natures with particle emissions from heavy and light duty vehi-cles, Atmos. Environ., 40(27), 5224–5235, 2006.
Suess, D. T. and Prather, K. A.: Mass spectrometry of aerosols,Chem. Rev., 99(10), 3007–3035, 1999.
Thomas, R. M.: Measurement of Speciated Aerosol Fluxes, PhDthesis, University of Manchester, 2007.
Thomson, D. S., Middlebrook, A. M., and Murphy, D. M.: Thresh-olds for laser-induced ion formation from aerosols in a vac-uum using ultraviolet and vacuum-ultraviolet laser wavelengths,Aerosol Sci. Tech., 26(6), 544–559, 1997.
Williams, P. I., Gallagher, M. W., Choularton, T. W., Coe, H.,Bower, K. N., and McFiggans, G.: Aerosol development and in-teraction in an urban plume, Aerosol Sci. Tech., 32(2), 120–126,2000.
Yin, J. and Harrison, R. M.: Pragmatic mass closure study forPM1.0, PM2.5 and PM10 at roadside, urban background and ruralsites, Atmos. Environ., 42(5), 980, 2008.
Atmos. Chem. Phys., 9, 3709–3720, 2009 www.atmos-chem-phys.net/9/3709/2009/