polynomial functions and basic graphs guidelines for ... · pdf filesection 2.2 polynomial...
TRANSCRIPT
SECTION 2.2 Polynomial Functions
MATH 1330 Precalculus 171
Section 2.2: Polynomial Functions
Polynomial Functions and Basic Graphs
Guidelines for Graphing Polynomial Functions
Polynomial Functions and Basic Graphs
Polynomials:
CHAPTER 2 Polynomial and Rational Functions
University of Houston Department of Mathematics 172
Degree of a Polynomial:
Example:
SECTION 2.2 Polynomial Functions
MATH 1330 Precalculus 173
Solution:
CHAPTER 2 Polynomial and Rational Functions
University of Houston Department of Mathematics 174
Definition of a Polynomial Function:
Examples of Polynomial Functions:
SECTION 2.2 Polynomial Functions
MATH 1330 Precalculus 175
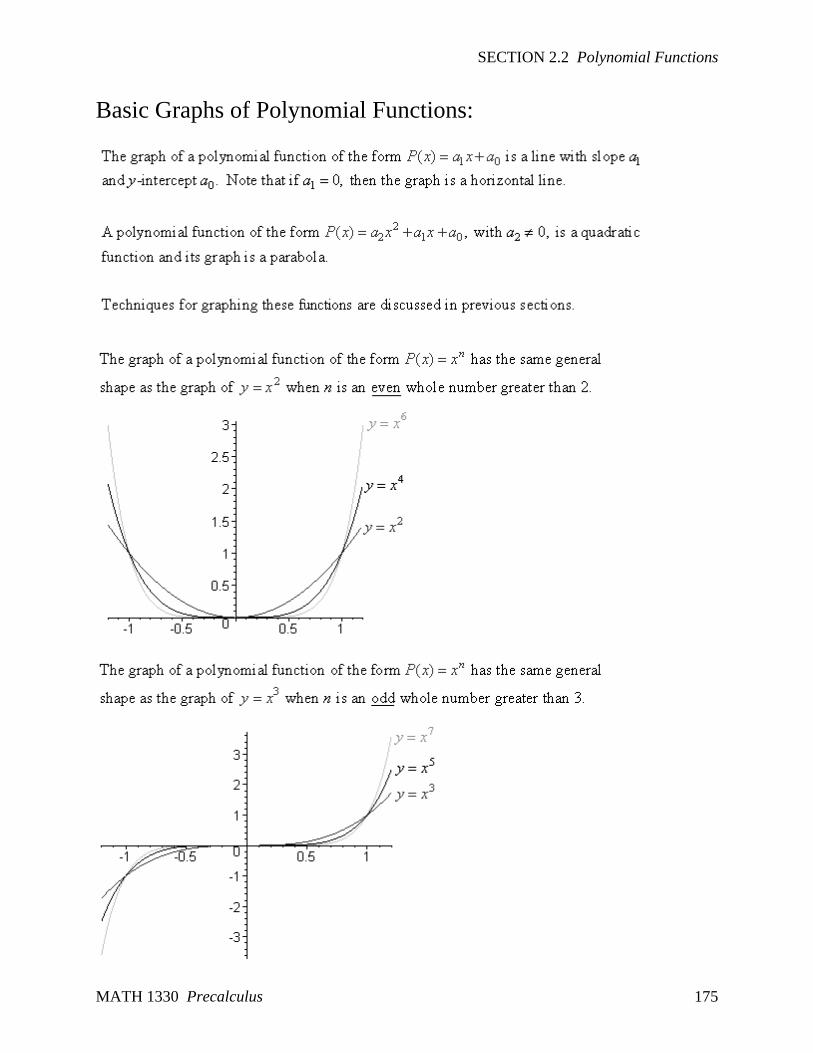
Basic Graphs of Polynomial Functions:
CHAPTER 2 Polynomial and Rational Functions
University of Houston Department of Mathematics 176
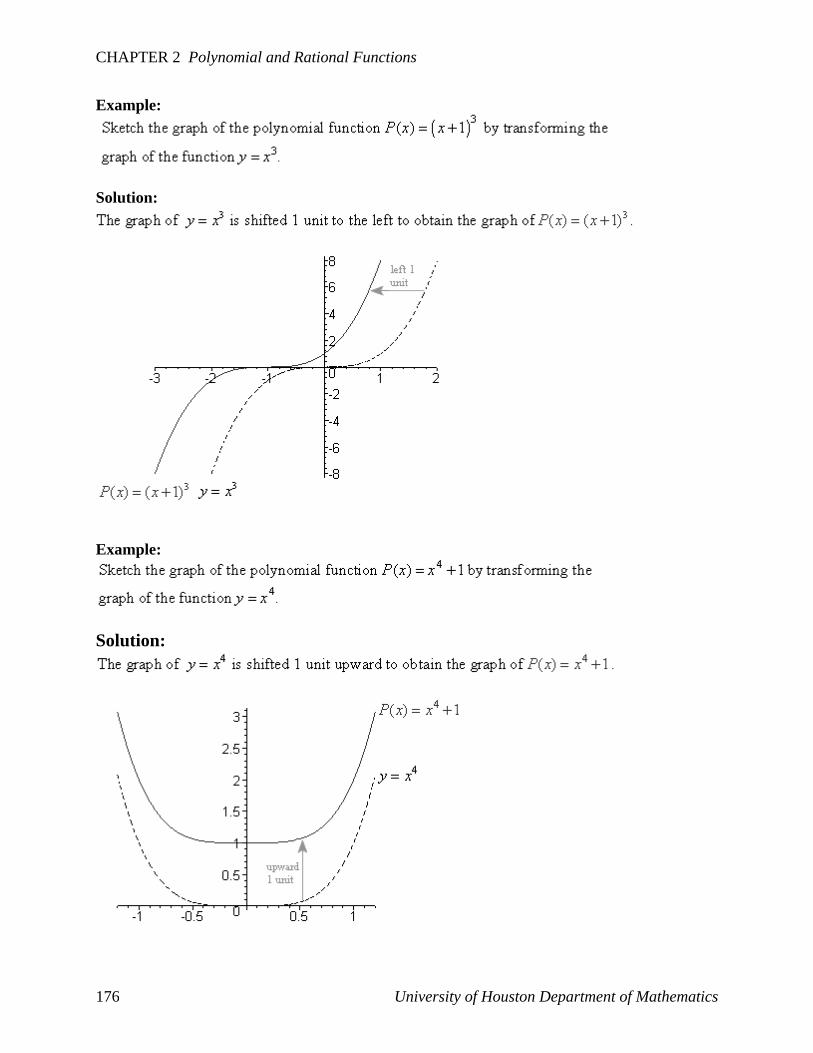
Example:
Solution:
Example:
Solution:
SECTION 2.2 Polynomial Functions
MATH 1330 Precalculus 177
Additional Example 1:
Solution:
CHAPTER 2 Polynomial and Rational Functions
University of Houston Department of Mathematics 178
Additional Example 2:
Solution:
SECTION 2.2 Polynomial Functions
MATH 1330 Precalculus 179
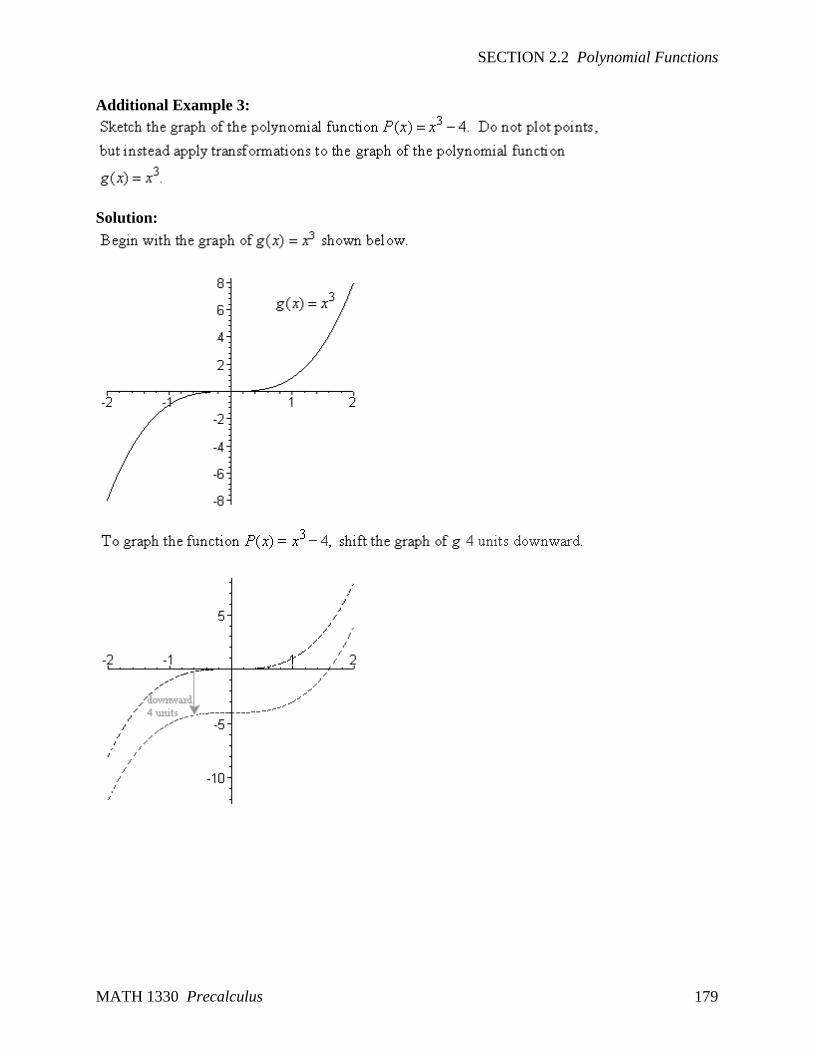
Additional Example 3:
Solution:
CHAPTER 2 Polynomial and Rational Functions
University of Houston Department of Mathematics 180
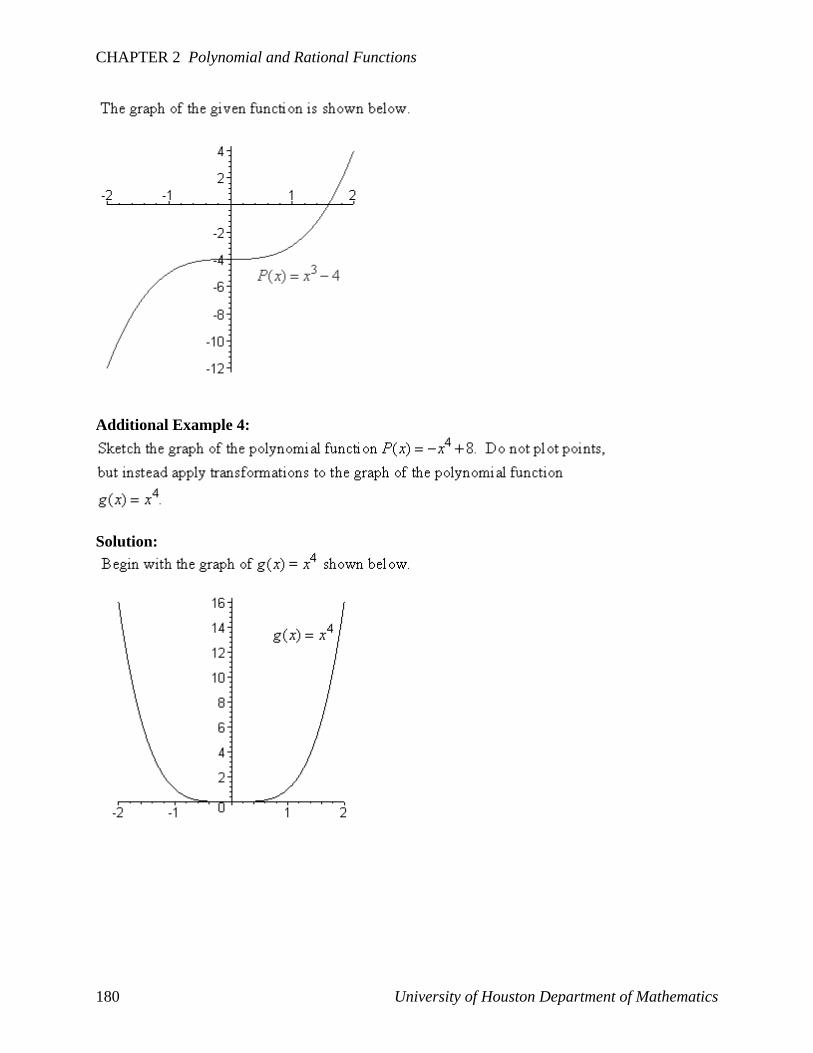
Additional Example 4:
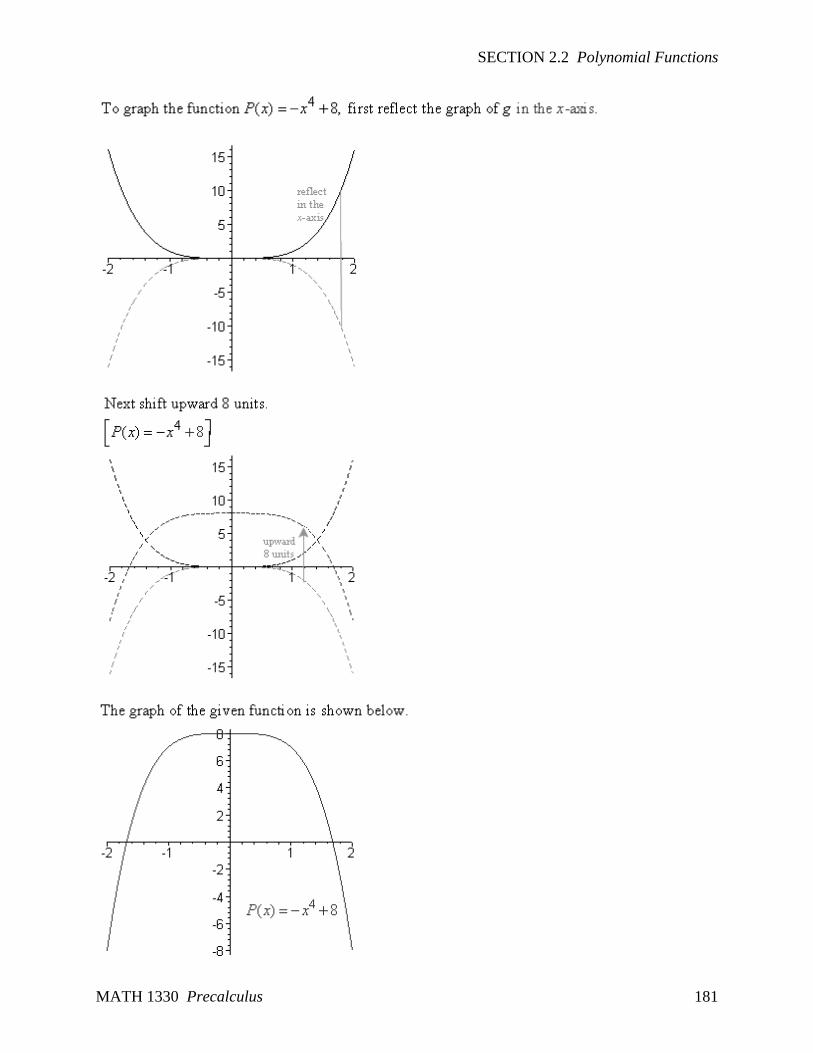
Solution:
SECTION 2.2 Polynomial Functions
MATH 1330 Precalculus 181
CHAPTER 2 Polynomial and Rational Functions
University of Houston Department of Mathematics 182
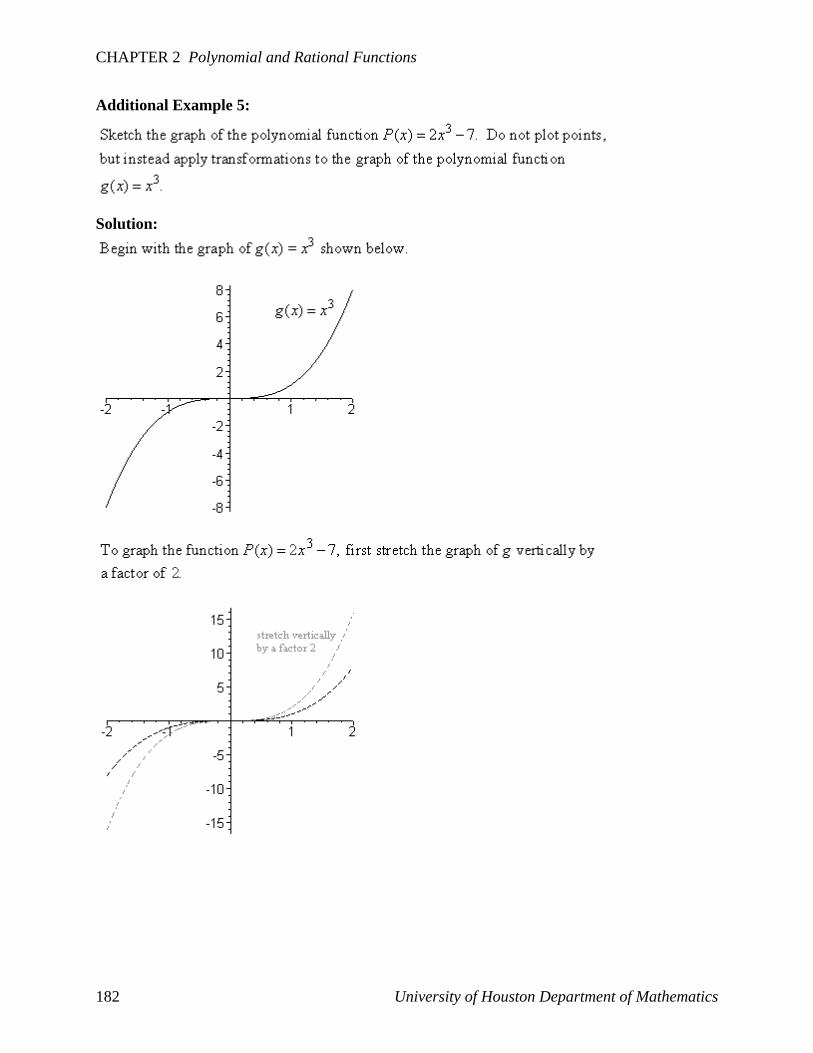
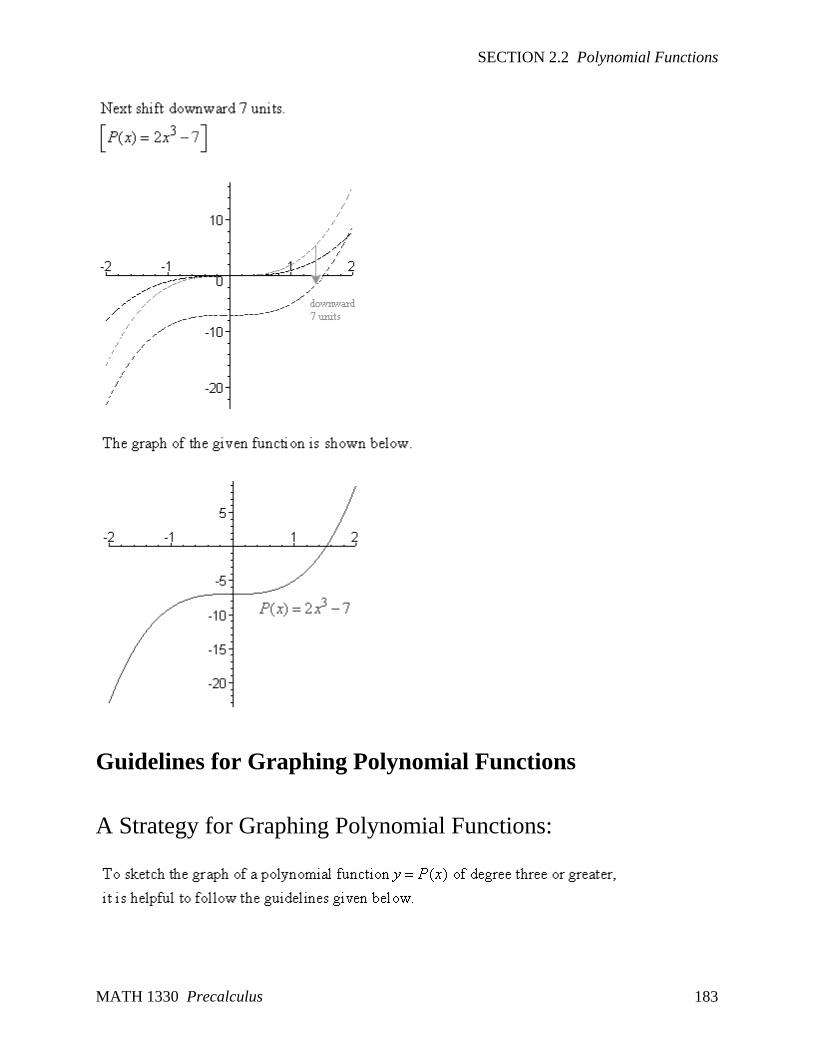
Additional Example 5:
Solution:
SECTION 2.2 Polynomial Functions
MATH 1330 Precalculus 183
Guidelines for Graphing Polynomial Functions
A Strategy for Graphing Polynomial Functions:
CHAPTER 2 Polynomial and Rational Functions
University of Houston Department of Mathematics 184
SECTION 2.2 Polynomial Functions
MATH 1330 Precalculus 185
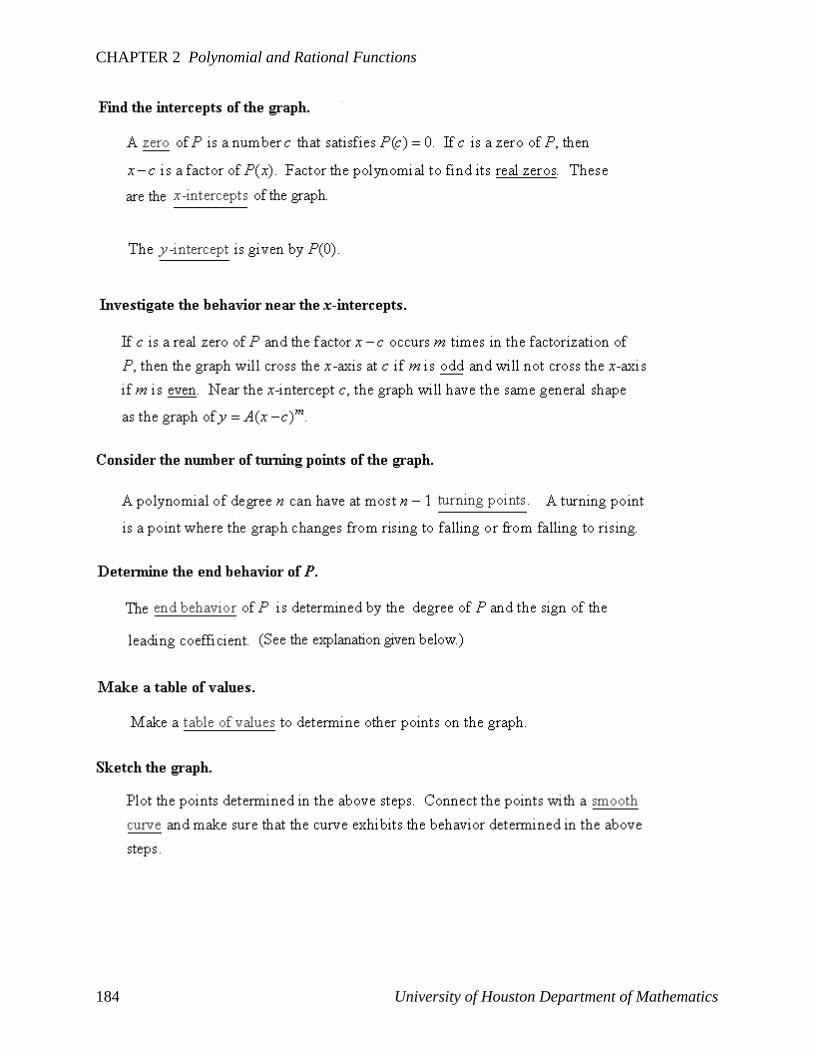
End Behavior of Polynomials:
n odd and an> 0 (odd degree and leading coefficient positive)
n odd and an< 0 (odd degree and leading coefficient negative)
CHAPTER 2 Polynomial and Rational Functions
University of Houston Department of Mathematics 186
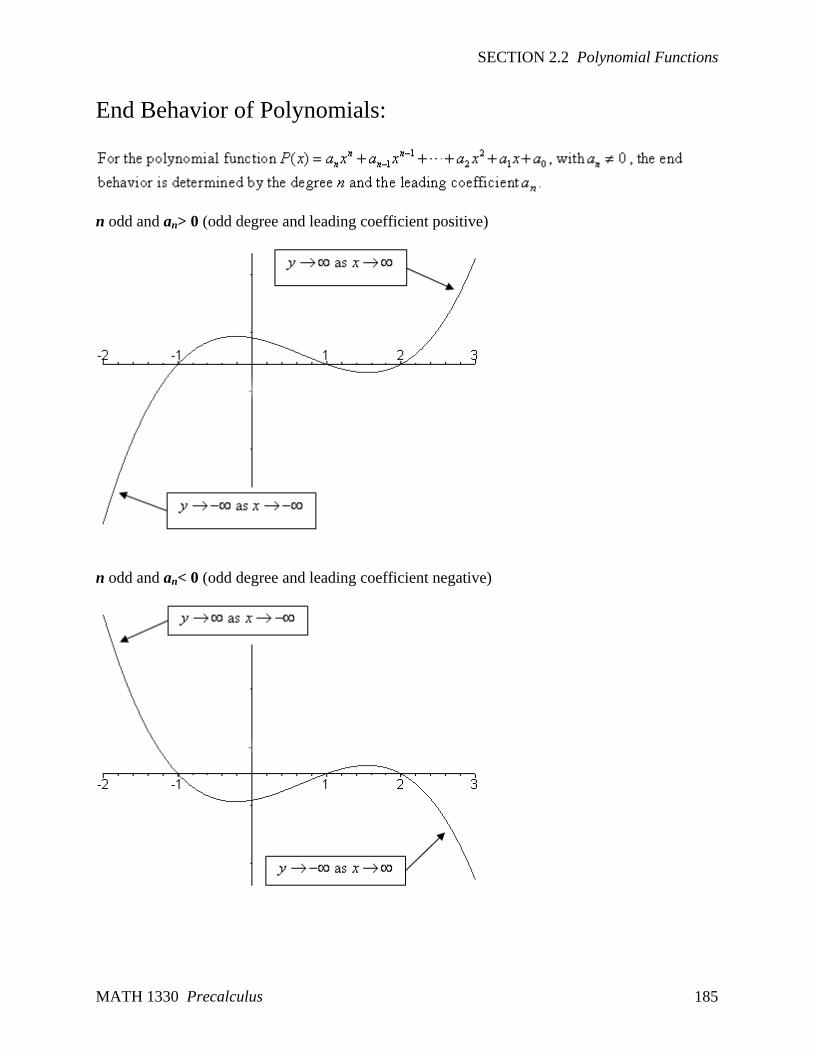
n even and an> 0 (even degree and leading coefficient positive)
n even and an< 0 (even degree and leading coefficient negative)
Example:
Solution:
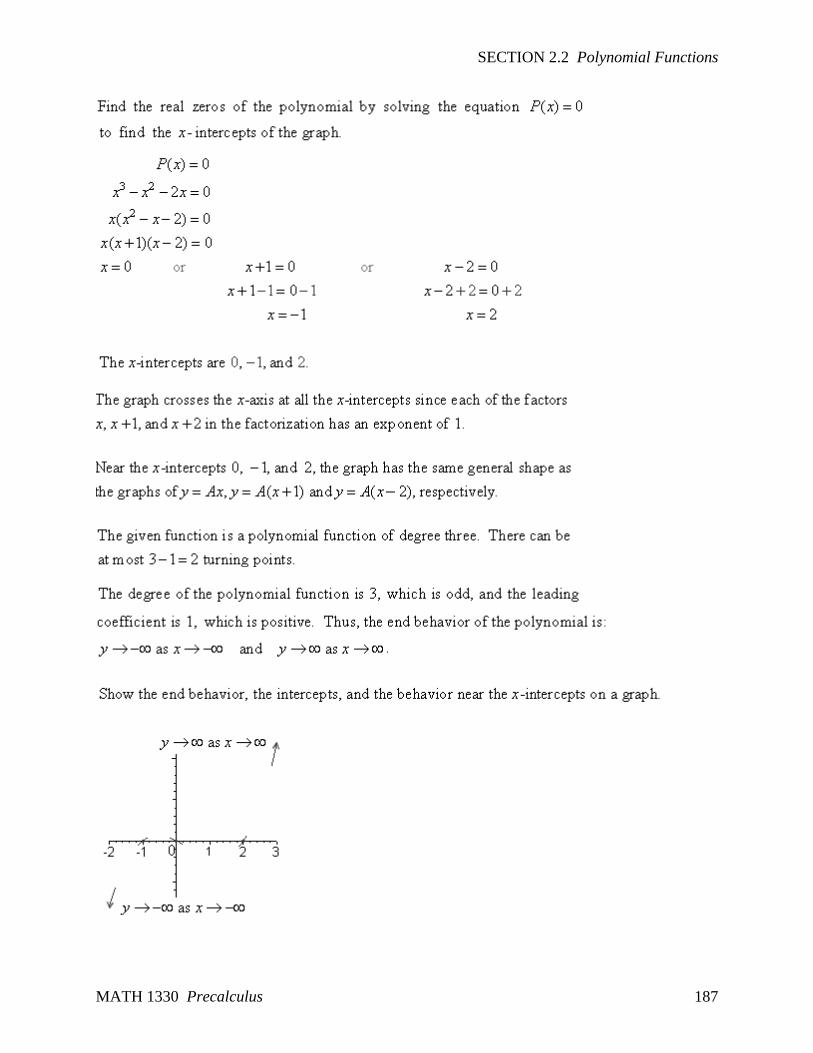
SECTION 2.2 Polynomial Functions
MATH 1330 Precalculus 187
CHAPTER 2 Polynomial and Rational Functions
University of Houston Department of Mathematics 188
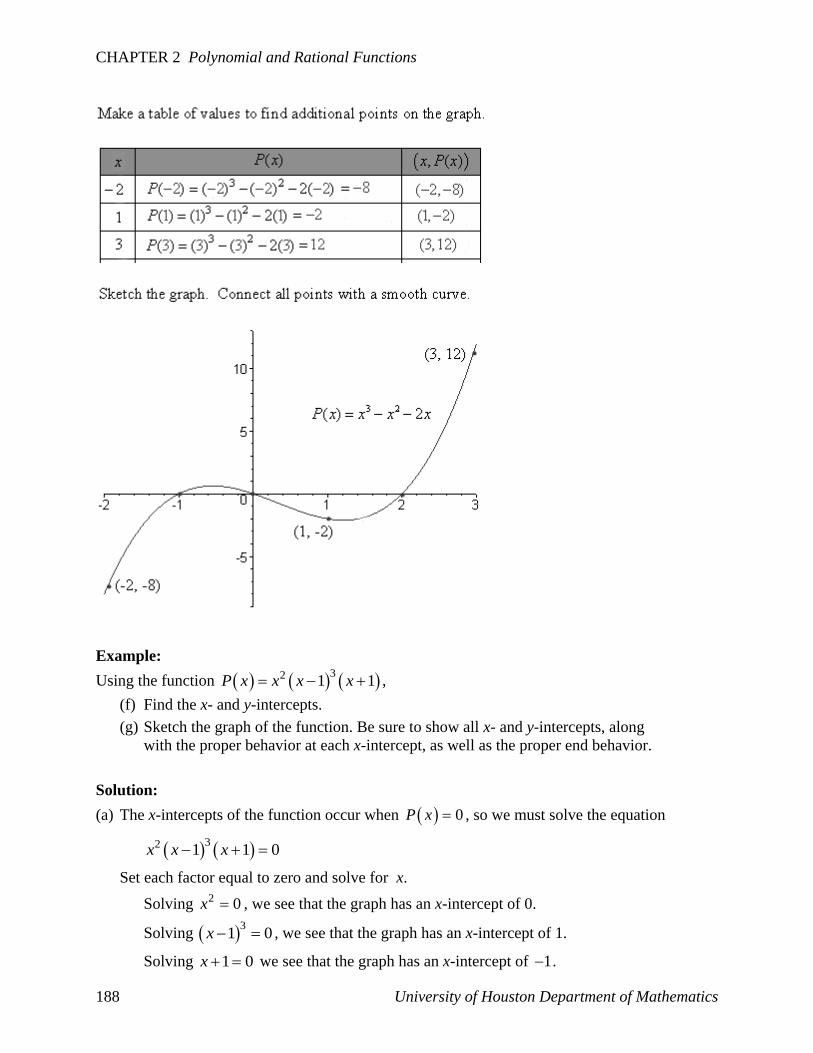
Example:
Using the function 32 1 1P x x x x ,
(f) Find the x- and y-intercepts.
(g) Sketch the graph of the function. Be sure to show all x- and y-intercepts, along
with the proper behavior at each x-intercept, as well as the proper end behavior.
Solution:
(a) The x-intercepts of the function occur when 0P x , so we must solve the equation
32 1 1 0x x x
Set each factor equal to zero and solve for x.
Solving 2 0x , we see that the graph has an x-intercept of 0.
Solving 3
1 0x , we see that the graph has an x-intercept of 1.
Solving 1 0x we see that the graph has an x-intercept of 1 .
SECTION 2.2 Polynomial Functions
MATH 1330 Precalculus 189
To find the y-intercept, find 0P . (In other words, let 0x .)
320 0 1 0 1 0 1 1 0P x
Therefore, the y-intercept is 0.
(b) Next, we will determine the degree of the function. Look at the highest power of x in
each factor (along with its sign). If this polynomial were to be multiplied out, it would
be of the form 6 ...P x x (the rest of the polynomial need not be shown; we are
simply determining the end behavior of the graph). Remember that for the graph of
any even function, both ‘tails’ of the function either go up together, or down together.
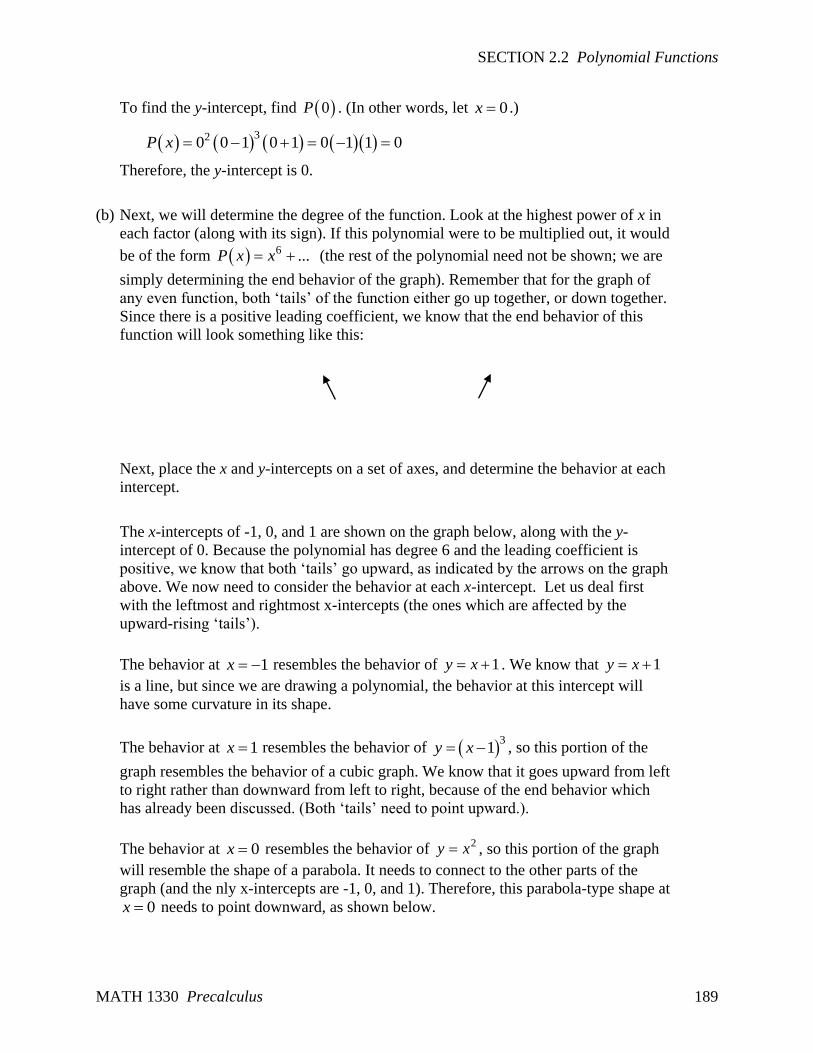
Since there is a positive leading coefficient, we know that the end behavior of this
function will look something like this:
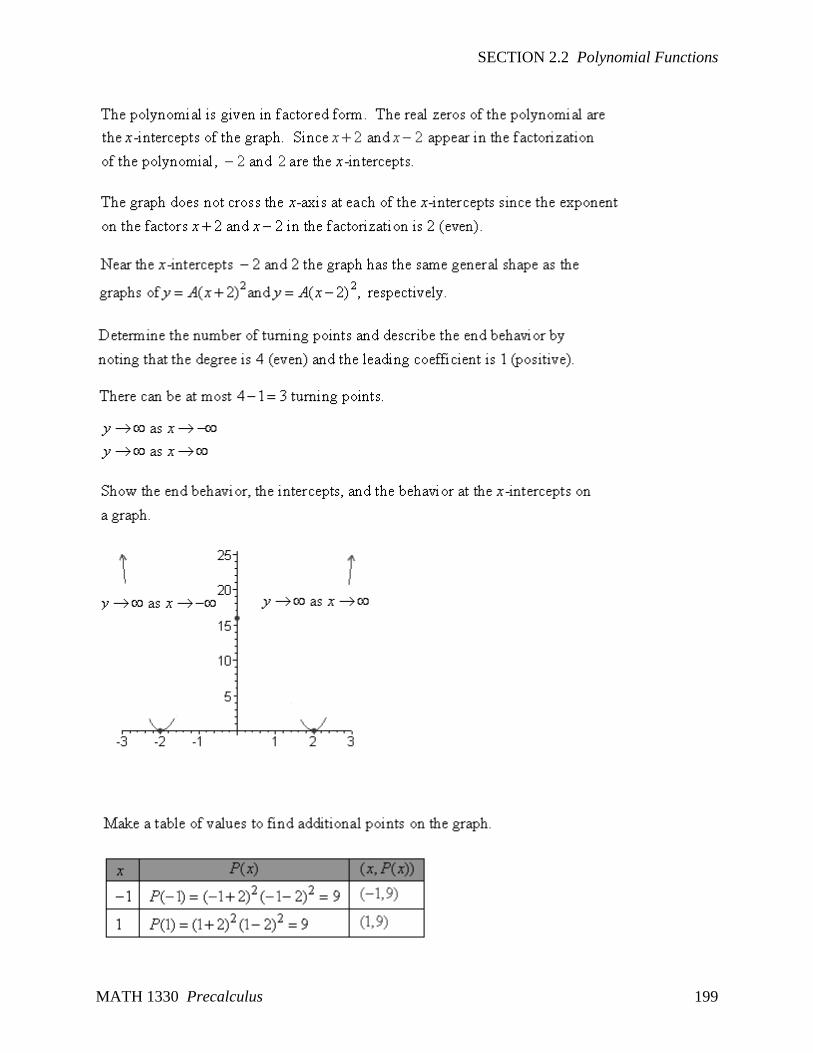
Next, place the x and y-intercepts on a set of axes, and determine the behavior at each
intercept.
The x-intercepts of -1, 0, and 1 are shown on the graph below, along with the y-
intercept of 0. Because the polynomial has degree 6 and the leading coefficient is
positive, we know that both ‘tails’ go upward, as indicated by the arrows on the graph
above. We now need to consider the behavior at each x-intercept. Let us deal first
with the leftmost and rightmost x-intercepts (the ones which are affected by the
upward-rising ‘tails’).
The behavior at 1x resembles the behavior of 1y x . We know that 1y x
is a line, but since we are drawing a polynomial, the behavior at this intercept will
have some curvature in its shape.
The behavior at 1x resembles the behavior of 3
1y x , so this portion of the
graph resembles the behavior of a cubic graph. We know that it goes upward from left
to right rather than downward from left to right, because of the end behavior which
has already been discussed. (Both ‘tails’ need to point upward.).
The behavior at 0x resembles the behavior of 2y x , so this portion of the graph
will resemble the shape of a parabola. It needs to connect to the other parts of the
graph (and the nly x-intercepts are -1, 0, and 1). Therefore, this parabola-type shape at
0x needs to point downward, as shown below.
CHAPTER 2 Polynomial and Rational Functions
University of Houston Department of Mathematics 190
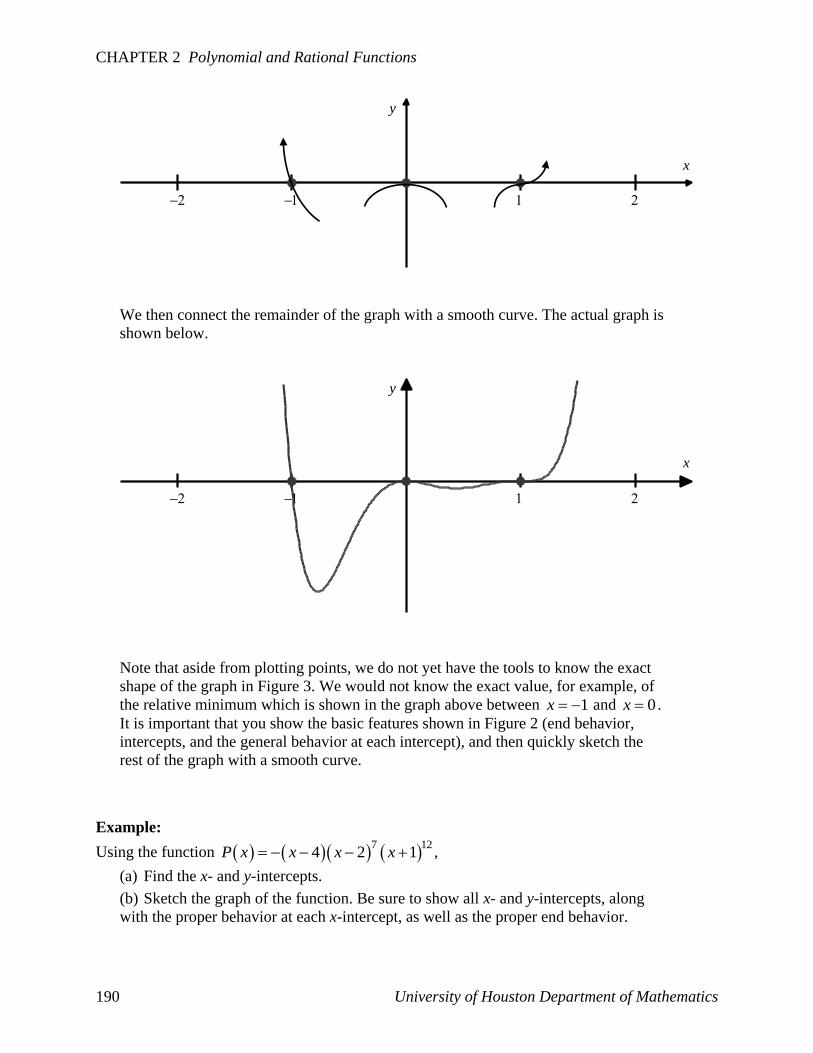
We then connect the remainder of the graph with a smooth curve. The actual graph is
shown below.
Note that aside from plotting points, we do not yet have the tools to know the exact
shape of the graph in Figure 3. We would not know the exact value, for example, of
the relative minimum which is shown in the graph above between 1x and 0x .
It is important that you show the basic features shown in Figure 2 (end behavior,
intercepts, and the general behavior at each intercept), and then quickly sketch the
rest of the graph with a smooth curve.
Example:
Using the function 7 12
4 2 1P x x x x ,
(a) Find the x- and y-intercepts.
(b) Sketch the graph of the function. Be sure to show all x- and y-intercepts, along
with the proper behavior at each x-intercept, as well as the proper end behavior.
x
y
x
y
SECTION 2.2 Polynomial Functions
MATH 1330 Precalculus 191
Solution:
(a) The x-intercepts of the function occur when 0P x , so we must solve the equation
7 12
4 2 1 0x x x
Set each factor equal to zero and solve for x.
Solving 4 0x , we see that the graph has an x-intercept of 4.
Solving 7
2 0x , we see that the graph has an x-intercept of 2.
Solving 12
1 0x , we see that the graph has an x-intercept of 1 .
To find the y-intercept, find 0P . (In other words, let 0x .)
7 12 7 12
0 4 0 2 0 1 4 2 1 4 128 1 512P x
Therefore, the y-intercept is 512.
(b) Next, we will determine the degree of the function. Look at the highest power of x in
each factor (along with its sign). If this polynomial were to be multiplied out, it would
be of the form 20 ...P x x (the rest of the polynomial need not be shown; we
are simply determining the end behavior of the graph). Remember that for the graph
of any even function, both ‘tails’ of the function either go up together, or down
together. Since there is a negative leading coefficient, we know that the end behavior
of this function will look something like this:
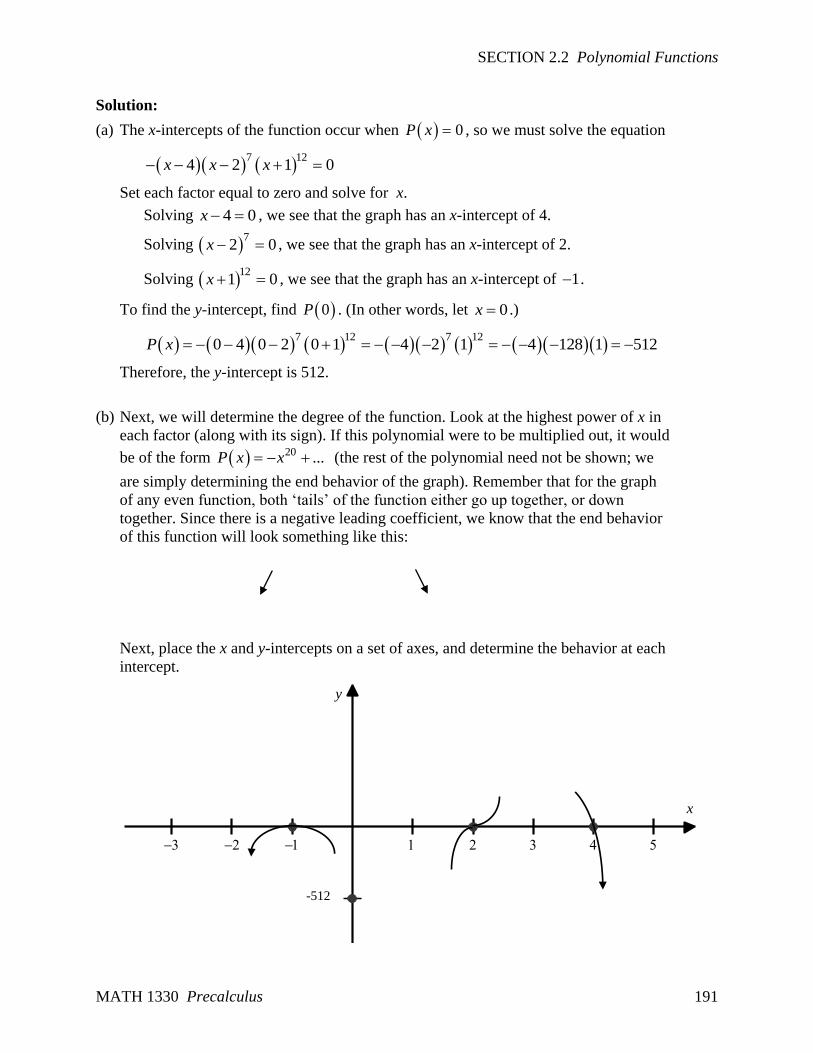
Next, place the x and y-intercepts on a set of axes, and determine the behavior at each
intercept.
x
y
-512
CHAPTER 2 Polynomial and Rational Functions
University of Houston Department of Mathematics 192
The x-intercepts of -1, 2, and 4 are shown on the graph, along with the y-intercept of
512 . Because the polynomial has degree 20 and the leading coefficient is negative,
we know that both ‘tails’ go downward, as indicated by the arrows on the graph
above. We now need to consider the behavior at each x-intercept.
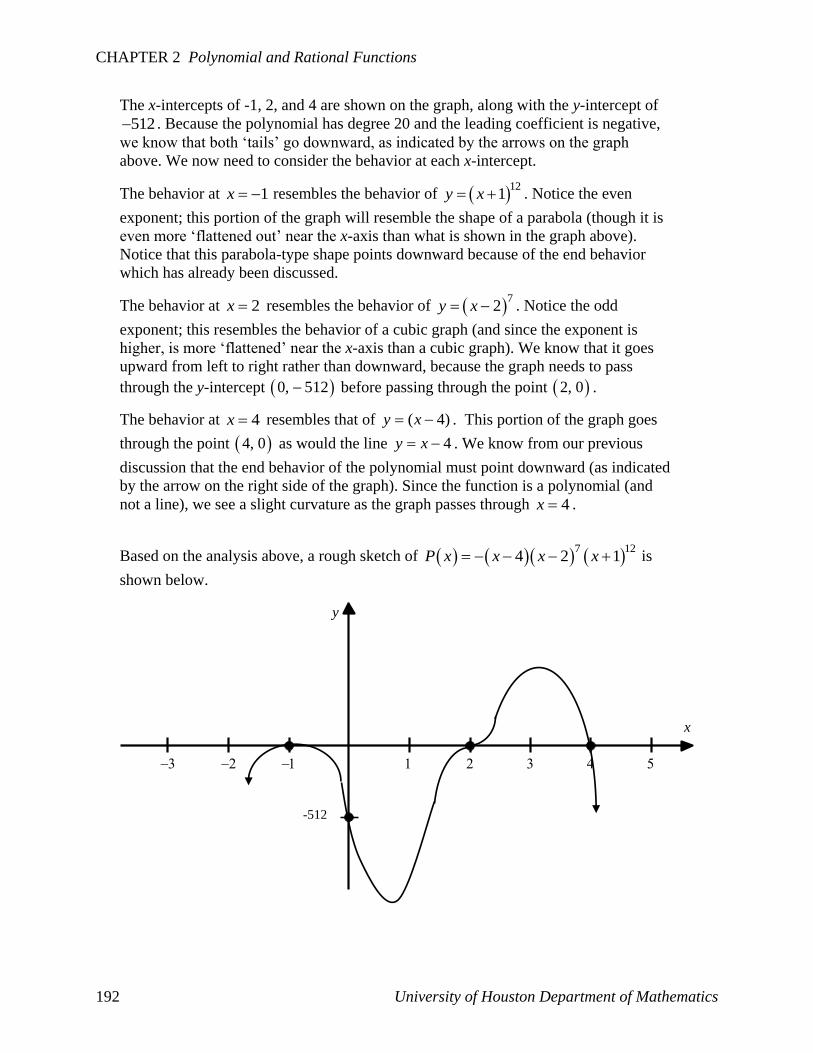
The behavior at 1x resembles the behavior of 12
1y x . Notice the even
exponent; this portion of the graph will resemble the shape of a parabola (though it is
even more ‘flattened out’ near the x-axis than what is shown in the graph above).
Notice that this parabola-type shape points downward because of the end behavior
which has already been discussed.
The behavior at 2x resembles the behavior of 7
2y x . Notice the odd
exponent; this resembles the behavior of a cubic graph (and since the exponent is
higher, is more ‘flattened’ near the x-axis than a cubic graph). We know that it goes
upward from left to right rather than downward, because the graph needs to pass
through the y-intercept 0, 512 before passing through the point 2, 0 .
The behavior at 4x resembles that of ( 4)y x . This portion of the graph goes
through the point 4, 0 as would the line 4y x . We know from our previous
discussion that the end behavior of the polynomial must point downward (as indicated
by the arrow on the right side of the graph). Since the function is a polynomial (and
not a line), we see a slight curvature as the graph passes through 4x .
Based on the analysis above, a rough sketch of 7 12
4 2 1P x x x x is
shown below.
x
y
-512
SECTION 2.2 Polynomial Functions
MATH 1330 Precalculus 193
Note:
The graph above is only a rough sketch which gives an idea of the behavior of the graph,
and is sufficient for the purpose of this course. In reality, the behavior near 1x and
2x is more ‘flattened’ (very close to the x-axis). Moreover, this graph has y-values of
a very large magnitude because of the large exponents in the polynomial function.
The analysis shown below is beyond the scope of the Math 1330 course, but is included
to show you what the graph of the above function really looks like.
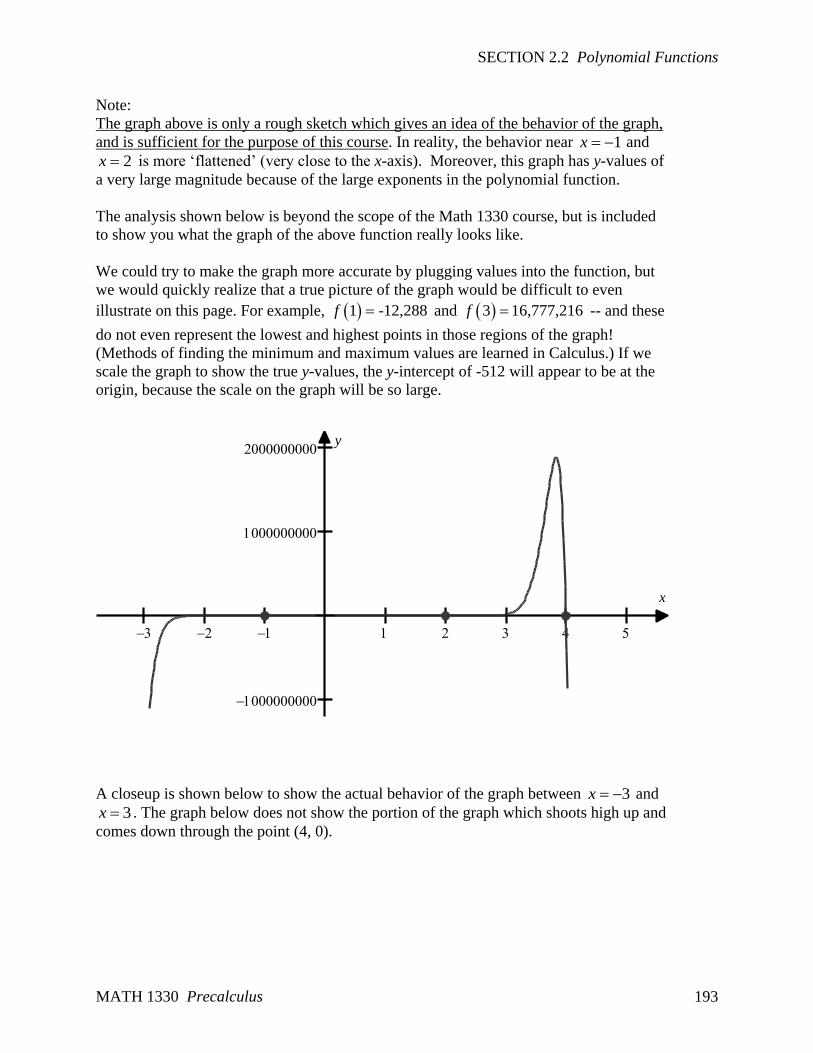
We could try to make the graph more accurate by plugging values into the function, but
we would quickly realize that a true picture of the graph would be difficult to even
illustrate on this page. For example, 1 -12,288f and 3 16,777,216f -- and these
do not even represent the lowest and highest points in those regions of the graph!
(Methods of finding the minimum and maximum values are learned in Calculus.) If we
scale the graph to show the true y-values, the y-intercept of -512 will appear to be at the
origin, because the scale on the graph will be so large.
A closeup is shown below to show the actual behavior of the graph between 3x and
3x . The graph below does not show the portion of the graph which shoots high up and
comes down through the point (4, 0).
x
y
CHAPTER 2 Polynomial and Rational Functions
University of Houston Department of Mathematics 194
x
y
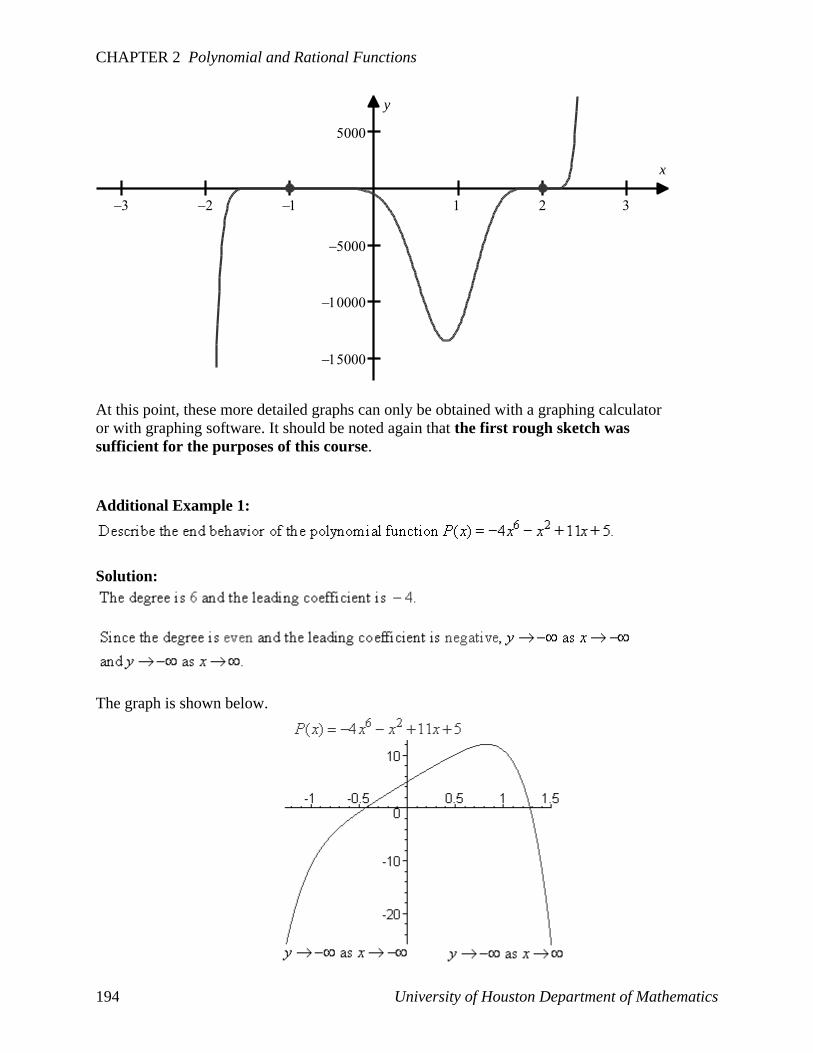
At this point, these more detailed graphs can only be obtained with a graphing calculator
or with graphing software. It should be noted again that the first rough sketch was
sufficient for the purposes of this course.
Additional Example 1:
Solution:
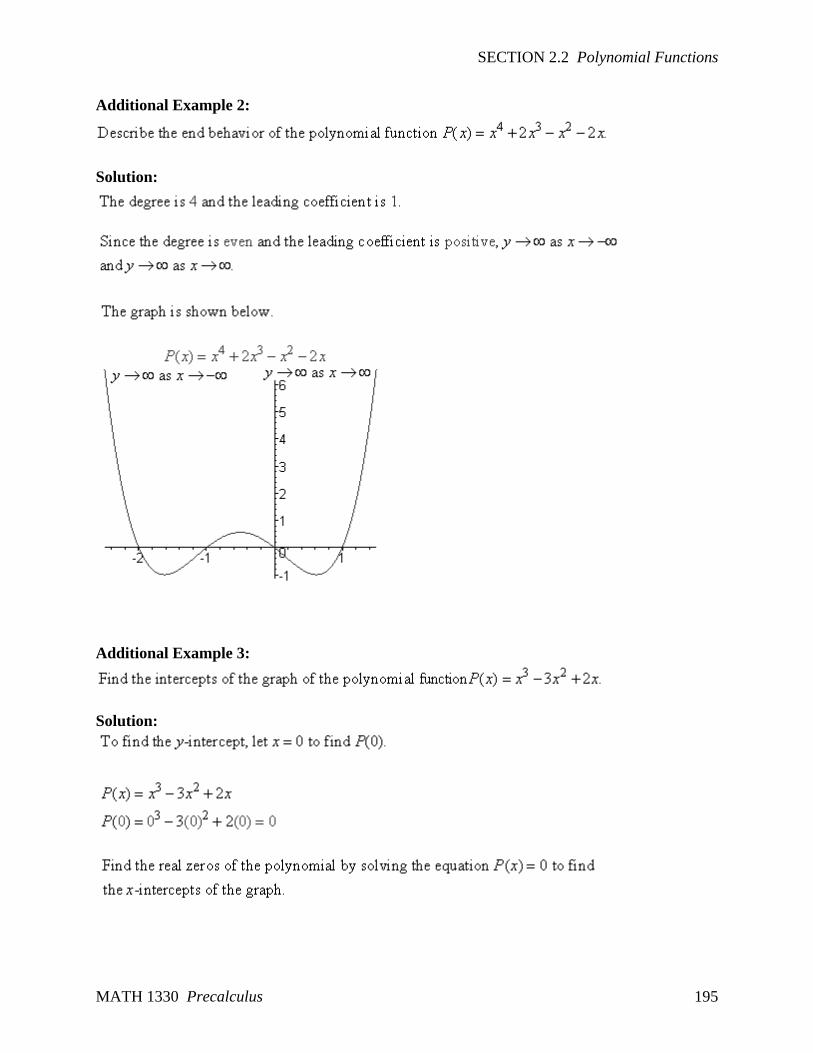
The graph is shown below.
SECTION 2.2 Polynomial Functions
MATH 1330 Precalculus 195
Additional Example 2:
Solution:
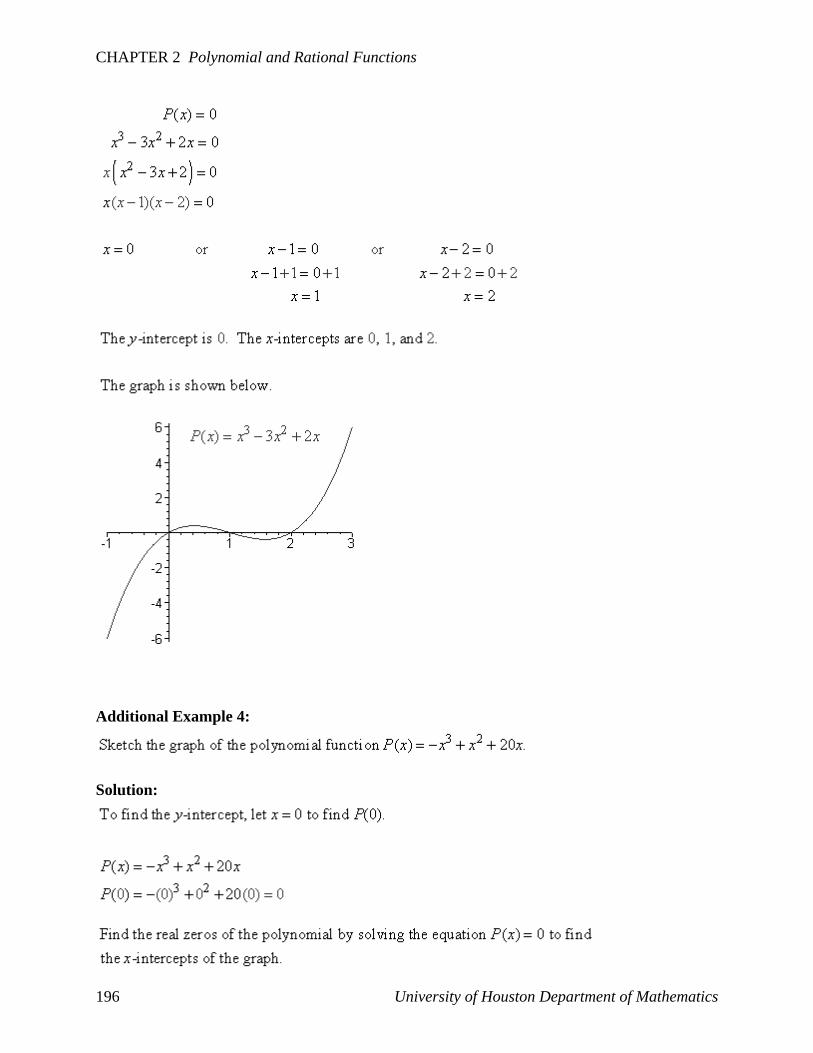
Additional Example 3:
Solution:
CHAPTER 2 Polynomial and Rational Functions
University of Houston Department of Mathematics 196
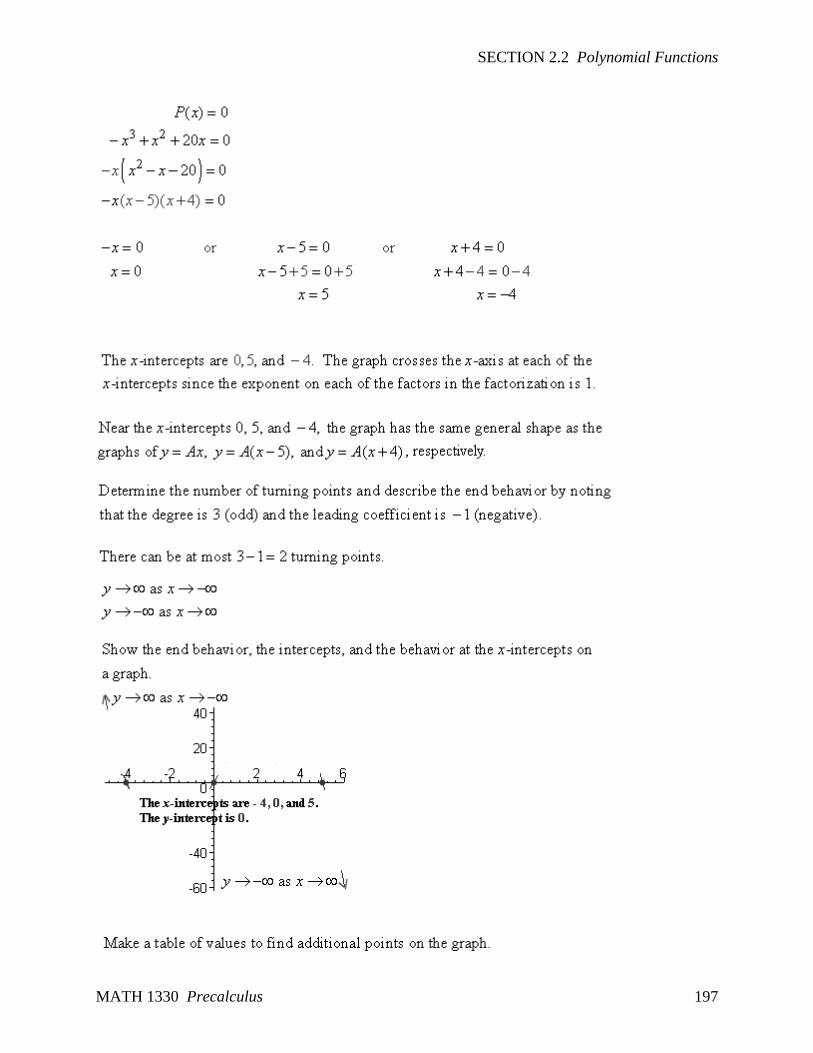
Additional Example 4:
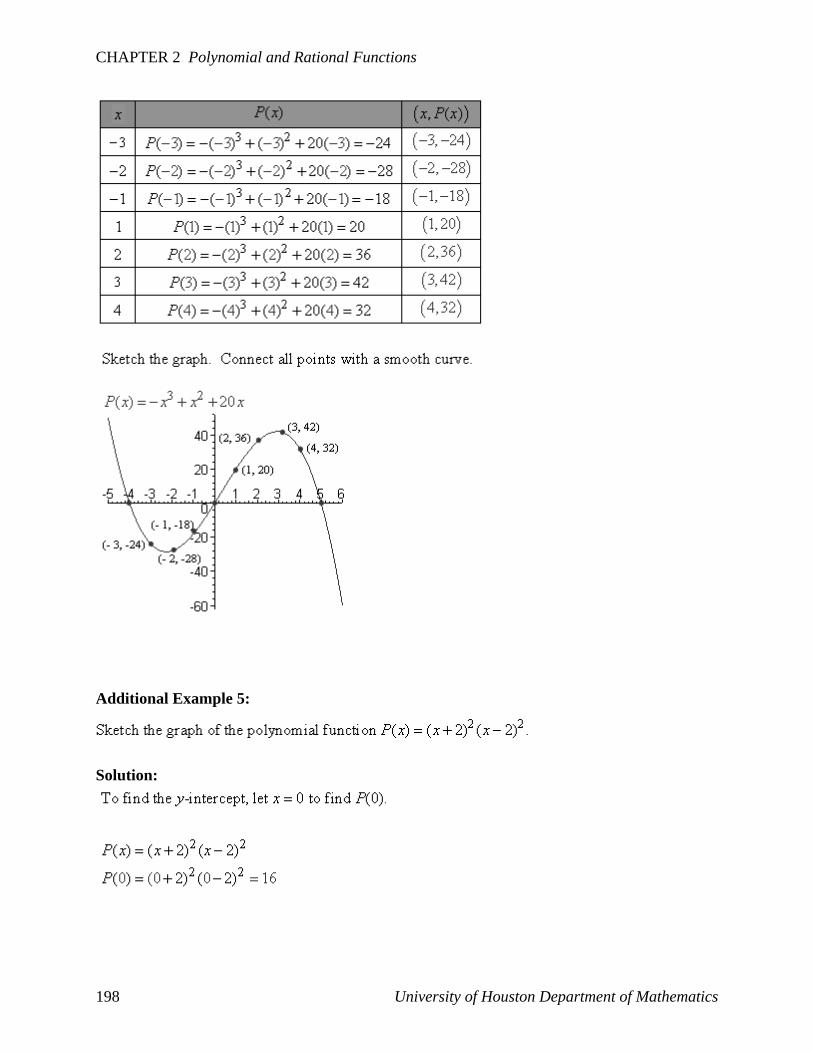
Solution:
SECTION 2.2 Polynomial Functions
MATH 1330 Precalculus 197
CHAPTER 2 Polynomial and Rational Functions
University of Houston Department of Mathematics 198
Additional Example 5:
Solution:
SECTION 2.2 Polynomial Functions
MATH 1330 Precalculus 199
CHAPTER 2 Polynomial and Rational Functions
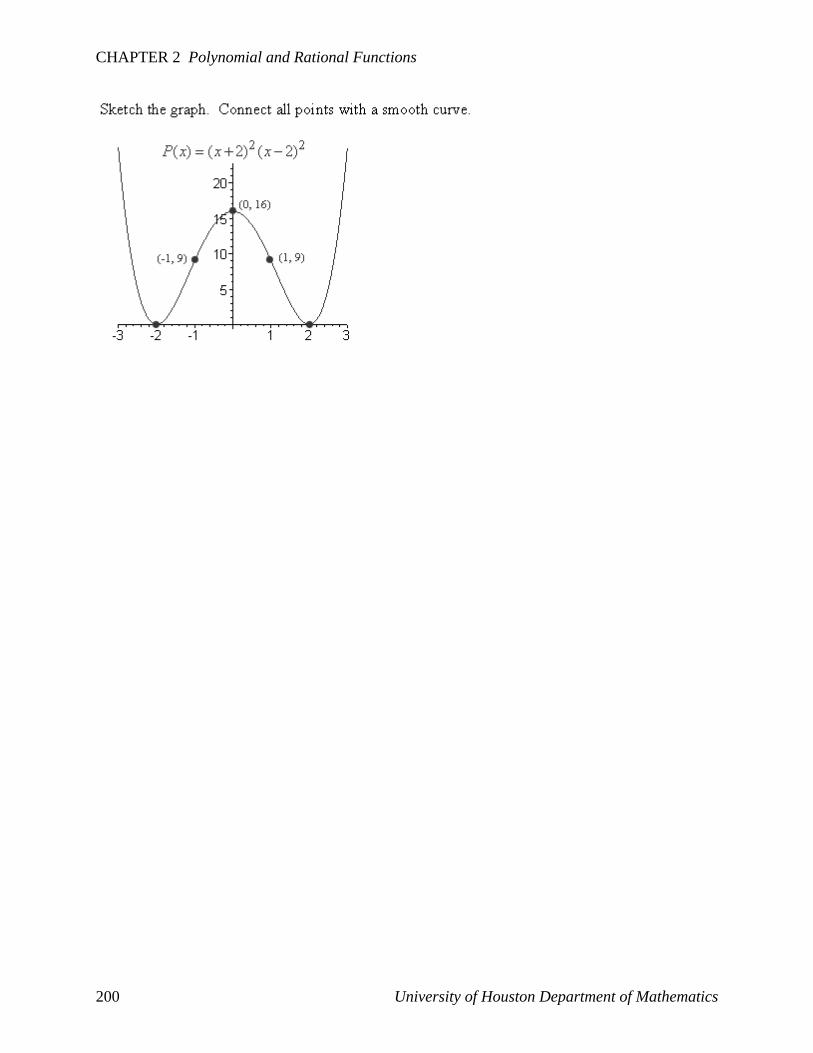
University of Houston Department of Mathematics 200
Exercise Set 2.2: Polynomial Functions
MATH 1330 Precalculus 201
Answer the following.
(a) State whether or not each of the following
expressions is a polynomial. (Yes or No.)
(b) If the answer to part (a) is yes, then state the
degree of the polynomial.
(c) If the answer to part (a) is yes, then classify
the polynomial as a monomial, binomial,
trinomial, or none of these. (Polynomials of
four or more terms are not generally given
specific names.)
1. 34 3x
2. 5 3 86 3x x
x
3. 3 5x
4. 3 22 4 7 4x x x
5. 3 2
2
5 6 7
4 5
x x
x x
6. 8
7. 27 52 3
9x x
8. 3 2
7 5 32
xx x
9. 1 4 13 7 2x x
10. 11 1
34 29 2 4x x x
11. 2 3 1x x
12. 632
x
13. 3 26 8x x
x
14. 2 4 93 5 6 3x x x
15. 3 4 2 23 2a b a b
16. 5 2 4 94 3x y x y
17. 5 3
2
34x y
xy
18. 2 9 3 4 22 15 4
3x y z xy x y z
19. 3 7 4 3 2325 7
4xyz y x y z
20. 7 3 5 6 2 42 3a a b b a b
Answer True or False.
21. (a) 37 2x x is a trinomial.
(b) 37 2x x is a third degree polynomial.
(c) 37 2x x is a binomial.
(d) 37 2x x is a first degree polynomial
22. (a) 2 34 7x x x is a second degree
polynomial.
(b) 2 34 7x x x is a binomial.
(c) 2 34 7x x x is a third degree polynomial.
(d) 2 34 7x x x is a trinomial.
23. (a) 7 4 6 83 2 3x x y y is a tenth degree
polynomial.
(b) 7 4 6 83 2 3x x y y is a binomial.
(c) 7 4 6 83 2 3x x y y is an eighth degree
polynomial.
(d) 7 4 6 83 2 3x x y y is a trinomial.
24. (a) 4 53a b is a fifth degree polynomial.
(b) 4 53a b is a trinomial.
(c) 4 53a b is a ninth degree polynomial.
(d) 4 53a b is a monomial.
Sketch a graph of each of the following functions.
25. 3)( xxP
26. 4)( xxP
27. 6)( xxP
28. 5)( xxP
29. .0 and odd is where,)( nnxxP n
30. .0 andeven is where,)( nnxxP n
Answer the following.
31. The graph of 23 )4()2)(1()( xxxxP has x-
intercepts at .4 and ,2,1 xxx
(a) At and immediately surrounding the point
2x , the graph resembles the graph of what
familiar function? (Choose one.)
xy 2xy 3xy
Continued on the next page…
Exercise Set 2.2: Polynomial Functions
University of Houston Department of Mathematics 202
x
y
x
y
x
y
x
y
x
y
x
y
(b) At and immediately surrounding the point
4x , the graph resembles the graph of
what familiar function? (Choose one.)
xy 2xy 3xy
(c) If )(xP were to be multiplied out
completely, the leading term of the
polynomial would be: (Choose one; do not
actually multiply out the polynomial.)
66554433 ;;;;;;; xxxxxxxx
32. The graph of 32 )5()3()( xxxQ has x-
intercepts at .5 and 3 xx
(a) At and immediately surrounding the point
3x , the graph resembles the graph of
what familiar function? (Choose one.)
xy 2xy 3xy
(b) At and immediately surrounding the point
5x , the graph resembles the graph of what
familiar function? (Choose one.)
xy 2xy 3xy
(c) If )(xP were to be multiplied out
completely, the leading term of the
polynomial would be: (Choose one; do not
actually multiply out the polynomial.)
66554433 ;;;;;;; xxxxxxxx
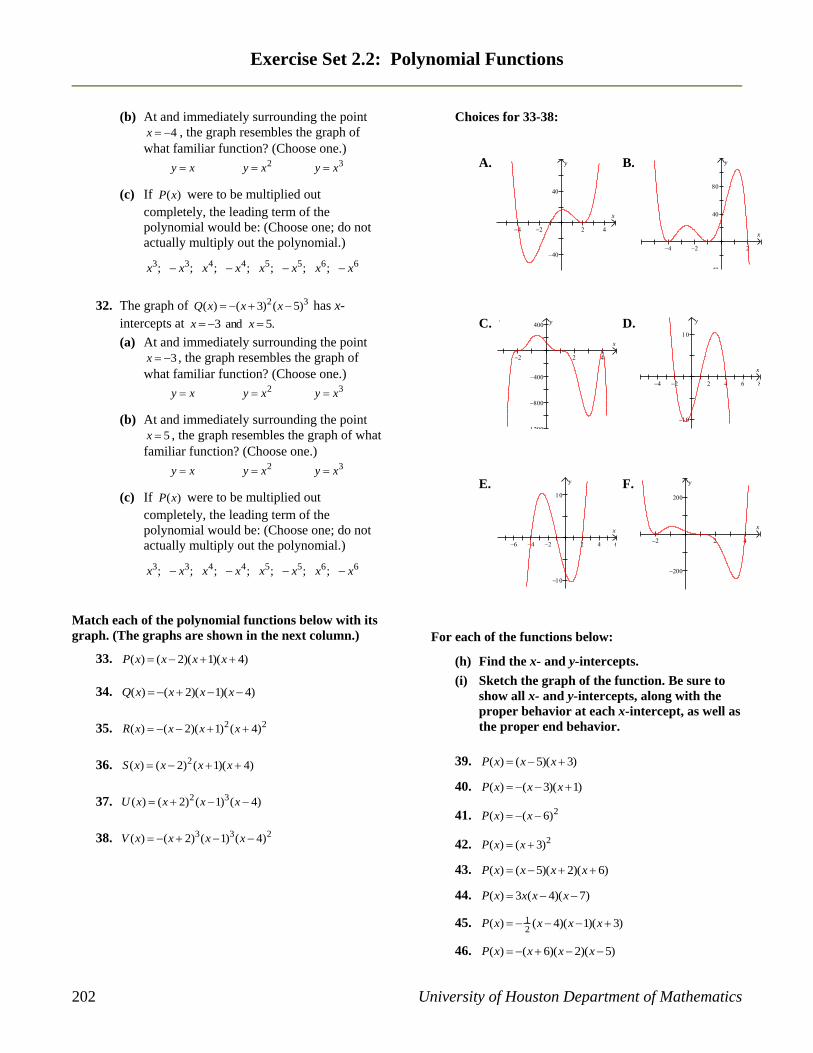
Match each of the polynomial functions below with its
graph. (The graphs are shown in the next column.)
33. )4)(1)(2()( xxxxP
34. )4)(1)(2()( xxxxQ
35. 22 )4()1)(2()( xxxxR
36. )4)(1()2()( 2 xxxxS
37. )4()1()2()( 32 xxxxU
38. 233 )4()1()2()( xxxxV
Choices for 33-38:
A. B.
C. D.
E. F.
For each of the functions below:
(h) Find the x- and y-intercepts.
(i) Sketch the graph of the function. Be sure to
show all x- and y-intercepts, along with the
proper behavior at each x-intercept, as well as
the proper end behavior.
39. )3)(5()( xxxP
40. )1)(3()( xxxP
41. 2)6()( xxP
42. 2)3()( xxP
43. )6)(2)(5()( xxxxP
44. )7)(4(3)( xxxxP
45. )3)(1)(4()(21 xxxxP
46. )5)(2)(6()( xxxxP
Exercise Set 2.2: Polynomial Functions
MATH 1330 Precalculus 203
47. )4()2()( 2 xxxP
48. 2)3)(5()( xxxP
49. )1)(5)(4)(23()( xxxxxP
50. )2)(3)(1)(5()(31 xxxxxP
51. )6)(4)(2()( xxxxxP
52. )5)(2)(3)(1()( xxxxxP
53. 22 )4()3()( xxxP
54. 3)52()( xxxP
55. )4()5()( 3 xxxP
56. 22 )6()( xxxP
57. 32 )4()3()( xxxP
58. )1()3(2)( 3 xxxxP
59. )4()3()2()( 22 xxxxxP
60. )1()2()5()( 23 xxxxP
61. 768 )1()1()( xxxxP
62. 743 )1()1()( xxxxP
63. xxxxP 86)( 23
64. xxxxP 152)( 23
65. 325)( xxxP
66. xxxxP 253)( 23
67. 234 12)( xxxxP
68. 24 16)( xxxP
69. 35 9)( xxxP
70. 345 183)( xxxxP
71. 44)( 23 xxxxP
72. 2045)( 23 xxxxP
73. 3613)( 24 xxxP
74. 1617)( 24 xxxP
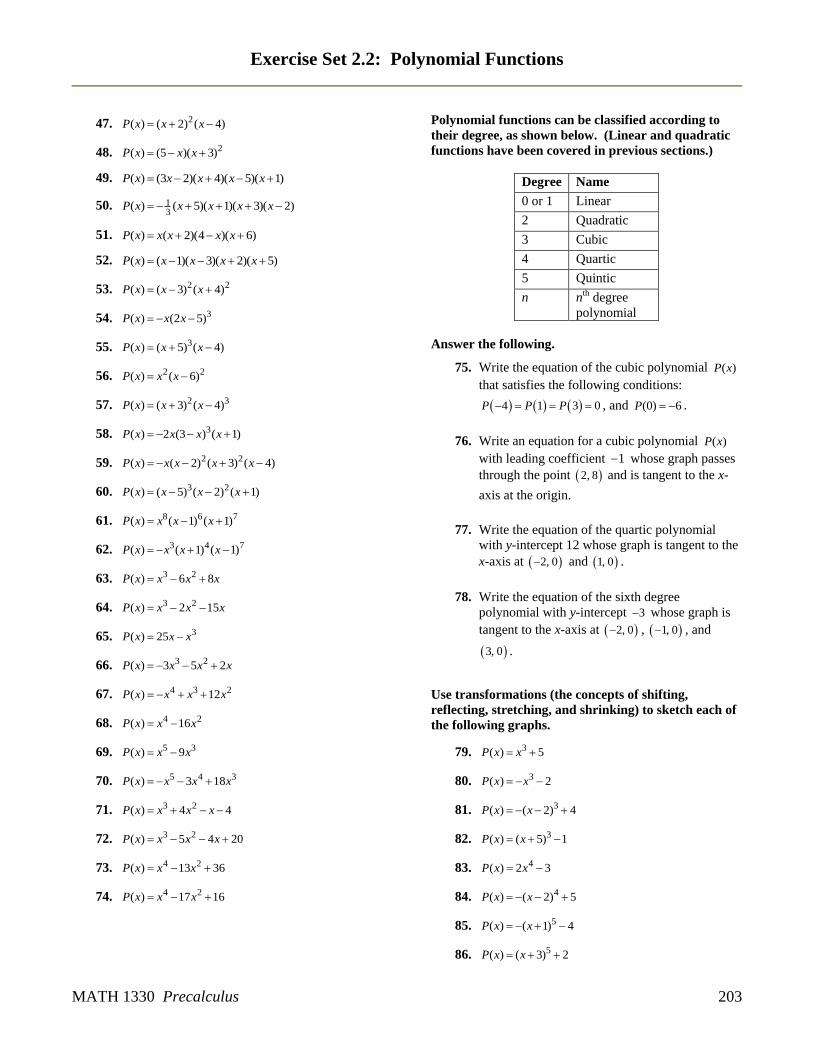
Polynomial functions can be classified according to
their degree, as shown below. (Linear and quadratic
functions have been covered in previous sections.)
Degree Name
0 or 1 Linear
2 Quadratic
3 Cubic
4 Quartic
5 Quintic
n nth degree
polynomial
Answer the following.
75. Write the equation of the cubic polynomial ( )P x
that satisfies the following conditions:
4 1 3 0P P P , and (0) 6P .
76. Write an equation for a cubic polynomial ( )P x
with leading coefficient 1 whose graph passes
through the point 2, 8 and is tangent to the x-
axis at the origin.
77. Write the equation of the quartic polynomial
with y-intercept 12 whose graph is tangent to the
x-axis at 2, 0 and 1, 0 .
78. Write the equation of the sixth degree
polynomial with y-intercept 3 whose graph is
tangent to the x-axis at 2, 0 , 1, 0 , and
3, 0 .
Use transformations (the concepts of shifting,
reflecting, stretching, and shrinking) to sketch each of
the following graphs.
79. 5)( 3 xxP
80. 2)( 3 xxP
81. 4)2()( 3 xxP
82. 1)5()( 3 xxP
83. 32)( 4 xxP
84. 5)2()( 4 xxP
85. 4)1()( 5 xxP
86. 2)3()( 5 xxP