pneumatic low-coherence interferometry otoscope to ... · pneumatic low-coherence interferometry...
TRANSCRIPT
Pneumatic low-coherence interferometry otoscope to quantify tympanic membrane mobility and middle ear pressure
JUNGEUN WON,1,2 GUILLERMO L. MONROY,1,2 PIN-CHIEH HUANG,1,2 ROSHAN DSOUZA,2 MALCOLM C. HILL,3,4 MICHAEL A. NOVAK,3,5 RYAN G. PORTER,3,5 ERIC CHANEY,2 RONIT BARKALIFA,2 AND STEPHEN A. BOPPART
1,2,3,6,* 1Department of Bioengineering, University of Illinois at Urbana-Champaign, 1304 W. Springfield Avenue, Urbana, IL 61801, USA 2Beckman Institute of Advanced Science and Technology, University of Illinois at Urbana-Champaign, 405 North Mathews Avenue, Urbana, IL 61801, USA 3Carle-Illinois College of Medicine, University of Illinois Urbana-Champaign, 807 South Wright Street, Champaign, IL 61820, USA 4Department of Pediatrics, Carle Foundation Hospital, 611 W. Park Street, Urbana, IL 61801, USA 5Department of Otolaryngology, Carle Foundation Hospital, 611 W. Park Street, Urbana, IL 61801, USA 6Department of Electrical and Computer Engineering, University of Illinois at Urbana-Champaign, 306 N Wright Street, Urbana, IL 61801, USA *[email protected]
Abstract: Pneumatic otoscopy to assess the mobility of the tympanic membrane (TM) is a highly recommended diagnostic method of otitis media (OM), a widespread middle ear infection characterized by the fluid accumulation in the middle ear. Nonetheless, limited depth perception and subjective interpretation of small TM displacements have challenged the appropriate and efficient examination of TM dynamics experienced during OM. In this paper, a pneumatic otoscope integrated with low coherence interferometry (LCI) was adapted with a controlled pressure-generating system to record the pneumatic response of the TM and to estimate middle ear pressure (MEP). Forty-two ears diagnosed as normal (n = 25), with OM (n = 10), or associated with an upper respiratory infection (URI) (n = 7) were imaged with a pneumatic LCI otoscope with an axial, transverse, and temporal resolution of 6 µm, 20 µm, and 1 msec, respectively. The TM displacement under pneumatic pressure transients (a duration of 0.5 sec with an intensity of ± 150 daPa) was measured to compute two metrics (compliance and amplitude ratio). These metrics were correlated with peak acoustic admittance and MEP from tympanometry and statistically compared via Welch’s t-test. As a result, the compliance represents pneumatic TM mobility, and the amplitude ratio estimates MEP. The presence of a middle ear effusion (MEE) significantly decreased compliance (p<0.001). The amplitude ratio of the OM group was statistically less than that of the normal group (p<0.01), indicating positive MEP. Unlike tympanometry, pneumatic LCI otoscopy quantifies TM mobility as well as MEP regardless of MEE presence. With combined benefits of pneumatic otoscopy and tympanometry, pneumatic LCI otoscopy may provide new quantitative metrics for understanding TM dynamics and diagnosing OM. © 2018 Optical Society of America under the terms of the OSA Open Access Publishing Agreement
OCIS codes: (170.4940) Otolaryngology; (170.4500) Optical coherence tomography; (170.4580) Optical diagnostics for medicine; (170.3880) Medical and biological imaging; (170.1610) Clinical applications.
References and links
1. D. W. Teele, J. O. Klein, and B. Rosner, “Epidemiology of otitis media during the first seven years of life in children in greater Boston: a prospective, cohort study,” J. Infect. Dis. 160(1), 83–94 (1989).
Vol. 9, No. 2 | 1 Feb 2018 | BIOMEDICAL OPTICS EXPRESS 397
#308905 Journal © 2018
https://doi.org/10.1364/BOE.9.000397 Received 25 Oct 2017; revised 18 Dec 2017; accepted 21 Dec 2017; published 3 Jan 2018
2. A. Vergison, R. Dagan, A. Arguedas, J. Bonhoeffer, R. Cohen, I. Dhooge, A. Hoberman, J. Liese, P. Marchisio, A. A. Palmu, G. T. Ray, E. A. Sanders, E. A. Simões, M. Uhari, J. van Eldere, and S. I. Pelton, “Otitis media and its consequences: beyond the earache,” Lancet Infect. Dis. 10(3), 195–203 (2010).
3. L. Monasta, L. Ronfani, F. Marchetti, M. Montico, L. Vecchi Brumatti, A. Bavcar, D. Grasso, C. Barbiero, and G. Tamburlini, “Burden of disease caused by otitis media: systematic review and global estimates,” PLoS One 7(4), e36226 (2012).
4. X. Guan and R. Z. Gan, “Mechanisms of tympanic membrane and incus mobility loss in acute otitis media model of guinea pig,” J. Assoc. Res. Otolaryngol. 14(3), 295–307 (2013).
5. A. S. Lieberthal, A. E. Carroll, T. Chonmaitree, T. G. Ganiats, A. Hoberman, M. A. Jackson, M. D. Joffe, D. T. Miller, R. M. Rosenfeld, X. D. Sevilla, R. H. Schwartz, P. A. Thomas, and D. E. Tunkel, “The diagnosis and management of acute otitis media,” Pediatrics 131(3), e964–e999 (2013).
6. J. R. Casey and M. E. Pichichero, “Acute otitis media: Update 2015,” http://contemporarypediatrics.modernmedicine.com/contemporary-pediatrics/news/acute-otitis-media-update-2015
7. R. M. Rosenfeld, J. J. Shin, S. R. Schwartz, R. Coggins, L. Gagnon, J. M. Hackell, D. Hoelting, L. L. Hunter, A. W. Kummer, S. C. Payne, D. S. Poe, M. Veling, P. M. Vila, S. A. Walsh and M. D. Corrigan, “Clinical practice guidelines: otitis media with effusion (update),” Otolaryngol. Head Neck Surg. 154(1S), S1–S41 (2016).
8. P. H. Karma, M. A. Penttilä, M. M. Sipilä, and M. J. Kataja, “Otoscopic diagnosis of middle ear effusion in acute and non-acute otitis media. I. The value of different otoscopic findings,” Int. J. Pediatr. Otorhinolaryngol. 17(1), 37–49 (1989).
9. G. S. Takata, L. S. Chan, T. Morphew, R. Mangione-Smith, S. C. Morton, and P. Shekelle, “Evidence assessment of the accuracy of methods of diagnosing middle ear effusion in children with otitis media with effusion,” Pediatrics 112(6), 1379–1387 (2003).
10. P. Abbott, S. Rosenkranz, W. Hu, H. Gunasekera, and J. Reath, “The effect and acceptability of tympanometry and pneumatic otoscopy in general practitioner diagnosis and management of childhood ear disease,” BMC Fam. Pract. 15(1), 181 (2014).
11. W. S. Jones and P. H. Kaleida, “How helpful is pneumatic otoscopy in improving diagnostic accuracy?” Pediatrics 112(3), 510–513 (2003).
12. E. Onusko, “Tympanometry,” Am. Fam. Physician 70(9), 1713–1720 (2004). 13. A. Palmu, H. Puhakka, T. Rahko, and A. K. Takala, “Diagnostic value of tympanometry in infants in clinical
practice,” Int. J. Pediatr. Otorhinolaryngol. 49(3), 207–213 (1999). 14. K. Anwar, S. Khan, H. U. Rehman, M. Javaid, and I. Shahabi, “Otitis media with effusion: Accuracy of
tympanometry in detecting fluid in the middle ears of children at myringotomies,” Pak. J. Med. Sci. 32(2), 466–470 (2016).
15. D. Huang, E. A. Swanson, C. P. Lin, J. S. Schuman, W. G. Stinson, W. Chang, M. R. Hee, T. Flotte, K. Gregory, C. A. Puliafito, and J. G. Fujimoto, “Optical coherence tomography,” Science 254(5035), 1178–1181 (1991).
16. C. T. Nguyen, H. Tu, E. J. Chaney, C. N. Stewart, and S. A. Boppart, “Non-invasive optical interferometry for the assessment of biofilm growth in the middle ear,” Biomed. Opt. Express 1(4), 1104–1116 (2010).
17. C. T. Nguyen, W. Jung, J. Kim, E. J. Chaney, M. Novak, C. N. Stewart, and S. A. Boppart, “Noninvasive in vivo optical detection of biofilm in the human middle ear,” Proc. Natl. Acad. Sci. U.S.A. 109(24), 9529–9534 (2012).
18. R. L. Shelton, W. Jung, S. I. Sayegh, D. T. McCormick, J. Kim, and S. A. Boppart, “Optical coherence tomography for advanced screening in the primary care office,” J. Biophotonics 7(7), 525–533 (2014).
19. G. L. Monroy, R. L. Shelton, R. M. Nolan, C. T. Nguyen, M. A. Novak, M. C. Hill, D. T. McCormick, and S. A. Boppart, “Noninvasive depth-resolved optical measurements of the tympanic membrane and middle ear for differentiating otitis media,” Laryngoscope 125(8), E276–E282 (2015).
20. G. L. Monroy, P. Pande, R. L. Shelton, R. M. Nolan, D. R. Spillman, Jr., R. G. Porter, M. A. Novak, and S. A. Boppart, “Non-invasive optical assessment of viscosity of middle ear effusions in otitis media,” J. Biophotonics 10(3), 394–403 (2017).
21. R. L. Shelton, R. M. Nolan, G. L. Monroy, P. Pande, M. A. Novak, R. G. Porter, and S. A. Boppart, “Quantitative pneumatic otoscopy using a light-based ranging technique,” J. Assoc. Res. Otolaryngol. 18(4), 555–568 (2017).
22. J. Welzel, “Optical coherence tomography in dermatology: a review,” Skin Res. Technol. 7(1), 1–9 (2001). 23. D. R. Richmond, J. T. Yelverton, E. R. Fletcher, and Y. Y. Phillips, “Physical correlates of eardrum rupture,”
Ann. Otol. Rhinol. Laryngol. Suppl. 98(5_suppl), 35–41 (1989). 24. C. A. Ostergard and D. R. Carter, “Positive middle ear pressure shown by tympanometry,” Arch. Otolaryngol.
107(6), 353–356 (1981). 25. M. Fiellau-Nikolajsen, “Tympanometry and middle ear effusion: a cohort-study in three-year-old children,” Int.
J. Pediatr. Otorhinolaryngol. 2(1), 39–49 (1980). 26. C. D. Bluestone, Q. C. Beery, and J. L. Paradise, “Audiometry and tympanometry in relation to middle ear
effusions in children,” Laryngoscope 83(4), 594–604 (1973). 27. V. J. Jaisinghani, L. L. Hunter, Y. Li, and R. H. Margolis, “Quantitative analysis of tympanic membrane disease
using video-otoscopy,” Laryngoscope 110(10), 1726–1730 (2000). 28. Y.-S. Cho, D.-K. Lee, C.-K. Lee, M. H. Ko, and H.-S. Lee, “Video pneumatic otoscopy for the diagnosis of otitis
media with effusion: a quantitative approach,” Eur. Arch. Otorhinolaryngol. 266(7), 967–973 (2009).
Vol. 9, No. 2 | 1 Feb 2018 | BIOMEDICAL OPTICS EXPRESS 398
29. P. Pande, R. L. Shelton, G. L. Monroy, R. M. Nolan, and S. A. Boppart, “Low-cost hand-held probe for depth-resolved low-coherence interferometry,” Biomed. Opt. Express 8(1), 338–348 (2017).
30. C. T. Nguyen, S. R. Robinson, W. Jung, M. A. Novak, S. A. Boppart, and J. B. Allen, “Investigation of bacterial biofilm in the human middle ear using optical coherence tomography and acoustic measurements,” Hear. Res. 301, 193–200 (2013).
1. Introduction
Otitis media (OM), a middle ear infection, is a ubiquitous disease in early childhood, where more than 80% of children in the United States experience at least one infection before the age of 3 [1–3]. One identifying feature of OM is the accumulation of fluid in the middle ear cavity, known as a middle ear effusion (MEE), which contributes to the reduced mobility of the tympanic membrane (TM) [4]. Decreased TM mobility from MEEs and middle ear pressure (MEP) causes acoustic dampening of sound, and disrupts the sound transmission to the inner ear, which may lead to conductive hearing loss if a MEE does not resolve on its own and remains untreated.
To determine the presence of a MEE, examining TM mobility with a pneumatic otoscope is strongly recommended by the American Academy of Pediatrics, the American Academy of Otolaryngology – Head and Neck Surgery Foundation, and the American Academy of Family Physicians [5–7], as the diagnostic accuracy based solely on the visible features of the TM, such as color, transparency, and opacity, varies widely [8]. In addition, a sensitivity of 94% in detecting MEEs was determined for pneumatic otoscopy, again validating an importance of evaluating TM mobility during a clinical examination [9]. However, only around 20% of physicians use a pneumatic otoscope on a regular basis, since the subjective assessments are difficult to interpret, and the procedure is believed to be inconvenient and difficult to perform correctly [10, 11]. Since pneumatic otoscopy has been identified as a key tool to establish a diagnosis of OM, there is a greater need for an enhanced pneumatic device that can quantify TM mobility to provide objective and valuable information to physicians for improved diagnosis and management of OM.
Several other methods are available to assess TM mobility and the possibility of a MEE. The most commonly used technique is tympanometry, which employs a single frequency tone (typically 226 Hz) to measure the acoustic admittance of the TM, also interpreted as acoustic mobility, as the ear canal pressure (ECP) is varied [12]. Tympanometry provides a plot of admittance versus ECP, a tympanogram, categorized into ‘type A’, ‘type B’, and ‘type C’. A ‘type A’ tympanogram contains a sharp peak acoustic admittance (PA), and indicates normal functioning of the middle ear. A ‘type B’ tympanogram, a flat plot, determines the presence of a MEE with around a 70-90% sensitivity, but with a negative predictive value of only around 50% [12–14]. Furthermore, a ‘type B’ tympanogram provides neither the PA nor the MEP due to the acoustically immobile TM reflecting the most tone. This results in a rather binary (Yes/No) output versus quantitative analysis, limiting the diagnostic and monitoring capability of tympanometry for OM patients. A ‘type C’ tympanogram, a shifted tympanogram with lower PA, indicates a significantly negative MEP and may be pathological, but is inconclusive as a diagnostic criterion [12]. Therefore, tympanometry alone is not sufficient for physicians to fully examine the decreased TM mobility experienced during OM.
Low coherence interferometry (LCI) is an optical ranging technique that can generate high-resolution depth-resolved scans of non-transparent optically scattering tissue structures based on their optical reflectivity. LCI is the fundamental basis of optical coherence tomography (OCT), a biomedical imaging modality that is an optical analogue of ultrasound imaging, first published in 1991 [15]. Our previous studies have developed portable, handheld, LCI and OCT systems to visualize the human TM and MEE in vivo, and showed that OCT can provide quantitative structural and mechanical information (TM thickness, MEE and biofilm presence, MEE viscosity) in the middle ear [16–20]. A more recent study showed the development of an LCI system with pneumatic function using a piston,
Vol. 9, No. 2 | 1 Feb 2018 | BIOMEDICAL OPTICS EXPRESS 399
demonstrating the potential to measure the pneumatic-induced motions of the TM in adults [21]. In this paper, a pneumatic LCI otoscopy system with improved automated pressure generation is presented with TM mobility measurements in pediatric OM patients, and compared to standard tympanometry to establish clinical relevance.
2. Methods
2.1 Pneumatic LCI-otoscope imaging system
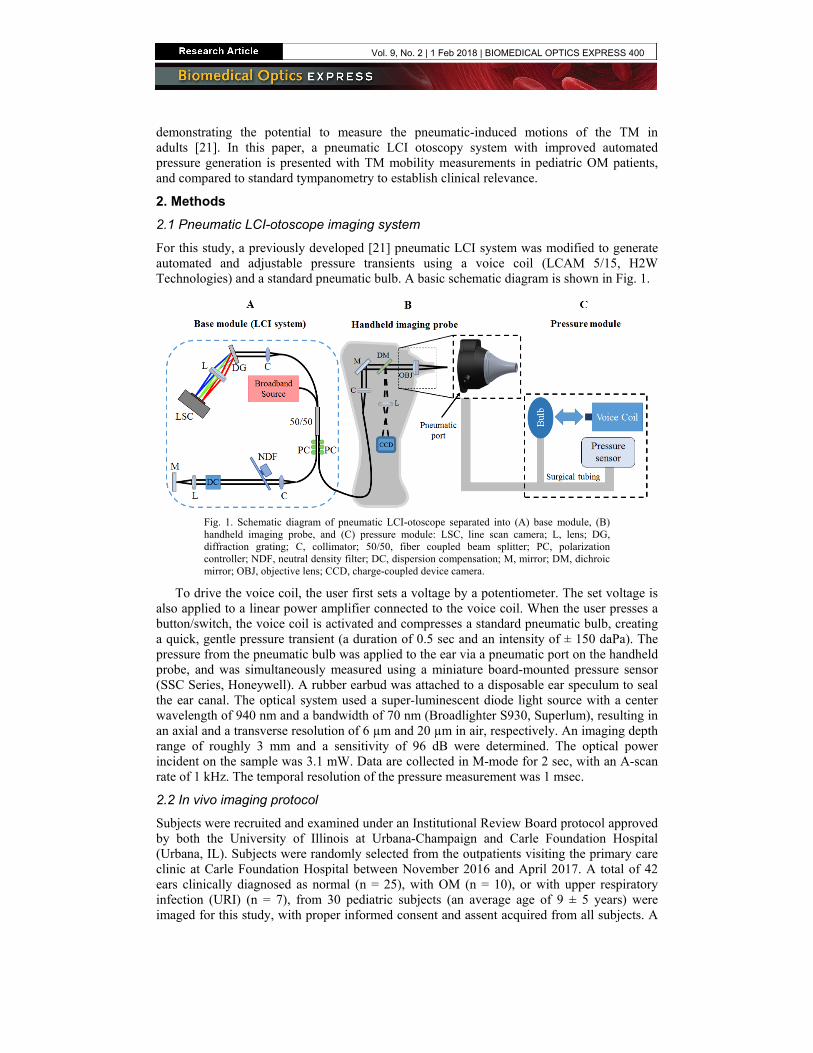
For this study, a previously developed [21] pneumatic LCI system was modified to generate automated and adjustable pressure transients using a voice coil (LCAM 5/15, H2W Technologies) and a standard pneumatic bulb. A basic schematic diagram is shown in Fig. 1.
Fig. 1. Schematic diagram of pneumatic LCI-otoscope separated into (A) base module, (B) handheld imaging probe, and (C) pressure module: LSC, line scan camera; L, lens; DG, diffraction grating; C, collimator; 50/50, fiber coupled beam splitter; PC, polarization controller; NDF, neutral density filter; DC, dispersion compensation; M, mirror; DM, dichroic mirror; OBJ, objective lens; CCD, charge-coupled device camera.
To drive the voice coil, the user first sets a voltage by a potentiometer. The set voltage is also applied to a linear power amplifier connected to the voice coil. When the user presses a button/switch, the voice coil is activated and compresses a standard pneumatic bulb, creating a quick, gentle pressure transient (a duration of 0.5 sec and an intensity of ± 150 daPa). The pressure from the pneumatic bulb was applied to the ear via a pneumatic port on the handheld probe, and was simultaneously measured using a miniature board-mounted pressure sensor (SSC Series, Honeywell). A rubber earbud was attached to a disposable ear speculum to seal the ear canal. The optical system used a super-luminescent diode light source with a center wavelength of 940 nm and a bandwidth of 70 nm (Broadlighter S930, Superlum), resulting in an axial and a transverse resolution of 6 µm and 20 µm in air, respectively. An imaging depth range of roughly 3 mm and a sensitivity of 96 dB were determined. The optical power incident on the sample was 3.1 mW. Data are collected in M-mode for 2 sec, with an A-scan rate of 1 kHz. The temporal resolution of the pressure measurement was 1 msec.
2.2 In vivo imaging protocol
Subjects were recruited and examined under an Institutional Review Board protocol approved by both the University of Illinois at Urbana-Champaign and Carle Foundation Hospital (Urbana, IL). Subjects were randomly selected from the outpatients visiting the primary care clinic at Carle Foundation Hospital between November 2016 and April 2017. A total of 42 ears clinically diagnosed as normal (n = 25), with OM (n = 10), or with upper respiratory infection (URI) (n = 7), from 30 pediatric subjects (an average age of 9 ± 5 years) were imaged for this study, with proper informed consent and assent acquired from all subjects. A
Vol. 9, No. 2 | 1 Feb 2018 | BIOMEDICAL OPTICS EXPRESS 400
total of four pediatricians, with a range of 2 to 35 years of experience, were involved in the subject recruitment and imaging for the study. The ears with an outer ear infection, TM perforation, or a tympanostomy tube were excluded from the study. There were no exclusions based on gender, race, or ethnicity. There was low associated risk involved in the study, as LCI is a non-invasive optical imaging technique using low-power near-infrared light [22], and the maximum possible pressure stimuli was 250 daPa, roughly 60% of the maximum pressure of tympanometry [23].
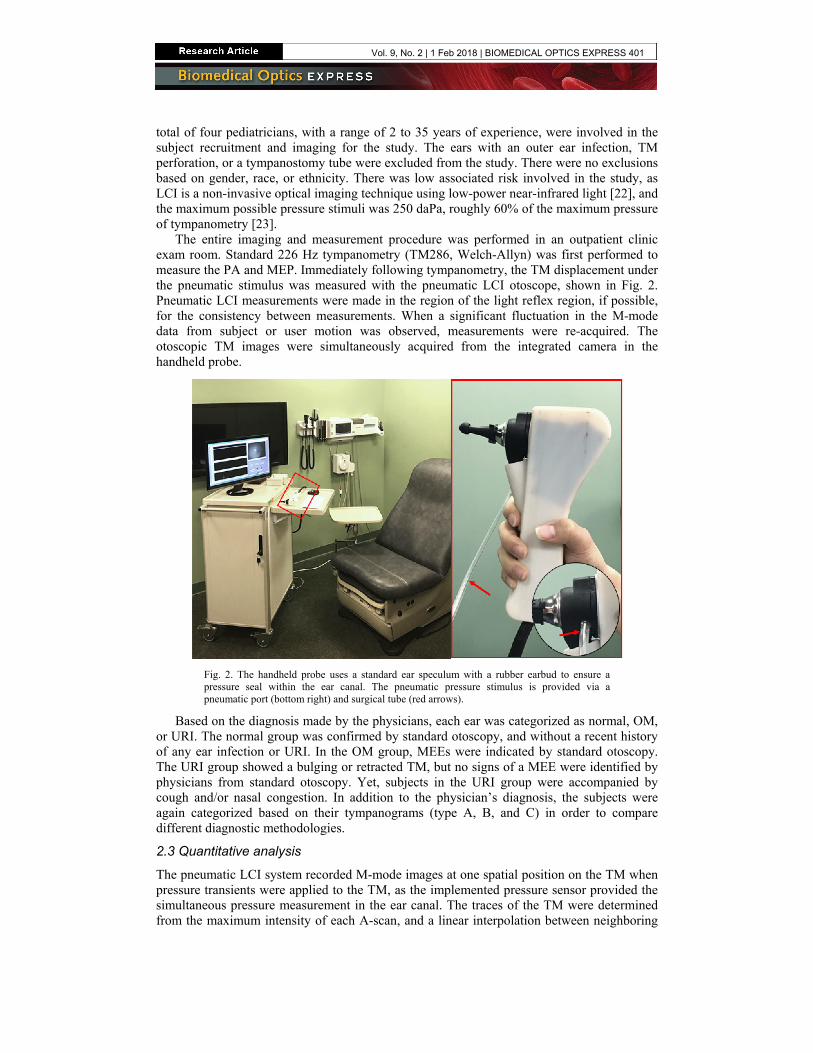
The entire imaging and measurement procedure was performed in an outpatient clinic exam room. Standard 226 Hz tympanometry (TM286, Welch-Allyn) was first performed to measure the PA and MEP. Immediately following tympanometry, the TM displacement under the pneumatic stimulus was measured with the pneumatic LCI otoscope, shown in Fig. 2. Pneumatic LCI measurements were made in the region of the light reflex region, if possible, for the consistency between measurements. When a significant fluctuation in the M-mode data from subject or user motion was observed, measurements were re-acquired. The otoscopic TM images were simultaneously acquired from the integrated camera in the handheld probe.
Fig. 2. The handheld probe uses a standard ear speculum with a rubber earbud to ensure a pressure seal within the ear canal. The pneumatic pressure stimulus is provided via a pneumatic port (bottom right) and surgical tube (red arrows).
Based on the diagnosis made by the physicians, each ear was categorized as normal, OM, or URI. The normal group was confirmed by standard otoscopy, and without a recent history of any ear infection or URI. In the OM group, MEEs were indicated by standard otoscopy. The URI group showed a bulging or retracted TM, but no signs of a MEE were identified by physicians from standard otoscopy. Yet, subjects in the URI group were accompanied by cough and/or nasal congestion. In addition to the physician’s diagnosis, the subjects were again categorized based on their tympanograms (type A, B, and C) in order to compare different diagnostic methodologies.
2.3 Quantitative analysis
The pneumatic LCI system recorded M-mode images at one spatial position on the TM when pressure transients were applied to the TM, as the implemented pressure sensor provided the simultaneous pressure measurement in the ear canal. The traces of the TM were determined from the maximum intensity of each A-scan, and a linear interpolation between neighboring
Vol. 9, No. 2 | 1 Feb 2018 | BIOMEDICAL OPTICS EXPRESS 401
pixels was used to obtain sub-pixel accuracy. To ensure the identical depth position on the TM was taken, a threshold for the depth difference between two adjacent A-scans was utilized. The TM displacements were calculated from the traces, where zero displacement was noted as the average position of 200 A-scans prior to the pressure transient. Based on the TM displacement and the pressure measurement, two quantitative metrics were defined:
MAX
MAX
displacementcompliance
|pressure|= (1)
MAX MAX
MAX MAX
(+)displacement |(-)pressure|amplitude ratio ,
(+)pressure |(-)displacement|= ⋅ (2)
where the maximum displacement and maximum pressure indicate the positive maximum value from zero, independently, and (+) and (-) indicate the positive and negative displacements of the TM, and the pressure. The unit of compliance is µm/mmHg, while the amplitude ratio is unit-less. As the primary parameter in the metrics is the TM displacement, conjugate M-mode data were also analyzed.
It is hypothesized that the compliance indicates the pneumatically-induced TM mobility, while the amplitude ratio is associated with the ratio of MEP relative to pressure in the ear canal. It is thus expected that the decreased mobility of the TM in OM patients is quantified by the compliance. Furthermore, the MEP causing the bulging or retracted TM in the URI group may be estimated from the amplitude ratio. Pneumatic LCI metrics were correlated with the PA and MEP determined by tympanometry using a linear regression (least-squares fit). The two metrics of each diagnostic group were statistically compared using Welch’s t test via MATLAB to examine the capability of the metrics in determining the presence of MEE and estimating the MEP.
3. Results
The pneumatic LCI data sets (the traces of the TM position in response to the pressure stimulus, and the otoscopic image of the TM) and tympanograms were acquired from 42 ears from 30 pediatric subjects. Metrics (compliance and amplitude ratio) were computed from LCI data to quantify the TM mobility and to estimate MEP. A summary of the data is shown in Data File 1. The pneumatic-induced displacement and dynamics of the TM in normal ears and ears with MEEs are described herein.
3.1 Representative pneumatic response of ear
Representative pneumatic LCI data sets from a normal subject are shown in Fig. 3(A). As in Fig. 3(A-3), the dynamics of the TM closely follow the pressure stimulus, although the relaxation dynamics of the TM and the pressure showed an exponential decay due to the partially sealed ear canal. A pneumatic bulb was rapidly (in 50 msec) compressed by the voice coil to generate positive pressure (~150 daPa), causing a positive TM displacement (inward). As the pneumatic bulb returned to its original resting state, negative pressure was applied to the ear, creating a negative TM displacement (outward). Considering that the pneumatic bulb generates both positive and negative pressure with a similar intensity, it was surprising that the outward TM displacement was roughly 40% greater than the inward TM displacement. This suggests that the pressure difference between the ear canal and middle ear was less when the negative pressure was applied, indicating negative MEP. This was confirmed with tympanometry (MEP of −20 daPa) and validated by the literature where it is noted that normal middle ears tend to have slightly negative MEP, as the air is absorbed by the lining of the middle ear [12].
Figure 3(B) shows representative pneumatic LCI data sets from a subject with OM. Figure 3(B-1) reveals the presence of a MEE (white arrows). In addition, the pneumatic
Vol. 9, No. 2 | 1 Feb 2018 | BIOMEDICAL OPTICS EXPRESS 402
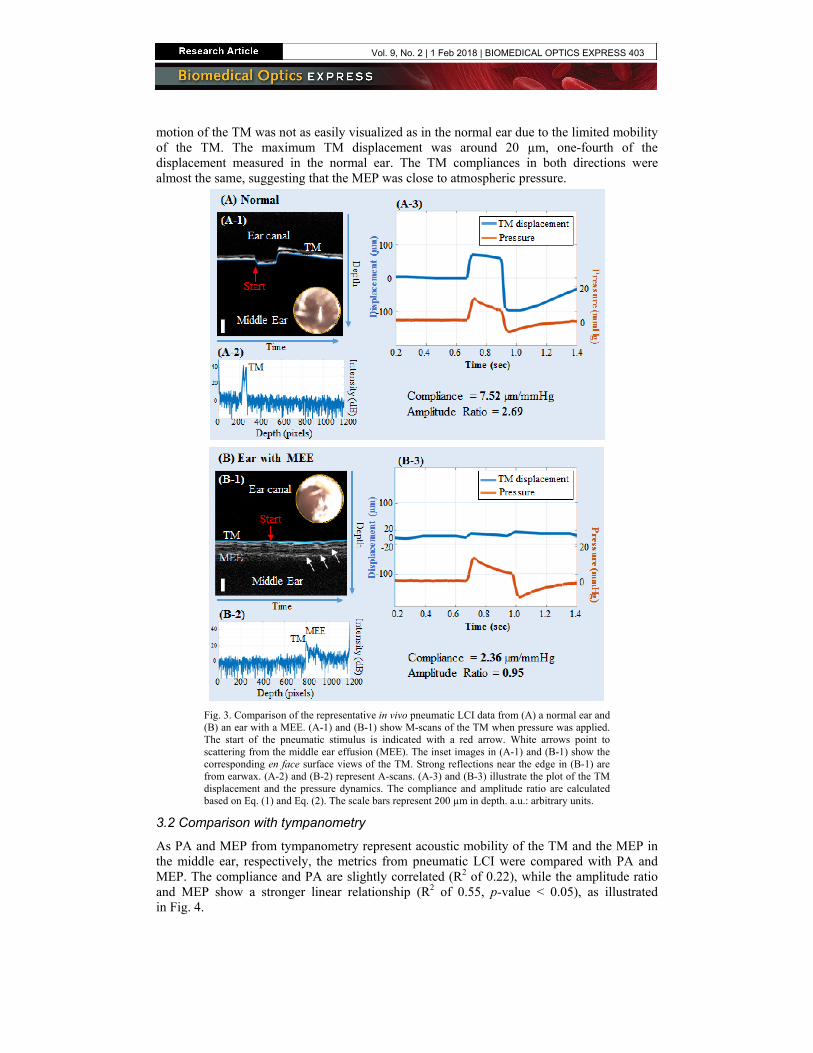
motion of the TM was not as easily visualized as in the normal ear due to the limited mobility of the TM. The maximum TM displacement was around 20 µm, one-fourth of the displacement measured in the normal ear. The TM compliances in both directions were almost the same, suggesting that the MEP was close to atmospheric pressure.
Fig. 3. Comparison of the representative in vivo pneumatic LCI data from (A) a normal ear and (B) an ear with a MEE. (A-1) and (B-1) show M-scans of the TM when pressure was applied. The start of the pneumatic stimulus is indicated with a red arrow. White arrows point to scattering from the middle ear effusion (MEE). The inset images in (A-1) and (B-1) show the corresponding en face surface views of the TM. Strong reflections near the edge in (B-1) are from earwax. (A-2) and (B-2) represent A-scans. (A-3) and (B-3) illustrate the plot of the TM displacement and the pressure dynamics. The compliance and amplitude ratio are calculated based on Eq. (1) and Eq. (2). The scale bars represent 200 µm in depth. a.u.: arbitrary units.
3.2 Comparison with tympanometry
As PA and MEP from tympanometry represent acoustic mobility of the TM and the MEP in the middle ear, respectively, the metrics from pneumatic LCI were compared with PA and MEP. The compliance and PA are slightly correlated (R2 of 0.22), while the amplitude ratio and MEP show a stronger linear relationship (R2 of 0.55, p-value < 0.05), as illustrated in Fig. 4.
Vol. 9, No. 2 | 1 Feb 2018 | BIOMEDICAL OPTICS EXPRESS 403
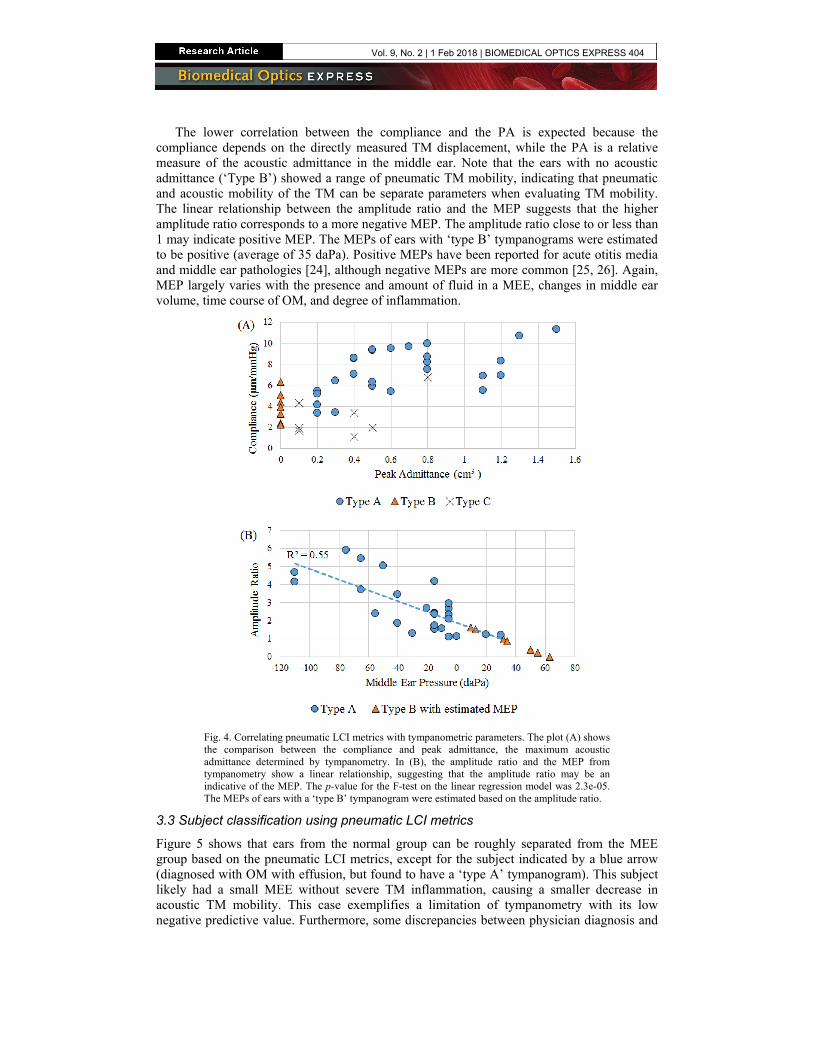
The lower correlation between the compliance and the PA is expected because the compliance depends on the directly measured TM displacement, while the PA is a relative measure of the acoustic admittance in the middle ear. Note that the ears with no acoustic admittance (‘Type B’) showed a range of pneumatic TM mobility, indicating that pneumatic and acoustic mobility of the TM can be separate parameters when evaluating TM mobility. The linear relationship between the amplitude ratio and the MEP suggests that the higher amplitude ratio corresponds to a more negative MEP. The amplitude ratio close to or less than 1 may indicate positive MEP. The MEPs of ears with ‘type B’ tympanograms were estimated to be positive (average of 35 daPa). Positive MEPs have been reported for acute otitis media and middle ear pathologies [24], although negative MEPs are more common [25, 26]. Again, MEP largely varies with the presence and amount of fluid in a MEE, changes in middle ear volume, time course of OM, and degree of inflammation.
Fig. 4. Correlating pneumatic LCI metrics with tympanometric parameters. The plot (A) shows the comparison between the compliance and peak admittance, the maximum acoustic admittance determined by tympanometry. In (B), the amplitude ratio and the MEP from tympanometry show a linear relationship, suggesting that the amplitude ratio may be an indicative of the MEP. The p-value for the F-test on the linear regression model was 2.3e-05. The MEPs of ears with a ‘type B’ tympanogram were estimated based on the amplitude ratio.
3.3 Subject classification using pneumatic LCI metrics
Figure 5 shows that ears from the normal group can be roughly separated from the MEE group based on the pneumatic LCI metrics, except for the subject indicated by a blue arrow (diagnosed with OM with effusion, but found to have a ‘type A’ tympanogram). This subject likely had a small MEE without severe TM inflammation, causing a smaller decrease in acoustic TM mobility. This case exemplifies a limitation of tympanometry with its low negative predictive value. Furthermore, some discrepancies between physician diagnosis and
Vol. 9, No. 2 | 1 Feb 2018 | BIOMEDICAL OPTICS EXPRESS 404
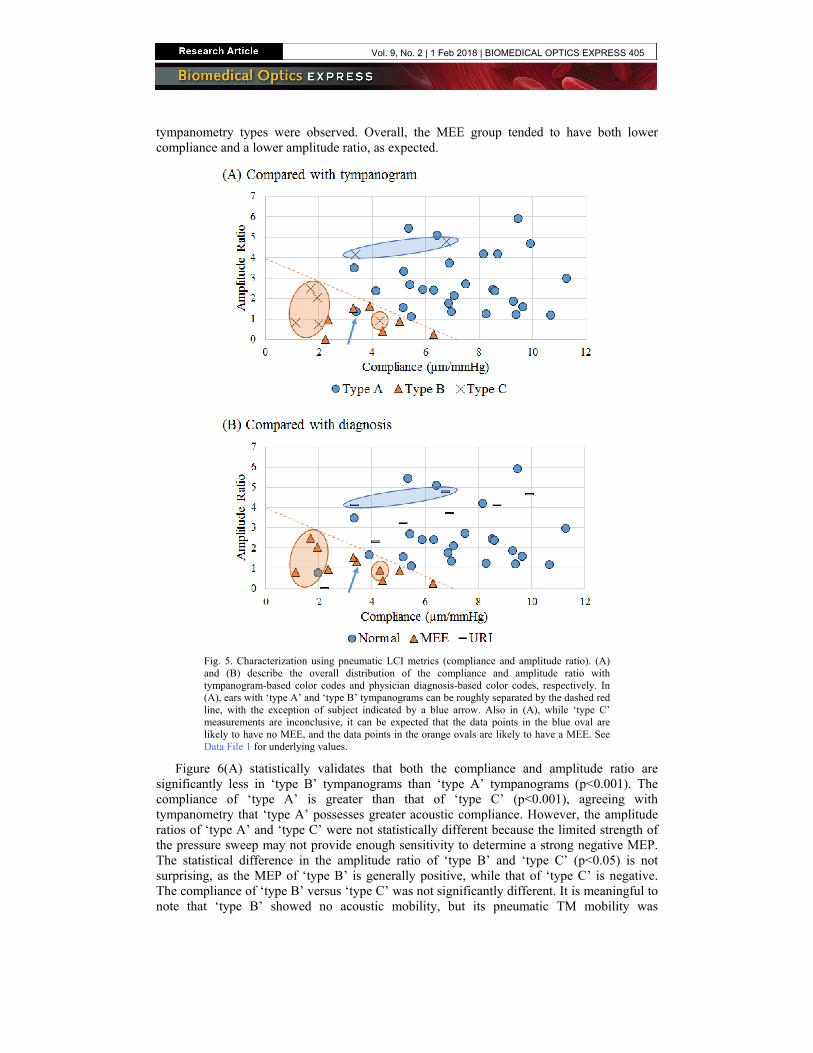
tympanometry types were observed. Overall, the MEE group tended to have both lower compliance and a lower amplitude ratio, as expected.
Fig. 5. Characterization using pneumatic LCI metrics (compliance and amplitude ratio). (A) and (B) describe the overall distribution of the compliance and amplitude ratio with tympanogram-based color codes and physician diagnosis-based color codes, respectively. In (A), ears with ‘type A’ and ‘type B’ tympanograms can be roughly separated by the dashed red line, with the exception of subject indicated by a blue arrow. Also in (A), while ‘type C’ measurements are inconclusive, it can be expected that the data points in the blue oval are likely to have no MEE, and the data points in the orange ovals are likely to have a MEE. See Data File 1 for underlying values.
Figure 6(A) statistically validates that both the compliance and amplitude ratio are significantly less in ‘type B’ tympanograms than ‘type A’ tympanograms (p<0.001). The compliance of ‘type A’ is greater than that of ‘type C’ (p<0.001), agreeing with tympanometry that ‘type A’ possesses greater acoustic compliance. However, the amplitude ratios of ‘type A’ and ‘type C’ were not statistically different because the limited strength of the pressure sweep may not provide enough sensitivity to determine a strong negative MEP. The statistical difference in the amplitude ratio of ‘type B’ and ‘type C’ (p<0.05) is not surprising, as the MEP of ‘type B’ is generally positive, while that of ‘type C’ is negative. The compliance of ‘type B’ versus ‘type C’ was not significantly different. It is meaningful to note that ‘type B’ showed no acoustic mobility, but its pneumatic TM mobility was
Vol. 9, No. 2 | 1 Feb 2018 | BIOMEDICAL OPTICS EXPRESS 405
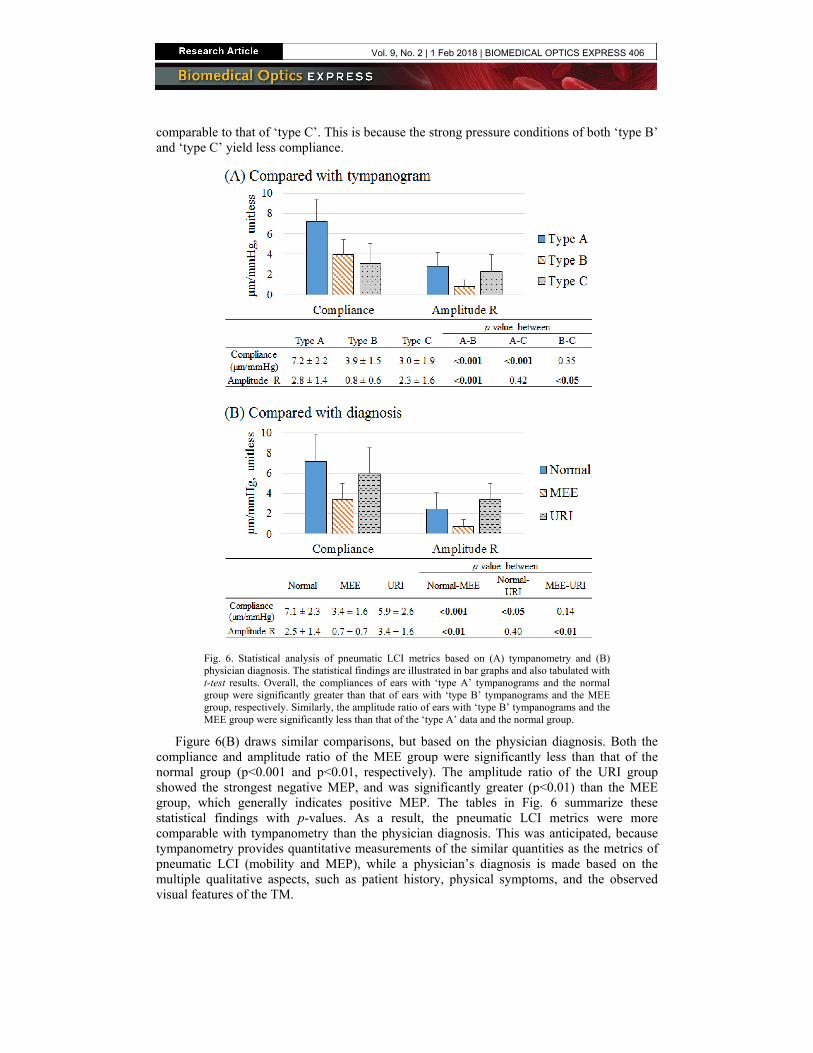
comparable to that of ‘type C’. This is because the strong pressure conditions of both ‘type B’ and ‘type C’ yield less compliance.
Fig. 6. Statistical analysis of pneumatic LCI metrics based on (A) tympanometry and (B) physician diagnosis. The statistical findings are illustrated in bar graphs and also tabulated with t-test results. Overall, the compliances of ears with ‘type A’ tympanograms and the normal group were significantly greater than that of ears with ‘type B’ tympanograms and the MEE group, respectively. Similarly, the amplitude ratio of ears with ‘type B’ tympanograms and the MEE group were significantly less than that of the ‘type A’ data and the normal group.
Figure 6(B) draws similar comparisons, but based on the physician diagnosis. Both the compliance and amplitude ratio of the MEE group were significantly less than that of the normal group (p<0.001 and p<0.01, respectively). The amplitude ratio of the URI group showed the strongest negative MEP, and was significantly greater (p<0.01) than the MEE group, which generally indicates positive MEP. The tables in Fig. 6 summarize these statistical findings with p-values. As a result, the pneumatic LCI metrics were more comparable with tympanometry than the physician diagnosis. This was anticipated, because tympanometry provides quantitative measurements of the similar quantities as the metrics of pneumatic LCI (mobility and MEP), while a physician’s diagnosis is made based on the multiple qualitative aspects, such as patient history, physical symptoms, and the observed visual features of the TM.
Vol. 9, No. 2 | 1 Feb 2018 | BIOMEDICAL OPTICS EXPRESS 406
4. Discussion
Although pneumatic otoscopy allows physicians to observe the general motion of the TM in response to the applied pressure change, its accuracy relies on the users’ experience and expertise. This study demonstrates that pneumatic LCI otoscopy can provide a quantitative measurement of the TM dynamics while maintaining the benefits of pneumatic otoscopy. Both objective and quantitative metrics (compliance and amplitude ratio) are utilized to represent the pneumatic mobility of the TM and the MEP, and are shown to be comparable to tympanometry.
4.1 Understanding pneumatic LCI metrics
Measuring the TM displacement has been of great interest for researchers and physicians to understand the loss in TM mobility caused by the presence of MEE and altered MEP. Although a few studies have quantitatively examined pneumatic-induced motions of the TM using video otoscopy [27, 28], no clinical studies have directly measured the TM displacement in response to pneumatic stimuli in vivo with different pathological conditions in pediatric subjects. By capturing the pneumatic-induced motion of the TM, our pneumatic LCI system may offer new parameters to study real-time TM dynamics in OM. The compliance calculates the TM displacement per unit pressure, and was also introduced and discussed in our previous study [21]. This quantitative metric converts the TM mobility examined from standard pneumatic otoscopy to an objective parameter. As expected, a MEE significantly reduced the TM compliance, agreeing with our previous study on adult subjects. However, low compliance itself was not sufficient enough to determine the presence of MEE. Nonetheless, the depth-resolved imaging capability of LCI offers the ability to detect optically scattering particles that may exist within a MEE, and thereby provide a clear diagnostic marker for a MEE.
Besides mobility, pneumatic otoscopy is also used to examine the position of the TM (retracted or bulging), which augments the qualitative assessment of MEP. The amplitude ratio converts this position of the TM to the quantitative MEP, based on the comparison of the TM displacements in two opposite directions. The amplitude ratio can define the MEP in subjects with MEE, and may indicate the stage of the MEE accumulation. For example, subjects with a MEE and with the greater amplitude ratio (negative MEP) tend to be in the early-stage or recovering stage of OM, while most subjects with an amplitude ratio close to 0 (positive MEP) were diagnosed as having a full mucoid (thicker, more viscous) effusion. A more accurate linear relationship between the amplitude ratio and MEP can be defined with a greater number of subjects, and by applying stronger pressure transients to improve sensitivity, although this may increase subject discomfort. Future studies will investigate the effect of the types and amount of MEE on the TM mobility by comparing the pneumatic LCI metrics with the cross-sectional OCT images of the middle ear, and will continue to build the normative database for different infection states using pneumatic LCI otoscopy.
4.2 Advantages of pneumatic LCI for OM diagnosis
Pneumatic LCI provides TM compliance in response to pressure stimuli, and no other techniques can directly measure the depth-resolved pneumatic mobility of the human TM in vivo. Pneumatic LCI can provide quantitative measurements regardless of the presence of a MEE, whereas tympanometry cannot for a ‘type B’ tympanogram. The LCI measurements are less affected by a blockage of the ear canal than tympanometry, as pneumatic LCI employs a point-based depth-resolved measurement. Our system generates both an en face view of the TM surface as well as depth-resolved information, while tympanometry cannot deliver any visual information to the physicians, requiring otoscopy. Furthermore, the depth-resolved information obtained with LCI may directly and visually indicate the presence of a MEE.
Vol. 9, No. 2 | 1 Feb 2018 | BIOMEDICAL OPTICS EXPRESS 407
When compared to pneumatic otoscopy, pneumatic LCI offers computer-controlled pressure transients from a pneumatic bulb, reducing the variability of the pressure pulses between physicians. The strength of the air puff is adjustable, and can be as gentle as 50 daPa because even subtle motions (tens of microns) of the TM can be measured, which are not readily visualized with the human eye, and which enable a more sensitive examination of TM mobility in vivo. Furthermore, the simultaneous pressure measurement can notify users if there is any air leak. Overall, pneumatic LCI otoscopy can offer more dynamic information for subjects with MEE than tympanometry, and directly measure TM displacements with potentially gentler and more precisely controlled air pressure transients than pneumatic otoscopy.
4.3 Limitations and future studies
There are two major limitations of this study. The first is the lack of a gold-standard for confirming a presence of a MEE due to the required invasive procedure of tympanocentesis, which involves a surgical incision of the TM and aspiration of the MEE. Given the relatively small sample volume of a MEE, particularly in pathological conditions, this collection and validation is extremely challenging and impractical in routine clinical exams. While there are many advantages of pneumatic LCI as a quantitative middle ear diagnostic tool, the second major limitation of this study involved the challenges associated with our current pneumatic LCI system. The LCI light ranging technique generates high-resolution depth information when the light is focused on or near the TM, and our handheld probe is specifically designed based on a standard ear speculum to help users guide the LCI beam. A single point-based measurement, however, cannot represent the overall TM mobility. Therefore, all measurements were taken near the light reflex region of the TM, guided by the en face view of the TM during imaging. By positioning the light beam over other regions of the TM, it is also possible to assess subtle regional differences in TM mobility that may exist [21]. The accuracy of the pressure measurement depends on the complete sealing of the speculum in the ear canal, which also applies to tympanometry. A standard ear speculum with a rubber earbud provided a more secure and comfortable sealing of the ear canal compared to the traditional pneumatic ear specula. In addition, the seal of the ear canal can be readily checked from the pressure measurement, which instills confidence in the measurement. The overall cost of this system is another factor, since pneumatic LCI requires more expensive optical components, such as a low-coherence light source and detector. We have reduced the cost of this system by removing the lateral scanning mechanism of OCT to create an LCI system that is based on point (M-mode) measurements. Moreover, a recent study from our group has focused on developing low-cost light ranging systems, increasing the potential of LCI as a readily available technique for the primary care office [29].
It is important to note the reproducibility of the compliance and amplitude ratio measurements of the TM. As a point-based measurement, significant efforts were made to collect the data near the light reflex region, the most easily recognizable feature on the TM. When multiple pneumatic LCI measurements (n = 5) near the light reflex region were performed on a healthy adult volunteer, the standard deviations of the compliance and amplitude ratio were 0.7 µm/mmHg and 0.5, respectively. Although the spatially-varying structure of the TM may still generate variability and uncertainty, we believe that targeting the light reflex region is the most consistent and reliable method to perform point-based measurements on the in vivo human TM.
It is also important to note that motion artifacts were inevitable during this in vivo human study, especially with pediatric subjects. The effect of motion artifacts on LCI measurements was thoroughly discussed in our previous study [21], and the stability assessment showed that motion artifacts were small and insignificant, relative to the larger pressure-induced displacements of the TM. The effect of motion artifacts, however, were more significant for the less mobile TM. In all cases, averaging of 200 A-scans immediately prior to the
Vol. 9, No. 2 | 1 Feb 2018 | BIOMEDICAL OPTICS EXPRESS 408
pneumatic stimulus was performed to determine the zero displacement position, which helped to minimize the effect of motion artifacts on the displacement measurements. Fringe wash-out effects and SNR degradation from the motion may occur and affect tracking of the TM during the rapid change in pressure. However, the pneumatic LCI metrics rely primarily on the maximum displacement of the TM, rather than the transitional changes and motion. At the maximum pressure, the TM tends to be relatively stationary, and LCI measurements are less affected by the signal loss.
Despite these limitations, a significant benefit of pneumatic LCI otoscopy is that the entire time-dependent traces of the TM motion and the pressure stimulus are quantitatively recorded. Future studies will continue to investigate the temporal dynamics, including the relaxation and rising responses, and aspects of the TM motion in relation to the type (serous and mucoid) and amount of MEE, determined by the cross-sectional OCT images, and the type of OM (acute OM, OM with effusion, and chronic OM with biofilm), which may differ in TM mobility and MEP. Follow-on studies will also compare the pneumatic LCI metrics with middle ear power analysis [30], another middle ear diagnostic tool mainly used by audiologists, to observe the effect of changes in the middle ear structures on the pneumatic-induced mobility of the TM.
5. Conclusion
Although pneumatic otoscopy is highly recommended to assess TM mobility and determine the presence or absence of a MEE when diagnosing OM, its subjective information has challenged the proper application and interpretation of this technique. Pneumatic LCI otoscopy enables not only the surface visualization of the TM, but also the quantitative measurement of pneumatic mobility, MEP, and the depth-resolved structural information in the middle ear cavity. The pneumatic LCI metrics (compliance and the amplitude ratio) were significantly less in the subjects with MEE, and the amplitude ratio can indicate the MEP. These findings suggest that a pneumatic LCI system can determine the presence of MEE and quantify TM dynamics in subjects with MEE as well as in normal subjects, with the combined benefits of pneumatic otoscopy and tympanometry.
Funding
National Institutes of Health (NIH) (R01 EB013723).
Acknowledgements
The authors thank Paula Bradley, Alexandra Almasov, and Deveine Toney from the Carle Research Office at Carle Foundation Hospital, Urbana, Illinois, for their help with IRB protocol management, and subject consenting and assenting. The authors acknowledge Dr. Ada C. K Sum, Dr. Neena Tripathy, and Dr. Stephanie A. Schroeder from the Department of Pediatrics at Carle Foundation Hospital for their help in subject recruitment. The authors also thank the nursing staff in the Department of Pediatrics at Carle Foundation Hospital for their clinical assistance, and Darold Spillman from the Beckman Institute for Advanced Science and Technology for his operations and information technology support.
Disclosures
SAB: PhotoniCare, Inc. (F,I,C,P,S), Massachusetts Institute of Technology (P), MAN: PhotoniCare, Inc. (I), others: none.
Vol. 9, No. 2 | 1 Feb 2018 | BIOMEDICAL OPTICS EXPRESS 409