planning vision and future - planning department · section ii planning vision and future...
TRANSCRIPT
Sectio
n II Planning
Visio
n and Future C
hallenges
Chapter 8: Defining Our Needs
Section II Planning Vision and Future Challenges

Defining Our Needs
Section II Planning Vision and Future Challenges
8Defining Our Needs
“Necessity never made a good bargain.”
–BenjaminFranklin
8.1 Reference Scenario
8.1.1 TheReferenceScenariodescribesthecircumstancesunderwhichweformulateourplanningstrategy.Itattemptstotranslateourlong-termvisionforHongKongintoasetofworkingassumptionsanddefinesomeofoursocial,environmentalandeconomicneedsinmoreconcreteand,wherepossible,quantitativeterms.IthighlightsthosefactorswhichneedtobetakenonboardintheconsiderationofamostappropriatespatialdevelopmentpatternforHongKongandinconductingvariousimpactassessmentsonthispattern.
8.1.2 Inthepreviouschapter,ithasbeennotedthatC&SDmakesofficialpopulationprojectionsfromtimetotime.However,theseprojectionshavelargelybeenmadeonthebasisofpasttrendsandprevailingpolicies,althoughtheyareupdatedregularlytoreflectlatestchanges.Forthepurposeoflong-termplanning,weneedtobemoreanticipatoryofchangesandpro-activeindefiningourfuture.Nevertheless,owingtothecomplexityofissues,resultantscenarioscouldbenumerous.WeneedtodefineaReferenceScenariowhichisnotonlywhatweaspireto,butonethatisplausibleandachievable.Ontheotherhand,inviewofthehighlevelofuncertaintyaboutthefuture,theassumptionsadoptedcouldonlyberegardedasour“bestguess”atthisstage.
8.2 Population and Employment Assumptions
8.2.1 ThepopulationandemploymentassumptionsoftheReferenceScenarioareasfollows:
• Populationwillcontinuetogrowalbeitataslowerrateofabout0.7%perannum,mainlyduetomigrationfromtheMainland.Theageingphenomenonwillbecomemoreprominentdueto
83
Section II Planning Vision and Future Challenges
Defining Our Needs8 Defining Our Needs
persistentlylowbirthratesandlongerlifeexpectancy.TheseassumptionsaresimilartothoseoftheofficialprojectionspreparedbyC&SD.
• Inlinewithourvisionforgrowthtowardsaknowledge-basedeconomy,wehaveassumedahigherintakeoftalent/skilledworkersandinvestorsinthelongterm(about10,000perannumfrom2021onwards,ontopofthatassumedundertheofficialprojections1);
• Asteadyrateofeconomicgrowth(annualGDPgrowthat4.0%initiallyandgraduallyfallingto3.0%)isassumed,withfastergrowthinkeyindustries;
• Employment(jobsrequired)willincreaseatabout0.6%to1.2%perannumtosupporttheeconomicgrowth;
• Higherworkerparticipationratesinolder/femaleagegroupswouldbelikely,reflectingamoreflexibleworklife,deferredretirement,aswellastheincreaseinwomenworkerswhowillbemorereadytojoinorremainintheworkforce.
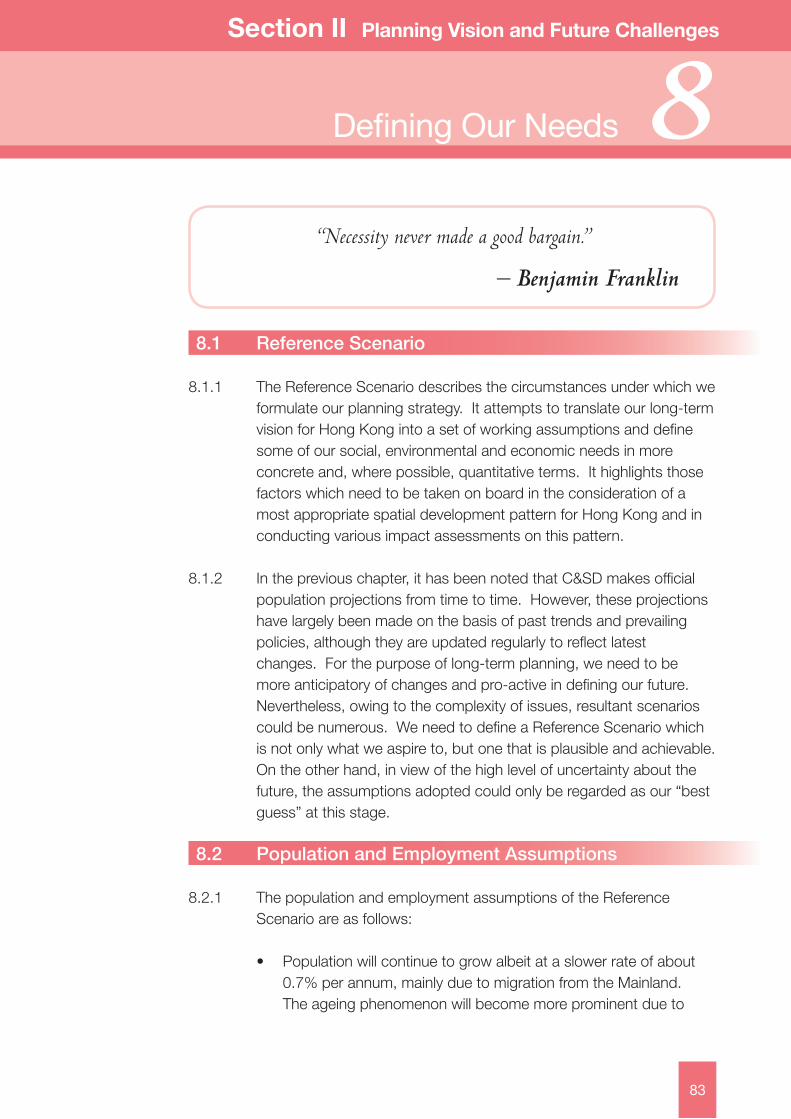
8.2.2 Undertheseassumptions,theresultantpopulationandemploymentareshowninthetablebelow:
1 Itisassumedthateachyear,around20,000to25,000professionalswillcometoHongKongundertheGeneralEmploymentPolicyandtheAdmissionSchemeforMainlandTalentandProfessionals.
2 Asthedatawaslargelycompiledin2005wheninformationon2004wasnotfullyavailable,theBaseYearhasbeentakentobe2003forthesakeofconsistency.ThisappliestoallreferencestotheBaseYearinthisreport.
84
# ReferringtoworkerswhoarealsoHongKongResidents.Itisassumedthatsomeofthesurplusjobsby2030willbefilledbycross-boundarycommutingworkers.
Base 2010 2020 2030 Year2
ResidentPopulation 6.8 7.2 7.8 8.4 WorkingPopulation# 3.2 3.6 3.8 3.9 Employment 3.0 3.5 3.7 4.0(million)
Defining Our Needs
Section II Planning Vision and Future Challenges
8Defining Our Needs
8.3 Housing Land Requirement
8.3.1 Tomeettheneedsofagrowingpopulation,oneoftheobjectivesoftheHK2030Studyistoensuretimelyprovisionofadequatelandandinfrastructureforthedevelopmentofhousingandcommunityfacilities.Anassessmentofthefuturehousingdemandisthereforeneededtoserveasabasisfortheformulationofourplanningstrategy.
8.3.2 Itisgenerallyacceptedthathousingdemandisgovernedbysuchfactorsaseconomicperformance,affordabilityandinvestmentincentives.However,forthepurposeofassessinglong-termhousingdemand,wecanassumethateveryhouseholdwouldbeadequatelyhoused,andthereforethetotalhousingrequirementwouldbebroadlyinlinewithhouseholdformation.
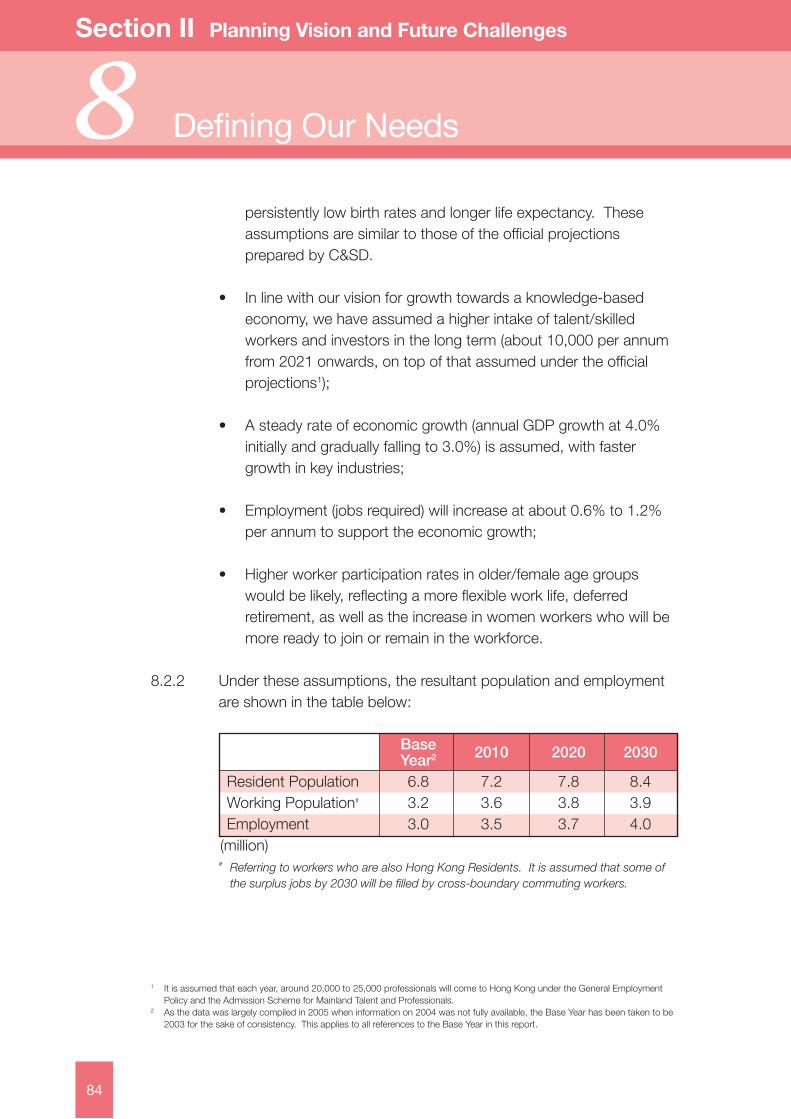
8.3.3 IntheperiodbetweentheBaseYearand2030,atotalhousingrequirementofabout924,000units(averagingabout34,000peryear)isassumed.
8.4 Economic Land Requirement
8.4.1 Toensureeconomicgrowthinthelongrun,aflexiblelandprovisionmechanismwouldbethekey.Thereforeanewandsimplifiedlandusetypologyhasbeendevelopedtoallowflexibilityintheassessmentoffuturelandrequirements,correspondingwiththecharacteristicsofmoderneconomicactivities.
8.4.2 Thisnewlandusetypologyre-categorisesmarket-driven“employmentuse”landintothreebroadcategories:(i)CBDGradeAOffices,(ii)GeneralBusinessand(iii)SpecialIndustries.
85
Base 2010 2020 2030 Year HousingStock 2,394 2,642 2,948 3,319 Accumulative
- 248 553 924 Requirement(thousandunits)

Section II Planning Vision and Future Challenges
Defining Our Needs8 Defining Our Needs
8.4.3 Aneconometricmodelwasestablishedtoassessfuturefloorspacedemandforthesemarket-drivenemploymentuses.Ittakesintoaccountthefloorspacedemandofindividualeconomicusesaswellasanumberof“independentvariables”includingHongKongandGuangdong’sGDPgrowth,aswellasHongKong’spopulationandemploymentparameters.
8.4.4 ThemodelhasassumedthatHongKongwillcontinuewithitsrestructuringoftheindustrialandservicesectorswhileembarkingonamuchclosereconomicrelationshipwiththeMainland.Ahigherlevelofproductivityandenhancementinworkerskillshavealsobeenassumed.
8.4.5 Itisprojectedthatthetotalemployment-relatedfloorspacedemandupto2030willbearound10.5millionm2inGFA.Takingintoaccounttheexistingsurplusstockandtheneedtoaccommodatea“naturalvacancy”3,thetotalrequirementwillamounttoabout11.0millionm2inGFA.
CBDGradeAOffices
8.4.6 “CBDGradeAOffice”hasbeenidentifiedforseparatereservationbecauseoftheparticularrequirementsoflocationandqualityofpremises,aswellasthevalueandstatusassociatedwithhigh-value-addedbusinessactivities.Itis
difficulttodelineatetheCBD,butforthepurposeofcalculationandpresentationofdatainthisstudy,thekeyofficedistrictsofCentral,WanChai,CausewayBay,SheungWanandTsimShaTsuiaretakenastheCBD.
3 “NaturalVacancy”referstoalevelofvacancythatisnormallypresentinthepropertymarket.Whilethelevelwouldconstantlyvary,a10%ratehasbeenassumedhere,basedontheaveragevacancylevelforGradeAofficeslocatedatCoreDistrictsintheperiodbetween1999and2003,asrecordedbytheRatingsandValuationDepartment.
86
Defining Our Needs
Section II Planning Vision and Future Challenges
8Defining Our Needs
8.4.7 Duringthepastdecade,GradeAofficesintheCBDtookupabout8.6%to10.3%oftotalfloorspacedemand.Consideringtheeffectsofeconomicrestructuring,CBDGradeAofficesareestimatedtotakeupapproximately13%ofallemploymentfloorspaceby2030.
GeneralBusinessUses
8.4.8 “GeneralBusiness”landusecoversprivateoffices(excludingCBDGradeAoffices),industrial/officeuses,flattedfactoriesandprivatestorages.Accordingtoanearlierusersurvey4,some80%ofthefloorspaceoftheprivateofficesandtheindustrial/officeusesareoccupiedbythreetypesofcommercialactivities,withimport/exportandwholesaletradebeingthehighestfloorspaceoccupierofbothprivateofficesandmulti-storeyfactorybuildings.
8.4.9 Whileconventionalmanufacturingusesareexpectedtocontinuetodecline,theimplementationofCEPAmayresultinaslightlyslowerrateofdecline.Ontheotherhand,continuedgrowthinthetradeandlogisticssector,aswellasservicesandbusinesseswhicharelesslocation-bound,willhelpmaintainasubstantialdemandforgeneralbusinessaccommodation.Itisestimatedthatgeneralbusinessuseswilltakeupapproximately74%ofallemploymentfloorspaceby2030.
SpecialIndustries
8.4.10 “SpecialIndustries”refertolanduseswithparticularaccommodationrequirements.Thiskindoflandusewillnotnecessarilybepollutingbutmayrequiresitessuitableforcapitaland/ortechnologyintensiveindustrialoperationswhichmayhavespecialinfrastructuraland/orlocationalrequirements,and/orwherespecialtreatment,security,orothermeasureshavetobetaken.Forthisreason,itwouldbeappropriatetodelineatedistinctzonesforsuchusestoseparatethemfromotheruses.Thelayoutofsuchspecialindustrialzoneswouldalsoneedtobeflexibleenoughtoaccommodatebuildingdesignstailor-madefordifferentusers.
4 PlanningDepartment(2005)“CommercialandIndustrialFloorspaceUtilisationSurvey”
87

Section II Planning Vision and Future Challenges
Defining Our Needs8 Defining Our Needs
8.4.11 WebelievethatHongKongwillmaintainasanadministrativebaseformuchofthemanufacturingactivitiesinthePearlRiverDeltaandwouldbenefitthroughundertakingotherhigh-value-addedtasksinthesupplychain,suchasresearchanddevelopment(R&D),logisticsmanagementandevensomeoftheproductionprocesses.Moreover,demandforsuchspacemayalsogrowoutofdevelopingexpertiseinnewindustries,suchasinformationtechnology,biotechnologicalaswellasgreenindustries.
8.4.12 AlthoughspecialindustriesmaystillcontributeonlyaminorportionofHongKong’seconomy,intermsoffloorspacedemand,theycouldconsumeasignificantshare.Itisestimatedthatspecialindustrieswilltakeupapproximately13%ofallemploymentfloorspaceby2030.
8.4.13 Thefollowingtableprovidesasummaryoftheassumedfloorspace
demandandrequirementsforthethreelandusecategories:
8.5 Policy-Influenced Land Uses and Infrastructure
Port
8.5.1 AccordingtotheStudyonHongKongPort–MasterPlan2020(HKP2020Study),growthprospectsofourcargosourcearefavourable,butweneedtoensurestrategicmeasuresaretakento
5 Thefloorspacerequirementtakesintoaccounttheexistingsurplusstockandtheneedtoaccommodatea“naturalvacancy”factor.
88
Base 2010 2020 2030 Demand Requirement5 Year 2003-2030 2003-2030 CBD 4.1 5.1 5.8 6.7 2.6 2.7 GradeA (10%) (11%) (12%) (13%) Offices General 33.0 35.5 36.2 38.2 5.2 5.4 Business (80%) (77%) (76%) (74%) Special 4.0 5.5 6.0 6.7 2.7 2.9 Industries (10%) (12%) (13%) (13%) Total 41.1 46.2 47.9 51.6 10.5 11.0 (100%) (100%) (100%) (100%) (GFAinmillionm2)

Defining Our Needs
Section II Planning Vision and Future Challenges
8Defining Our Needs
capture market share of the direct cargo segments. With successful implementation of the recommended port strategy, our total ocean container throughput could increase from 13.9 million TEUs in 2002 to 31.8 million TEUs in 2020 (preferred forecast scenario under the HKP2020 Study).
8.5.2 The maximum capacity of the existing container port (container terminals 1 to 9) is around 18.6 million TEUs, with a potential to increase by another 1.7 million TEUs, and possibly more if additional land and other productivity measures are introduced. If the projected demand is realised, there is likely to be a need for a new container terminal (CT 10) in the first half of the next decade. Our assumptions for future cargo throughput and terminal capacities are shown in the following table.
8.5.3 Another important aspect of the recommended port strategy which may have implications for the HK2030 Study is the demand for port back-up (PBU) land. The HKP2020 Study predicts that the total demand for PBU land will increase with port throughput, but the trend for these uses to move over the boundary nearer the cargo centres in the PRD is expected to continue. Moreover, changes to cross-boundary trucking and/or the location of empty depots could have a marked impact upon the amount of PBU land needed in Hong Kong.
8.5.4 PBU operations traditionally occupy sites that are easily accessible and low cost. They are currently concentrated in former agricultural areas in the New Territories with the use primarily organised on
89
Source: HKP2020 Study
BaseYear 2010 2020 2030 Cargo 12.8 18.0 28.8 34.5 Throughput Terminal Capacity CT 1-8, 13.1 - - - CT 9 (part) CT 1-9 - 19.8 21.7 23.0 CT 10 - - 7.2 11.6 Total 13.1 19.8 28.8 34.6(million TEUs)

Section II Planning Vision and Future Challenges
Defining Our Needs8 Defining Our Needs
thebasisofprivatecontractualarrangementsbetweenindividuallandownersandoperators.ThesupplyofPBUland(estimatedtobeabout378hain2003)includesthosesiteswhicharezonedforsuchpurpose,thoseoperatingwithtemporaryplanningapprovaland/orundershort-termtenanciesandthosewhichexistedbeforeplanningcontrolscameintoforce.
8.5.5 AdditionalsupplyofPBUlandincludesfacilitieswithintherivertradeterminalinTuenMun,sitesprovidednearCT9andsiteszonedforPBUusebutnotyettakenup.Moreover,theHKP2020StudyalsorecommendsthatthedevelopmentofCT10,ifitistoproceed,shouldincludeatitsvicinityPBUlandataratioof10haperberth.Concurrently,someoftheexistingshort-termusersareexpectedtofadeoutgradually,especiallywiththeintroductionofnewcustomspolicyintheMainland.
Airport
8.5.6 In2006,theHongKongInternationalAirport(HKIA)atChekLapKokserved44.5millionpassengersandhandled3.58milliontonnesofcargo.AApublishedinDecember2006anupdateoftheAirportMasterPlan(knownastheHKIA2025)toguidefuturedevelopmentoftheHKIAupto2025.Ithasprojectedthatby2025,HKIAwillserve80millionpassengers,handle8milliontonnesofcargoand490,000aircraftmovementseachyear.
90
Source:HKP2020StudyandPlanningDepartment’sestimation
Base Year 2010 2020 2030 PBU Land Demand 260 204 309 398 Supply 378 439 480 500(cumulative)(hectares)

Defining Our Needs
Section II Planning Vision and Future Challenges
8Defining Our Needs
8.5.7 Forthepurposeofassessingfutureairportrelatedtraffic,thepreliminaryforecastsonairpassengerandcargowhichexcludetransfer/transitpassengersandtransshipmentcargo(detailedintablebelow)havebeenadopted.
StrategicTransportInfrastructure
Major Transport Infrastructure Assumed
8.5.8 Intheimmediateperiodbefore2010,majorcommittedtransportnetworksincludingtheDeepBayLink,ShenzhenWesternCorridorandLokMaChauSpurLinewillallbeinplace.However,trafficcongestionatsomestrategicroadssuchasGloucesterRoad/HarcourtRoad/ConnaughtRoadCentralatthenorthshoreoftheHongKongIsland,GascoigneRoadFlyover/ChathamRoadalongtheeast-westcorridoracrosscentralKowloonwillremain.Torelievetheproblem,newstrategicinfrastructureliketheCentral-WanchaiBypassandtheCentralKowloonRouteaswellasthewideningoftheGascoigneRoadFlyovershouldbeimplementedasearlyaspossible.
8.5.9 Fortheperiodbetween2011and2020,wehaveassumedcompletionoftheHongKong-Zhuhai-MacaoBridgeanditsconnectorroadtotheNorthLantauHighway,theGuangzhou-Shenzhen-HongKongExpressRailLink,theNorthernLink,theShatintoCentralLinkandtheWestIslandLine.Assessmenthasbeenmadetoidentifycapacityproblemsatmajorcorridorsduringthisperiodaswellastheperiodbetween2021and2030,andnewinfrastructurehasbeenproposedtoaddresstheproblems.
91
Note: TheaboveassumptionsfortheReferenceScenariohavebeendevelopedbythePlanningDepartmentbasedondiscussionswiththeAirportAuthority,andareusedinthepreliminaryassessmentofvehicularflowsonmajorroadsofthisStudyonly.
Base Year 2010 2020 2030DailyAirPassengers 63,900 99,100 124,200 156,500DailyCargo(tonnes) 6,300 11,500 15,800 21,200
Section II Planning Vision and Future Challenges
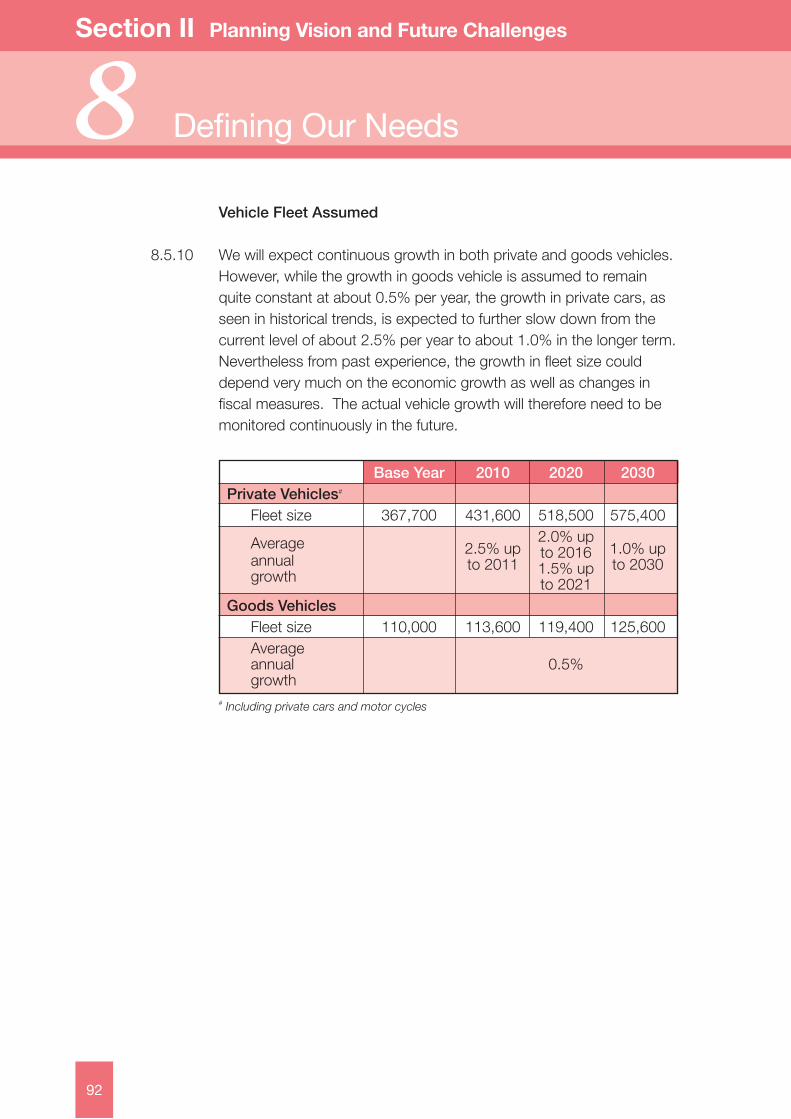
Defining Our Needs8Vehicle Fleet Assumed
8.5.10 Wewillexpectcontinuousgrowthinbothprivateandgoodsvehicles.However,whilethegrowthingoodsvehicleisassumedtoremainquiteconstantatabout0.5%peryear,thegrowthinprivatecars,asseeninhistoricaltrends,isexpectedtofurtherslowdownfromthecurrentlevelofabout2.5%peryeartoabout1.0%inthelongerterm.Neverthelessfrompastexperience,thegrowthinfleetsizecoulddependverymuchontheeconomicgrowthaswellaschangesinfiscalmeasures.Theactualvehiclegrowthwillthereforeneedtobemonitoredcontinuouslyinthefuture.
92
#Includingprivatecarsandmotorcycles
Base Year 2010 2020 2030 Private Vehicles# Fleetsize 367,700 431,600 518,500 575,400 Average
2.5%up 2.0%up
1.0%up annual to2011
to2016to2030
growth 1.5%up to2021 Goods Vehicles Fleetsize 110,000 113,600 119,400 125,600 Average annual 0.5% growth