sustainable investing and bond returns - … investing and bond returns research study into the...
TRANSCRIPT
1
Sustainable investing and bond returnsResearch study into the impact of ESG on credit portfolio performance
01Impact Series

2
Environmental
Social
Governance
3
If ESG attributes are aligned with bond returns as our study suggests, we can expect the move to sustainable investing to endure. As our analysts remind us in this report: “As ESG considerations play out over a long horizon, and as they increasingly become a priority for company managers, they may help alleviate the pressure for short-termism and encourage a focus on long-term value creation – to the mutual benefit of the firm, its investors and the world at large.”
Jes Staley, Chief Executive Officer of Barclays
Foreword
Across the world, individual and institutional investors seek attractive financial returns while helping to achieve a positive impact on the communities around them. With growing concerns over climate change and global warming, geopolitical instability and uncertainty in financial markets, this has become even more pressing.
The growing awareness of and support for responsible investing has led to it becoming inherent to the investment processes of many institutional investors. These responsible investors often hope to improve sustainability by engaging with corporate managers, allocating capital to more virtuous companies and lobbying for broader reporting standards and changes in regulations.
Much research has been done on the relationship between environmental, social and corporate governance (ESG) investing and performance in equity markets, but far less on its effect on the credit markets. This study by the Barclays Research team into the behaviour of corporate bond portfolios makes a significant contribution to the available body of evidence on sustainable investing. The research shows that applying ESG factors resulted in a small but steady performance benefit and the team could find no evidence of a negative effect.
Welcome to the first report in our Impact Series, showcasing groundbreaking research into the effect of environmental, social and governance investing on bond portfolio performance.
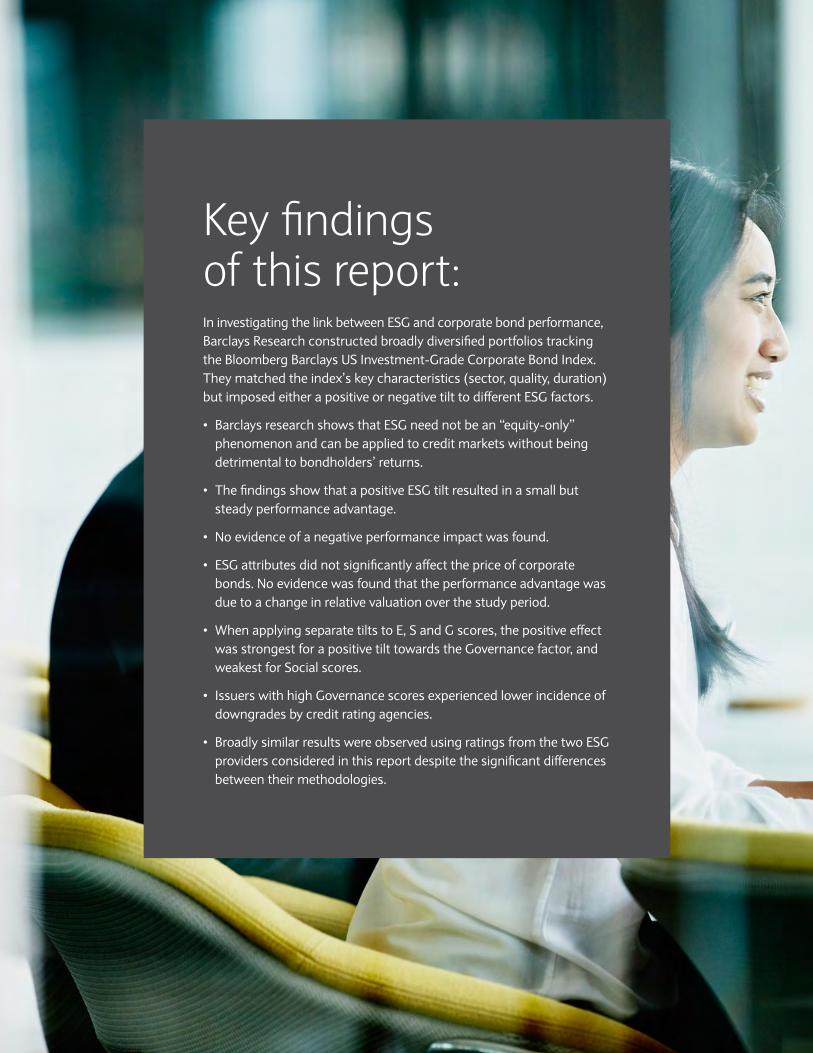
Key findings of this report: In investigating the link between ESG and corporate bond performance, Barclays Research constructed broadly diversified portfolios tracking the Bloomberg Barclays US Investment-Grade Corporate Bond Index. They matched the index’s key characteristics (sector, quality, duration) but imposed either a positive or negative tilt to different ESG factors.
• Barclays research shows that ESG need not be an “equity-only” phenomenon and can be applied to credit markets without being detrimental to bondholders’ returns.
• The findings show that a positive ESG tilt resulted in a small but steady performance advantage.
• No evidence of a negative performance impact was found.
• ESG attributes did not significantly affect the price of corporate bonds. No evidence was found that the performance advantage was due to a change in relative valuation over the study period.
• When applying separate tilts to E, S and G scores, the positive effect was strongest for a positive tilt towards the Governance factor, and weakest for Social scores.
• Issuers with high Governance scores experienced lower incidence of downgrades by credit rating agencies.
• Broadly similar results were observed using ratings from the two ESG providers considered in this report despite the significant differences between their methodologies.
5
Sustainable investing, in which Environmental, Social, and Governance (ESG) issues are incorporated into the investment process, is increasingly gaining a foothold in mainstream financial markets.
For some of the most committed investors, the knowledge that their funds are being invested to support their values is so important that they would accept a lower return on their investments. A much larger group would be happy to support these values, but only once they are convinced that there is limited negative return impact. Finally, if consideration of ESG principles can actually help to improve portfolio performance – as many adherents claim – then it would be hard to justify any resistance to their adoption. The relationship between ESG characteristics and performance is therefore of primary importance.
Focus on credit market In the absence of much research into the impact of ESG on the credit markets, Barclays Research has conducted a new study to determine the nature of the relationship between bond performance and ESG. We focused on the credit markets for several reasons.
First, an increasingly large number of bond investors is interested in ESG investing.
Second, the relationship between sustainability and portfolio performance has been extensively researched in the equity market and much less so in credit.
Third, credit investing is dominated by institutional investors, including pension funds, which are leading the trend for sustainable returns; bonds represent a substantial percentage of their assets.
Finally, corporate bonds are complex: they combine exposure to interest rates and credit spread, so allocations along both dimensions influence risk and performance. Unintended biases can therefore easily appear when overweighting one bond relative to another. To aid bond
The road to sustainable returns
managers in evaluating the potential performance effect of integrating ESG data into their portfolio construction, we knew it was important to construct a study that carefully avoids any systematic risk exposures.
What this report coversWe begin with a short overview of what drives ESG investing and the rapid rise in its popularity over the last decade. Next, we offer a glossary of terms to help address the proliferation of buzzwords and acronyms that have been used in this field. We then investigate the impact that increasing ESG awareness has had on different groups of financial market participants, including asset owners, asset managers, corporate managers and regulators. Finally, we present a list of ten areas in which the industry has undergone significant changes in recent years, and discuss the implications of these trends for the future.
The second section addresses ESG ratings. Many market participants rely on independent providers of ESG scores and ratings in their investment decisions. In fact, we rely on them ourselves when we seek to quantify the performance impact of ESG-motivated investment decisions. We therefore try to understand them better: what exactly do the scores measure and how are they constructed? We describe the approaches followed by two major ESG providers – MSCI and Sustainalytics – and investigate the relationships between different metrics. How do these scores relate to more traditional credit ratings, or to corporate bond spreads? How stable are the scores over time? We investigate these questions in the context of the US investment-grade credit market.
Finally, we perform a detailed analysis of the relationship between ESG scores and corporate bond performance. We construct high-ESG and low-ESG bond portfolios carefully designed to track the index by controlling for the non-ESG factors known to affect bond returns. We find that the high-ESG portfolios have tended to outperform historically, and we try to understand why.
6
ESG is becoming mainstream
Responsible investing goes by many different names and definitions, but can broadly be described as expanding the objectives of an investment process beyond pure financial considerations to reflect investors’ values and beliefs that their holdings affect the community and broader eco-system.
In order to measure the sustainability of investments, a widely accepted set of metrics has evolved, known as environmental, social and governance (ESG) scores. In addition to the traditional objective of delivering financial returns, ESG investing enables investors to structure portfolios that are aligned with their values.
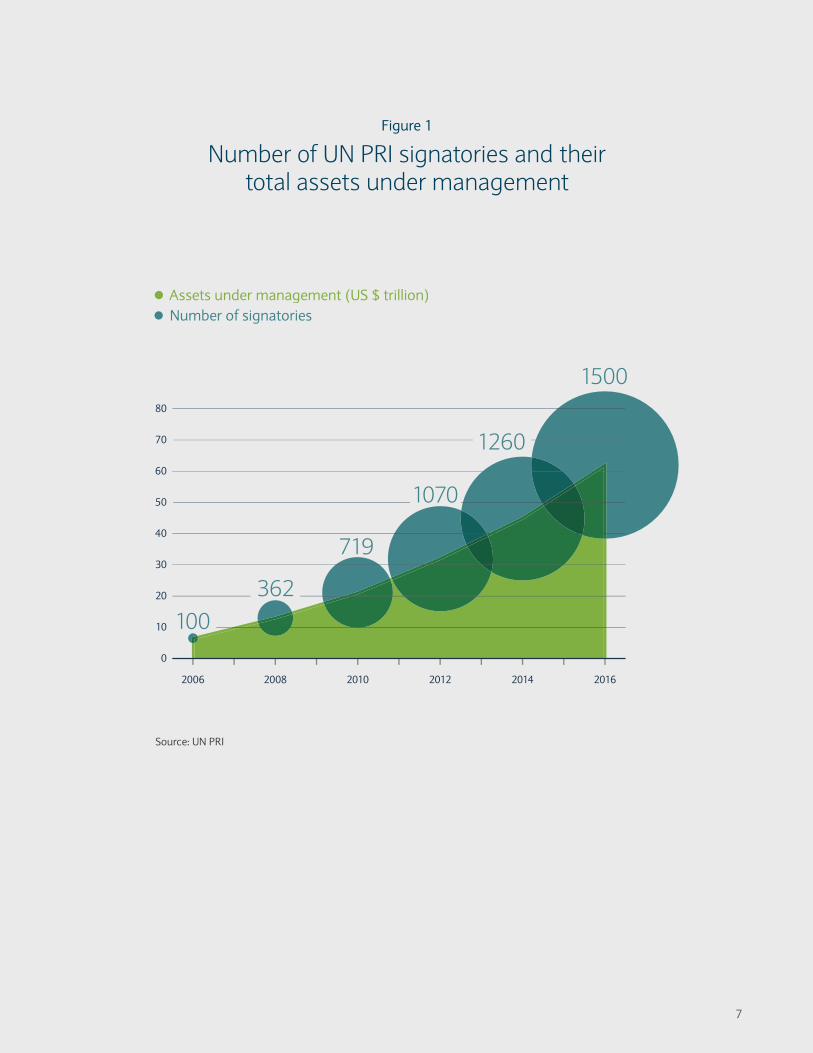
While not new, responsible investing has gathered momentum and taken on broader significance in the past ten years. The United Nations, for example, supported the launch of six Principles for Responsible Investing in 2006 to incorporate sustainability into investment practice1. Collectively known as UN PRI, it has since then attracted nearly 1,500 signatories, collectively controlling over $60 trillion of assets under management.
The rise in responsible investing has followed the growth and increasing sophistication of large institutional investors such as pension plans, sovereign wealth funds, insurance companies and mutual fund managers. As these institutional asset owners are ultimately accountable to a large base of individual policyholders, they have in many cases found it necessary to align their investment processes with the priorities and values of their beneficiaries.
These large investors have often been at the forefront of ESG innovations, insisting on high standards of corporate governance as well as on controlling potential negative impacts of corporate activities on society and the environment. In addition, laws and regulations may not
1 The six principles, which may be found at www.unpri.org/about/the-six-principles, commit signatories to incorporate ESG issues into the investment process and actively encourage others to do the same.
ensure that corporate behaviour is always desirable from a broad societal perspective. In this context, ESG can be seen as an alternative to more regulation.
We are at a turning point where ESG investing is maturing and being formalised through ESG integration into decision-making processes, standardisation of ESG data, new benchmark indices, and broader pro-active engagement with issuers.
The widespread adoption of ESG investing has come hand in hand with a subtle but critical change in emphasis. The early charge was led by ethically motivated investors clearly focused on environmental and social issues while most institutional investors looked on from the sidelines, concerned about the potential negative impact on portfolio returns. The key to gaining traction was in reversing the perceived effect on performance. Not only is it no longer assumed that “doing the right thing” will place a drag on portfolio returns; rather, it is now seen as prudent to avoid investing in companies that have a detrimental impact on the world, because their business practices may not be allowed to remain unchanged. ESG ratings providers thus emphasise that their ratings measure the risks of negative events stemming from poor behaviour in the Environmental, Social and Governance spheres; and the jargon used to describe the industry (see glossary on p. 8-10) has evolved towards terms that have positive connotations regarding performance.
“ Not only is it no longer assumed that ‘doing the right thing’ will place a drag on portfolio returns; rather, it is now seen as prudent to avoid investing in companies that have a detrimental impact on the world.”
7
0
10
20
30
40
50
60
70
80
Assets under management (US $ trillion)Number of signatories
1500
1260
1070
719
362100
2006 2008 2010 2012 2014 2016
Figure 1
Number of UN PRI signatories and their total assets under management
Source: UN PRI

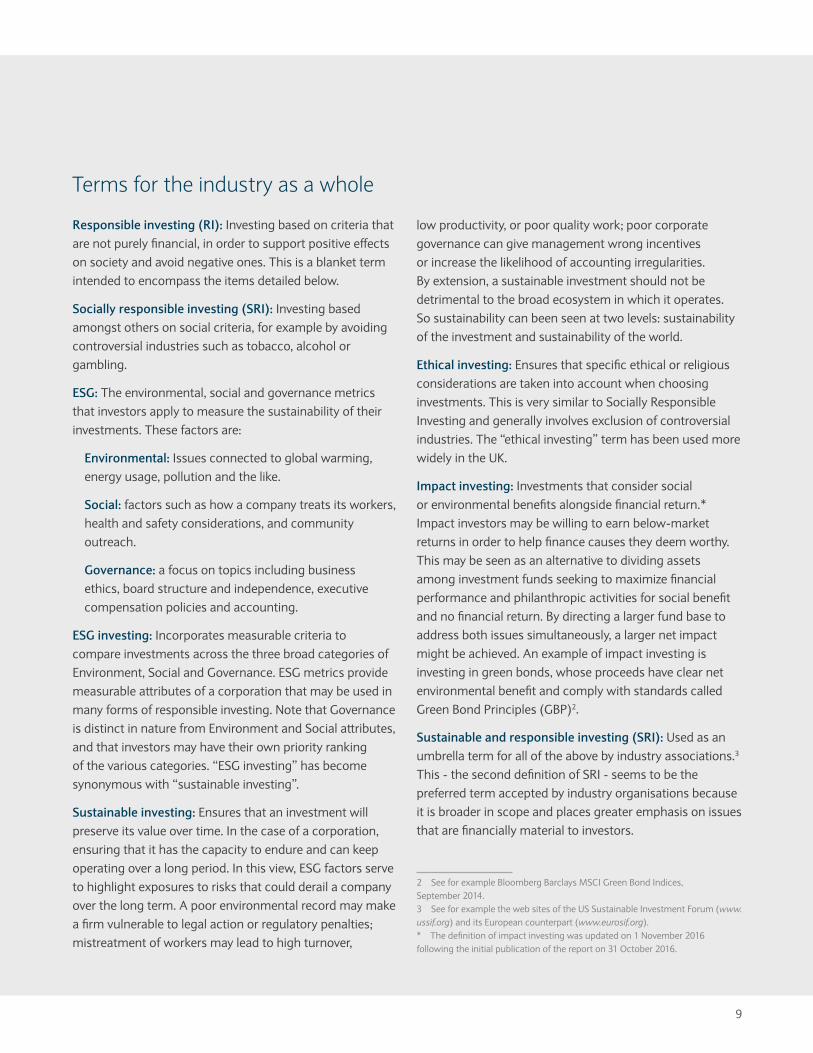
A brief glossary of ESG termsThe idea that investors should look beyond traditional financial measures and incorporate ESG-related factors into the investment process has broad appeal. It has been espoused by many different groups, each driven by a slightly different set of motives. This has given rise to a profusion of terms to describe this type of investment, each emphasising a particular angle, but with significant overlap among them. In the brief (and certainly incomplete) glossary below, we attempt to summarise the industry jargon.
9
Responsible investing (RI): Investing based on criteria that are not purely financial, in order to support positive effects on society and avoid negative ones. This is a blanket term intended to encompass the items detailed below.
Socially responsible investing (SRI): Investing based amongst others on social criteria, for example by avoiding controversial industries such as tobacco, alcohol or gambling.
ESG: The environmental, social and governance metrics that investors apply to measure the sustainability of their investments. These factors are:
Environmental: Issues connected to global warming, energy usage, pollution and the like.
Social: factors such as how a company treats its workers, health and safety considerations, and community outreach.
Governance: a focus on topics including business ethics, board structure and independence, executive compensation policies and accounting.
ESG investing: Incorporates measurable criteria to compare investments across the three broad categories of Environment, Social and Governance. ESG metrics provide measurable attributes of a corporation that may be used in many forms of responsible investing. Note that Governance is distinct in nature from Environment and Social attributes, and that investors may have their own priority ranking of the various categories. “ESG investing” has become synonymous with “sustainable investing”.
Sustainable investing: Ensures that an investment will preserve its value over time. In the case of a corporation, ensuring that it has the capacity to endure and can keep operating over a long period. In this view, ESG factors serve to highlight exposures to risks that could derail a company over the long term. A poor environmental record may make a firm vulnerable to legal action or regulatory penalties; mistreatment of workers may lead to high turnover,
low productivity, or poor quality work; poor corporate governance can give management wrong incentives or increase the likelihood of accounting irregularities. By extension, a sustainable investment should not be detrimental to the broad ecosystem in which it operates. So sustainability can been seen at two levels: sustainability of the investment and sustainability of the world.
Ethical investing: Ensures that specific ethical or religious considerations are taken into account when choosing investments. This is very similar to Socially Responsible Investing and generally involves exclusion of controversial industries. The “ethical investing” term has been used more widely in the UK.
Impact investing: Investments that consider social or environmental benefits alongside financial return.* Impact investors may be willing to earn below-market returns in order to help finance causes they deem worthy. This may be seen as an alternative to dividing assets among investment funds seeking to maximize financial performance and philanthropic activities for social benefit and no financial return. By directing a larger fund base to address both issues simultaneously, a larger net impact might be achieved. An example of impact investing is investing in green bonds, whose proceeds have clear net environmental benefit and comply with standards called Green Bond Principles (GBP)2.
Sustainable and responsible investing (SRI): Used as an umbrella term for all of the above by industry associations.3 This - the second definition of SRI - seems to be the preferred term accepted by industry organisations because it is broader in scope and places greater emphasis on issues that are financially material to investors.
2 See for example Bloomberg Barclays MSCI Green Bond Indices, September 2014.3 See for example the web sites of the US Sustainable Investment Forum (www.ussif.org) and its European counterpart (www.eurosif.org). * The definition of impact investing was updated on 1 November 2016 following the initial publication of the report on 31 October 2016.
Terms for the industry as a whole
10
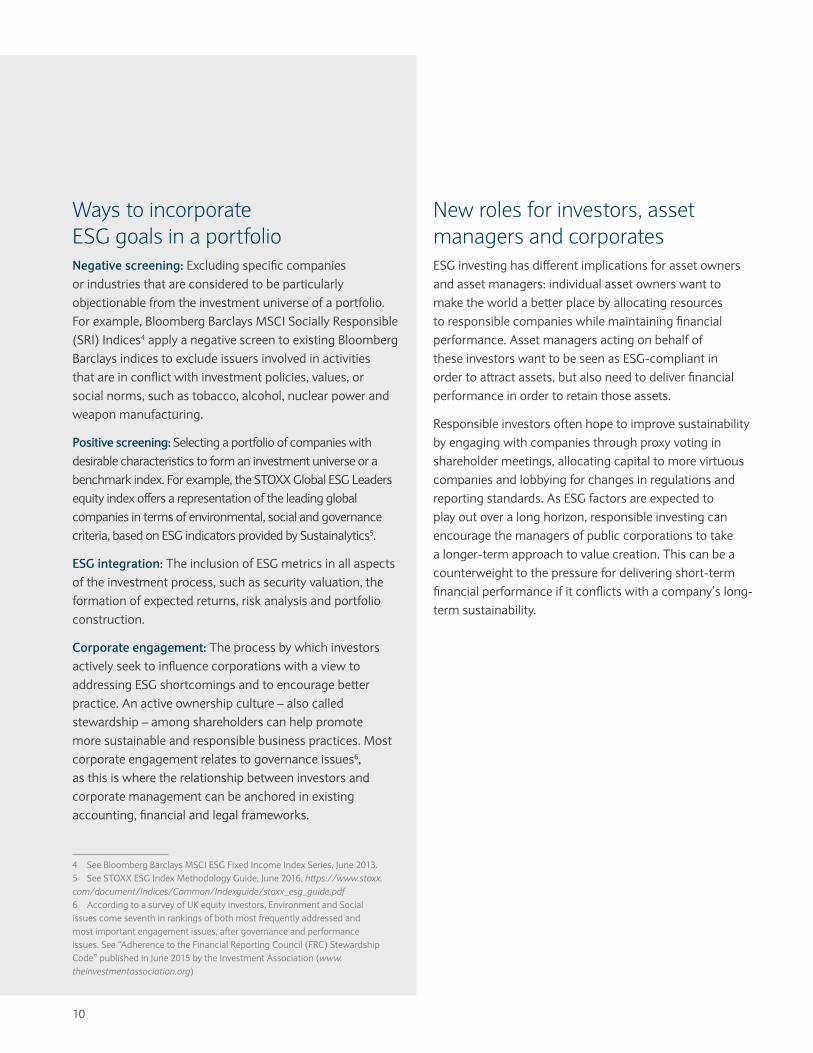
New roles for investors, asset managers and corporatesESG investing has different implications for asset owners and asset managers: individual asset owners want to make the world a better place by allocating resources to responsible companies while maintaining financial performance. Asset managers acting on behalf of these investors want to be seen as ESG-compliant in order to attract assets, but also need to deliver financial performance in order to retain those assets.
Responsible investors often hope to improve sustainability by engaging with companies through proxy voting in shareholder meetings, allocating capital to more virtuous companies and lobbying for changes in regulations and reporting standards. As ESG factors are expected to play out over a long horizon, responsible investing can encourage the managers of public corporations to take a longer-term approach to value creation. This can be a counterweight to the pressure for delivering short-term financial performance if it conflicts with a company’s long-term sustainability.
Ways to incorporate ESG goals in a portfolioNegative screening: Excluding specific companies or industries that are considered to be particularly objectionable from the investment universe of a portfolio. For example, Bloomberg Barclays MSCI Socially Responsible (SRI) Indices4 apply a negative screen to existing Bloomberg Barclays indices to exclude issuers involved in activities that are in conflict with investment policies, values, or social norms, such as tobacco, alcohol, nuclear power and weapon manufacturing.
Positive screening: Selecting a portfolio of companies with desirable characteristics to form an investment universe or a benchmark index. For example, the STOXX Global ESG Leaders equity index offers a representation of the leading global companies in terms of environmental, social and governance criteria, based on ESG indicators provided by Sustainalytics5.
ESG integration: The inclusion of ESG metrics in all aspects of the investment process, such as security valuation, the formation of expected returns, risk analysis and portfolio construction.
Corporate engagement: The process by which investors actively seek to influence corporations with a view to addressing ESG shortcomings and to encourage better practice. An active ownership culture – also called stewardship – among shareholders can help promote more sustainable and responsible business practices. Most corporate engagement relates to governance issues6, as this is where the relationship between investors and corporate management can be anchored in existing accounting, financial and legal frameworks.
4 See Bloomberg Barclays MSCI ESG Fixed Income Index Series, June 2013.5 See STOXX ESG Index Methodology Guide, June 2016, https://www.stoxx.com/document/Indices/Common/Indexguide/stoxx_esg_guide.pdf6 According to a survey of UK equity investors, Environment and Social issues come seventh in rankings of both most frequently addressed and most important engagement issues, after governance and performance issues. See “Adherence to the Financial Reporting Council (FRC) Stewardship Code” published in June 2015 by the Investment Association (www.theinvestmentassociation.org)

11
Figure 2
ESG expands the relationship among asset owners, asset managers and corporations
TRADITIONAL
ESG
Maximizefinancial
performance
Invest basedon financial
attributes
Maximizeshareholder
value
Align to values
Aim for sustainabilityof the world
Consider ESGattributes
Aim for sustainability of the investment
Adjust business model and enhance governance
Enhance Corporate &Social Responsiblity
(CSR)
ASSET OWNER ASSET MANAGER CORPORATION
Source: Barclays Research
12
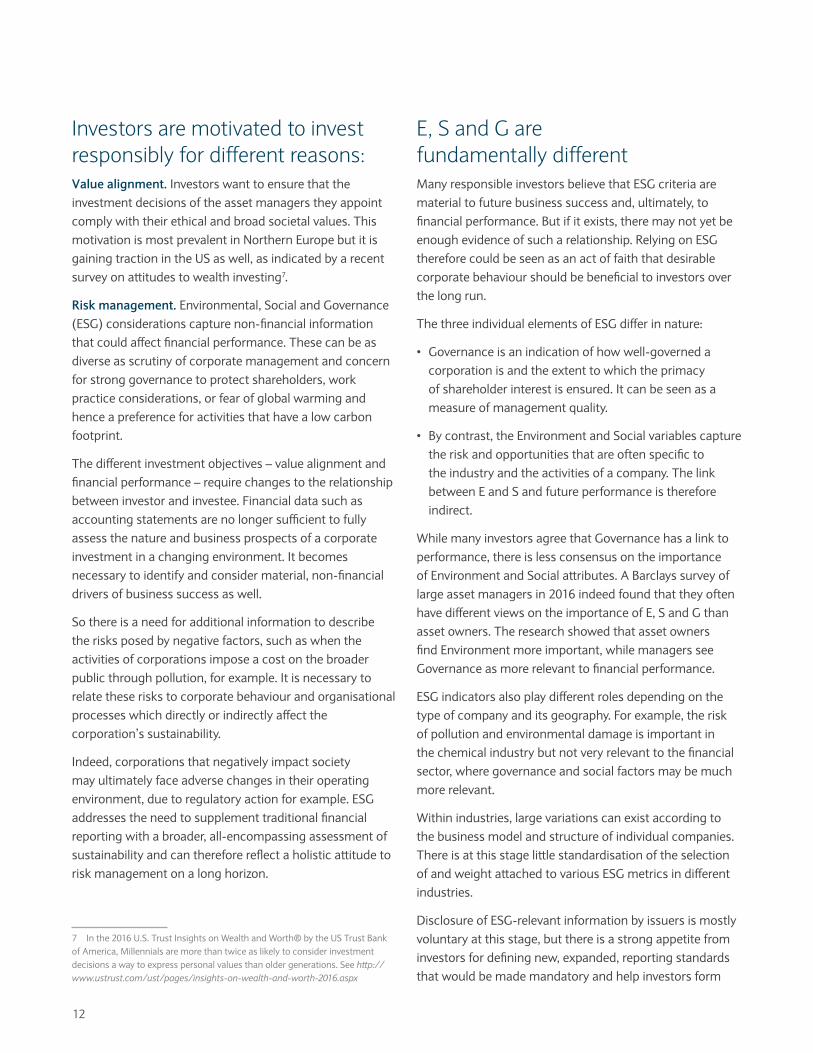
Investors are motivated to invest responsibly for different reasons:Value alignment. Investors want to ensure that the investment decisions of the asset managers they appoint comply with their ethical and broad societal values. This motivation is most prevalent in Northern Europe but it is gaining traction in the US as well, as indicated by a recent survey on attitudes to wealth investing7.
Risk management. Environmental, Social and Governance (ESG) considerations capture non-financial information that could affect financial performance. These can be as diverse as scrutiny of corporate management and concern for strong governance to protect shareholders, work practice considerations, or fear of global warming and hence a preference for activities that have a low carbon footprint.
The different investment objectives – value alignment and financial performance – require changes to the relationship between investor and investee. Financial data such as accounting statements are no longer sufficient to fully assess the nature and business prospects of a corporate investment in a changing environment. It becomes necessary to identify and consider material, non-financial drivers of business success as well.
So there is a need for additional information to describe the risks posed by negative factors, such as when the activities of corporations impose a cost on the broader public through pollution, for example. It is necessary to relate these risks to corporate behaviour and organisational processes which directly or indirectly affect the corporation’s sustainability.
Indeed, corporations that negatively impact society may ultimately face adverse changes in their operating environment, due to regulatory action for example. ESG addresses the need to supplement traditional financial reporting with a broader, all-encompassing assessment of sustainability and can therefore reflect a holistic attitude to risk management on a long horizon.
7 In the 2016 U.S. Trust Insights on Wealth and Worth® by the US Trust Bank of America, Millennials are more than twice as likely to consider investment decisions a way to express personal values than older generations. See http://www.ustrust.com/ust/pages/insights-on-wealth-and-worth-2016.aspx
E, S and G are fundamentally differentMany responsible investors believe that ESG criteria are material to future business success and, ultimately, to financial performance. But if it exists, there may not yet be enough evidence of such a relationship. Relying on ESG therefore could be seen as an act of faith that desirable corporate behaviour should be beneficial to investors over the long run.
The three individual elements of ESG differ in nature:
• Governance is an indication of how well-governed a corporation is and the extent to which the primacy of shareholder interest is ensured. It can be seen as a measure of management quality.
• By contrast, the Environment and Social variables capture the risk and opportunities that are often specific to the industry and the activities of a company. The link between E and S and future performance is therefore indirect.
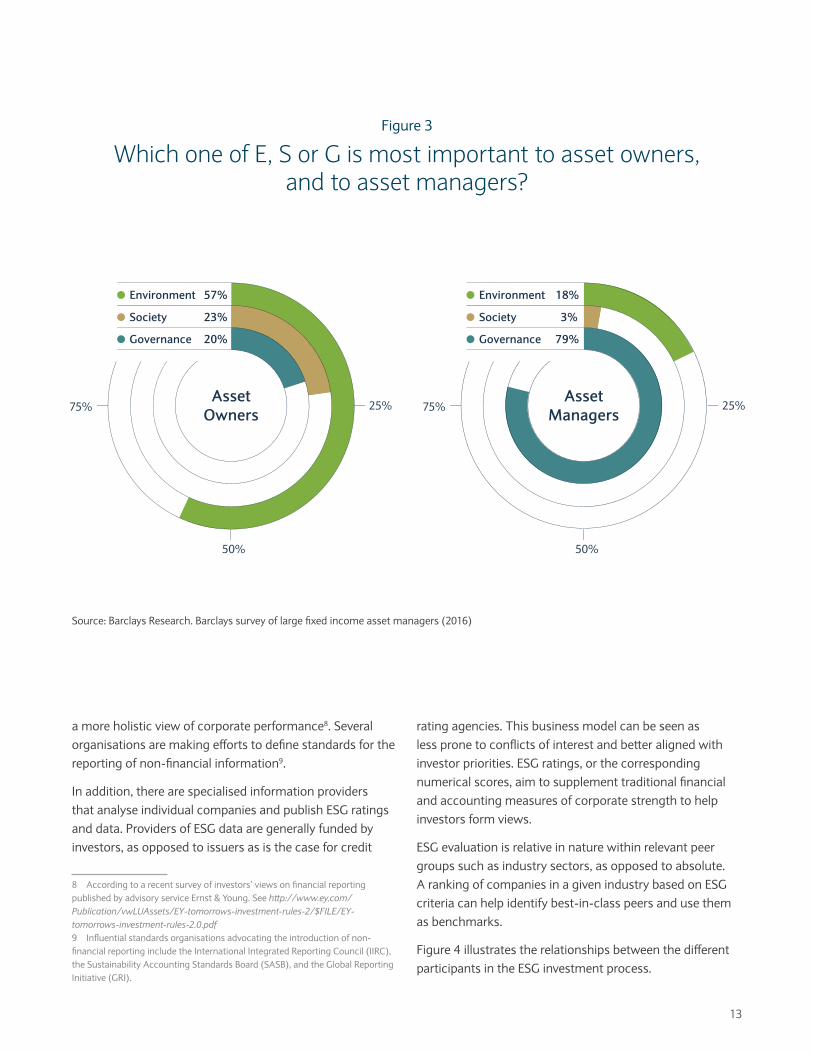
While many investors agree that Governance has a link to performance, there is less consensus on the importance of Environment and Social attributes. A Barclays survey of large asset managers in 2016 indeed found that they often have different views on the importance of E, S and G than asset owners. The research showed that asset owners find Environment more important, while managers see Governance as more relevant to financial performance.
ESG indicators also play different roles depending on the type of company and its geography. For example, the risk of pollution and environmental damage is important in the chemical industry but not very relevant to the financial sector, where governance and social factors may be much more relevant.
Within industries, large variations can exist according to the business model and structure of individual companies. There is at this stage little standardisation of the selection of and weight attached to various ESG metrics in different industries.
Disclosure of ESG-relevant information by issuers is mostly voluntary at this stage, but there is a strong appetite from investors for defining new, expanded, reporting standards that would be made mandatory and help investors form
13
a more holistic view of corporate performance8. Several organisations are making efforts to define standards for the reporting of non-financial information9.
In addition, there are specialised information providers that analyse individual companies and publish ESG ratings and data. Providers of ESG data are generally funded by investors, as opposed to issuers as is the case for credit
8 According to a recent survey of investors’ views on financial reporting published by advisory service Ernst & Young. See http://www.ey.com/Publication/vwLUAssets/EY-tomorrows-investment-rules-2/$FILE/EY-tomorrows-investment-rules-2.0.pdf9 Influential standards organisations advocating the introduction of non-financial reporting include the International Integrated Reporting Council (IIRC), the Sustainability Accounting Standards Board (SASB), and the Global Reporting Initiative (GRI).
AssetManagers
Environment
Society
Governance
18%
3%
79%
25%75%
50%
AssetOwners
25%75%
50%
Environment
Society
Governance
57%
23%
20%
Figure 3
Which one of E, S or G is most important to asset owners, and to asset managers?
rating agencies. This business model can be seen as less prone to conflicts of interest and better aligned with investor priorities. ESG ratings, or the corresponding numerical scores, aim to supplement traditional financial and accounting measures of corporate strength to help investors form views.
ESG evaluation is relative in nature within relevant peer groups such as industry sectors, as opposed to absolute. A ranking of companies in a given industry based on ESG criteria can help identify best-in-class peers and use them as benchmarks.
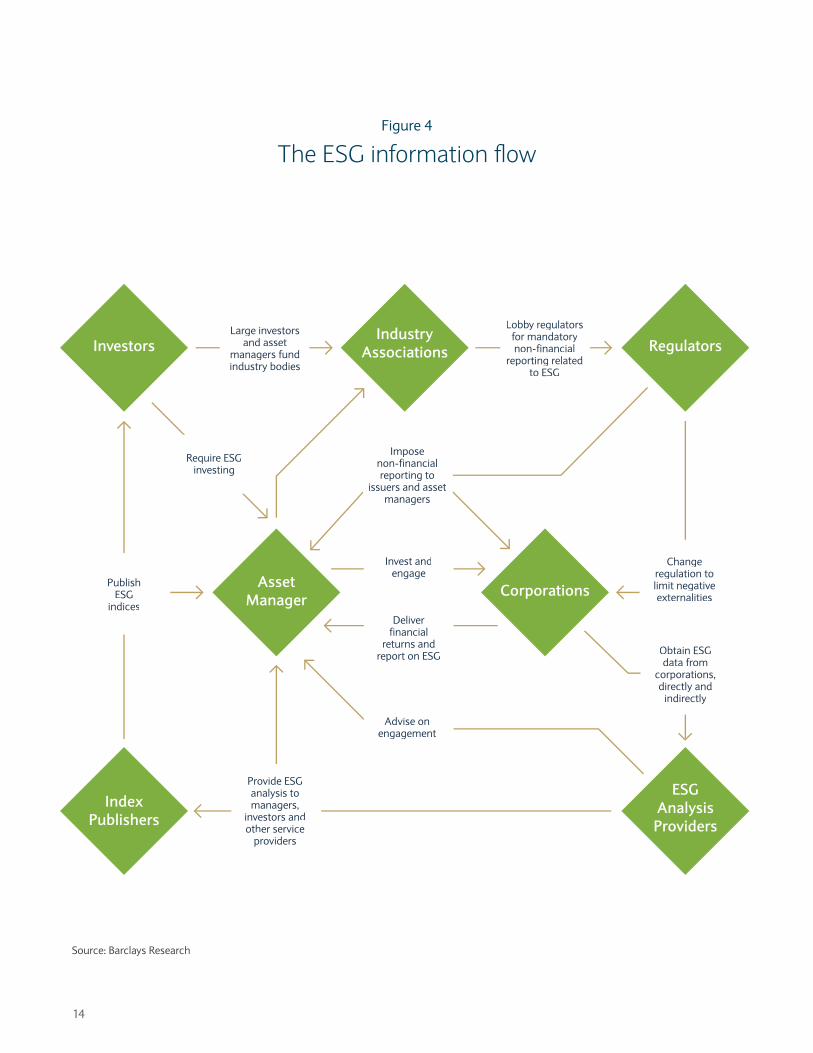
Figure 4 illustrates the relationships between the different participants in the ESG investment process.
Source: Barclays Research. Barclays survey of large fixed income asset managers (2016)
14
InvestorsIndustry
Associations
AssetManager Corporations
Regulators
IndexPublishers
ESGAnalysisProviders
Require ESGinvesting
Large investors and asset
managers fund industry bodies
Lobby regulators for mandatorynon-financial
reporting related to ESG
Impose non-financial reporting to
issuers and asset managers
Invest andengage
PublishESG
indices
Provide ESGanalysis tomanagers,
investors andother service
providers
Deliverfinancial
returns and report on ESG
Advise on engagement
Changeregulation tolimit negativeexternalities
Obtain ESG data from
corporations,directly and
indirectly
Figure 4
The ESG information flow
Source: Barclays Research

15
“We are at a turning point where ESG investing is maturing and formalised through ESG integration into decision-making processes, standardisation of ESG data, new benchmark indices, and broader pro-active engagement with issuers.”
16
01 Socially responsible investing (SRI), often associated with excluding controversial sectors such as tobacco from a portfolio, is increasingly being replaced by “ESG
investing”, which favours issuers with stronger ESG credentials. Two factors favour this trend. First, ESG introduces an element of objectivity in the investment process. ESG analysis typically results in a ranking of issuers within a particular sector based on measurable criteria, without automatically excluding any one of them. For example, an issuer might operate in a controversial sector, such as mining, but demonstrate pro-activeness in managing the risks inherent to that sector (e.g., clean-up actions and social development for the community) beyond the standard industry practice. Second, a blanket exclusion of a sector may change the structure and risk profile of a portfolio. This can translate into large tracking errors relative to traditional market-weighted benchmarks. Without a suitable benchmark index, it is difficult for an asset manager to implement an ESG strategy.
02Until recently, responsible investing was a specialist activity limited to specific mandates. Now, several large asset managers have created specialist ESG
teams. Initially, they operated in isolation from the main portfolio management teams, but integration is now under way. ESG analysis is systematically incorporated in the investment decisions of some large investors, especially when the investment horizon is long and the asset less liquid, as is the case for infrastructure and, increasingly, corporate bonds.
03The UN PRI has acted as a catalyst for making ESG investing an inherent part of the institutional investment process. Its role has changed over time to encourage
best practice. When it was created ten years ago, signatories expressed their intent to invest responsibly and
The evolution of ESG: 10 recent trends
implement its principles. Now, the PRI requires a detailed report of how this has been translated into practice. Investors who do not complete an annual questionnaire can be excluded from the list.
04The asset management industry initially focused on offering specialist mandates where controversial sectors were excluded, often based on ethical
considerations. Since then, broader generic and thematic funds have been launched, for example low carbon. This includes exchange-traded funds (ETF) in equity and in credit markets that follow specially designed benchmark indices. Large investors such as sovereign wealth funds and insurance companies have also started systematically divesting from controversial issuers and sectors. For example, the Norway Petroleum fund announced in June 2015 it would divest from the coal industry out of concern for global warming, and the insurance company AXA announced in May 2016 that it would sell its tobacco investments10.
05Responsible and ESG investing have been mainly motivated by the concerns of asset owners for value alignment. Regulation did not initially play much of
a role and, in some cases, was not seen as supportive. For example, a 2008 guideline from US pension fund regulation ERISA indicated that ESG investing could be seen as a collateral goal that should not distract from maximising financial performance. Only in October 2015 did the US Department of Labor publish a clarification saying that it “does not believe ERISA prohibits a fiduciary from incorporating ESG factors”11.
10 See http://www.axa.co.uk/newsroom/media-releases/2016/AXA-Group-divests-tobacco-industry-assets/11 See https://www.dol.gov/opa/media/press/ebsa/ebsa20152045.htm
17
But regulation around ESG is now taking shape. One striking example is the introduction in August 2015 by the French government of a law on energy transition and green growth which carries mandatory ESG and climate change reporting for listed companies, banks and institutional investors.12
06Index publishers have developed benchmark indices incorporating ESG features. Initially, the focus was on equity markets, but ESG bond indices
have followed. Many indices can be customised, such as for thematic exchange-traded funds, but they may not be fully comparable with more encompassing market indices. For example, a focus on high ESG-rated companies may introduce differences in allocation in favour of a larger size and higher rating quality. Some market participants therefore advocate the use of “smart beta” ESG strategies that combine an ESG theme with the financial objective of retaining exposure to rewarded risk factors while being well diversified13.
07Collecting data and analysing an issuer’s ESG attributes can be hard work. Some asset managers have hired teams of ESG specialists, but many rely on dedicated
ESG research providers. ESG analysis often evaluates individual companies, but such scoring of mutual funds has also been introduced by fund research companies such as Morningstar14 and MSCI15. Their approach currently consists of determining the ESG profile of a fund based on the ESG ratings of its underlying investments. This industry is new, growing fast, and also showing signs of consolidation as large investors require consistency of approach across a broad universe of issuers globally and also across the multiple dimensions of E, S and G.
08The attitudes of bond issuers, too, have changed markedly. While ESG disclosure used to be handled by corporations’ investor relations department upon
request, ESG transparency and pro-activeness is now
12 See https://www.legifrance.gouv.fr/eli/loi/2015/8/17/DEVX1413992L/jo#JORFARTI00003104554713 See for example http://www.scientificbeta.com/#/documentation/latest-publications/scibeta-low-carbon-multibeta-multistrategy-indices14 See http://www.morningstar.com/company/sustainability/15 See https://www.msci.com/esg-fund-metrics
widespread. As reported by a large accounting firm16, most large listed UK companies now publish comprehensive corporate social responsibility (CSR) reports, while at the turn of the century, only a small proportion of them had environmental policy statements. Also, many large corporations want to be seen as increasing their positive contribution to society by being active in CSR – regarded as synonymous to ESG but from the perspective of the issuer.
09ESG-related company data are much more readily available now, and of better quality. Information is still being collected individually by asset managers
and service providers, but there are significant initiatives to standardise non-financial information. Bodies such as Sustainability Investor Forums (SIFs), the International Integrated Reporting Council (IIRC), the Global Reporting Initiative (GRI) and the Sustainable Accounting Standard Board (SASB) are all pushing for mandatory reporting standards of non-financial material information.
10The interaction between companies and investors has become two-way, with large investors and asset owners keen to engage with issuers on all ESG-related topics. This
engagement by investors has existed for a long time, in particular in the USA, but has been highly focused on governance issues and proxy voting. Engagement is also a relatively new phenomenon in Europe. In a recent study17, Sustainalytics estimates that the European engagement and voting market has grown to the point where over €6 trillion of equity market capitalisation is concerned, up from €118 billion in 2002.
These developments, taken together, lead to a single inescapable conclusion: the trend towards sustainable investing is not just a passing fad, but a movement that has brought, and will continue to bring, fundamental and sweeping changes to the investment landscape.
16 See http://www.ey.com/Publication/vwLUAssets/EY-tomorrows-investment-rules-2/$FILE/EY-tomorrows-investment-rules-2.0.pdf17 See http://www.sustainalytics.com/sites/default/files/engagement-blackboxofvaluecreation-2016.pdf

18
Negative screening of “sin” industries
Hiring of specialist ESG teams
Investors sign up to the UN PRI
Asset managers offer specialist SRI mandates
Regulation is at best indifferent to ESG investing
Limited offering of ESG-related indices
Emergence of specialist providers of ESG analysis
Limited ESG disclosure by corporations
ESG data hard to collect
Active engagement limited to governance and proxy voting
Positive screening based on ESG
ESG is integrated in investment decisions
PRI Signatories report on ESG implementation
Asset owners embrace responsible investing
Regulation is supportive of ESG
Broader offering of ESG indices; launch of thematic ETFs; ESG incorporated in “smart beta” strategies
An industry of ESG providers is growing fast and consolidating
Corporations develop a Corporate Social Responsibility (CSR) agenda
ESG data broadly available. Push for mandatory reporting
Active engagement covers all E, S and G dimensions
YESTERDAY TODAY
Figure 5
From fringe to mainstream: changes in the ESG investment landscape at a glance
Source: Barclays Research

19
But be aware of the cost…The evolution of the ESG landscape can potentially lead to incremental costs to investors, asset managers and corporations: ESG commitment, reporting and analysis take time and resources to implement. This raises a host of questions for asset owners and managers:
• Many institutional asset managers have created specialist ESG teams. Is all this justified, or should such expertise just be embedded in traditional fundamental investment analysis with a long horizon perspective?
• Can a focus on ESG distract the investment focus away from return maximisation?
• In particular, could the increased emphasis on ESG ratings encourage mutual fund managers to make their funds attractive to investors by increasing the weight of high ESG-rated securities with insufficient consideration of financial risk and return?
• Can the increasing scrutiny and reporting burden that comes with ESG deter private companies from going public, or even encourage public corporations to go private? ESG ratings are generally published for publicly listed companies although corporate bonds can be issued by both public and private firms. A trend towards private ownership could limit the ESG rated investment universe of asset managers.
20
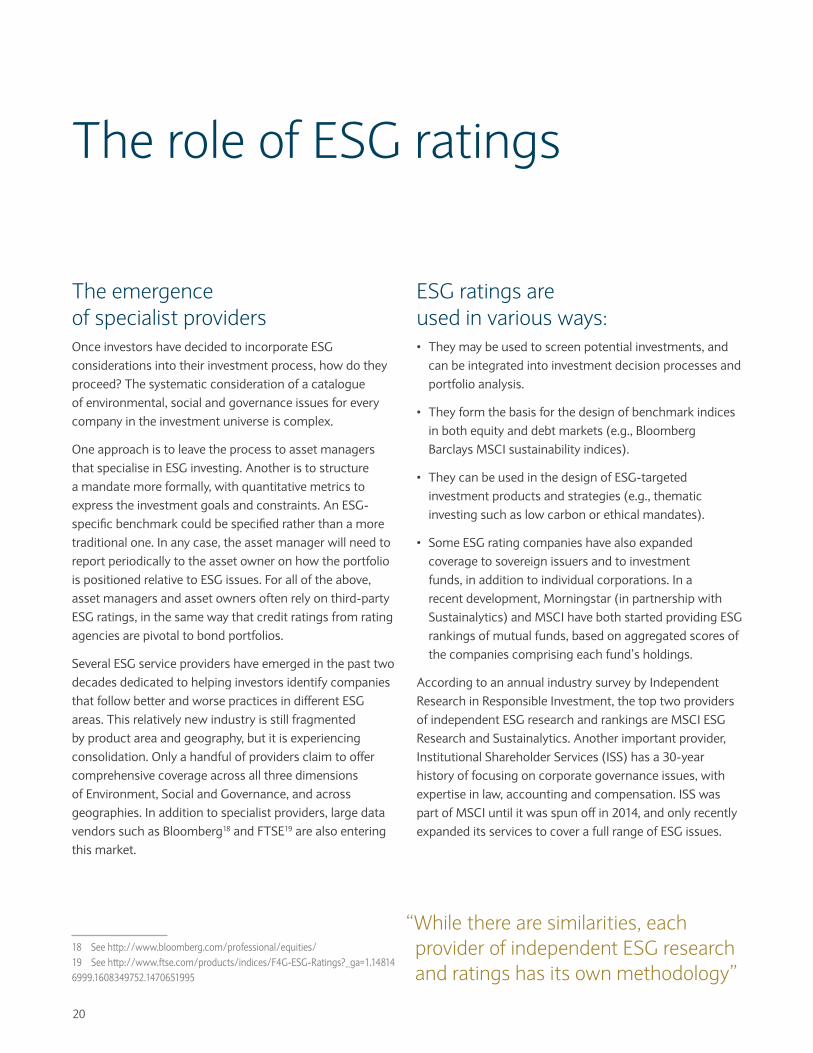
The emergence of specialist providersOnce investors have decided to incorporate ESG considerations into their investment process, how do they proceed? The systematic consideration of a catalogue of environmental, social and governance issues for every company in the investment universe is complex.
One approach is to leave the process to asset managers that specialise in ESG investing. Another is to structure a mandate more formally, with quantitative metrics to express the investment goals and constraints. An ESG-specific benchmark could be specified rather than a more traditional one. In any case, the asset manager will need to report periodically to the asset owner on how the portfolio is positioned relative to ESG issues. For all of the above, asset managers and asset owners often rely on third-party ESG ratings, in the same way that credit ratings from rating agencies are pivotal to bond portfolios.
Several ESG service providers have emerged in the past two decades dedicated to helping investors identify companies that follow better and worse practices in different ESG areas. This relatively new industry is still fragmented by product area and geography, but it is experiencing consolidation. Only a handful of providers claim to offer comprehensive coverage across all three dimensions of Environment, Social and Governance, and across geographies. In addition to specialist providers, large data vendors such as Bloomberg18 and FTSE19 are also entering this market.
18 See http://www.bloomberg.com/professional/equities/19 See http://www.ftse.com/products/indices/F4G-ESG-Ratings?_ga=1.148146999.1608349752.1470651995
The role of ESG ratings
ESG ratings are used in various ways:• They may be used to screen potential investments, and
can be integrated into investment decision processes and portfolio analysis.
• They form the basis for the design of benchmark indices in both equity and debt markets (e.g., Bloomberg Barclays MSCI sustainability indices).
• They can be used in the design of ESG-targeted investment products and strategies (e.g., thematic investing such as low carbon or ethical mandates).
• Some ESG rating companies have also expanded coverage to sovereign issuers and to investment funds, in addition to individual corporations. In a recent development, Morningstar (in partnership with Sustainalytics) and MSCI have both started providing ESG rankings of mutual funds, based on aggregated scores of the companies comprising each fund’s holdings.
According to an annual industry survey by Independent Research in Responsible Investment, the top two providers of independent ESG research and rankings are MSCI ESG Research and Sustainalytics. Another important provider, Institutional Shareholder Services (ISS) has a 30-year history of focusing on corporate governance issues, with expertise in law, accounting and compensation. ISS was part of MSCI until it was spun off in 2014, and only recently expanded its services to cover a full range of ESG issues.
“While there are similarities, each provider of independent ESG research and ratings has its own methodology”
21
How are ESG ratings formed?While there are similarities, each provider of independent ESG research and ratings has its own methodology. ESG ratings are based on a multi-criteria scoring of individual corporations based on a large set of factors or metrics across all three E, S and G dimensions (Figure 6).
The ranking process begins in a bottom-up manner. Within each of the three main dimensions, dozens of specific categories of risk are assessed, and each company is scored on its exposure to that category of risk and the steps it has taken to mitigate it.
In each category, the assignment of a numerical score to a company may require the synthesis of quantitative and qualitative information from multiple sources. Among the information sources and questions to be evaluated in a given area are:
• Quantitative ESG data disclosed by a company regarding its own activities
• Estimates of ESG data from third-party sources
• Level of self-disclosure
• How exposed is the company to significant risks in this area?
• How much has been done to manage such risks?
• Has the company been involved in controversial incidents on this topic? What happened?
• Is there a formal program in place to manage this issue company-wide?
• Is the company well placed to capitalize on opportunities in this area?
ESG score providers combine information from all of these sources and calculate fine-grained scores for each individual metric on an absolute basis. These are then
aggregated up to overall scores for each of the three pillars (E, S and G), and from there to an overall ESG score, as a weighted average of the granular scores. Another key element in this aggregation process is the assignment of weights. A given corporation may be involved in many different businesses and geographies, each bringing a different set of ESG exposures. Similarly, the relative importance of each metric may vary substantially by industry or country.
To meet this challenge, each ESG ranking firm has developed a scheme for assigning different sets of weights to underlying risk factors for each industry and company. Thus, while an overall Environment ranking will be provided for every firm, be it a bank, a pharmaceutical firm or an oil company, the three scores will represent very different things, and the Environment score will form a different percentage of the overall ESG score. For example, the Environment score has a relatively small weight in the combined ESG score of banks, but a large weight in the ESG rating of energy companies.
Both the selection of the underlying metrics that are evaluated and the weights assigned to these metrics change over time, reflecting industry developments and evolving beliefs regarding corporate “best practice”.
The ESG rating firms’ research contains two kinds of rankings: relative and absolute. The most fine-grained metrics are typically absolute scores, or raw scores, which allow comparison between any two companies across the board. Conversely, the highest-level ESG ratings are based on rankings relative to a peer group in the same industry. Rating comparisons are most useful for firms within the same peer group; a comparison of the overall ESG scores of companies in different industries is much less meaningful. In this sense, ESG ratings are very different than credit ratings, which rank the credit-worthiness of firms in all industries on a common scale.

It’s not just about climate changeGlobal warming may be the most widely recognised “poster child” of sustainable investing, but it is far from being the only issue. In fact, ESG ratings reflect a broad range of considerations within each of the three categories. Each ratings provider has a detailed hierarchy of sub-categories and specific issues that are used to arrive at numeric scores for each company. The following table offers a small sampling of the more detailed sets of issues examined by ESG ratings providers to form their E, S and G scores:
ENVIRONMENT SOCIAL GOVERNANCE
Carbon emissions Labour management Corporate governance
Energy efficiency Diversity and discrimination Business ethics
Natural resource use Working conditions Anti-competitive practices
Hazardous waste management Employee safety Corruption and instability
Recycled material use Product safety Anti-bribery policy
Clean technology Fair trade products Anti-money laundering policy
Green buildings Advertising ethics Compensation disclosure
Biodiversity programmes Human rights policy Gender diversity of board
Source: MSCI ESG Research, Sustainalytics
Figure 6
23
Each ratings provider has developed its own unique approach to integrating all of these issues into a numerical scoring system for producing ESG ratings. While they often agree, there are differences in the different providers’ methodologies at every level:
• Selection of the detailed list of low-level factors in each category
• Assignment of raw factor scores: how much emphasis is placed on the different types of information available? How much of a penalty is assigned to companies that do not disclose information or do not maintain formal ESG programs?
• What parts of the ratings process are purely formula-driven, and where is there room for an analyst to apply subjective judgement?
• Assignment of weights to different factors for each industry. Must these be constant across an industry, or can a given firm be assigned different weights to respect its mix of businesses?
• To what peer group should each firm be compared to convert absolute scores to relative ones?
Due to these differences in approach, it is not surprising that different ratings providers can at times disagree in their assessment of a company.
For a more detailed analysis of the methodologies employed by MSCI and Sustainalytics, as well as a comparative analysis of their ESG scores, please contact the authors (details on page 38).
Do all these ratings tell the same story?To what extent are individual E, S and G scores from the same provider correlated with each other? For example, is a company that scores highly in terms of Governance also likely to have high Environment or Social scores? Our analysis of the ratings on corporate bond issuers from both providers shows that all of these correlations are low (near zero for MSCI and about 30% for Sustainalytics). This means that individual E, S and G scores carry different information content so tend to complement each other to help form a holistic description of non-financial information and risk.
Do different providers of ESG ratings tend to reach similar conclusions? As a lot of the analysis done by each provider is based on publicly accessible data sources, and on the information put forward by the rated companies, one could expect the qualitative rankings of different companies to be comparable. However, as discussed, the differences in the way the data are processed, analysed and presented can lead to very different results.
In practice, we observe that MSCI and Sustainalytics ratings often disagree with each other. When measuring the relationship between ESG ratings of the two providers, we find positive but low correlations across all three dimensions (Governance has 14%, Environment 31%), as well as for the composite rating. This is not surprising, given the differences in methodology described above.
Thus, ESG ratings should not be considered as a simple commodity; the ratings from different providers carry different information and can potentially suggest different portfolio management decisions. This makes it all the more surprising that our analysis seems to arrive at similar conclusions using ESG ratings from either provider – as we shall soon see – in terms of both the relationship with credit ratings and the performance implications.
“Several ESG service providers have emerged in the past two decades dedicated to helping investors identify companies that follow better and worse practices in different ESG areas.”
24
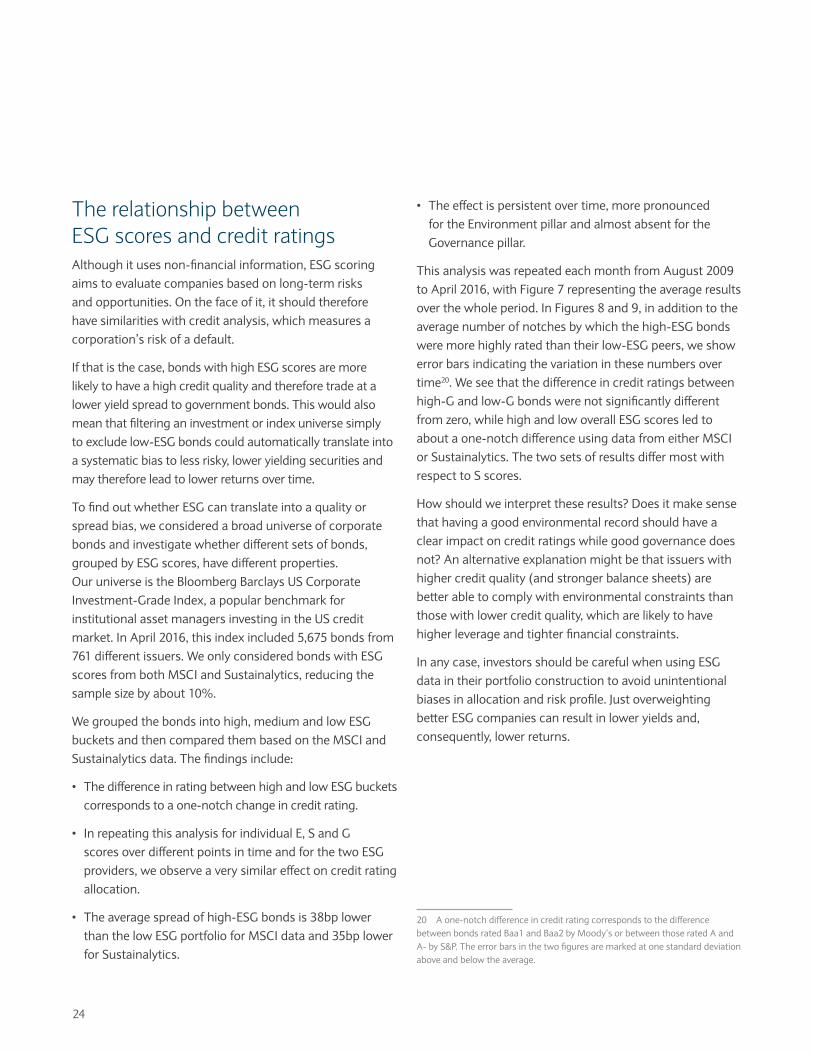
The relationship between ESG scores and credit ratingsAlthough it uses non-financial information, ESG scoring aims to evaluate companies based on long-term risks and opportunities. On the face of it, it should therefore have similarities with credit analysis, which measures a corporation’s risk of a default.
If that is the case, bonds with high ESG scores are more likely to have a high credit quality and therefore trade at a lower yield spread to government bonds. This would also mean that filtering an investment or index universe simply to exclude low-ESG bonds could automatically translate into a systematic bias to less risky, lower yielding securities and may therefore lead to lower returns over time.
To find out whether ESG can translate into a quality or spread bias, we considered a broad universe of corporate bonds and investigate whether different sets of bonds, grouped by ESG scores, have different properties. Our universe is the Bloomberg Barclays US Corporate Investment-Grade Index, a popular benchmark for institutional asset managers investing in the US credit market. In April 2016, this index included 5,675 bonds from 761 different issuers. We only considered bonds with ESG scores from both MSCI and Sustainalytics, reducing the sample size by about 10%.
We grouped the bonds into high, medium and low ESG buckets and then compared them based on the MSCI and Sustainalytics data. The findings include:
• The difference in rating between high and low ESG buckets corresponds to a one-notch change in credit rating.
• In repeating this analysis for individual E, S and G scores over different points in time and for the two ESG providers, we observe a very similar effect on credit rating allocation.
• The average spread of high-ESG bonds is 38bp lower than the low ESG portfolio for MSCI data and 35bp lower for Sustainalytics.
• The effect is persistent over time, more pronounced for the Environment pillar and almost absent for the Governance pillar.
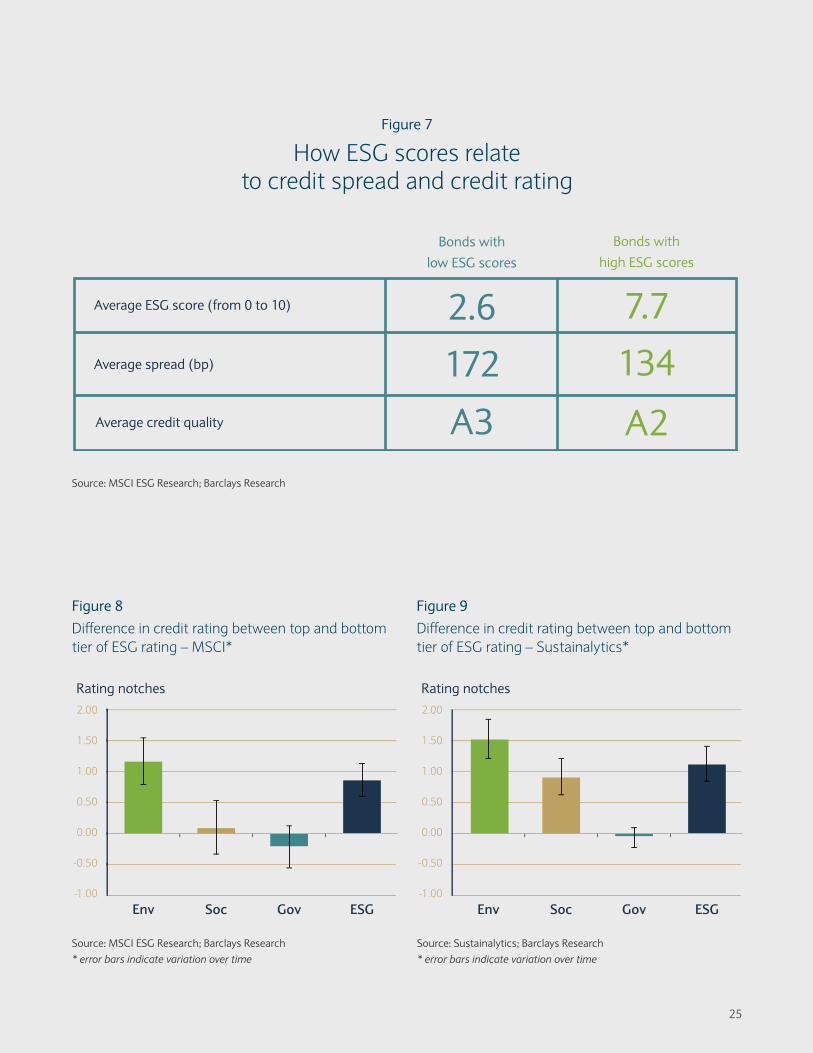
This analysis was repeated each month from August 2009 to April 2016, with Figure 7 representing the average results over the whole period. In Figures 8 and 9, in addition to the average number of notches by which the high-ESG bonds were more highly rated than their low-ESG peers, we show error bars indicating the variation in these numbers over time20. We see that the difference in credit ratings between high-G and low-G bonds were not significantly different from zero, while high and low overall ESG scores led to about a one-notch difference using data from either MSCI or Sustainalytics. The two sets of results differ most with respect to S scores.
How should we interpret these results? Does it make sense that having a good environmental record should have a clear impact on credit ratings while good governance does not? An alternative explanation might be that issuers with higher credit quality (and stronger balance sheets) are better able to comply with environmental constraints than those with lower credit quality, which are likely to have higher leverage and tighter financial constraints.
In any case, investors should be careful when using ESG data in their portfolio construction to avoid unintentional biases in allocation and risk profile. Just overweighting better ESG companies can result in lower yields and, consequently, lower returns.
20 A one-notch difference in credit rating corresponds to the difference between bonds rated Baa1 and Baa2 by Moody’s or between those rated A and A- by S&P. The error bars in the two figures are marked at one standard deviation above and below the average.
25
2.00
1.50
1.00
0.50
0.00
-0.50
-1.00
Env ESGSoc Gov
2.00
1.50
1.00
0.50
0.00
-0.50
-1.00
Rating notches Rating notches
Env ESGSoc Gov
2.00
1.50
1.00
0.50
0.00
-0.50
-1.00
Env ESGSoc Gov
2.00
1.50
1.00
0.50
0.00
-0.50
-1.00
Rating notches Rating notches
Env ESGSoc Gov
Figure 7
How ESG scores relate to credit spread and credit rating
Bonds with low ESG scores
2.6 7.7
172 134
A3 A2
Average ESG score (from 0 to 10)
Average spread (bp)
Average credit quality
Bonds with high ESG scores
Source: MSCI ESG Research; Barclays Research
Figure 8Difference in credit rating between top and bottom tier of ESG rating – MSCI*
Figure 9 Difference in credit rating between top and bottom tier of ESG rating – Sustainalytics*
Source: MSCI ESG Research; Barclays Research* error bars indicate variation over time
Source: Sustainalytics; Barclays Research* error bars indicate variation over time
26
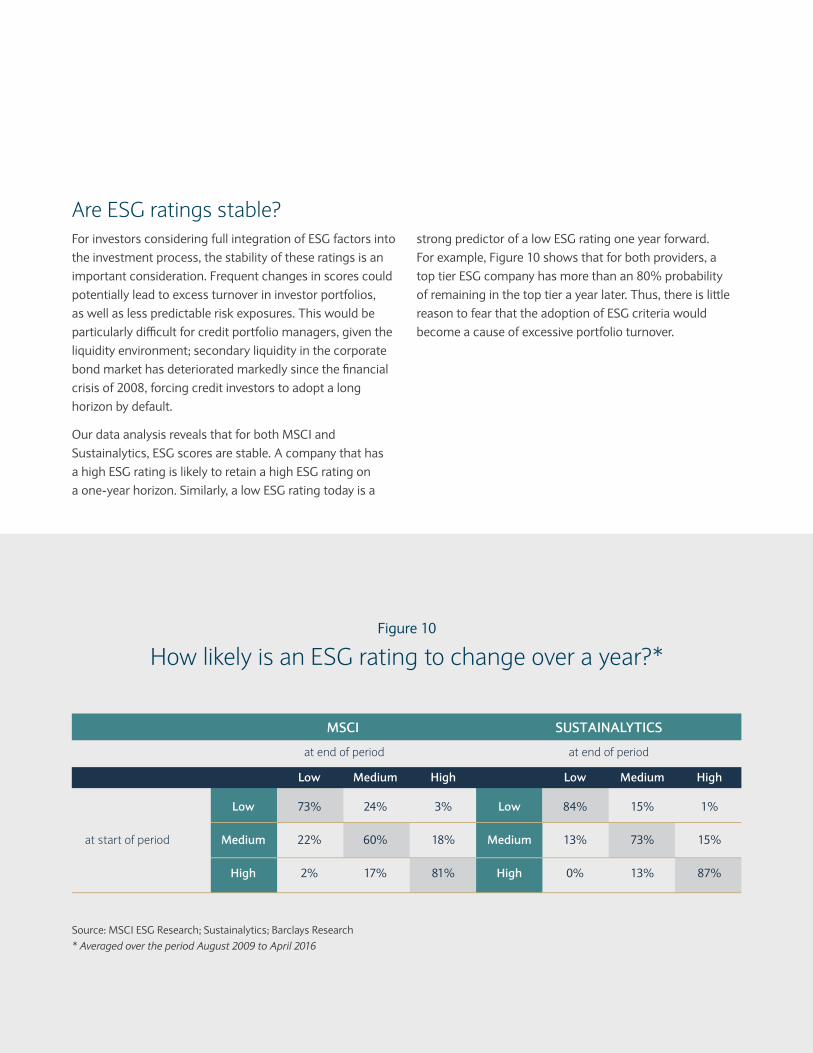
Are ESG ratings stable?For investors considering full integration of ESG factors into the investment process, the stability of these ratings is an important consideration. Frequent changes in scores could potentially lead to excess turnover in investor portfolios, as well as less predictable risk exposures. This would be particularly difficult for credit portfolio managers, given the liquidity environment; secondary liquidity in the corporate bond market has deteriorated markedly since the financial crisis of 2008, forcing credit investors to adopt a long horizon by default.
Our data analysis reveals that for both MSCI and Sustainalytics, ESG scores are stable. A company that has a high ESG rating is likely to retain a high ESG rating on a one-year horizon. Similarly, a low ESG rating today is a
Figure 10
How likely is an ESG rating to change over a year?*
MSCI SUSTAINALYTICS
at end of period at end of period
Low Medium High Low Medium High
Low 73% 24% 3% Low 84% 15% 1%
at start of period Medium 22% 60% 18% Medium 13% 73% 15%
High 2% 17% 81% High 0% 13% 87%
Source: MSCI ESG Research; Sustainalytics; Barclays Research* Averaged over the period August 2009 to April 2016
strong predictor of a low ESG rating one year forward. For example, Figure 10 shows that for both providers, a top tier ESG company has more than an 80% probability of remaining in the top tier a year later. Thus, there is little reason to fear that the adoption of ESG criteria would become a cause of excessive portfolio turnover.

27
28
Does the incorporation of environmental, social and governance criteria in the investment process improve the financial performance of a bond portfolio or hurt it?
Many studies have been published to try to establish an empirical link between ESG attributes and financial performance. A recent survey article21 on this body of research summarises the results from 60 distinct review studies, covering 2,200 primary studies. The authors emphasise the difficulties in trying to generalise over many different studies, each of which may focus on a different aspect of ESG criteria in a different market, geography, or industry. Nonetheless, they report that about half of the published studies show a positive link between corporate social responsibility and corporate financial performance, while less than 10% report a negative link.
There is a key distinction between an ESG approach based on negative screening by industry and one based on relative comparisons of the firms in each industry. For example, an investor using a negative screen may choose to exclude coal mining companies from its investment universe. Another may use ESG ratings to rank coal mining companies and choose to invest in the ones that have the best overall ranking within the sector. In the first case, in a year in which coal mining companies outperform the market, the investment portfolio may lag a broad market index. In the second approach, the portfolio is neutral with regard to the systematic sector exposure, but favours companies with better ESG policies, as these are considered to be less likely to suffer from the risks inherent in the industry.22
21 Gunnar Friede, Timo Busch & Alexander Bassen (2015),”ESG and financial performance: aggregated evidence from more than 2000 empirical studies”, Journal of Sustainable Finance & Investment (2015) 5:4, 210-233.22 It may seem at first glance that negative screens provide a much more powerful impetus for social change. However, in the context of our example, which investor is more likely to influence the behavior of a coal mining company executive? The first will not buy stock in any case, while the second will be reviewing ESG policies as the basis for the investment decision. Thus, the “best-in-class” approach can be supported even from an idealistic viewpoint as well as from a purely capitalistic one.
How do ESG ratings affect corporate bond performance?
The Bloomberg Barclays MSCI range of ESG bond indices23 include examples of both negative and positive screening. The Socially Responsible (SRI) corporate bond index is based on negative screening and excludes companies involved in industries such as tobacco, alcohol, gambling, adult entertainment, nuclear power, genetically modified organisms, stem cell research, firearms, and weapon systems. By contrast, the Sustainability index uses a best-in-class approach based on ESG ratings to choose the best-rated subset of index bonds within each industry.
In research24 conducted in 2015, Barclays Research analysed the historical returns of both these indices relative to the Bloomberg Barclays US Corporate IG Index. While both had underperformed in terms of nominal returns, some of that underperformance was traced to systematic biases unrelated to ESG criteria. Once they were corrected, we found that the return impact due specifically to the ESG tilt in security selection was positive for the Sustainability index but negative for the SRI one. We concluded that the wholesale exclusion of entire industries from the investment universe, while it may be desirable based on ethical considerations, is not justified based on purely financial criteria.
23 See Bloomberg Barclays MSCI ESG Fixed Income Indices, A New Market Standard for Environmental, Social, and Governance Investing, June 2013.24 Albert Desclée, Lev Dynkin, Anando Maitra and Simon Polbennikov, ESG Ratings and Performance of Corporate Bonds, Barclays Research, 18 November 2015.
29
Our methodology: objectively measuring ESG impact on performance For the purpose of this research paper into the impact of ESG on corporate bond portfolios, we applied an ESG tilt in security selection within each industry. Can such an approach improve portfolio performance over the long term?
To measure the effect of ESG investing on credit portfolio performance in an objective manner, it is important to isolate the ESG effect from all other possible sources of risk. To do this, we constructed pairs of portfolios that differed drastically in their ESG scores, but whose risk profiles were nearly identical across all important dimensions of risk for corporate bonds. We then measured and compared the performance of these portfolios over time.
The core of our portfolio construction technique is a mechanism for building well-diversified portfolios of bonds designed to track a benchmark – in this case, the Bloomberg Barclays US Corporate Investment-Grade Index. We applied a simple model that constrains the portfolio to remain neutral to the benchmark along multiple risk dimensions that could arise from differences in yield, maturity, credit quality, or sector allocation. In addition, limits on concentration ensured that the tracking portfolios were highly diversified.25
Many such portfolios could be created; in our procedure, the model was run once to find the portfolio with the highest possible average ESG score that meets these constraints and once to find the one with the lowest ESG score. The two tracking portfolios were reconstructed on a monthly basis, coordinated with the monthly index
25 To ensure consistency, the set of bonds considered for portfolio construction was limited to those for which ESG ratings were available from both MSCI and Sustainalytics.
rebalancing, to ensure that they kept pace with any changes in the structure of the corporate bond market. Both would be expected to track the index quite well, experiencing the same broad rallies and declines as the benchmark, so that monthly tracking error volatility should be low. The key question is whether substantial differences would arise over time between the average returns of the two portfolios.
The difference between the high and low ESG tracking portfolios can be interpreted as an ESG factor: the return contribution associated with systematically favouring high ESG corporate bonds over low ESG ones while keeping everything else equal. This approach does not automatically exclude any issuer or any industry sector, no matter how controversial they might be.
In addition to pairs of portfolios with the minimum and maximum overall ESG rating, we also created portfolio pairs that accentuate the differences in individual E, S and G scores, to try to observe which one of these three pillars is most related to performance. All of these studies were carried out twice, using ESG ratings from either MSCI or Sustainalytics.
“Wholesale exclusion of entire industries from the investment universe, while it may be desirable based on ethical considerations, is not justified based on purely financial criteria.”
30
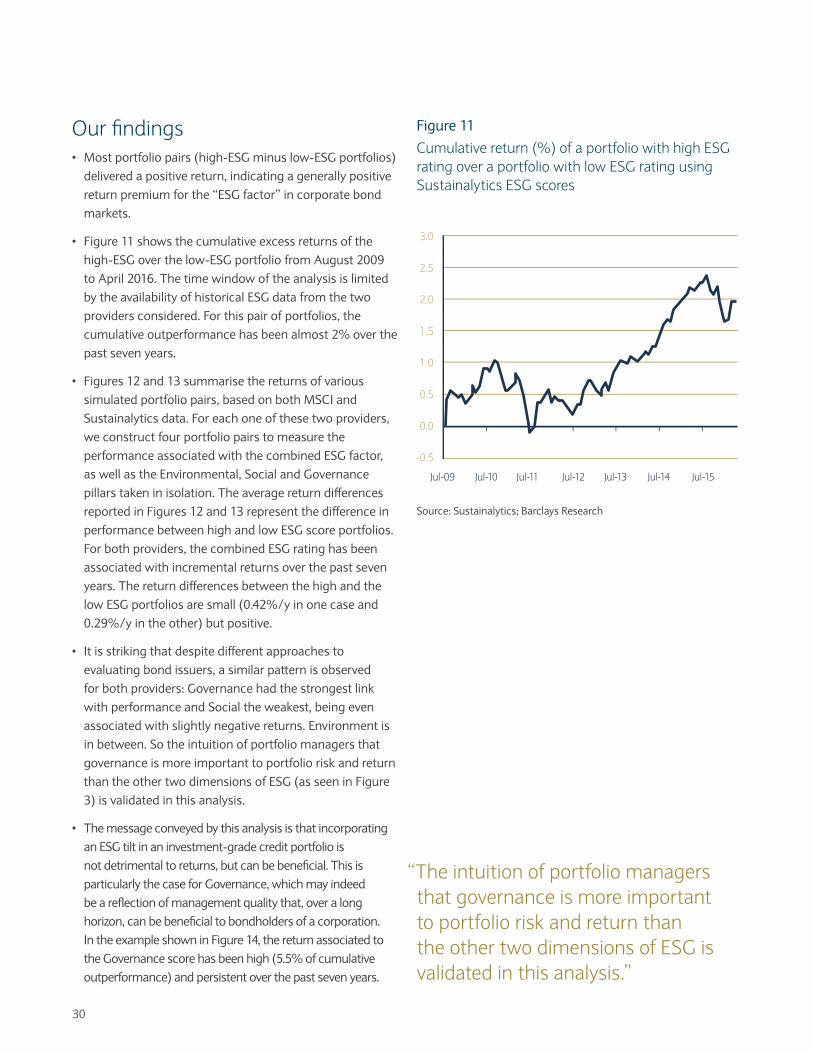
Figure 11Cumulative return (%) of a portfolio with high ESG rating over a portfolio with low ESG rating using Sustainalytics ESG scores
Source: Sustainalytics; Barclays Research
Jul-09 Jul-10 Jul-11 Jul-12 Jul-13 Jul-14 Jul-15
3.0
2.5
2.0
1.5
1.0
0.5
0.0
-0.5
Our findings• Most portfolio pairs (high-ESG minus low-ESG portfolios)
delivered a positive return, indicating a generally positive return premium for the “ESG factor” in corporate bond markets.
• Figure 11 shows the cumulative excess returns of the high-ESG over the low-ESG portfolio from August 2009 to April 2016. The time window of the analysis is limited by the availability of historical ESG data from the two providers considered. For this pair of portfolios, the cumulative outperformance has been almost 2% over the past seven years.
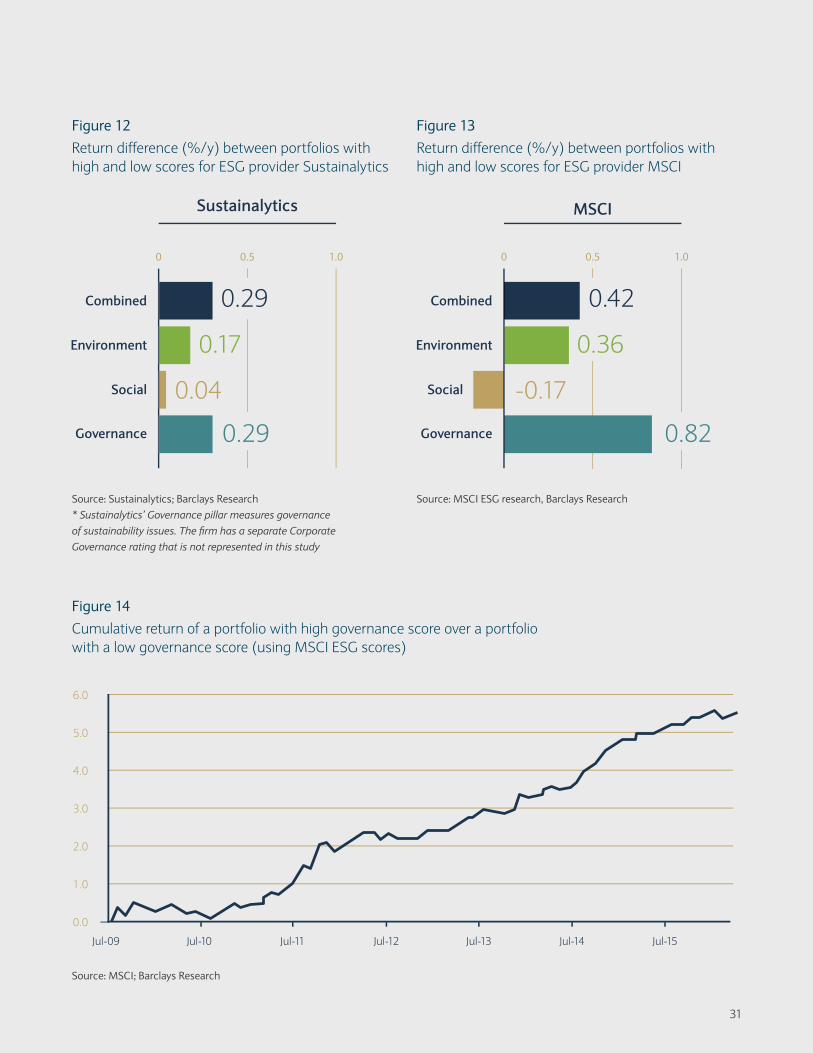
• Figures 12 and 13 summarise the returns of various simulated portfolio pairs, based on both MSCI and Sustainalytics data. For each one of these two providers, we construct four portfolio pairs to measure the performance associated with the combined ESG factor, as well as the Environmental, Social and Governance pillars taken in isolation. The average return differences reported in Figures 12 and 13 represent the difference in performance between high and low ESG score portfolios. For both providers, the combined ESG rating has been associated with incremental returns over the past seven years. The return differences between the high and the low ESG portfolios are small (0.42%/y in one case and 0.29%/y in the other) but positive.
• It is striking that despite different approaches to evaluating bond issuers, a similar pattern is observed for both providers: Governance had the strongest link with performance and Social the weakest, being even associated with slightly negative returns. Environment is in between. So the intuition of portfolio managers that governance is more important to portfolio risk and return than the other two dimensions of ESG (as seen in Figure 3) is validated in this analysis.
• The message conveyed by this analysis is that incorporating an ESG tilt in an investment-grade credit portfolio is not detrimental to returns, but can be beneficial. This is particularly the case for Governance, which may indeed be a reflection of management quality that, over a long horizon, can be beneficial to bondholders of a corporation. In the example shown in Figure 14, the return associated to the Governance score has been high (5.5% of cumulative outperformance) and persistent over the past seven years.
“The intuition of portfolio managers that governance is more important to portfolio risk and return than the other two dimensions of ESG is validated in this analysis.”
31
Jul-09 Jul-10 Jul-11 Jul-12 Jul-13 Jul-14 Jul-15
6.0
5.0
4.0
3.0
2.0
1.0
0.0
Source: Sustainalytics; Barclays Research * Sustainalytics’ Governance pillar measures governance of sustainability issues. The firm has a separate Corporate Governance rating that is not represented in this study
Source: MSCI ESG research, Barclays Research
Figure 12Return difference (%/y) between portfolios with high and low scores for ESG provider Sustainalytics
Figure 13Return difference (%/y) between portfolios with high and low scores for ESG provider MSCI
Figure 14 Cumulative return of a portfolio with high governance score over a portfolio with a low governance score (using MSCI ESG scores)
Source: MSCI; Barclays Research
32
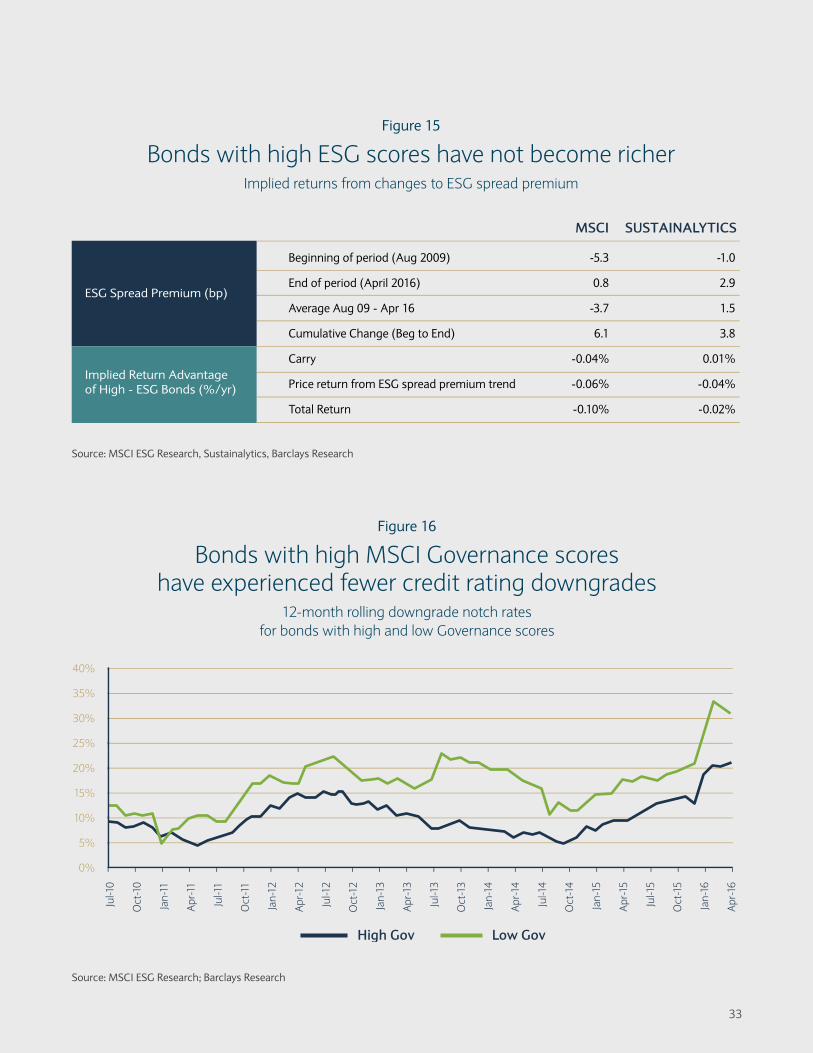
No evidence of “systematic richening” of high ESG bondsThere is a possibility that, as a result of the increased popularity of ESG investing, portfolio flows from issuers with poor ESG attributes to those with high ESG scores have resulted in the systematic richening of high ESG bonds (and cheapening of low ESG bonds). If that is the case, the returns observed in our analysis should be considered as transient and typical of a specific time period that may not be representative of future market conditions.
If such a systematic ESG-based repricing of bonds happened in the past few years, it should be visible in bond valuations, in particular spreads over Treasuries. However, issuers with high ESG scores could also have tighter spreads for unrelated reasons – they could be tilted towards higher credit ratings or specific industries, for example. We use statistical analysis to measure the extent to which there is a systematic ESG-specific spread premium that would cause the spreads of high-ESG corporate bonds to be higher or lower than those of their peers after controlling for sector, quality and duration. We repeated this analysis each month and observed both the average results over our study period and the changes that were observed in the interim. We then calculated a crude estimate of the impact that these observed spread differences could have been expected to have on portfolio returns.
We found no evidence of a systematic tightening of high-ESG bonds relative to the broader market; in fact, if anything, we found the opposite. Results of the statistical analysis had low significance in many months, indicating that the market was largely pricing corporate bonds based on sector, quality and duration, with little or no systematic preference for ESG bonds. As shown in Figure 15, using overall ESG scores from both MSCI and Sustainalytics as the ranking variable, a small negative spread premium was detected at the start of the period, indicating that high-ESG bonds were more expensive than their low-ESG peers. However, by the end of the study, this reverted to a small positive number.
The effect of this premium on returns would be two-fold. First, over the long term, high-ESG bonds should earn a carry advantage equal to the spread, which for the MSCI rankings came to an estimated -0.04%/year. Second, if the spread widened by 6 basis points over the course of the seven years of the study period – representing
roughly 1 bp/year – this should translate into an estimated underperformance of about -0.10%/year. For Sustainalytics ratings, the performance difference was estimated at -0.02%/year. Thus, if there was a systematic effect of ESG ratings on pricing, the small changes to this number should have caused a small underperformance for high-ESG bonds over the study period. We can thus rule out the possibility that the outperformance of high-ESG portfolios described above was due to a systematic richening of ESG bonds; and there is therefore no reason to expect this outperformance to be reversed.
What is the reason for high ESG outperformance?If there was no systematic richening of bonds with good ESG rankings, what has made them outperform? One interpretation could be that poor ESG rankings relate to risks of various types of adverse events that could negatively impact companies’ fortunes and that even over the relatively short time period we have investigated, our high-ESG portfolios experienced fewer such events than the low-ESG portfolios. Unfortunately, we do not have sufficient data to document such an effect with regard to ESG-specific events. However, we know that in bond markets, negative changes to a company’s outlook are often associated with a downgrade in credit ratings, as well as negative returns. Do we find that high ESG scores are associated with a lower rate of subsequent downgrades?
To test this, we partitioned our bond universe into two groups – above and below the median ESG scores – and observed the number and magnitude of downgrades in each set. This allowed us to report an annual “downgrade notch rate” capturing both the frequency and intensity of downgrades. (For example, if 10% of the issuers in a given group experience one-notch downgrades and another 3% have two-notch downgrades, the downgrade notch rate for the year would be 16%.) We compared these downgrade rates for bonds scoring high and low in different ESG categories according to the two providers; the most striking difference in the two groups was observed using Governance scores. As shown in Figure 16, bonds with low governance scores experienced a consistently higher rate of subsequent downgrades than those with high scores throughout our study period.
33
Figure 15
Bonds with high ESG scores have not become richer Implied returns from changes to ESG spread premium
Source: MSCI ESG Research, Sustainalytics, Barclays Research
Figure 16
Bonds with high MSCI Governance scores have experienced fewer credit rating downgrades
12-month rolling downgrade notch rates for bonds with high and low Governance scores
Source: MSCI ESG Research; Barclays Research
MSCI SUSTAINALYTICS
Beginning of period (Aug 2009) -5.3 -1.0
End of period (April 2016) 0.8 2.9
Average Aug 09 - Apr 16 -3.7 1.5
Cumulative Change (Beg to End) 6.1 3.8
Carry -0.04% 0.01%
Price return from ESG spread premium trend -0.06% -0.04%
Total Return -0.10% -0.02%
ESG Spread Premium (bp)
Implied Return Advantageof High - ESG Bonds (%/yr)
40%
35%
30%
25%
20%
15%
10%
5%
0%
Jul-1
0
Oct
-10
Jan-
11
Apr
-11
Jul-1
1
Oct
-11
Jan-
12
Apr
-12
Jul-1
2
Oct
-12
Jan-
13
Apr
-13
Jul-1
3
Oct
-13
Jan-
14
Apr
-14
Jul-1
4
Oct
-14
Jan-
15
Apr
-15
Jul-1
5
Oct
-15
Jan-
16
Apr
-16
High Gov Low Gov
34
All the indications are that the trend towards sustainable investing is not only becoming more sophisticated but also gaining widespread acceptance. ESG has become an increasingly popular framework for measuring and managing assets in a way that resonates with the values and beliefs held by many asset owners. ESG investing is now becoming embedded in the investment process of many institutional investors.
While evaluating an investment on Environment, Social and Governance dimensions used to be a demanding task, a number of service providers have emerged that offer ESG scores derived using non-financial metrics of corporate performance.
Our research into the impact of ESG on the performance of US investment-grade corporate bonds in the past seven years has shown that portfolios that maximise ESG scores while controlling for other risk factors have outperformed the index, and that ESG-minimized portfolios underperformed. The effect was most pronounced for the Governance tilt and least pronounced for the Social tilt. Favouring issuers with strong Environmental or Social rating has not been detrimental to bond returns. These conclusions hold using ESG ratings data from two different ratings providers, despite significant differences between the two ratings methodologies.
In many publicly quoted companies, corporate decision-makers have been forced to balance the long-term best interests of their firms against relentless investor pressure for short-term earnings growth. The growth of the sustainable investing movement can help redress the balance. As ESG considerations play out over a long horizon, and as they increasingly become a priority for company managers, they may help alleviate the pressure for short-termism and rather encourage a focus on long-term value creation – to the mutual benefit of the firm, its investors and the world at large.
Conclusion: sustainable investing has been beneficial to bond returns
“As ESG considerations play out over a long horizon, and as they increasingly become a priority for company managers, they may help alleviate the pressure for short-termism and rather encourage a focus on long-term value creation – to the mutual benefit of the firm, its investors and the world at large.”

35
36
Important Content Disclosures
Personal Use Only
All information contained herein shall only be used by the recipient for his/her own personal reference. Any other use, including any disclosure or distribution to of any information to any third party, requires the express written permission of Barclays.
For Information Purposes Only
This information has been prepared by the Research Department within the Investment Bank of Barclays Bank PLC and is distributed by Barclays Bank PLC and/or one or more of its affiliates (collectively and each individually, “Barclays”). The views expressed in this publication are those of the author(s) alone and are subject to change without notice. Barclays has no obligation to update this publication. This information is intended for informational purposes only and should not be regarded as an offer to sell or a solicitation of an offer to buy the products or securities to which it applies. No representation is made that any returns will be achieved through its use.
Information Provided May Not Be Accurate or Complete and May Be Sourced from Third Parties
All information, whether proprietary to Barclays or a third party, is provided “as is” and Barclays makes no express or implied warranties, and expressly disclaims all warranties of merchantability or fitness for a particular purpose or use with respect to any data included herein. Other than disclosures relating to Barclays, the information contained
in this publication has been obtained from sources that Barclays Research believes to be reliable, but Barclays makes no representations that the information contained herein is accurate, reliable, complete, or appropriate for use by all investors in all locations. Further, Barclays does not guarantee the accuracy or completeness of information which is obtained from, or is based upon, trade and statistical services or other third party sources. Because of the possibility of human and mechanical errors as well as other factors, Barclays is not responsible for any errors or omissions in the information contained herein. Barclays is not responsible for, and makes no warranties whatsoever as to, the content of any third-party web site accessed via a hyperlink contained herein and such information is not incorporated by reference.
Information Provided Is Not Indicative of Future Results
Any data on past performance, modelling or back-testing contained herein is not necessarily indicative of future results. All levels, prices and spreads are historical and do not represent current market levels, prices or spreads, some or all of which may have changed. The information referenced herein or any of the results derived from any analytic tools or reports referenced herein are not intended to predict actual results and no assurances are given with respect thereto. The value of and income from any investment may fluctuate from day to day as a result of changes in relevant economic markets (including changes in market liquidity).

37
No Liability
To the extent permitted by law, in no event shall Barclays, nor any affiliate, nor any of their respective officers, directors, partners, employees or third party licensors have any liability, direct or indirect, including but not limited to (a) any special, punitive, indirect, or consequential damages; or (b) any lost profits, lost revenue, loss of anticipated savings or loss of opportunity or other financial loss, even if notified or advised of the possibility of such damages or potential loss, arising from any use of the information provided herein.
No Advice
The information provided does not constitute investment advice or take into account the individual financial circumstances or objectives of the clients who receive it. You should consult with your own accounting, legal or other advisors as to the adequacy of this information for your purposes.
No Use For Valuation Purposes
No data or price information should be used for any valuation, trading, settlement, accounting purposes or other related functions.
Not Available In All Jurisdictions
Not all products or services mentioned are available in all jurisdictions. No offers, sales, resales, or delivery of any products or services described herein or any offering materials relating to any such products or services may be made in or from any jurisdiction except in circumstances which will result with compliance with any applicable laws and regulations and which will not impose any obligations on Barclays.
Tax Disclaimer
Barclays does not provide tax advice and nothing contained herein should be construed to be tax advice. Accordingly, you should seek advice based on your particular circumstances from an independent tax advisor.
Intellectual Property
© Copyright Barclays Bank PLC (2016). All rights reserved. No part of this document may be reproduced or redistributed in any manner without the prior written permission of Barclays.
Barclays Bank PLC is registered in England No. 1026167. Registered office 1 Churchill Place, London, E14 5HP.

38
Albert Desclée
+44 (0)20 7773 3382 [email protected] Barclays, UK
Albert Desclée is a Managing Director in the QPS Group at Barclays Research, based in London, and is responsible for its European activities. He advises investors on portfolio construction, including benchmark selection, risk management, asset allocation, choice of investment style and optimal risk budgeting. Albert joined Barclays in 2008 from Lehman Brothers, where he had the same responsibilities. Prior to joining Lehman Brothers’ research department, he worked at Salomon Brothers in London, where he was in charge of fixed income index analytics and portfolio construction advisory. Albert graduated from the Catholic University of Louvain (Belgium) and obtained an MBA from INSEAD.
Lev Dynkin
+1 212 526 6302 [email protected] BCI, US
Lev Dynkin is Managing Director, founder and Head of the Quantitative Portfolio Strategy (QPS) Group at Barclays Research. Lev and the QPS group joined Barclays in 2008 from Lehman Brothers, where the group was a part of Fixed Income Research since 1987. QPS focuses on bespoke research related to quantitative issues of portfolio management for major institutional investors around the globe. Lev joined Lehman Brothers Fixed Income Research from Coopers & Lybrand, where he managed financial software development. He began his career doing research in theoretical and mathematical physics. He is based in New York.
Jay Hyman
+972 3 623 8745 [email protected] Barclays, UK
Jay Hyman is a Managing Director in the QPS group at Barclays Research. Jay advises clients on mandate design and efficient portfolio construction and management, relative to traditional benchmarks or liabilities. He has published research on topics including risk budgeting, performance attribution, portfolio optimization, cost of constraints, sufficient diversification and index replication; these studies have covered asset classes spanning fixed income, FX, equities, hedge funds and derivatives. Jay joined Barclays in October 2008 from Lehman Brothers, where he held a similar position. He holds a Ph.D. in Electrical Engineering from Columbia University in NY.
Simon Polbennikov
+44 (0)20 3134 0752 [email protected] Barclays, UK
Simon Polbennikov is a Director in the Quantitative Portfolio Strategy group. He advises institutional investors on quantitative aspects of portfolio management. Simon is responsible for empirical studies on investment strategies, hedging, portfolio construction, and benchmark customization. He joined Barclays in October 2008 from Lehman Brothers, where he held a similar position. He received a PhD degree from Tilburg University, Netherlands. Prior to that, he studied physics at Lomonosov’s Moscow State University, Russia and economics at the New Economic School, Moscow.
About the authors

39
