monitoring trichloroethene remediation at an iron permeable reactive barrier using stable carbon...
TRANSCRIPT
Journal of Contaminant Hydrology 78 (2005) 313–325
www.elsevier.com/locate/jconhyd
Monitoring trichloroethene remediation at an iron
permeable reactive barrier using stable carbon
isotopic analysis
Nancy VanStone a,b, Andrzej Przepiora c, John Vogan c,
Georges Lacrampe-Couloume a, Brian Powers d, Ernesto Perez e,
Scott Mabury b, Barbara Sherwood Lollar a,*
aStable Isotope Laboratory, University of Toronto, 22 Russell St., Toronto, ON, Canada, M5S 3B1bDepartment of Chemistry, University of Toronto, 80 St. George St., Toronto, ON, Canada, M5S 3H6
cEnviroMetal Technologies, Inc., 745 Bridge St. W., Suite 7, Waterloo, ON, Canada, N2V 2G6dURS Corporation, 8181 East Tufts Ave., Denver, CO, 80237, United States
eAFCEE/ ERD-FEW, 300 Vesle Drive, Building 367, F.E. Warren AFB, WY, 82005, United States
Received 27 May 2004; received in revised form 31 May 2005; accepted 31 May 2005
Abstract
Stable carbon isotopic analysis, in combination with compositional analysis, was used to evaluate
the performance of an iron permeable reactive barrier (PRB) for the remediation of ground water
contaminated with trichloroethene (TCE) at Spill Site 7 (SS7), F.E. Warren Air Force Base,
Wyoming. Compositional data indicated that although the PRB appeared to be reducing TCE to
concentrations below treatment goals within and immediately downgradient of the PRB,
concentrations remained higher than expected at wells further downgradient (i.e. N9 m) of the
PRB. At two wells downgradient of the PRB, TCE concentrations were comparable to upgradient
values, and d13C values of TCE at these wells were not significantly different than upgradient values.
Since the process of sorption/desorption does not significantly fractionate carbon isotope values, this
suggests that the TCE observed at these wells is desorbing from local aquifer materials and was
present before the PRB was installed. In contrast, three other downgradient wells show significantly
more enriched d13C values compared to the upgradient mean. In addition, d13C values for the
degradation products of TCE, cis-dichloroethene and vinyl chloride, show fractionation patterns
0169-7722/$ -
doi:10.1016/j.
* Correspon
E-mail add
see front matter D 2005 Elsevier B.V. All rights reserved.
jconhyd.2005.05.013
ding author. Tel.: +1 416 978 0770; fax: +1 416 978 3938.
ress: [email protected] (B. Sherwood Lollar).
N. VanStone et al. / Journal of Contaminant Hydrology 78 (2005) 313–325314
expected for the products of the reductive dechlorination of TCE. Since concentrations of both TCE
and degradation products drop to below detection limit in wells within the PRB and directly below it,
these downgradient chlorinated hydrocarbon concentrations are attributed to desorption from local
aquifer material. The carbon isotope values indicate that this dissolved contaminant is subject to local
degradation, likely due to in situ microbial activity.
D 2005 Elsevier B.V. All rights reserved.
Keywords: Carbon isotopes; Groundwater remediation; Permeable reactive barrier; Reductive dechlorination;
Trichloroethene; Zero-valent iron
1. Introduction
Permeable reactive barriers (PRBs) constructed of elemental iron have emerged as an
effective passive remediation method for ground water contaminated with a range of
contaminants, mainly chlorinated hydrocarbons (CHCs) (e.g. Agrawal and Tratnyek,
1996; Alowitz and Scherer, 2002; Gillham and O’Hannesin, 1994; Hozalski et al., 2001;
Nam and Tratnyek, 2000). A PRB is an in situ engineered zone of reactive material placed
across the path of contaminated ground water. The major advance of PRBs over other
ground water remediation approaches is the lack of above ground structures, low operation
and maintenance cost and the enhanced remediation efficiency, particularly compared with
pump-and-treat systems. There are currently more than 90 PRBs installed at CHC
contaminated sites (O’Hannesin, 2003). Many studies have investigated the pathways,
mechanisms, kinetics and longevity of CHC degradation using elemental iron (see Scherer
et al., 2000; Tratnyek, 2002).
Assessment of iron PRB performance is based on monitoring CHC concentrations,
along with pH and Eh, and major inorganic constituents, in ground water well transects
across the PRB. Often, iron PRBs are installed within existing contaminant plumes and
therefore elevated concentrations of contaminants are observed downgradient of PRBs for
some time after the system has been installed, depending on the extent of initial
contamination, ground water flow rates, desorption rates and type of the aquifer material.
The persistence of CHCs downgradient of iron PRBs is expected because significant
volumes of ground water may be needed for the remnant contaminants to be desorbed and
flushed from downgradient aquifer materials (Heneman et al., 2001; Powell et al., 1998). It
is difficult, however, to evaluate PRB performance in situations where elevated
contaminant concentrations downgradient of the PRB remain for longer than expected
periods (Powell et al., 1998). This could arise for three reasons: (1) incomplete degradation
within the PRB, (2) hydraulic bypass underneath or around the PRB, and (3) slower than
expected desorption of remnant contaminants trapped within aquifer materials. Distin-
guishing between these processes is important for the assessment of PRB performance and
consequently developing new techniques that help resolve these processes is of
considerable interest.
Fractionation of stable carbon isotopes has been observed for chlorinated ethenes
during processes such as biodegradation (Bloom et al., 2000; Hunkeler et al., 1999;
Sherwood Lollar et al., 2001; Slater et al., 2001), oxidation by permanganate (Hunkeler et

N. VanStone et al. / Journal of Contaminant Hydrology 78 (2005) 313–325 315
al., 2003; Poulson and Naraoka, 2002), and reductive dechlorination on zero-valent iron
(Bill et al., 2001; Dayan et al., 1999; Slater et al., 2002; VanStone et al., 2004). Carbon
isotopic fractionation results from differences in the rates of reaction for 13C- and 12C-
bearing molecules. The differences in reaction rates for the different isotopes are due to
mass-dependent differences in activation energies for the respective reactions (Fry, 1971).
In general, for most chlorinated ethenes and aromatic compounds, the lighter isotope (12C)
reacts faster than the heavier isotope (13C), leading to fractionation, and enrichment of the
heavy isotope in the remaining reactant as the reaction proceeds. Likewise, this leads to
enrichment in the light isotope with respect to the parent compound in the products of the
reaction. Laboratory experiments have shown that carbon isotopic fractionation for
chlorinated ethenes is not significant (i.e. b0.5x) for non-degradative processes such as
dissolution, vaporization or adsorption under equilibrium conditions (Dempster et al.,
1997; Harrington et al., 1999; Poulson and Drever, 1999; Slater et al., 1999, 2000),
whereas carbon isotopic fractionation associated with degradative processes is on the order
of tens of permil (x).
Carbon compound specific isotopic analysis (CSIA) is used to measure carbon isotope
fractionation and has been shown to be a powerful tool for identifying in situ
biodegradation in the field for contaminants such as perchloroethene (PCE) and
trichloroethene (TCE) (Hunkeler et al., 1999; Sherwood Lollar et al., 2001; Song et al.,
2002; Vieth et al., 2003). Several studies have shown large and reproducible carbon
isotopic fractionation during the degradation of chlorinated ethenes on electrolytic and cast
iron (Bill et al., 2001; Dayan et al., 1999; Slater et al., 2002; VanStone et al., 2004), but
these observations have not been applied in the field to date. The objective of this study
was to investigate the use of carbon stable isotopic analysis to help evaluate PRB
performance at a field installation for the remediation of TCE. Routine performance
monitoring of the PRB consisted of quantification of TCE and its products upgradient,
within and downgradient of the iron PRB. In addition, carbon CSIAwas carried out in the
vicinity of the PRB to investigate the source of elevated chlorinated ethene concentrations
observed downgradient of the installation.
2. Site background
A PRB constructed of iron filings was installed in 1999 at the F.E. Warren Air Force
Base, Wyoming, Spill Site 7 (SS7) to remediate ground water contaminated with TCE.
The TCE originates from a defunct on-site liquid oxygen manufacturing facility. A grease
trap at the plant was the source of organic solvents (primarily TCE) to a surface drainage
ditch, resulting in migration of the solvents through the vadose zone to local ground water
(Heneman et al., 2001). Construction of the PRB was completed in October 1999. A
schematic of the SS7 PRB is shown in Fig. 1, with the direction of ground water flow
indicated. The PRB is 173 m long, has a flow through thickness of 1.2 m and a saturated
depth of 4.6 m below the historic low ground water level, with a low-permeability clay cap
installed on the PRB to minimize ground water flow over the top of the treatment PRB.
The PRB was installed at the site as an interim remediation measure and it does not extend
to the bottom of the contaminated shallow aquifer. The PRB is located within 20 to 60 m
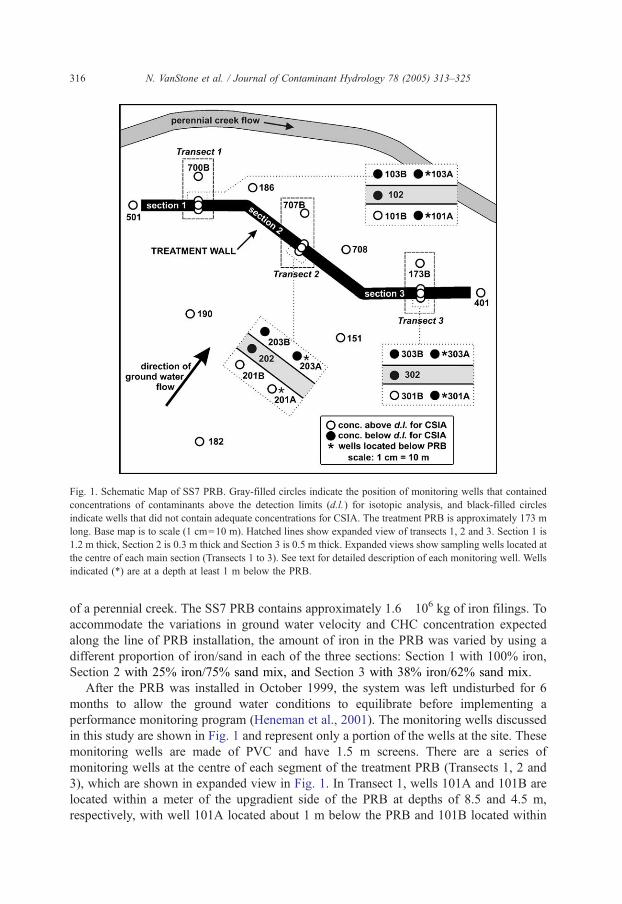
Fig. 1. Schematic Map of SS7 PRB. Gray-filled circles indicate the position of monitoring wells that contained
concentrations of contaminants above the detection limits (d.l.) for isotopic analysis, and black-filled circles
indicate wells that did not contain adequate concentrations for CSIA. The treatment PRB is approximately 173 m
long. Base map is to scale (1 cm=10 m). Hatched lines show expanded view of transects 1, 2 and 3. Section 1 is
1.2 m thick, Section 2 is 0.3 m thick and Section 3 is 0.5 m thick. Expanded views show sampling wells located at
the centre of each main section (Transects 1 to 3). See text for detailed description of each monitoring well. Wells
indicated (*) are at a depth at least 1 m below the PRB.
N. VanStone et al. / Journal of Contaminant Hydrology 78 (2005) 313–325316
of a perennial creek. The SS7 PRB contains approximately 1.6�106 kg of iron filings. To
accommodate the variations in ground water velocity and CHC concentration expected
along the line of PRB installation, the amount of iron in the PRB was varied by using a
different proportion of iron/sand in each of the three sections: Section 1 with 100% iron,
Section 2 with 25% iron/75% sand mix, and Section 3 with 38% iron/62% sand mix.
After the PRB was installed in October 1999, the system was left undisturbed for 6
months to allow the ground water conditions to equilibrate before implementing a
performance monitoring program (Heneman et al., 2001). The monitoring wells discussed
in this study are shown in Fig. 1 and represent only a portion of the wells at the site. These
monitoring wells are made of PVC and have 1.5 m screens. There are a series of
monitoring wells at the centre of each segment of the treatment PRB (Transects 1, 2 and
3), which are shown in expanded view in Fig. 1. In Transect 1, wells 101A and 101B are
located within a meter of the upgradient side of the PRB at depths of 8.5 and 4.5 m,
respectively, with well 101A located about 1 m below the PRB and 101B located within
N. VanStone et al. / Journal of Contaminant Hydrology 78 (2005) 313–325 317
the ground water plume transected by the PRB. Well 102 is located in the middle of the
PRB. Wells 103A and 103B are located approximately 1 m downgradient of the PRB at
depths of 8.5 and 4.5 m, respectively, with 103A located about 1 m below the PRB and
103B located within the ground water plume intercepted by the PRB. Well 700B is located
9 m downgradient from the PRB. The wells for the other 2 transects (Transect 2 and 3) are
similarly located with respect to the PRB.
Periodic sampling of the groundwater monitoring wells has been conducted since April
2000 for concentrations of CHCs (TCE, cDCE, trans-dichloroethene and VC) using
standard EPA method 502.1, and several inorganic indicators of water quality (Heneman et
al., 2001). There were consistent decreases in Eh, sulfate, calcium and magnesium
concentrations and increases in pH consistent with those documented at other PRB
projects (O’Hannesin and Gillham, 1998).
Performance monitoring of the SS7 PRB revealed a decrease in CHC concentration
across the PRB from upgradient to non-detectable values within the PRB and immediately
downgradient (Heneman et al., 2001). In contrast, in wells further downgradient of the
PRB (e.g. wells 186, 700B, 707B and 708 located 9 to 12 m from the PRB) concentrations
of both TCE and cDCE were comparable to upgradient concentrations and were suggested
to be due to desorption of TCE from aquifer materials downgradient of the PRB (Heneman
et al., 2001). Corresponding increases in pH and decreases in Eh, carbonate alkalinity,
Ca2+, and Mg2+ were noted within the PRB and immediately downgradient in comparison
to upgradient wells (Heneman et al., 2001). These trends are expected due to reducing
conditions created by iron corrosion and are consistent with those noted at other PRB sites
(O’Hannesin and Gillham, 1998). The values of iron-sensitive parameters (i.e. Eh and pH)
and constituents (Ca2+, alkalinity) measured in wells 700B, 707B, and 173B were similar
to the upgradient values. It was unclear whether the persistent high concentrations of TCE
and cDCE in the downgradient wells were due to incomplete degradation of TCE within
the PRB, or to continued desorption from the aquifer material (Heneman et al., 2001).
Based on hydraulic heads measured at each monitoring well, ground water flow paths in
the vicinity of the PRB were not significantly altered from pre-PRB ground water flow
records (Heneman et al., 2001), ruling out hydraulic bypass of the PRB as the source of
elevated downgradient concentrations of CHCs.
3. Methods
Samples for concentrations of chlorinated hydrocarbons and carbon isotopic analysis
were taken in June 2002 (Table 1). Four 40 mL samples from each well were preserved
with several drops of undiluted HCl to inhibit microbial activity, and stored without
headspace. Additional water samples were taken from each well for analysis of TCE,
cDCE and VC concentrations by EPA method 502.1. The detection limit for this analysis
is 0.05 ug/L. All samples for carbon CSIA were packed on ice and shipped to the Stable
Isotope Laboratory at the University of Toronto, Canada, and analyzed within 1 month of
sampling. Detection limits for isotopic analysis varies from compound to compound but is
between 10 and 30 ug/L for TCE, cDCE and VC. One day prior to analysis, 2 of each 40
mL water samples were transferred to 160 mL glass bottles with 40 g of NaCl to facilitate
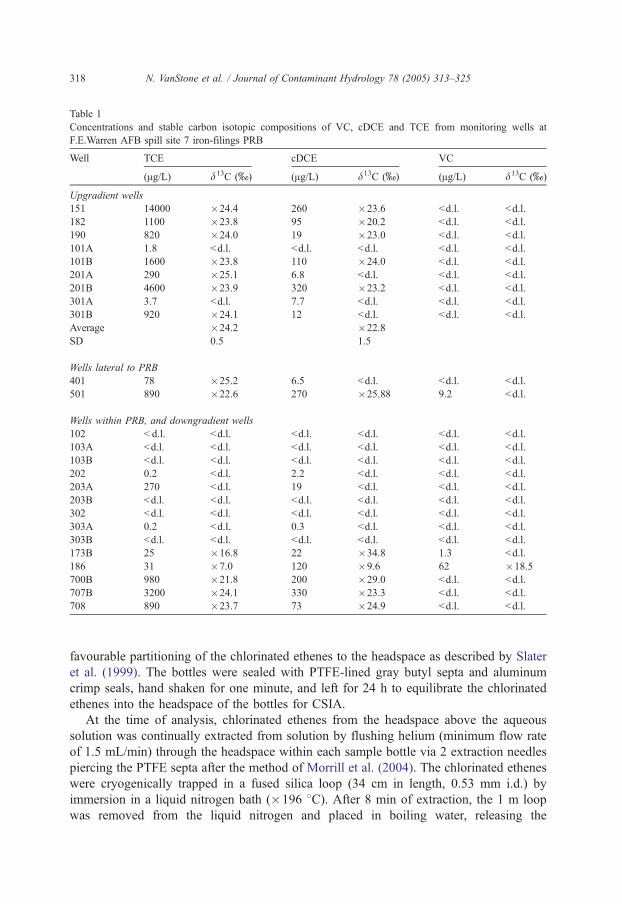
Table 1
Concentrations and stable carbon isotopic compositions of VC, cDCE and TCE from monitoring wells at
F.E.Warren AFB spill site 7 iron-filings PRB
Well TCE cDCE VC
(Ag/L) d13C (x) (Ag/L) d13C (x) (Ag/L) d13C (x)
Upgradient wells
151 14000 �24.4 260 �23.6 bd.l. bd.l.
182 1100 �23.8 95 �20.2 bd.l. bd.l.
190 820 �24.0 19 �23.0 bd.l. bd.l.
101A 1.8 bd.l. bd.l. bd.l. bd.l. bd.l.
101B 1600 �23.8 110 �24.0 bd.l. bd.l.
201A 290 �25.1 6.8 bd.l. bd.l. bd.l.
201B 4600 �23.9 320 �23.2 bd.l. bd.l.
301A 3.7 bd.l. 7.7 bd.l. bd.l. bd.l.
301B 920 �24.1 12 bd.l. bd.l. bd.l.
Average �24.2 �22.8
SD 0.5 1.5
Wells lateral to PRB
401 78 �25.2 6.5 bd.l. bd.l. bd.l.
501 890 �22.6 270 �25.88 9.2 bd.l.
Wells within PRB, and downgradient wells
102 b d.l. bd.l. bd.l. bd.l. bd.l. bd.l.
103A bd.l. bd.l. bd.l. bd.l. bd.l. bd.l.
103B bd.l. bd.l. bd.l. bd.l. bd.l. bd.l.
202 0.2 bd.l. 2.2 bd.l. bd.l. bd.l.
203A 270 bd.l. 19 bd.l. bd.l. bd.l.
203B bd.l. bd.l. bd.l. bd.l. bd.l. bd.l.
302 bd.l. bd.l. bd.l. bd.l. bd.l. bd.l.
303A 0.2 bd.l. 0.3 bd.l. bd.l. bd.l.
303B bd.l. bd.l. bd.l. bd.l. bd.l. bd.l.
173B 25 �16.8 22 �34.8 1.3 bd.l.
186 31 �7.0 120 �9.6 62 �18.5
700B 980 �21.8 200 �29.0 bd.l. bd.l.
707B 3200 �24.1 330 �23.3 bd.l. bd.l.
708 890 �23.7 73 �24.9 bd.l. bd.l.
N. VanStone et al. / Journal of Contaminant Hydrology 78 (2005) 313–325318
favourable partitioning of the chlorinated ethenes to the headspace as described by Slater
et al. (1999). The bottles were sealed with PTFE-lined gray butyl septa and aluminum
crimp seals, hand shaken for one minute, and left for 24 h to equilibrate the chlorinated
ethenes into the headspace of the bottles for CSIA.
At the time of analysis, chlorinated ethenes from the headspace above the aqueous
solution was continually extracted from solution by flushing helium (minimum flow rate
of 1.5 mL/min) through the headspace within each sample bottle via 2 extraction needles
piercing the PTFE septa after the method of Morrill et al. (2004). The chlorinated ethenes
were cryogenically trapped in a fused silica loop (34 cm in length, 0.53 mm i.d.) by
immersion in a liquid nitrogen bath (�196 8C). After 8 min of extraction, the 1 m loop
was removed from the liquid nitrogen and placed in boiling water, releasing the

N. VanStone et al. / Journal of Contaminant Hydrology 78 (2005) 313–325 319
chlorinated ethenes onto the GC column in a single pulse. A DB-624 capillary column (30
m�0.25 mm i.d., 1.4 um film thickness) was used to separate chlorinated ethenes with a
temperature program of 40 8C for 4 min followed by an increase to 90 8C at a rate of 15
8C/min and a final holding time of 7 min and a flow rate of 1.2 mL/min. Injection
temperature was 185 8C. Samples were prepared and analyzed in duplicate to ensure
reproducibility, which was always less than F0.4x. Total error associated with this
method is F0.5x, and incorporates both accuracy and reproducibility (Dempster et al.,
1997; Mancini et al., 2002; Morrill et al., 2004). Carbon isotopic compositions are
reported as d13C, where d13C=(Rs�Rst) /Rst�1000, and Rs and Rst are the ratios of13C
to 12C in the sample and a standard (calibrated to V-PDB), respectively (Clark and Fritz,
1997). d13C is reported in units of permil (x).
4. Results and discussion
Concentrations in upgradient wells (Table 1) range from 290 to 14000 Ag/L for TCE,
and 12 to 320 Ag/L for cDCE. cDCE may have been present in the initial TCE spill as a
trace co-contaminant. Alternatively, cDCE may be present as a product of TCE
degradation by reductive dechlorination. The carbon isotopic composition of TCE in
the upgradient wells is quite uniform, from �23.8x to �25.1x (mean: �24.2F0.5x,
n =7). Well 401, located several metres to the side of the PRB is also similar (�25.2x).
These values are slightly enriched in 13C compared to results obtained for TCE from
industrial sources. The d13C of free product TCE ranges from �31.9x to �25.8x(Beneteau et al., 1999; Shouakar-Stash et al., 2003; van Warmerdam et al., 1995). Physical
processes such as dissolution, dispersion, vaporization or adsorption are not known to
cause significant fractionation for chlorinated ethenes (Dempster et al., 1997; Harrington
et al., 1999; Slater et al., 1999, 2000). Hence, both these enriched d13C values, and the
presence of cDCE suggests TCE upgradient and away from the influence of the PRB may
already be somewhat degraded with respect to the source TCE. A second lateral well
(501), which is located several meters to the side of the PRB, in fact, shows significant
levels of VC (9.2 Ag/L). The occurrence of VC in well 501 may be due to local microbial
activity, as VC is a product of reductive dechlorination by certain microbial communities
(Wiedemeier et al., 1999). TCE from well 501 has a more enriched value of �22.6x with
respect to the mean upgradient value of �24.2x, which, combined with the occurrence of
VC in this well (a product of microbial degradation of TCE) provides further evidence of
some degree of microbial activity in the vicinity of this well, and potentially throughout
the site.
Downgradient of the PRB, a range of TCE concentrations are observed from 25 to 3200
Ag/L (Table 1). The concentrations of TCE measured in wells 700B (Fig. 2a), 707B (Fig.
2b) and 708 (Table 1) are not substantially lower than upgradient of the PRB. In addition,
the carbon isotopic compositions of TCE in wells 707B (�24.1x) and 708 (�23.7x) are
not significantly different than those measured upgradient of the PRB (upgradient mean is
�24.2x) (Table 1). It is clear from Fig. 2b, however, that this is not due to incomplete
degradation within the PRB, as TCE concentrations within the PRB (wells 202 and 203B)
and immediately downgradient are below detection limits. This same trend is true for

Fig. 2. Concentration of cDCE and TCE for Transects 1, 2 and 3 of SS7 PRB. For each transect of the PRB as
shown in Fig. 1, concentrations in Ag/L and isotopic compositions of cDCE and TCE (where applicable) at each
well are shown. Identity of well is indicated at top of horizontal axis. Total error is F5 % for concentration, and
F0.5x for d13C values, incorporating both accuracy and reproducibility after Mancini et al. (2002) and Gray et
al. (2002).
N. VanStone et al. / Journal of Contaminant Hydrology 78 (2005) 313–325320
cDCE, which also shows identical d13C values upgradient and downgradient of the PRB,
although concentrations drop to below detection limits within the PRB (Table 1, Fig. 2b).
There is considerable research ongoing into the persistence of CHCs downgradient of
PRBs, including the examination of phenomena such as slow desorption of CHCs from
aquifer sediments and incomplete flushing of aquifer materials due to aquifer

N. VanStone et al. / Journal of Contaminant Hydrology 78 (2005) 313–325 321
heterogeneities. Assuming that the TCE sorbed to aquifer materials downgradient is from
the same source as the upgradient material, they should have similar carbon isotopic
compositions (Fig. 2b) as partitioning does not show significant fractionation (i.e.
enrichment or depletion of 13C in contaminant pool) for TCE (Beneteau et al., 1999;
Dempster et al., 1997; Poulson and Drever, 1999; Slater et al., 1999, 2000). In contrast,
significant enrichment of 13C in residual TCE is observed during degradative reactions,
such as biologically mediated reductive dechlorination (Bloom et al., 2000; Hunkeler et
al., 1999; Sherwood Lollar et al., 1999; Slater et al., 2001), oxidation by permanganate
(Hunkeler et al., 2003; Poulson and Naraoka, 2002) or abiotic degradation of TCE by iron
(Bill et al., 2001; Dayan et al., 1999; Slater et al., 2002; VanStone et al., 2004). The
similarity between the carbon isotopic values of the downgradient TCE (�24.1x and
�23.7x for wells 707B and 708) and the mean upgradient value, therefore indicates that
the TCE observed in these downgradient wells has not undergone any degradative
processes compared to the TCE observed upgradient. The source of TCE observed in wells
707B and 708, therefore, is likely desorption from the downgradient aquifer material,
indicating that substantial amounts of TCE were present before the PRB was installed, and
it is continuing to desorb from the local materials. An alternative hypothesis for the source
of this TCE could be a hydraulic bypass of the contaminant plume beneath the PRB.
Monitoring wells placed below the PRB (101A, 103A, 201A, 203A, 301A and 303A in
Fig. 1), however, all show TCE and cDCE concentrations less than detection limits,
confirming that there is likely no hydraulic bypass of the PRB.
Downgradient wells 173, 186 and 700B show significantly different isotopic results
(Fig. 1, Table 1). In contrast to wells 707B and 708, TCE in well 700B has a d13C of
�21.8x, which is enriched in 13C with respect to the average upgradient value
(�24.2x), and to the TCE in the well directly upgradient within Transect 1 (well 101B,
Fig. 2a, �23.8x). This change in the d13C of the TCE, albeit small, is consistent with
typical fractionation associated with degradation whereby a preferential rate of degradation
of the 12C-bonds results in a preferential enrichment of the remaining parent contaminant
(in this case TCE) in 13C (Dayan et al., 1999; Bill et al., 2001; Slater et al., 2002; VanStone
et al., 2004). This is manifested as a less negative d13C value (�21.8x) versus its
presumed starting composition (mean upgradient d13C value of �24.2x). The d13C value
of cDCE in this well also supports this interpretation. When cDCE is produced as a
breakdown product of TCE, it will initially be more depleted in 13C (resulting in a more
negative d13C value) compared to the TCE, reflecting the preferential rate of reaction for12C-containing molecules and preferential incorporation of 12C into cDCE. The d13C value
of cDCE (�29.0x) observed in downgradient well 700B compared to the upgradient
wells indicates that, at least in part, cDCE is a product of TCE degradation. As observed
for TCE, concentrations of cDCE drop to below detection limits within the PRB and in the
well below it (well 101A) (Fig. 1a). Thus, it can be inferred that the contaminant plume is
not bypassing the PRB. As observed for wells 707B and 708, the TCE and cDCE observed
in well 700B are likely due to desorption from local downgradient aquifer materials.
Unlike in wells 707B and 708, however, there may be some microbial degradation
occurring in the localized region around this well to account for the enrichment of 13C
observed in the TCE compared to upgradient wells, and the depletion of 13C observed for
the cDCE relative to the d13C values of the TCE in the same well.

N. VanStone et al. / Journal of Contaminant Hydrology 78 (2005) 313–325322
Two other downgradient wells (wells 173B and 186) have significantly enriched d13C
values of TCE (�16.8x and �7.0x, respectively) compared to the upgradient wells,
consistent with much more extensive degradation of TCE at these wells. In addition, the
concentrations of TCE observed in these wells are the lowest in the downgradient plume
(25 to 31 Ag/L), and VC is detected in both wells (1.3 to 62 Ag/L). Both cDCE and VC are
typical products of the reductive dechlorination of TCE. The carbon isotopic compositions
of cDCE and VC provide evidence that they are indeed present due to the degradation of
TCE. The d13C value for cDCE in well 173B (�34.8x) is much more negative than that
of TCE (�16.8x), reflecting the preferential incorporation of 12C into the breakdown
product, cDCE. Similarly the d13C value of cDCE in well 186 is �9.6x, which is more
negative compared to the value of TCE in the same well (�7.0x). In addition, in well
186, VC has a d13C value of �18.5x, a value significantly more negative than both
cDCE and TCE in the same well, and again consistent with progressive incorporation of12C into the breakdown products. Furthermore, the cDCE and TCE in well 186 have
extremely enriched d13C values (�9.6x and �7.0, respectively) compared to the
upgradient mean (�24.2x). No process other than degradation is known to produce such
isotopically enriched values through preferential transfer of 12C to the breakdown products
and a corresponding enrichment of 13C in the remaining contaminant.
Based on d13C values alone, it is not possible to determine if the degradation is
microbially or abiotically mediated. However, microbiological analysis of a water sample
taken from well 186 showed a highly increased anaerobic microbial population in this well
compared to other areas in the vicinity of the PRB, suggesting that in situ anaerobic
microbial degradation may account for the CHC composition in this well (USAF, 2003).
Microbiological data are not available from wells 173B and 700B, however, the degree of13C fractionation in TCE and cDCE observed in these wells, combined with their
concentration trends across these PRB transects provide indirect evidence for local
microbiological dechlorination of previously existing contaminants desorbing from the
aquifer matrix, rather than incomplete degradation in the PRB. For example, the
concentration and carbon isotopic composition of TCE and cDCE for well 173B are
shown for Transect 3 in Fig. 2c. The decrease in concentrations of TCE and cDCE across
the PRB at this location indicates that complete degradation is occurring within the PRB.
Furthermore, the concentrations of TCE and cDCE below the PRB (well 301A) are below
detection limits. The carbon isotopic compositions of TCE (�16.8x) and cDCE
(�34.8x) in well 173B, however, indicate that some degradative process is acting on
the chlorinated ethenes downgradient of the PRB. A likely hypothesis is that localized
microbiological activity is degrading TCE and cDCE desorbing from the aquifer material.
5. Conclusions and implications for PRB technology
Carbon isotopic compositions of TCE in two of the wells downgradient of the PRB
(wells 707B and 708) indicate that the observed downgradient concentrations are likely
due to desorption of contaminant sorbed to the aquifer material prior to the PRB
installation. In contrast, the carbon isotopic results support the existence of microbially-
mediated reductive dechlorination of TCE in well 186. Furthermore, d13C values of TCE

N. VanStone et al. / Journal of Contaminant Hydrology 78 (2005) 313–325 323
and cDCE in downgradient wells 173B and 700B appear to indicate a local biological
dechlorination of contaminants desorbing from aquifer material, rather than incomplete
degradation in the PRB.
A complex series of processes control concentrations of pollutants at contaminated
field sites. Both abiotic and biotic degradation may reduce contaminant concentrations in
the dissolved phase, but in addition mass transfer processes such as transport by
advection and diffusion and mass partitioning via sorption and desorption play important
roles. Since PRBs are commonly installed within existing contaminant plumes, all of
these processes may play a role in controlling concentrations of contaminants
downgradient of the barrier. Specifically, at installations where downgradient concentra-
tions persist at higher than anticipated levels, the possibility of inadequate treatment
within the barrier, hydraulic bypass around or under the barrier, and desorption of
material from the downgradient aquifer material must typically be assessed. Measure-
ment of the distribution of concentrations alone can be ambiguous. Similarly, as this
study shows, stable isotope measurements alone are also no silver bullet. Nonetheless, it
is clear that integration of both concentration distributions and stable isotope data
provides a significant advantage in terms of constraining the role of processes of
contaminant transformation versus processes of mass transfer in the subsurface. The kind
of process level information stable isotope measurements can provide can be an
important advantage in distinguishing between the effects of fractionating degradative
processes and non-fractionating processes such as desorption. While this study illustrates
these principles at a site contaminated with chlorinated hydrocarbons, the conclusions
are directly applicable to other contamination problems as well, such as abiotic
degradation of carbon tetrachloride (Amonette et al., 2000; Matheson and Tratnyek,
1994; Pecher et al., 2002) which has recently been shown to also involve significant
carbon isotope fractionation (Elsner et al., 2004).
Acknowledgements
The authors gratefully acknowledge the assistance of Stephen Hart and Anna Radloff of
URS Corporation for providing samples and site information. Special thanks are due to the
anonymous reviewers of this manuscript and to Martin Elsner of the Stable Isotope
Laboratory at the University of Toronto for valuable comments. This work was supported
in part by the Natural Sciences and Engineering Research Council of Canada, EnviroMetal
Technologies Inc., and a CRESTech Industrial Cooperative Research Award to N.V.
References
Agrawal, A., Tratnyek, P.G., 1996. Reduction of nitro aromatic compounds by zero-valent iron metal. Environ.
Sci. Technol. 30 (1), 153–160.
Alowitz, M.J., Scherer, M.M., 2002. Kinetics of nitrate, nitrite, and Cr(VI) reduction by iron metal. Environ. Sci.
Technol. 36 (3), 299–306.
Amonette, J.E., Workman, D.J., Kennedy, D.W., Fruchter, J.S., Gorby, Y.A., 2000. Dechlorination of carbon
tetrachloride by Fe(II) associated with geothite. Environ. Sci. Technol. 34 (21), 4606–4613.

N. VanStone et al. / Journal of Contaminant Hydrology 78 (2005) 313–325324
Beneteau, K.M., Aravena, R., Frape, S.K., 1999. Isotopic characterization of chlorinated solvents — laboratory
and field results. Org. Geochem. 30, 739–753.
Bill, M., Schuth, C., Barth, J.A.C., Kalin, R.M., 2001. Carbon isotopic fractionation during abiotic reductive
dehalogenation of trichloroethylene (TCE). Chemosphere 44, 1281–1286.
Bloom, Y., Aravena, R., Hunkeler, D., Edwards, E.A., Frape, S.K., 2000. Carbon isotope fractionation during
microbial dechlorination of trichloroethene, cis-1,2-dichloroethene, and vinyl chloride: implications for
assessment of natural attenuation. Environ. Sci. Technol. 34 (13), 2768–2772.
Clark, I., Fritz, P., 1997. Environmental Isotopes in Hydrogeology. CRC Press, Boca Raton.
Dayan, H., Abrajano, T., Sturchio, N.C., Winsor, L., 1999. Carbon isotopic fractionation during reductive
dehalogenation of chlorinated ethenes by metallic iron. Org. Geochem. 30, 755–763.
Dempster, H.S., Sherwood Lollar, B., Feenstra, S., 1997. Tracing organic contaminants in groundwater: a new
methodology using compound-specific isotope analysis. Environ. Sci. Technol. 31, 3193–3197.
Elsner, M., Schwarzenbach, R.P., Kellerhals, T., Luzi, S., Zwank, L., Angst, W., Haderlein, S.B., 2004.
Mechanisms and products of surface-mediated reductive dehalogenation of carbon tetrachloride by Fe(II) on
goethite. Environ. Sci. Technol. 38 (7), 2058–2066.
Fry, A., 1971. Heavy atom isotope effects in organic reaction studies. In: Bowman, N.S. (Ed.), Isotope Effects in
Chemical Reactions. Van Nostrand Reinhold, New York.
Gillham, R.W., O’Hannesin, S.F., 1994. Enhanced degradation of halogenated aliphatics by zero-valent iron.
Ground Water 32 (6), 958–967.
Gray, J.R., Lacrampe-Couloume, G., Gandhi, D., Scow, K.M., Wilson, R.D., MacKay, D.M., Sherwood Lollar,
B., 2002. Carbon and hydrogen isotopic fractionation during biodegradation of methyl tert-butyl ether.
Environ. Sci. Technol. 36, 1931–1938.
Harrington, R.R., Poulson, S.R., Drever, J.I., Colberg, P.J.S., Kelly, E.F., 1999. Carbon isotope systematics of
monoaromatic hydrocarbons: vaporization and adsorption experiments. Org. Geochem. 30, 765–775.
Heneman, F.C., May, M.R., Powers, B.C., Perez, E.J., 2001. The End of a Trilogy: The F.E. Warren AFB Spill
Site 7 Iron-Filings Permeable Reactive Barrier is Working, National Defense Industrial Association 27th
Environmental Symposium and Exhibition Proceedings, Austin, TX.
Hozalski, R.M., Zhang, L., Arnold, W.A., 2001. Reduction of haloacetic acids by Fe0: implications for treatment
and fate. Environ. Sci. Technol. 35 (11), 2258–2263.
Hunkeler, D., Aravena, R., Butler, B.J., 1999. Monitoring microbial dechlorination of tetrachloroethene (PCE) in
groundwater using compound-specific stable carbon isotope ratios: microcosm and field studies. Environ. Sci.
Technol. 33 (16), 2733–2738.
Hunkeler, D., Aravena, R., Parker, B.L., Cherry, J.A., Diao, X., 2003. Monitoring oxidation of chlorinated
ethenes by permanganate in groundwater using stable isotopes: laboratory and field studies. Environ. Sci.
Technol. 37, 798–804.
Mancini, S.A., Lacrampe-Couloume, G., Jonker, H., van Breukelen, B.M., Groen, J., Volkering, F., Sherwood
Lollar, B., 2002. Hydrogen isotopic enrichment: an indicator of biodegradation at a petroleum hydrocarbon
contaminated field site. Environ. Sci. Technol. 36, 2464–2470.
Matheson, L.J., Tratnyek, P.G., 1994. Reductive dehalogenation of chlorinated methanes by iron metal. Environ.
Sci. Technol. 28 (12), 2045–2053.
Morrill, P., Lacrampe-Couloume, G., Sherwood Lollar, B., 2004. Dynamic headspace: a single-step extraction for
isotopic analysis of Ag/L concentrations of dissolved chlorinated ethenes. Rapid Commun. Mass Spectrom.
18, 595–600.
Nam, S., Tratnyek, P.G., 2000. Reduction of azo dyes with zero-valent iron. Water Res. 34 (6), 1837–1845.
O’Hannesin, S.F., 2003. 10 years of North American Experience in Granular Iron PRB Technology for VOC
Groundwater Remediation, ConSoil 2003 (8th International FZK/TNO Conference on Contaminated Soil),
Gent, Belgium, pp. 1568–1571.
O’Hannesin, S.F., Gillham, R.W., 1998. Long-term performance of an in situ biron wallQ for remediation of
VOCs. Ground Water 36 (1), 164–170.
Pecher, K., Haderlein, S.B., Schwarzenbach, R.P., 2002. Reduction of polyhalogenated methanes by surface-
bound Fe(II) in aqueous suspensions of iron oxides. Environ. Sci. Technol. 36, 1734–1741.
Poulson, S.R., Drever, J.I., 1999. Stable isotope (C, Cl, and H) fractionation during vaporization of
trichloroethylene. Environ. Sci. Technol. 33 (20), 3689–3694.
N. VanStone et al. / Journal of Contaminant Hydrology 78 (2005) 313–325 325
Poulson, S.R., Naraoka, H., 2002. Carbon isotope fractionation during permanganate oxidation of chlorinated
ethylenes (cDCE, TCE, PCE). Environ. Sci. Technol. 36, 3270–3274.
Powell, R.M., Blowes, D.W., Gillham, R.W., Schultz, D., Sivavec, T., Puls, R.W., Vogan, J.L., Landis, R., 1998.
Permeable reactive barrier technologies for contaminant remediation. United States Environmental Protection
Agency. EPA/600/R-98/125.
Scherer, M.M., Richter, S., Valentine, R.L., Alvarez, P.J.J., 2000. Chemistry and microbiology of reactive barriers
for in situ groundwater cleanup. Crit. Rev. Environ. Sci. Technol. 30 (3), 363–411.
Sherwood Lollar, B., Slater, G.F., Ahad, J.M.E., Sleep, B.E., Spivack, J., Brennan, M., MacKenzie, P., 1999.
Contrasting carbon isotope fractionation during biodegradation of trichloroethylene and toluene: implications
for intrinsic bioremediation. Org. Geochem. 30, 813–820.
Sherwood Lollar, B., Slater, G.F., Sleep, B.E., Witt, M., Klecka, G.M., Harkness, M., Spivack, J., 2001. Stable
carbon isotope evidence for intrinsic bioremediation of tetrachloroethene and trichloroethene at Area 6, Dover
Air Force Base. Environ. Sci. Technol. 35 (2), 261–269.
Shouakar-Stash, O., Frape, S.K., Drimmie, R.J., 2003. Stable hydrogen, carbon and chlorine isotope
measurements of selected chlorinated organic solvents. J. Contam. Hydrol. 60, 211–228.
Slater, G.F., Dempster, H.S., Sherwood Lollar, B., Ahad, J.M.E., 1999. Headspace analysis: a new application for
isotopic characterization of dissolved organic contaminants. Environ. Sci. Technol. 33, 190–194.
Slater, G.F., Ahad, J.M.E., Sherwood Lollar, B., Allen-King, R.M., Sleep, B.E., 2000. Carbon isotope effects
resulting from equilibrium sorption of dissolved VOCs. Anal. Chem. 72 (22), 5669–5672.
Slater, G.F., Sherwood Lollar, B., Sleep, B.E., Edwards, E.A., 2001. Variability in carbon isotopic fractionation
during biodegradation of chlorinated ethenes: implications for field applications. Environ. Sci. Technol. 35
(5), 901–907.
Slater, G.F., Sherwood Lollar, B., Allen King, R., O’Hannesin, S.F., 2002. Isotopic fractionation during
reductive dechlorination of trichloroethene by zero valent iron: influence of surface treatment. Chemosphere
49, 587–596.
Song, D.L., Conrad, M.E., Sorenson, K.S., Alvarez-Cohen, L., 2002. Stable carbon isotope fractionation during
enhanced in situ bioremediation of trichloroethene. Environ. Sci. Technol. 36, 2262–2268.
Tratnyek, P.G., 2002. Keeping up with all that literature: the ironrefs database turns 500. Ground Water Monit.
Remediat. 22 (3), 92–94.
USAF, 2003. Final Zone D Groundwater Remedial Investigation Report. F.E. Warren AFB, WY.
van Warmerdam, E.M., Frape, S.K., Aravena, R., Drimmie, R.J., Flatt, H., Cherry, J.A., 1995. Stable chlorine and
carbon isotope measurement of selected chlorinated organic solvents. Appl. Geochem. 10, 547–552.
VanStone, N.A., Focht, R.M., Mabury, S.A., Sherwood Lollar, B., 2004. Effect of iron type on kinetics and
carbon isotopic enrichment of chlorinated ethylenes during abiotic reduction on Fe(0). Ground Water 42 (2),
268–276.
Vieth, A., Muller, J., Strauch, G., Kastner, M., Gehre, M., Meckenstock, R.U., Richnow, H.H., 2003. In-situ
biodegradation of tetrachloroethene and trichloroethene in contaminated aquifers monitored by stable isotope
fractionation. Isot. Environ. Health Stud. 39 (2), 113–124.
Wiedemeier, T.H., Rifai, H., Newell, C.J., Wilson, J.T., 1999. Natural Attenuation of Fuels and Chlorinated
Solvents in the Subsurface. John Wiley & Sons, Inc., New York.