monitoring of agricultural drought using … · monitoring of agricultural drought using...
TRANSCRIPT
MONITORING OF AGRICULTURAL DROUGHT USING FORTNIGHTLY VARIATION
OF VEGETATION CONDITION INDEX (VCI) FOR THE STATE OF TAMIL NADU,
INDIA
N. Vaani1*, P.Porchelvan2
1 Centre for Disaster Mitigation and Management (CDMM), Vellore Institute of Technology (VIT), Vellore – 632014, Tamil Nadu, India - [email protected]
2 School of Civil and Chemical Engineering (SCALE), Vellore Institute of Technology (VIT),Vellore – 632014, Tamil Nadu, India - [email protected]
KEYWORDS: Agricultural drought monitoring, Vegetation condition index (VCI), Drought severity map, Geographic Information
Systems (GIS), Normalized differenced vegetation index (NDVI).
ABSTRACT:
India being an agrarian nation widely depends upon rainfall for its agricultural productivity. The failure of rainfall and hence
shortfall of productivity badly affects national economy. With an intricate nature of drought, the planning and management requires
rigid monitoring for better understanding. The occurrence of drought and its severity varies in a regional level. The process of
monitoring agricultural drought in a regional level requires long term analysis of vegetation. In this present work, the attempt has
been carried out to study and monitor the spatial and temporal variation of agricultural drought for the state of Tamilnadu, India
which is more prone to drought especially due to monsoon failure or change in monsoon. The long term Normalized differenced
vegetation index (NDVI) of Global Inventory Modelling and Mapping Studies (GIMMS) for the period of 20 years (1984-2003) was used to compute the most popular index called vegetation condition index (VCI) to identify the vegetation vigour. The
fortnightly variation of VCI during major crop growing period of Kharif season (June to September) was used to monitor the spatio-
temporal drought conditions of Tamil Nadu. The results proved that there is wide variation of drought intensity among the districts
within the state. The keen observation of fortnightly variation of long term agricultural drought helps finding the onset, period and
spatial extent of drought in various districts of the state. The districts which are most often prone to moderate to severe drought
conditions during the analysis period were recognized in order to develop various strategies to improve the agricultural productivity
in that region. The persistent drought in the state necessitates the government to take appropriate preventive measures to evade
drought in future. Based on the severity of the drought level observed from the agricultural drought intensity maps prepared using VCI, the action plans could be prioritized by identifying the high risk zones.
1. INTRODUCTION
Due to the effects of climate change, the precipitation losses
and agricultural drought are more common in recent years in
most parts of the world. In the developing country like India
where approximately 54.8% of people are dependent on
agriculture, the drought vulnerability is significantly
increased by extreme weather events, temperature rise and
lower rainfall. This abnormal dry weather consecutively
results in a wide range of negative physical impact and
socio-economic setback in the country. Those physical
impacts include ground water depletion , drying-up of ponds ,
rivers, lakes, wells and reservoirs, shortage of food grains
due to reduction in agricultural productivity. These impacts
also lead to socio economic issues in the country like rise of
international commodity values, mortgage or sale of
productive crop lands to promote real estate business ,
migration of population from villages to urban centres,
increase of insecurity in the minds of people which leads to
suicides, social offence, etc. In India, 3,228 farmers
committed suicide in 2015 which accounts to an average of 9
suicides/day. The failure of crops due to erratic monsoon
onset, duration and severity level is the prime reason for
farmers to go on debt and attempt suicide due to their
inability to repay the agricultural loan . As the severity of the
problem is found to be increasing every year in India, its an
urgent need of the hour to take necessary actions to monitor
the trend in severity level of drought and be prepared enough
to face the crisis situation.
The various types of drought ie., meteorological,
hydrological and agricultural drought are all related to each
other. When the actual precipitation is considerably less than
the normal level (meteorological drought), it leads to obvious
depletion of ground water and surface water levels
(hydrological drought) which in turn causes drying up of land
and severe crop stress (agricultural drought). The precise
spatial analysis of meteorological drought severity level
requires dense network of rain gauge stations. But the
availability of weather data is constricted in many regions
whereas spatio temporal analysis of agricultural drought can
efficiently be made with the advancement in the fields of
satellite remote sensing and Geographic Information Systems
(GIS).
One of the most popular vegetation indices, which is
commonly used by researchers across the world for
monitoring and assessing the agricultural drought is
Normalized differenced vegetation index (NDVI). As NDVI
is a good indicator of vegetation stress (Anyamba et
al.,2001), (Domenikiotis et al.,2004), (Dutta et al.,2013),
(Dutta et al.,2015), (Fensholt et al.,2012), ( Jain et al.,2010),
(Legess et al.,2014) and (Quiring et al., 2010) it is proved to
be efficient in all drought related studies. The radiation
principle in the calculation of NDVI uses two different
energy bands viz., Near-Infrared (NIR) and red region of
visible band(VIS). As the healthy and dense green
vegetation strongly reflects NIR radiation, it greatly absorbs
visible red radiation of the electromagnetic spectrum. In
The International Archives of the Photogrammetry, Remote Sensing and Spatial Information Sciences, Volume XLII-4/W9, 2018 International Conference on Geomatics and Geospatial Technology (GGT 2018), 3–5 September 2018, Kuala Lumpur, Malaysia
This contribution has been peer-reviewed. https://doi.org/10.5194/isprs-archives-XLII-4-W9-159-2018 | © Authors 2018. CC BY 4.0 License.
159
case of unhealthy poor vegetation, the above case is
upturned. This particular characteristics best suits to study
and analyse the status of vegetation growth in a region using
the following rule to estimate NDVI.
NDVI
(NIR
VIS)
(1)
(NIR
VIS)
The value of NDVI ranges between minimum of -1 and
maximum of +1. If the value goes below 0.1, it stands for
barren rock, sand, water clouds and snow but when values go
above 0.7. it signifies dense tropical rainforests ((Fensholt et
al.,2012). The current study is attempted to envisage the
efficiency of drought monitoring using NDVI based index
called vegetation condition index (VCI). The efficiency of
remote sensing derived VCI in assessing agricultural drought
were ascertained as the correlation analysis between VCI and
major rain fed crops showed correlation coefficient of 0.75.
(Dutta et al.,2015). The assessment of regional drought
impacts can be made effectively using VCI. The drought
areas are hence well delineated with certain threshold values
of NDVI and VCI. It was also proved that these delineation
matched well with rainfall anomalies observed from rainfall
maps (Liu et al, 1996). VCI also allows to assess the trend in
frequency of regional drought. (Liang et al., 2017)
Drought as a creeping phenomena, is hard to understand
among all the natural disasters. The drift of drought could not
be analysed properly using only the trend in recent years. It
also necessitates the long period of analysis to derive
conclusion about the changing pattern of agricultural
drought. So, the long term analysis of VCI was adopted to
monitor the agricultural drought in the state of Tamil Nadu,
India . The VCI based fortnightly variation of agricultural
drought severity maps were prepared to identify the drought
risk zones. The state government authorities may find it
useful for understanding the drought risk areas and thereby
prioritize their actions while extenuating for the drought
period.
2. STUDY AREA
The present area of study is Tamil Nadu state which is
located in south eastern part of Indian peninsula and is shown
in Figure 1. The geographical extent of the state lies between
08°00' N to and 13°30' N Latitudes and between 76°15' E and
80°18' E Longitudes. The total area of Tamil Nadu extends to
1,30,058 km2 and it stands as the eleventh largest state in
India. The adjacent states of Tamilnadu include Andhra
Pradesh and Karnataka in North and Kerala on the West. East
of the state is bounded by Bay of Bengal and south of the
state is covered by Indian Ocean. The eastern side of state is
also surrounded by a union territory called Pondicherry.
Tamilnadu is the state in India where rain fed agriculture is
the predominant occupation. The state is bestowed with two
important monsoons which contribute rainfall to the state.
They are: (1) Southwest monsoon during June to September
and (2) Northeast monsoon during October to January. When
all other states of India receive more rainfall during
southwest monsoon, Tamil Nadu receives more rainfall only
during northeast monsoon. The annual rainfall of the state
was found to be 911.6 mm. Northeast monsoon contributes
47 percentage of total annual rainfall whereas southwest
monsoon contributes 35 percentage of total rainfall (Indira et
al.,2013). As more than 80 percentage of the state depends on
rainfall for their seasonal crop production, it is more prone to
agricultural drought whenever monsoon fails. There are
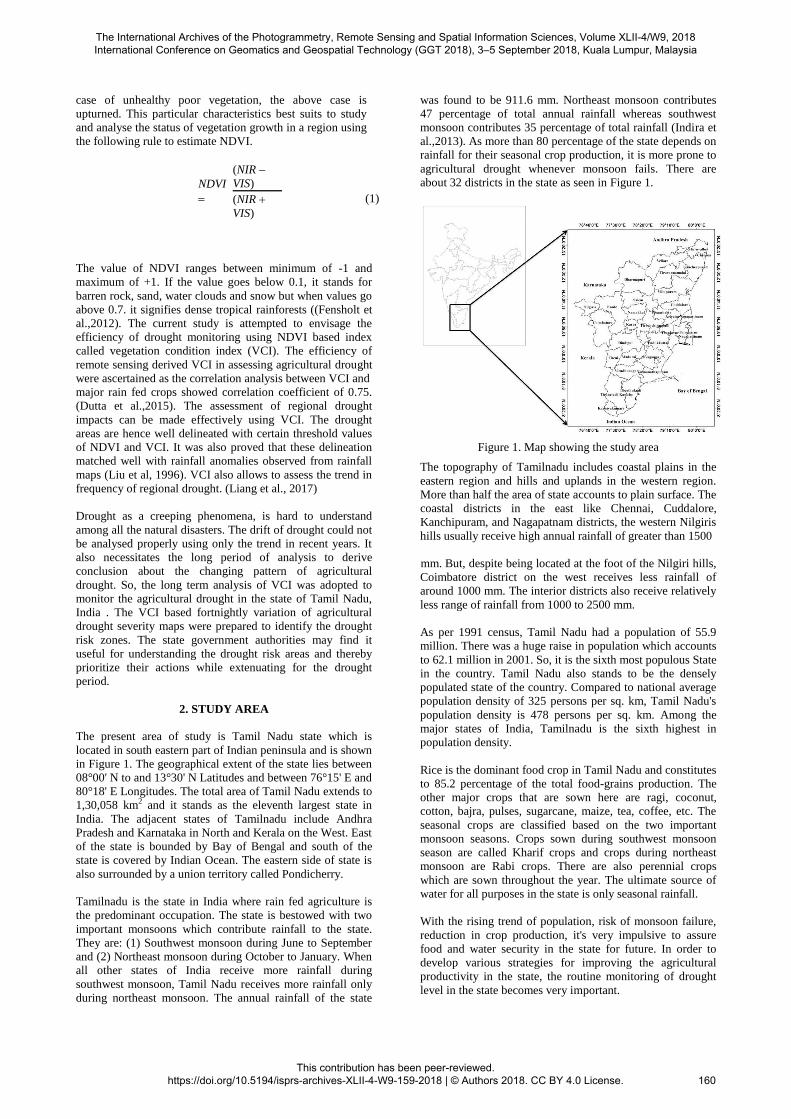
about 32 districts in the state as seen in Figure 1.
Figure 1. Map showing the study area
The topography of Tamilnadu includes coastal plains in the
eastern region and hills and uplands in the western region.
More than half the area of state accounts to plain surface. The
coastal districts in the east like Chennai, Cuddalore,
Kanchipuram, and Nagapatnam districts, the western Nilgiris
hills usually receive high annual rainfall of greater than 1500
mm. But, despite being located at the foot of the Nilgiri hills,
Coimbatore district on the west receives less rainfall of
around 1000 mm. The interior districts also receive relatively
less range of rainfall from 1000 to 2500 mm.
As per 1991 census, Tamil Nadu had a population of 55.9
million. There was a huge raise in population which accounts
to 62.1 million in 2001. So, it is the sixth most populous State
in the country. Tamil Nadu also stands to be the densely
populated state of the country. Compared to national average
population density of 325 persons per sq. km, Tamil Nadu's
population density is 478 persons per sq. km. Among the
major states of India, Tamilnadu is the sixth highest in
population density.
Rice is the dominant food crop in Tamil Nadu and constitutes
to 85.2 percentage of the total food-grains production. The
other major crops that are sown here are ragi, coconut,
cotton, bajra, pulses, sugarcane, maize, tea, coffee, etc. The
seasonal crops are classified based on the two important
monsoon seasons. Crops sown during southwest monsoon
season are called Kharif crops and crops during northeast
monsoon are Rabi crops. There are also perennial crops
which are sown throughout the year. The ultimate source of
water for all purposes in the state is only seasonal rainfall.
With the rising trend of population, risk of monsoon failure,
reduction in crop production, it's very impulsive to assure
food and water security in the state for future. In order to
develop various strategies for improving the agricultural
productivity in the state, the routine monitoring of drought
level in the state becomes very important.
The International Archives of the Photogrammetry, Remote Sensing and Spatial Information Sciences, Volume XLII-4/W9, 2018 International Conference on Geomatics and Geospatial Technology (GGT 2018), 3–5 September 2018, Kuala Lumpur, Malaysia
This contribution has been peer-reviewed. https://doi.org/10.5194/isprs-archives-XLII-4-W9-159-2018 | © Authors 2018. CC BY 4.0 License.
160
3. MATERIALS AND METHODOLOGY
The derived composites of NDVI from Advanced Very High
Resolution Radiometer (AVHRR) for every fortnight
released by Global Inventory Modeling and Mapping Studies
(GIMMS) (Fensholt et al.,2012) has been used in this study
to calculate the VCI for a period of 20 years from 1984 to
2003. The GIMMS NDVI data are originally available at a
spatial resolution of 8 km with the values of raw data range
between –10000 to 10000. Since the major crop growing
period for the state of Tamil Nadu is from June to September,
the data for those months has been considered in the present
study. In every year, there are eight NDVI datasets for four
months (June-September) as two fortnight datasets per month
(15 day composites). They were used for VCI calculation.
First, to get NDVI values in the range of -1 to +1, a scale
factor of 0.0001 was applied to the raw NDVI data i.e., the
raw NDVI values were multiplied by 0.0001 to obtain the
desired range of NDVI values from -1 to +1. The raw data
was in Albers Equal Area Projection. So, it has been
converted to Universal Transverse Mercator (UTM)
projection. Tamil Nadu state and district boundary maps
prepared using Survey of India topographic maps were then
overlaid. As the original GIMMS NDVI data covers the entire world, the clip option in ArcGIS 10.2 software was
used to clip NDVI within the state of Tamil Nadu. As NDVI
values fall below 0.1 represent areas other than vegetation,
they were then removed. The raster calculator in ArcGIS 10.2
enables the computation of VCI from NDVI using the
following formula.
VCI (NDVIi NDVImin ) 100 (2)
(NDVI
NDVI )
max min
In the above equation 2, NDVIi indicates the NDVI of a
given pixel in the raster image of one fortnight (eg. NDVI image of first fortnight of July, i.e., July 1-15 image of 1984).
Whereas NDVImin and NDVImax indicates the minimum and maximum values of NDVI for the same pixel calculated based on all raster images of the same fortnight from 1984 to
2003. The obtained VCI values range from 0 to 100. Those
obtained raster images of VCI were then classified based on
the drought severity classification proposed by (Kogan et al.,1995) as shown below in Table 1.
S. VCI Drought No category 1 ≥ 50 Normal 2 ≥ 35 but Moderate
< 50
3 < 35 Severe
Table 1 VCI classification for agricultural drought
Monitoring
This particular method of finding the impact of meteorological drought on vegetation cover was found to be the best for monitoring or assessment of onset and progress of drought due to some of the criterions like the availability of free of charge data and its simplicity, more literature and minimum requirement of input data.
4. RESULTS AND DISCUSSION The VCI based agricultural drought intensity maps from 1984 to
2003 are shown in Figure 2, 3, 4, 5, 6, 7, 8 and 9 for June 1st
fortnight, June 2nd fortnight, July 1
st fortnight, July 2
nd
fortnight, August 1st fortnight, August 2nd fortnight,
September 1st fortnight and September 2nd fortnight, respectively.
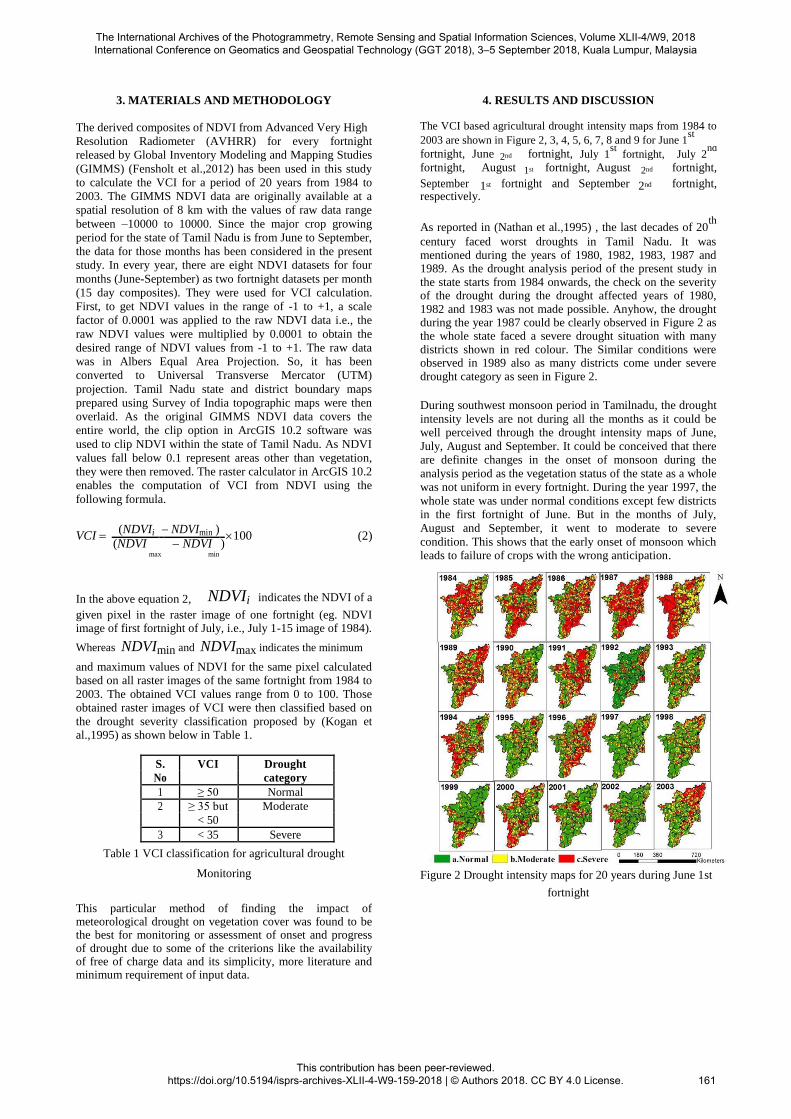
As reported in (Nathan et al.,1995) , the last decades of 20th
century faced worst droughts in Tamil Nadu. It was mentioned during the years of 1980, 1982, 1983, 1987 and 1989. As the drought analysis period of the present study in the state starts from 1984 onwards, the check on the severity of the drought during the drought affected years of 1980,
1982 and 1983 was not made possible. Anyhow, the drought during the year 1987 could be clearly observed in Figure 2 as the whole state faced a severe drought situation with many districts shown in red colour. The Similar conditions were observed in 1989 also as many districts come under severe drought category as seen in Figure 2.
During southwest monsoon period in Tamilnadu, the drought
intensity levels are not during all the months as it could be well perceived through the drought intensity maps of June,
July, August and September. It could be conceived that there are definite changes in the onset of monsoon during the
analysis period as the vegetation status of the state as a whole was not uniform in every fortnight. During the year 1997, the
whole state was under normal conditions except few districts in the first fortnight of June. But in the months of July,
August and September, it went to moderate to severe
condition. This shows that the early onset of monsoon which leads to failure of crops with the wrong anticipation.
Figure 2 Drought intensity maps for 20 years during June 1st
fortnight
The International Archives of the Photogrammetry, Remote Sensing and Spatial Information Sciences, Volume XLII-4/W9, 2018 International Conference on Geomatics and Geospatial Technology (GGT 2018), 3–5 September 2018, Kuala Lumpur, Malaysia
This contribution has been peer-reviewed. https://doi.org/10.5194/isprs-archives-XLII-4-W9-159-2018 | © Authors 2018. CC BY 4.0 License.
161
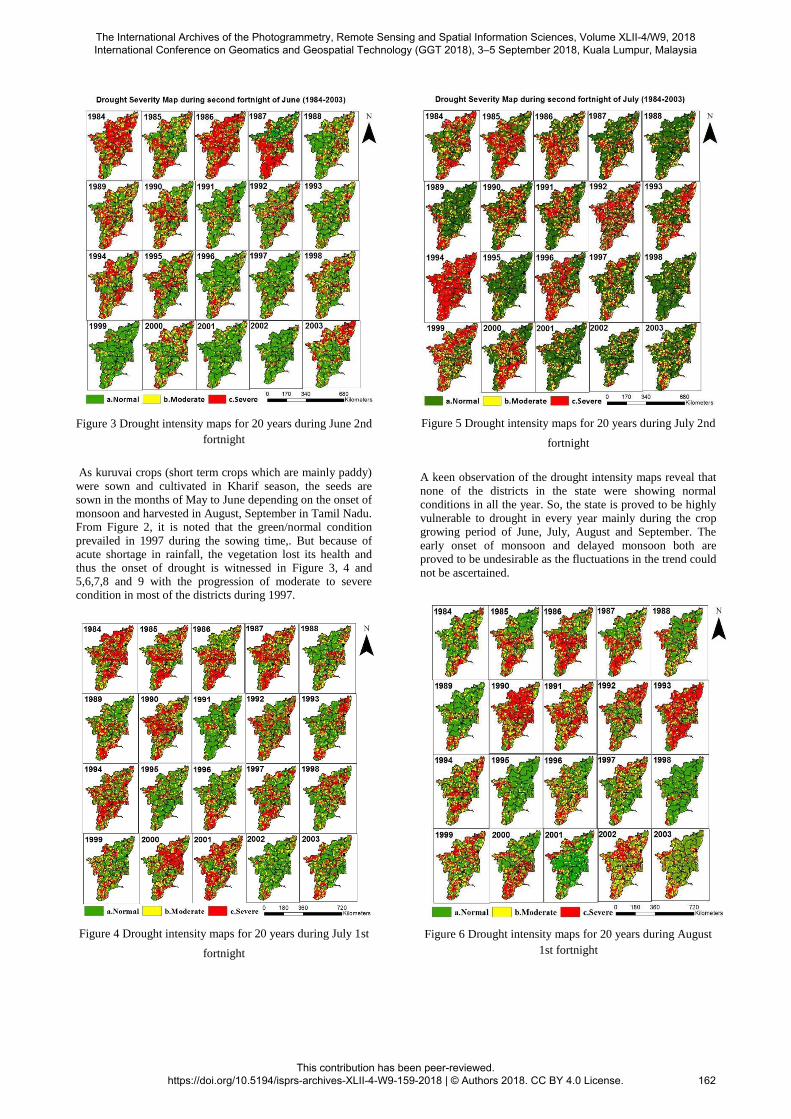
Figure 3 Drought intensity maps for 20 years during June 2nd
fortnight
As kuruvai crops (short term crops which are mainly paddy)
were sown and cultivated in Kharif season, the seeds are sown in the months of May to June depending on the onset of
monsoon and harvested in August, September in Tamil Nadu. From Figure 2, it is noted that the green/normal condition
prevailed in 1997 during the sowing time,. But because of acute shortage in rainfall, the vegetation lost its health and thus the onset of drought is witnessed in Figure 3, 4 and 5,6,7,8 and 9 with the progression of moderate to severe condition in most of the districts during 1997.
Figure 4 Drought intensity maps for 20 years during July 1st
fortnight
Figure 5 Drought intensity maps for 20 years during July 2nd
fortnight
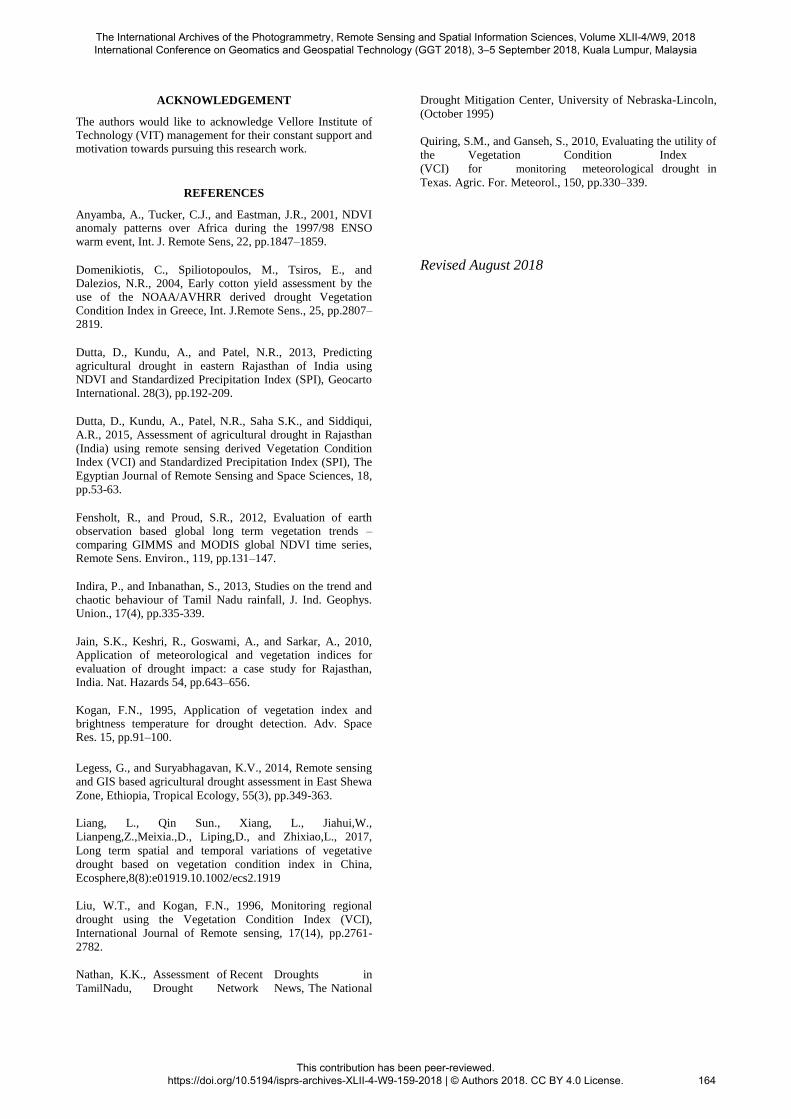
A keen observation of the drought intensity maps reveal that
none of the districts in the state were showing normal conditions in all the year. So, the state is proved to be highly
vulnerable to drought in every year mainly during the crop growing period of June, July, August and September. The
early onset of monsoon and delayed monsoon both are proved to be undesirable as the fluctuations in the trend could
not be ascertained.
Figure 6 Drought intensity maps for 20 years during August
1st fortnight
The International Archives of the Photogrammetry, Remote Sensing and Spatial Information Sciences, Volume XLII-4/W9, 2018 International Conference on Geomatics and Geospatial Technology (GGT 2018), 3–5 September 2018, Kuala Lumpur, Malaysia
This contribution has been peer-reviewed. https://doi.org/10.5194/isprs-archives-XLII-4-W9-159-2018 | © Authors 2018. CC BY 4.0 License.
162
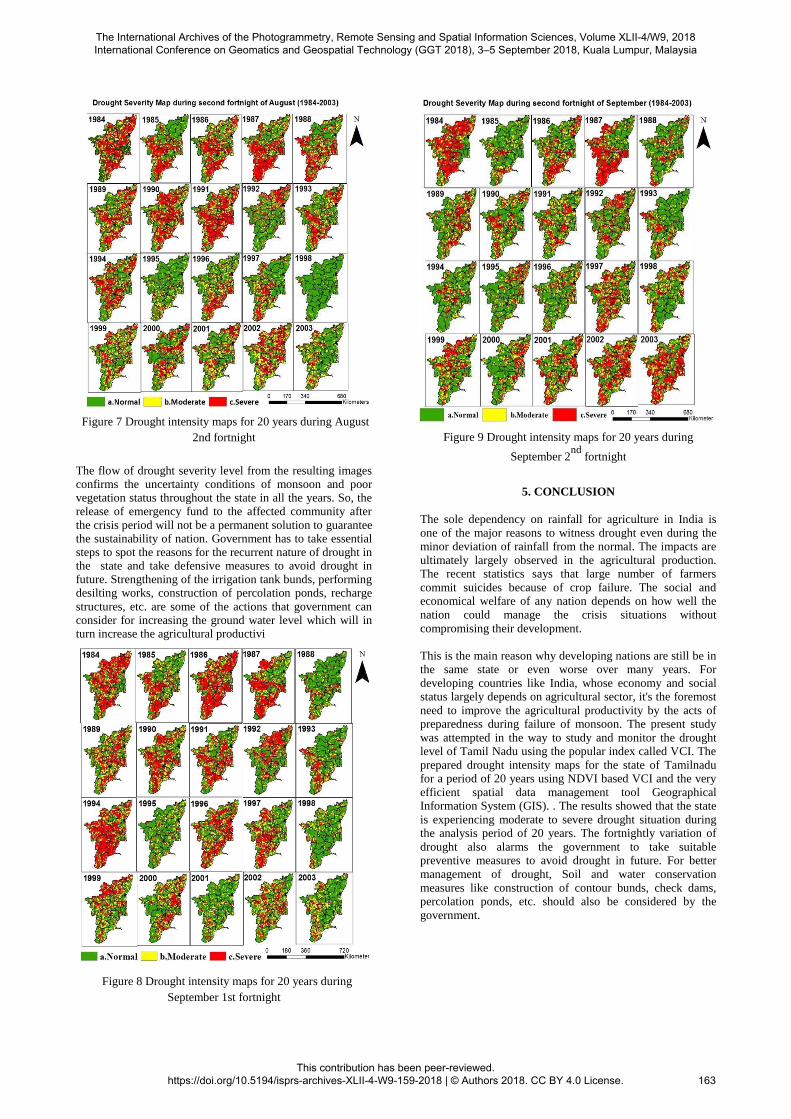
Figure 7 Drought intensity maps for 20 years during August
2nd fortnight
The flow of drought severity level from the resulting images confirms the uncertainty conditions of monsoon and poor vegetation status throughout the state in all the years. So, the release of emergency fund to the affected community after
the crisis period will not be a permanent solution to guarantee the sustainability of nation. Government has to take essential steps to spot the reasons for the recurrent nature of drought in the state and take defensive measures to avoid drought in future. Strengthening of the irrigation tank bunds, performing desilting works, construction of percolation ponds, recharge
structures, etc. are some of the actions that government can consider for increasing the ground water level which will in turn increase the agricultural productivi
Figure 8 Drought intensity maps for 20 years during
September 1st fortnight
Figure 9 Drought intensity maps for 20 years during
September 2nd
fortnight
5. CONCLUSION
The sole dependency on rainfall for agriculture in India is
one of the major reasons to witness drought even during the minor deviation of rainfall from the normal. The impacts are
ultimately largely observed in the agricultural production. The recent statistics says that large number of farmers
commit suicides because of crop failure. The social and economical welfare of any nation depends on how well the
nation could manage the crisis situations without
compromising their development.
This is the main reason why developing nations are still be in the same state or even worse over many years. For
developing countries like India, whose economy and social status largely depends on agricultural sector, it's the foremost
need to improve the agricultural productivity by the acts of preparedness during failure of monsoon. The present study
was attempted in the way to study and monitor the drought level of Tamil Nadu using the popular index called VCI. The
prepared drought intensity maps for the state of Tamilnadu for a period of 20 years using NDVI based VCI and the very
efficient spatial data management tool Geographical Information System (GIS). . The results showed that the state
is experiencing moderate to severe drought situation during the analysis period of 20 years. The fortnightly variation of
drought also alarms the government to take suitable preventive measures to avoid drought in future. For better
management of drought, Soil and water conservation
measures like construction of contour bunds, check dams, percolation ponds, etc. should also be considered by the
government.
The International Archives of the Photogrammetry, Remote Sensing and Spatial Information Sciences, Volume XLII-4/W9, 2018 International Conference on Geomatics and Geospatial Technology (GGT 2018), 3–5 September 2018, Kuala Lumpur, Malaysia
This contribution has been peer-reviewed. https://doi.org/10.5194/isprs-archives-XLII-4-W9-159-2018 | © Authors 2018. CC BY 4.0 License.
163
ACKNOWLEDGEMENT The authors would like to acknowledge Vellore Institute of Technology (VIT) management for their constant support and motivation towards pursuing this research work.
REFERENCES
Anyamba, A., Tucker, C.J., and Eastman, J.R., 2001, NDVI anomaly patterns over Africa during the 1997/98 ENSO warm event, Int. J. Remote Sens, 22, pp.1847–1859. Domenikiotis, C., Spiliotopoulos, M., Tsiros, E., and Dalezios, N.R., 2004, Early cotton yield assessment by the use of the NOAA/AVHRR derived drought Vegetation
Condition Index in Greece, Int. J.Remote Sens., 25, pp.2807– 2819. Dutta, D., Kundu, A., and Patel, N.R., 2013, Predicting agricultural drought in eastern Rajasthan of India using NDVI and Standardized Precipitation Index (SPI), Geocarto International. 28(3), pp.192-209. Dutta, D., Kundu, A., Patel, N.R., Saha S.K., and Siddiqui, A.R., 2015, Assessment of agricultural drought in Rajasthan
(India) using remote sensing derived Vegetation Condition Index (VCI) and Standardized Precipitation Index (SPI), The
Egyptian Journal of Remote Sensing and Space Sciences, 18,
pp.53-63. Fensholt, R., and Proud, S.R., 2012, Evaluation of earth observation based global long term vegetation trends – comparing GIMMS and MODIS global NDVI time series, Remote Sens. Environ., 119, pp.131–147. Indira, P., and Inbanathan, S., 2013, Studies on the trend and chaotic behaviour of Tamil Nadu rainfall, J. Ind. Geophys. Union., 17(4), pp.335-339. Jain, S.K., Keshri, R., Goswami, A., and Sarkar, A., 2010, Application of meteorological and vegetation indices for
evaluation of drought impact: a case study for Rajasthan, India. Nat. Hazards 54, pp.643–656. Kogan, F.N., 1995, Application of vegetation index and brightness temperature for drought detection. Adv. Space Res. 15, pp.91–100.
Legess, G., and Suryabhagavan, K.V., 2014, Remote sensing
and GIS based agricultural drought assessment in East Shewa
Zone, Ethiopia, Tropical Ecology, 55(3), pp.349-363.
Liang, L., Qin Sun., Xiang, L., Jiahui,W.,
Lianpeng,Z.,Meixia.,D., Liping,D., and Zhixiao,L., 2017,
Long term spatial and temporal variations of vegetative
drought based on vegetation condition index in China,
Ecosphere,8(8):e01919.10.1002/ecs2.1919
Liu, W.T., and Kogan, F.N., 1996, Monitoring regional
drought using the Vegetation Condition Index (VCI),
International Journal of Remote sensing, 17(14), pp.2761-
2782. Nathan, K.K., Assessment of Recent Droughts in TamilNadu, Drought Network News, The National
Drought Mitigation Center, University of Nebraska-Lincoln,
(October 1995) Quiring, S.M., and Ganseh, S., 2010, Evaluating the utility of
the Vegetation Condition Index
(VCI) for monitoring meteorological drought in
Texas. Agric. For. Meteorol., 150, pp.330–339.
Revised August 2018
The International Archives of the Photogrammetry, Remote Sensing and Spatial Information Sciences, Volume XLII-4/W9, 2018 International Conference on Geomatics and Geospatial Technology (GGT 2018), 3–5 September 2018, Kuala Lumpur, Malaysia
This contribution has been peer-reviewed. https://doi.org/10.5194/isprs-archives-XLII-4-W9-159-2018 | © Authors 2018. CC BY 4.0 License.
164