mobile benchmark study - userzoominfo.userzoom.com/rs/userzoom/images/mobile commerce...
TRANSCRIPT
Measuring the User Experience of Fashion Web Stores on Tablet Devices
www.userzoom.com
MOBILE BENCHMARK STUDY
THE UX INSIGHTS COMPANY
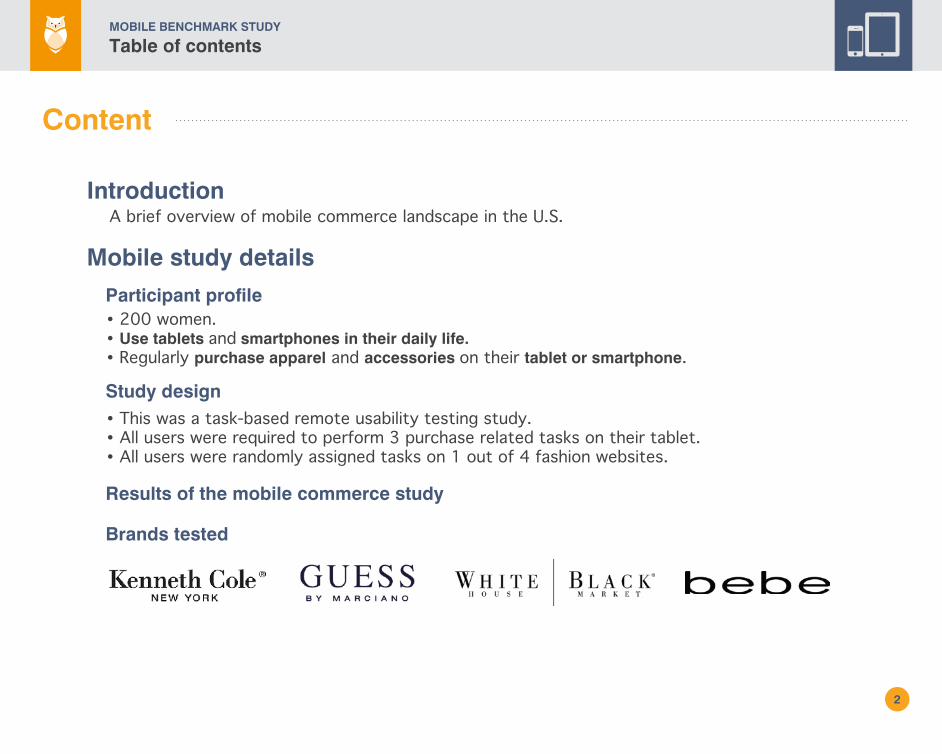
Brands tested
Introduction
Mobile study details
A brief overview of mobile commerce landscape in the U.S.
• 200 women.• Use tablets and smartphones in their daily life.• Regularly purchase apparel and accessories on their tablet or smartphone.
Study design
Results of the mobile commerce study
Participant profile
• This was a task-based remote usability testing study.• All users were required to perform 3 purchase related tasks on their tablet.• All users were randomly assigned tasks on 1 out of 4 fashion websites.
2
Table of contentsMOBILE BENCHMARK STUDY
Content
3
MOBILE BENCHMARK STUDY
Mobile commerce landscape in the U.S.
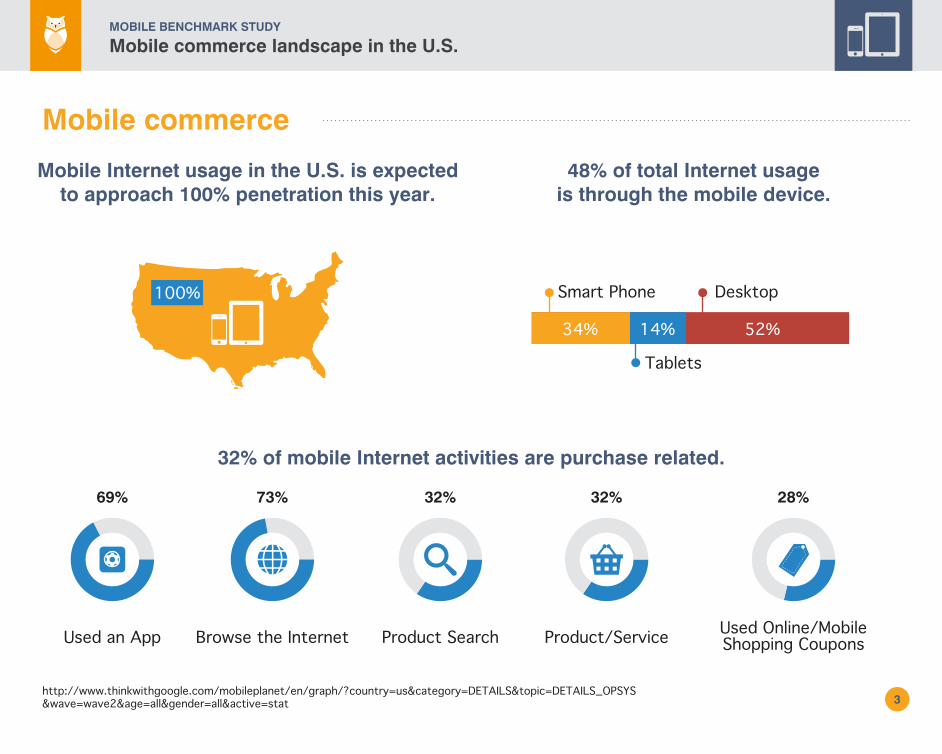
Mobile commerce
Mobile Internet usage in the U.S. is expectedto approach 100% penetration this year.
http://www.thinkwithgoogle.com/mobileplanet/en/graph/?country=us&category=DETAILS&topic=DETAILS_OPSYS&wave=wave2&age=all&gender=all&active=stat
48% of total Internet usageis through the mobile device.
32% of mobile Internet activities are purchase related.
Used an App Browse the Internet Product Search Product/Service Used Online/MobileShopping Coupons
69% 73% 32% 32% 28%
34% 14% 52%
Smart Phone Desktop
Tablets
100%
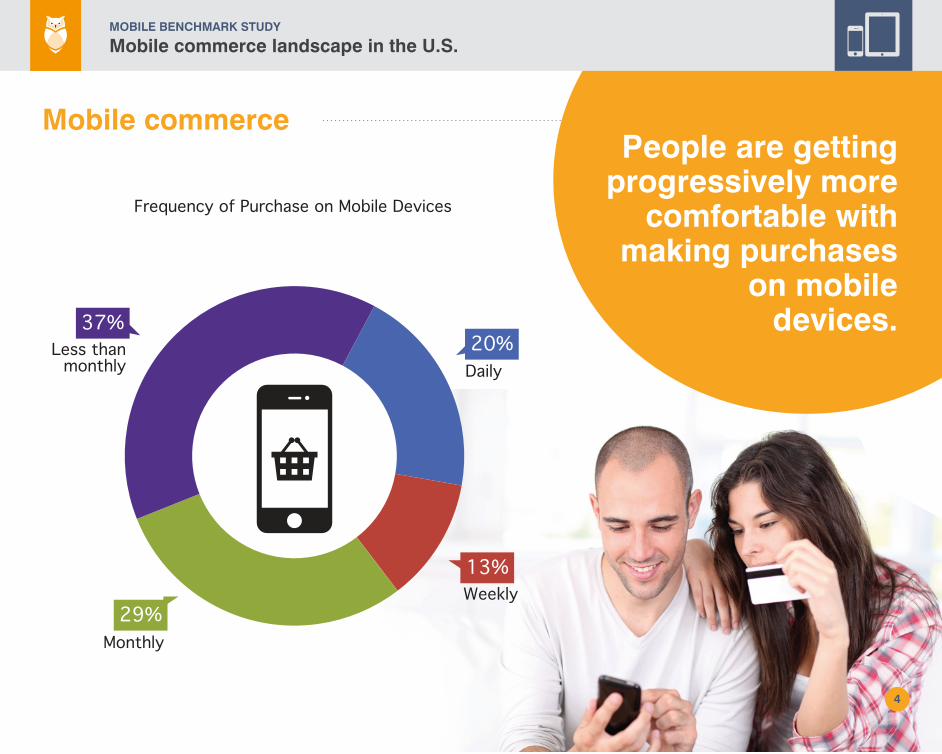
Mobile commerce
Mobile commerce landscape in the U.S.MOBILE BENCHMARK STUDY
People are gettingprogressively more
comfortable withmaking purchases
on mobiledevices.
Frequency of Purchase on Mobile Devices
Weekly13%
Monthly
Daily20%Less than
monthly
37%
29%
4
Mobile commerce landscape in the U.S.MOBILE BENCHMARK STUDY
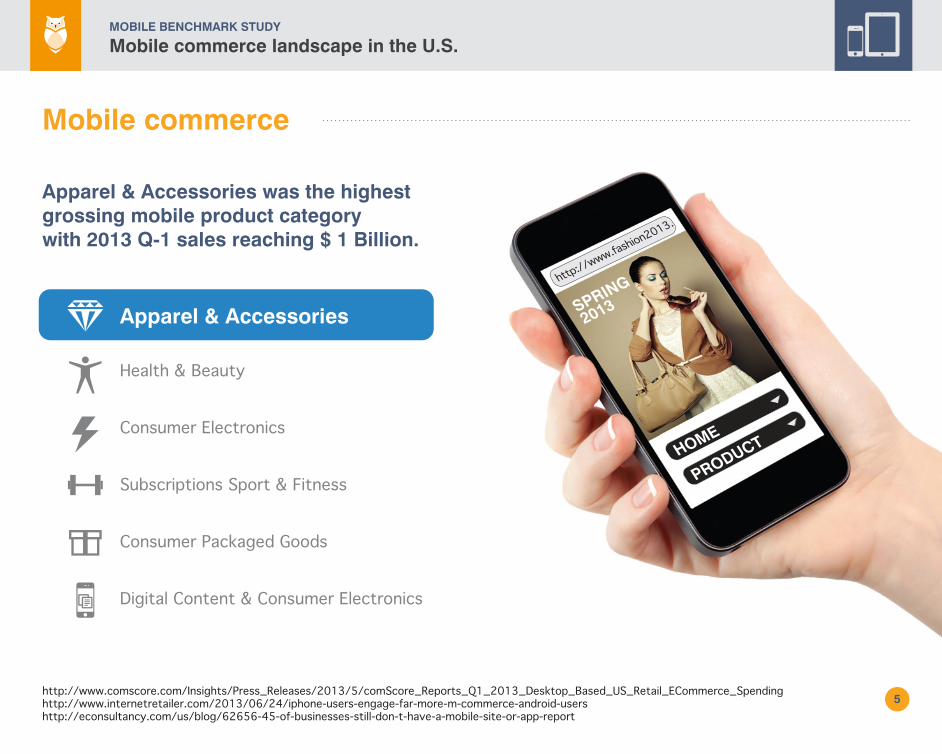
Apparel & Accessories was the highestgrossing mobile product categorywith 2013 Q-1 sales reaching $ 1 Billion.
http://www.comscore.com/Insights/Press_Releases/2013/5/comScore_Reports_Q1_2013_Desktop_Based_US_Retail_ECommerce_Spendinghttp://www.internetretailer.com/2013/06/24/iphone-users-engage-far-more-m-commerce-android-usershttp://econsultancy.com/us/blog/62656-45-of-businesses-still-don-t-have-a-mobile-site-or-app-report
Health & Beauty
Consumer Packaged Goods
Apparel & Accessories
Subscriptions Sport & Fitness
Consumer Electronics
Digital Content & Consumer Electronics
5
SPRING
2013
HOME
PRODUCT
http://www.fash
ion2013.com
Mobile commerce
6
Mobile commerce landscape in the U.S.MOBILE BENCHMARK STUDY
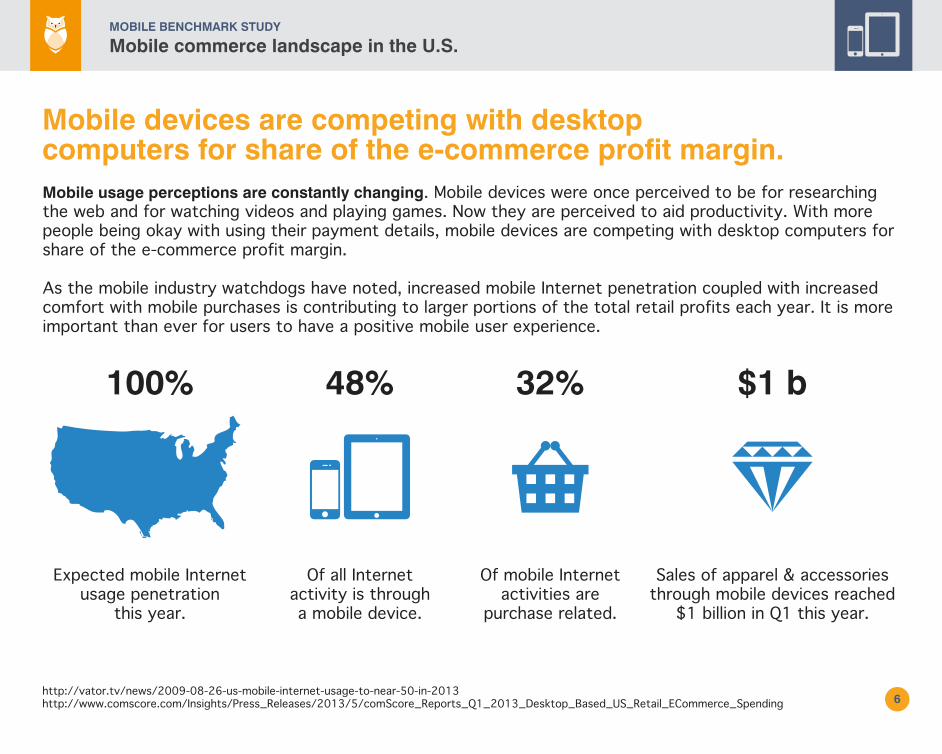
Mobile usage perceptions are constantly changing. Mobile devices were once perceived to be for researching the web and for watching videos and playing games. Now they are perceived to aid productivity. With more people being okay with using their payment details, mobile devices are competing with desktop computers for share of the e-commerce profit margin.
As the mobile industry watchdogs have noted, increased mobile Internet penetration coupled with increased comfort with mobile purchases is contributing to larger portions of the total retail profits each year. It is more important than ever for users to have a positive mobile user experience.
Of mobile Internetactivities are
purchase related.
Sales of apparel & accessoriesthrough mobile devices reached
$1 billion in Q1 this year.
Of all Internetactivity is througha mobile device.
Expected mobile Internetusage penetration
this year.
32%48%100% $1 b
http://vator.tv/news/2009-08-26-us-mobile-internet-usage-to-near-50-in-2013http://www.comscore.com/Insights/Press_Releases/2013/5/comScore_Reports_Q1_2013_Desktop_Based_US_Retail_ECommerce_Spending
Mobile devices are competing with desktopcomputers for share of the e-commerce profit margin.

How do users expectmobile websites to perform?Users expect mobile sites to perform as well as the desktop ones. 61% of users said that poor performance will make them less likely to visit a mobile site again.
Sadly, increased customer comfort with mobile purchases has not affected how mobile websites perform. Most sites do not support users in completing their transactions, with most sites having a success rate of just 61%.
http://www.nngroup.com/articles/mobile-usability-update/
40% failure rate implieslost user base that is unlikelyto re-visit your mobile site!
7
8
Mobile commerce landscape in the U.S.MOBILE BENCHMARK STUDY
http://www.gomez.com/mobile-readiness-instant-test/http://www.nngroup.com/articles/mobile-usability-update/
38-75%
58%
59%
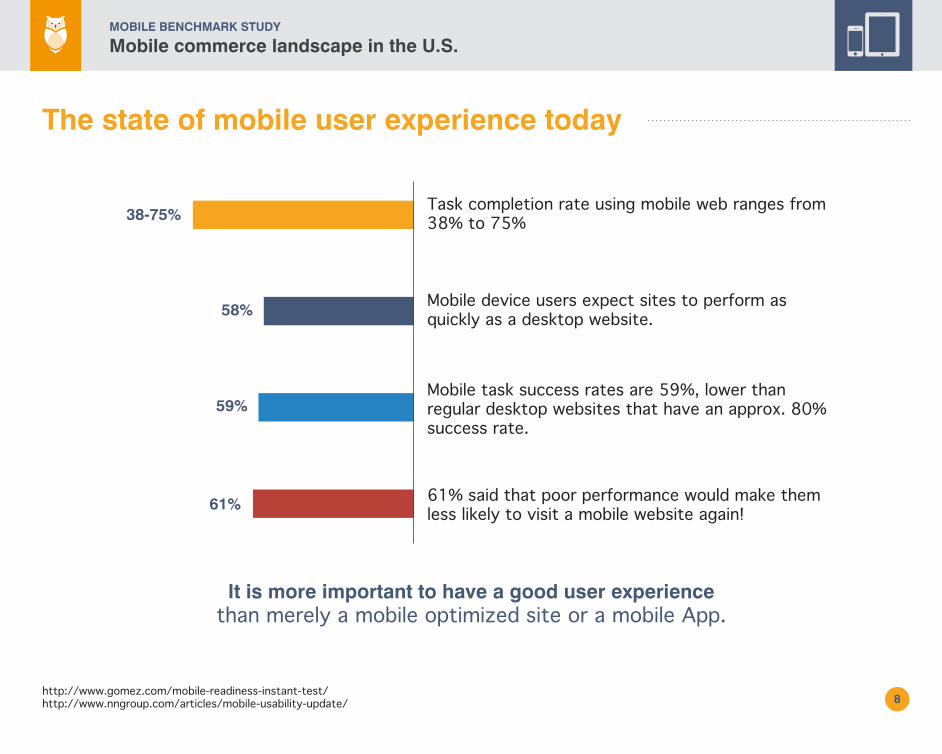
Task completion rate using mobile web ranges from 38% to 75%
Mobile device users expect sites to perform as quickly as a desktop website.
Mobile task success rates are 59%, lower than regular desktop websites that have an approx. 80% success rate.
61% said that poor performance would make them less likely to visit a mobile website again!
It is more important to have a good user experiencethan merely a mobile optimized site or a mobile App.
61%
The state of mobile user experience today
Tablets are the next device to take off
9
Mobile commerce landscape in the U.S.MOBILE BENCHMARK STUDY
10
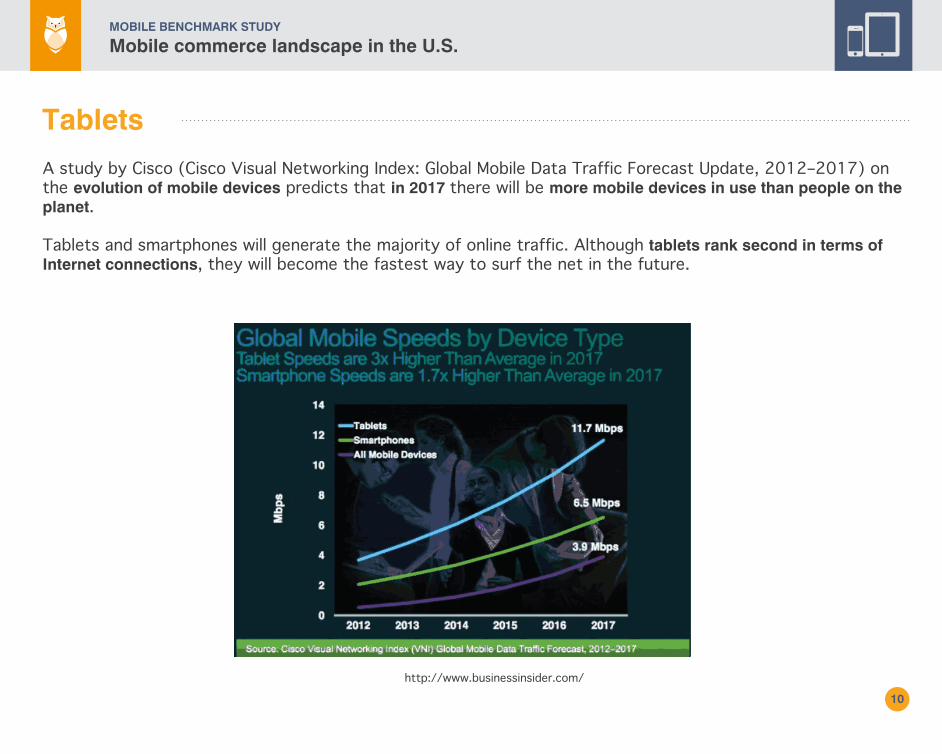
Tablets
A study by Cisco (Cisco Visual Networking Index: Global Mobile Data Traffic Forecast Update, 2012–2017) on the evolution of mobile devices predicts that in 2017 there will be more mobile devices in use than people on the planet.
Tablets and smartphones will generate the majority of online traffic. Although tablets rank second in terms of Internet connections, they will become the fastest way to surf the net in the future.
http://www.businessinsider.com/
Mobile commerce landscape in the U.S.MOBILE BENCHMARK STUDY
11
The key to success
Most retailers are still not taking advantage of the shopping potential offeredby mobile devices andtablets...
Mobile devices are part of an overall user experience. It is not a matter of creating a different experience for each device. The ideal solution would be to create a single experience - a brand experience - that adapts to the device in use.
Most retailers are still not taking advantage of the shopping potential offered by mobile devices and tablets. Either they are unfamiliar with the role of mobile devices in the shopping process, or they have not optimized their e-commerce sites to create the best and the most efficient shopping experience. This often translates into a frustrating experience for their customers. There is a great deal of opportunity for improvement.
The key to successlies in optimizing all the
functionalities of these devices and integrating them into multi-channel shopping experiences in order to
increase sales.
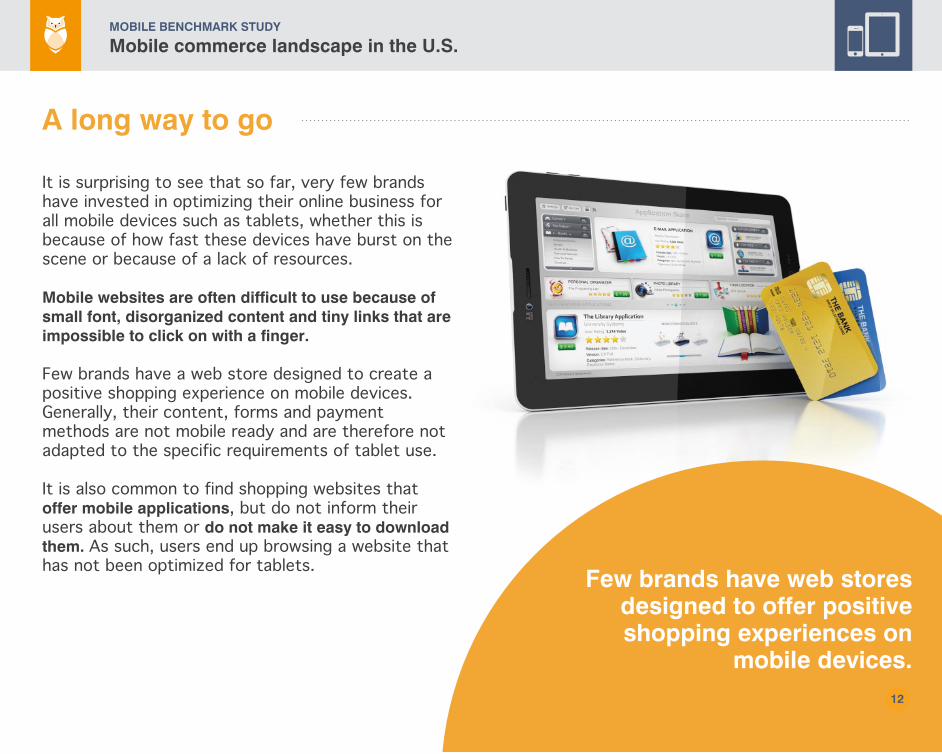
Few brands have web storesdesigned to offer positiveshopping experiences on
mobile devices.
Mobile commerce landscape in the U.S.MOBILE BENCHMARK STUDY
12
A long way to go
It is surprising to see that so far, very few brands have invested in optimizing their online business for all mobile devices such as tablets, whether this is because of how fast these devices have burst on the scene or because of a lack of resources.
Mobile websites are often difficult to use because of small font, disorganized content and tiny links that are impossible to click on with a finger.
Few brands have a web store designed to create a positive shopping experience on mobile devices. Generally, their content, forms and payment methods are not mobile ready and are therefore not adapted to the specific requirements of tablet use.
It is also common to find shopping websites that offer mobile applications, but do not inform their users about them or do not make it easy to download them. As such, users end up browsing a website that has not been optimized for tablets.
13
UserZoom’s researchers selected the most profitable purchase category, Apparel & Accessories, for a competitive benchmark study. The motivation behind this study was to evaluate the state of mobile usability and to highlight the lessons and takeaways.
How can weimprove mobileuser experience?We need to ensure that mobilewebsites meet users expectationsby conducting user research ona regular basis.
Mobile benchmark study (tablets)
Fashion Web Stores
14

15
Study Design
*This report is based on the evaluation made at the time of analysis.
16
Study designMOBILE BENCHMARK STUDY (TABLETS)
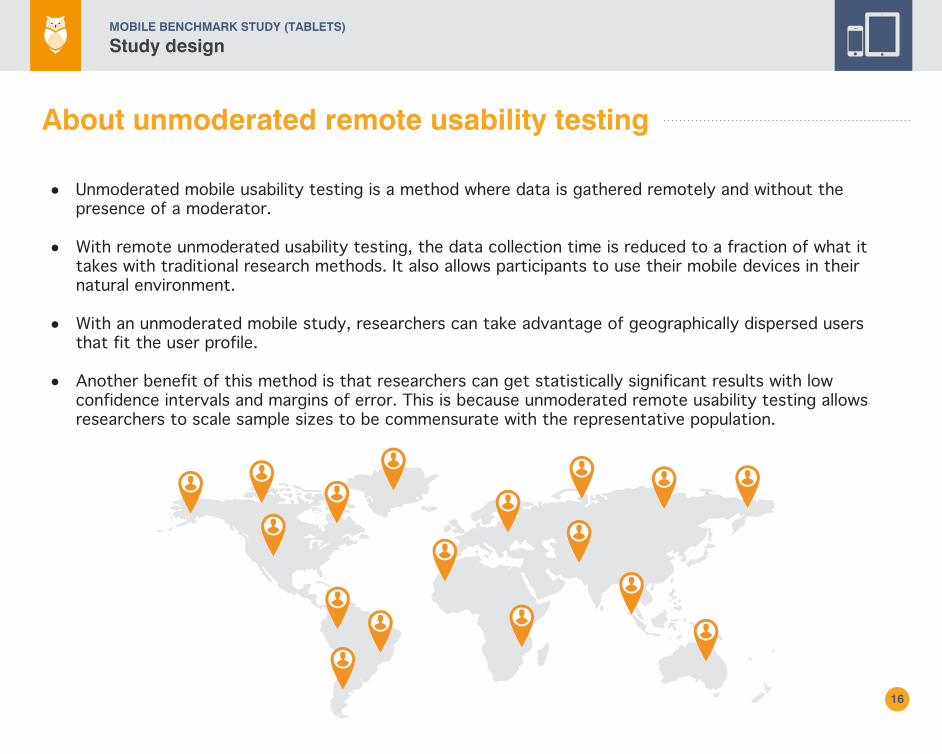
About unmoderated remote usability testing
Unmoderated mobile usability testing is a method where data is gathered remotely and without the presence of a moderator.
With remote unmoderated usability testing, the data collection time is reduced to a fraction of what it takes with traditional research methods. It also allows participants to use their mobile devices in their natural environment.
With an unmoderated mobile study, researchers can take advantage of geographically dispersed users that fit the user profile.
Another benefit of this method is that researchers can get statistically significant results with low confidence intervals and margins of error. This is because unmoderated remote usability testing allows researchers to scale sample sizes to be commensurate with the representative population.
•
•
•
•
17
Study designMOBILE BENCHMARK STUDY
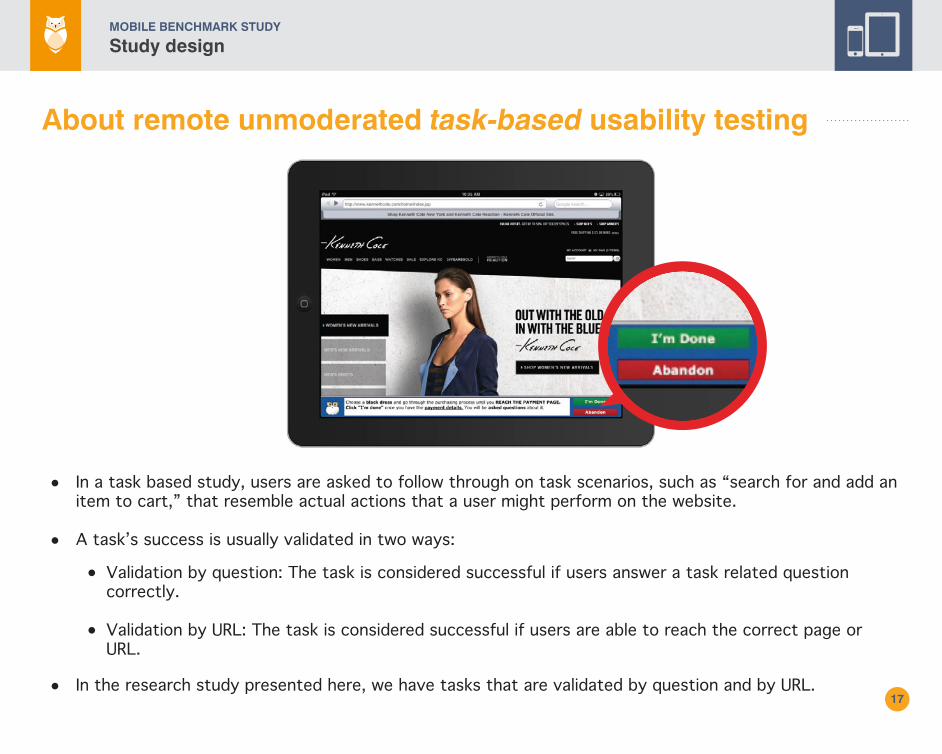
About remote unmoderated task-based usability testing
In a task based study, users are asked to follow through on task scenarios, such as “search for and add an item to cart,” that resemble actual actions that a user might perform on the website.
A task’s success is usually validated in two ways:
Validation by question: The task is considered successful if users answer a task related question correctly.
Validation by URL: The task is considered successful if users are able to reach the correct page or URL.
•
•
•
•
In the research study presented here, we have tasks that are validated by question and by URL. •
In the research study presented here, we have tasks that are validated by question and by URL. 18
Study designMOBILE BENCHMARK STUDY (TABLETS)
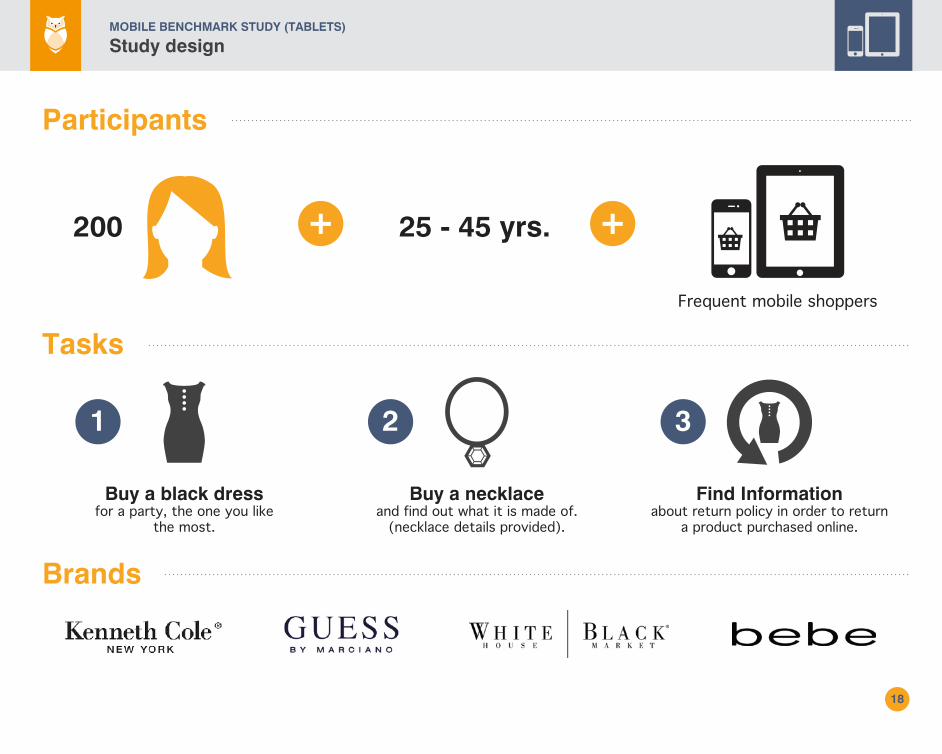
Participants
Tasks
Brands
Frequent mobile shoppers
1
Buy a black dressfor a party, the one you like
the most.
2
+ +
Buy a necklaceand find out what it is made of.
(necklace details provided).
3
Find Informationabout return policy in order to return
a product purchased online.
200 25 - 45 yrs.
How does UserZoom’s mobile solution work?
19
Study designMOBILE BENCHMARK STUDY (TABLETS)
Executive summary
20
Study designMOBILE BENCHMARK STUDY (TABLETS)
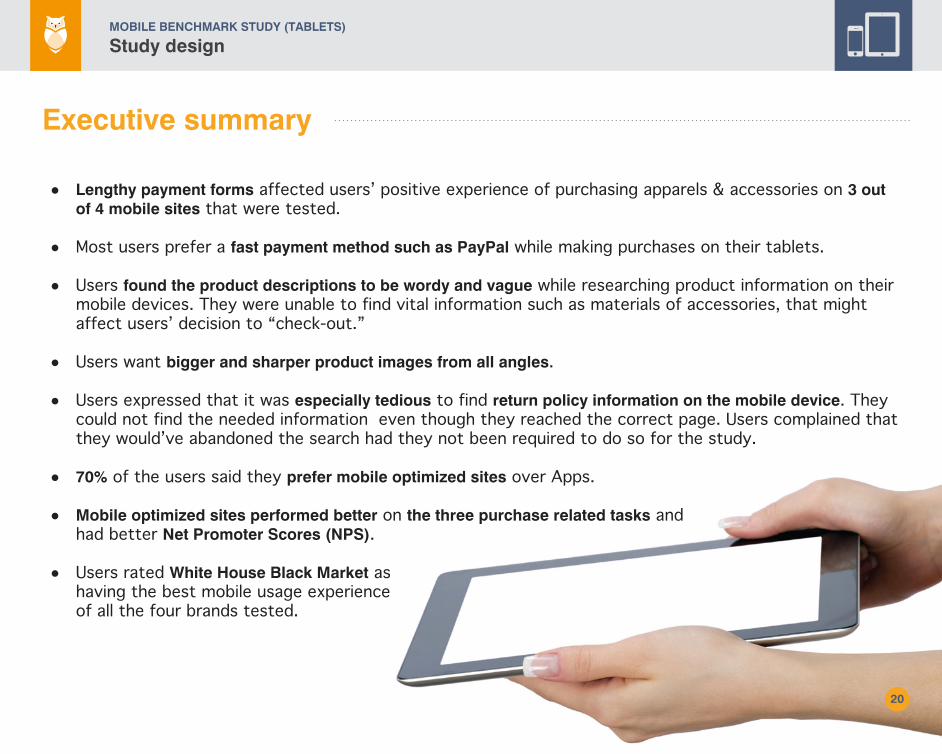
Lengthy payment forms affected users’ positive experience of purchasing apparels & accessories on 3 out of 4 mobile sites that were tested.
Most users prefer a fast payment method such as PayPal while making purchases on their tablets.
Users found the product descriptions to be wordy and vague while researching product information on their mobile devices. They were unable to find vital information such as materials of accessories, that might affect users’ decision to “check-out.”
Users want bigger and sharper product images from all angles.
Users expressed that it was especially tedious to find return policy information on the mobile device. They could not find the needed information even though they reached the correct page. Users complained that they would’ve abandoned the search had they not been required to do so for the study.
70% of the users said they prefer mobile optimized sites over Apps.
Mobile optimized sites performed better on the three purchase related tasks andhad better Net Promoter Scores (NPS).
Users rated White House Black Market ashaving the best mobile usage experienceof all the four brands tested.
•
•
•
•
•
•
•
•
21
Study Results
22
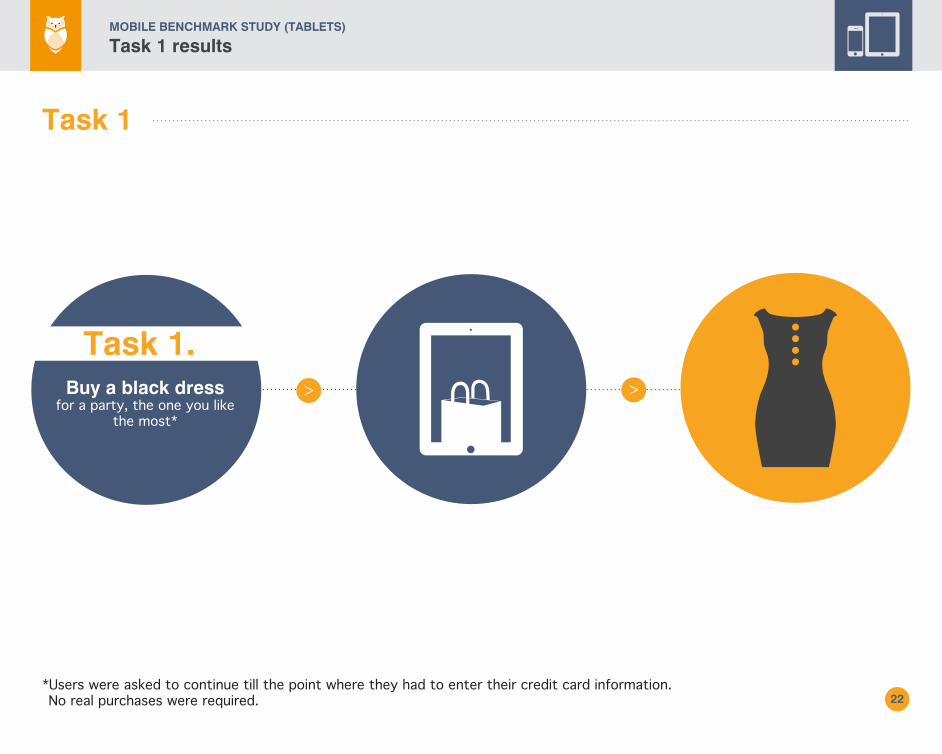
Task 1
Task 1.Buy a black dress
for a party, the one you likethe most*
*Users were asked to continue till the point where they had to enter their credit card information. No real purchases were required.
Task 1 resultsMOBILE BENCHMARK STUDY (TABLETS)
23
Findings
Users struggled to find product information related to purchasing a black dress. The best performing brands were White House Black Market and Kenneth Cole.
Users care about finishing the process quickly and putting in as little information as possible.
Task 1 resultsMOBILE BENCHMARK STUDY (TABLETS)
24
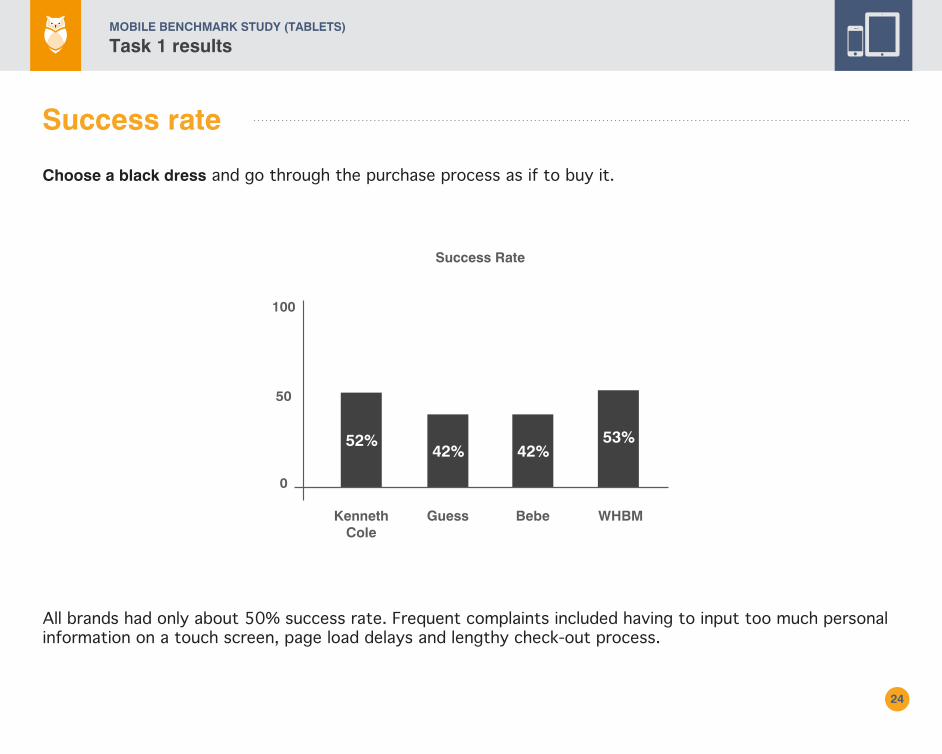
Success rate
Choose a black dress and go through the purchase process as if to buy it.
All brands had only about 50% success rate. Frequent complaints included having to input too much personal information on a touch screen, page load delays and lengthy check-out process.
WHBM
53%
Bebe
42%
Guess
42%
Kenneth Cole
52%
100
50
0
Success Rate
Task 1 resultsMOBILE BENCHMARK STUDY (TABLETS)
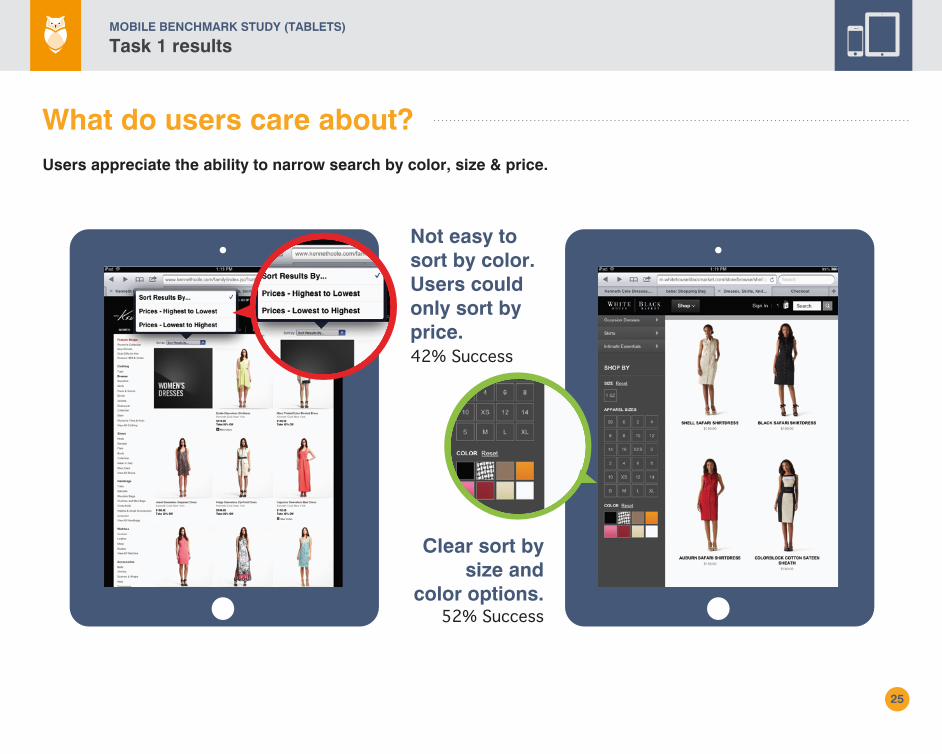
42% Success
Not easy to sort by color. Users could only sort by price.
52% Success
Clear sort by size and
color options.
25
What do users care about?Users appreciate the ability to narrow search by color, size & price.
Task 1 resultsMOBILE BENCHMARK STUDY (TABLETS)
26
Task 1 resultsMOBILE BENCHMARK STUDY (TABLETS)
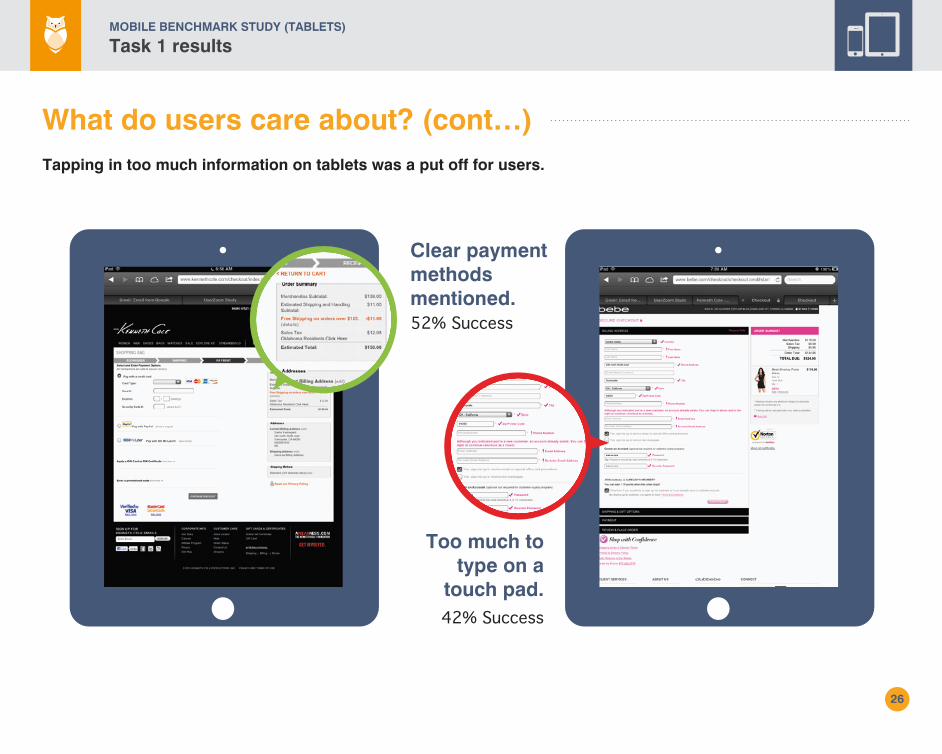
Tapping in too much information on tablets was a put off for users.
52% Success
Clear payment methods mentioned.
42% Success
Too much to type on a
touch pad.
What do users care about? (cont…)
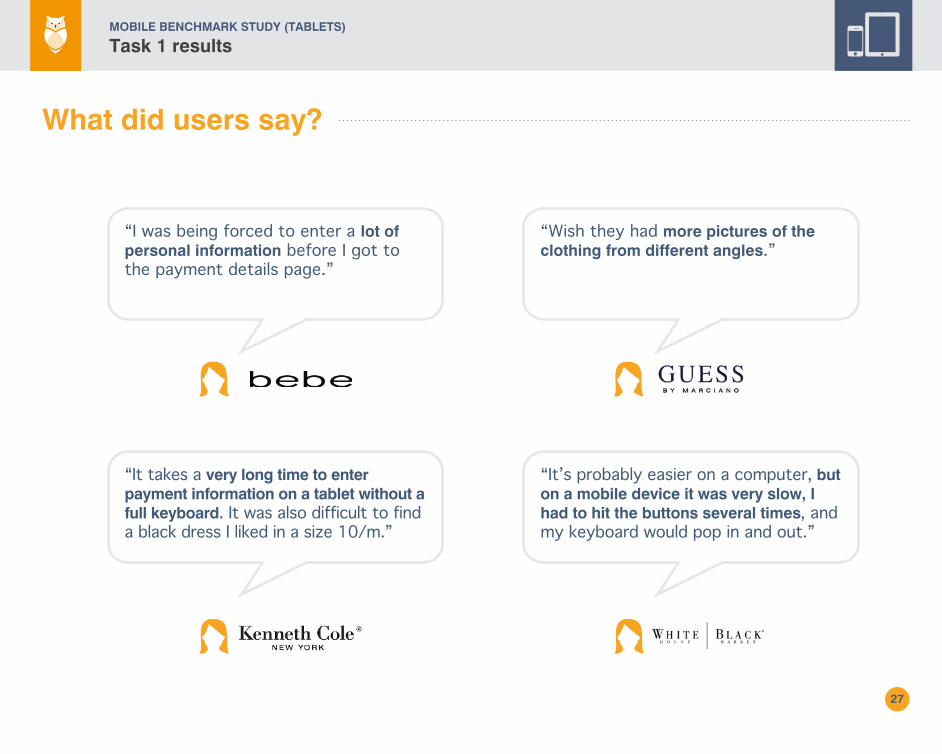
What did users say?
27
“I was being forced to enter a lot of personal information before I got to the payment details page.”
“Wish they had more pictures of the clothing from different angles.”
“It takes a very long time to enter payment information on a tablet without a full keyboard. It was also difficult to find a black dress I liked in a size 10/m.”
“It’s probably easier on a computer, but on a mobile device it was very slow, I had to hit the buttons several times, and my keyboard would pop in and out.”
Task 1 resultsMOBILE BENCHMARK STUDY (TABLETS)
28
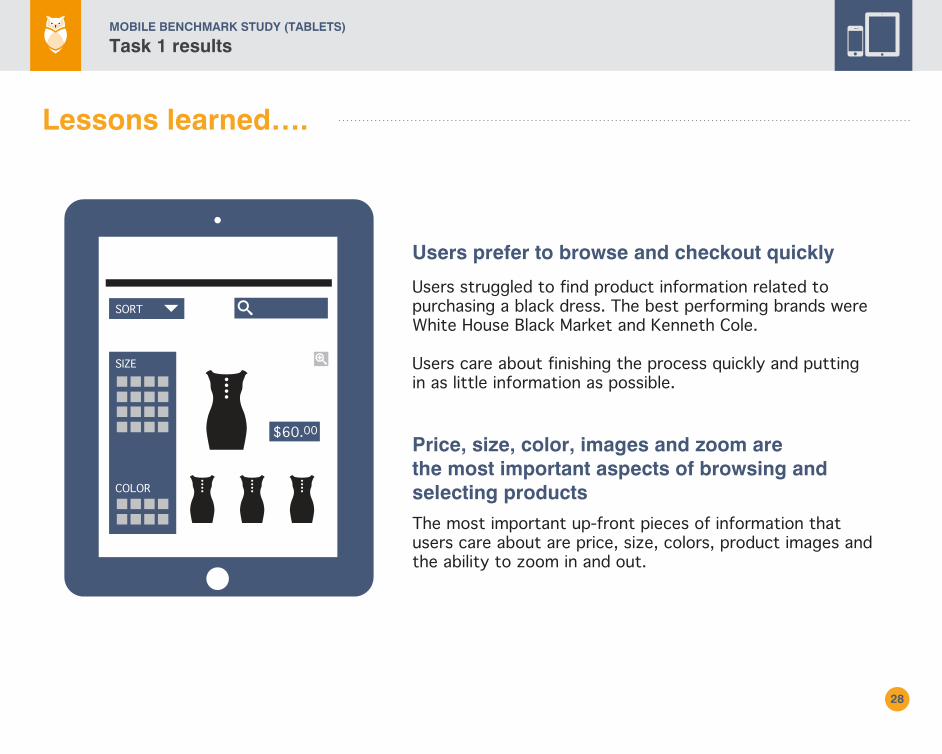
Lessons learned….
Users struggled to find product information related to purchasing a black dress. The best performing brands were White House Black Market and Kenneth Cole.
Users care about finishing the process quickly and putting in as little information as possible.
The most important up-front pieces of information that users care about are price, size, colors, product images and the ability to zoom in and out.
Users prefer to browse and checkout quickly
Price, size, color, images and zoom arethe most important aspects of browsing andselecting products
SORT
SIZE
COLOR
$60.00
Task 1 resultsMOBILE BENCHMARK STUDY (TABLETS)
MOBILE BENCHMARK STUDY (TABLETS)
Task 2 results
29
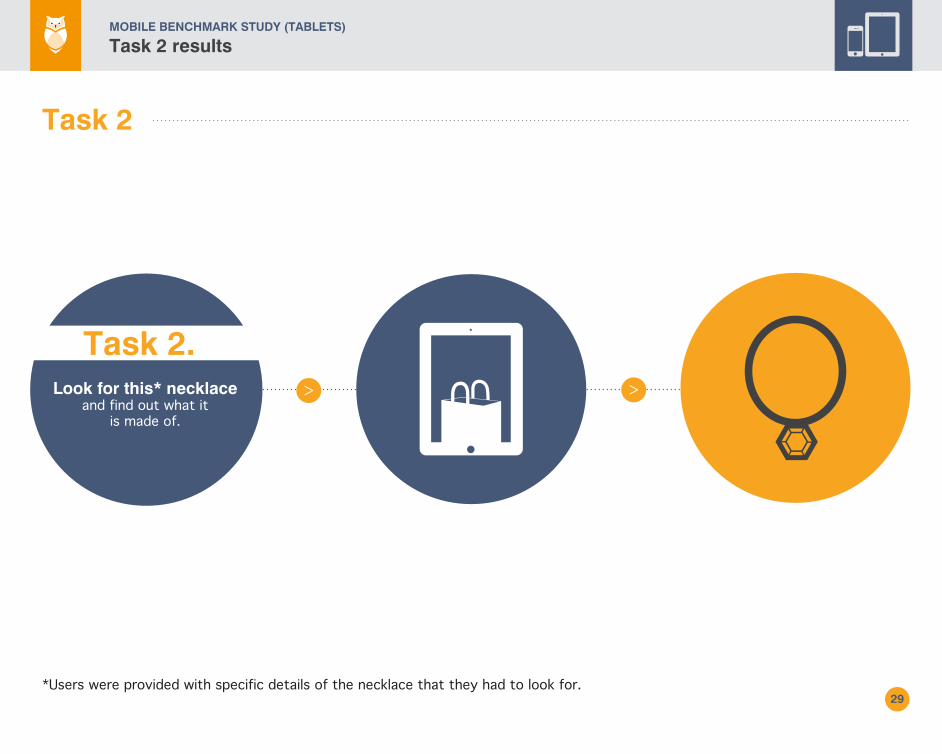
Task 2.Look for this* necklace
and find out what itis made of.
Task 2
*Users were provided with specific details of the necklace that they had to look for.
MOBILE BENCHMARK STUDY (TABLETS)
Task 2 results
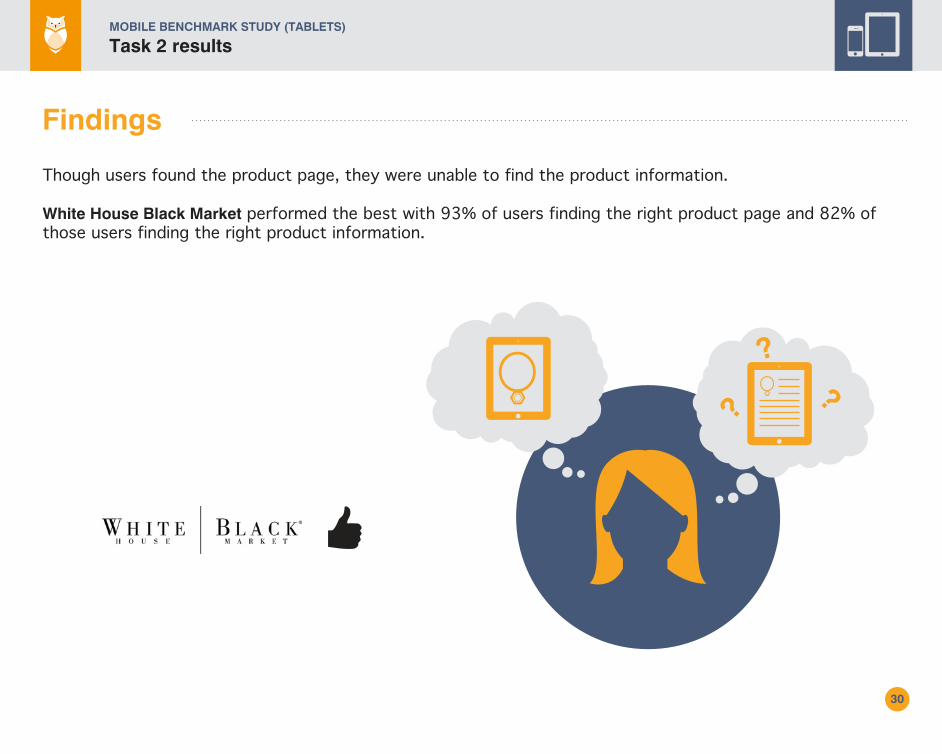
30
Though users found the product page, they were unable to find the product information.
White House Black Market performed the best with 93% of users finding the right product page and 82% of those users finding the right product information.
??
?
Findings
MOBILE BENCHMARK STUDY (TABLETS)
Task 2 results
31
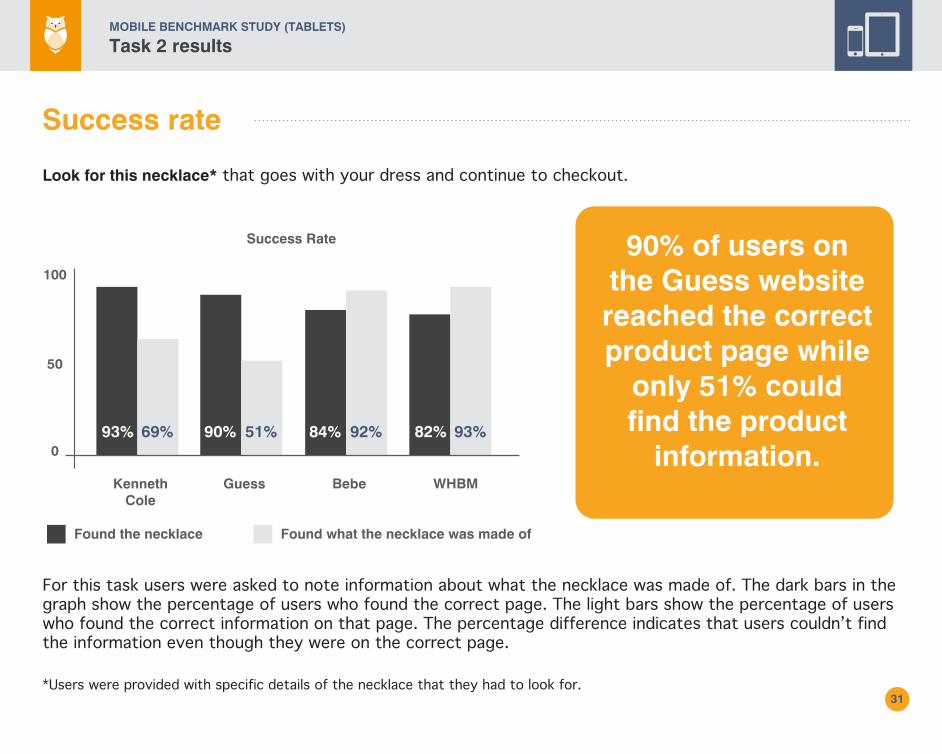
Success rate
Look for this necklace* that goes with your dress and continue to checkout.
For this task users were asked to note information about what the necklace was made of. The dark bars in the graph show the percentage of users who found the correct page. The light bars show the percentage of users who found the correct information on that page. The percentage difference indicates that users couldn’t find the information even though they were on the correct page.
WHBM
82% 93%
Bebe
84% 92%
Guess
90% 51%
Kenneth Cole
93% 69%
100
50
0
Success Rate
Found the necklace Found what the necklace was made of
90% of users onthe Guess website reached the correct product page while
only 51% couldfind the product
information.
*Users were provided with specific details of the necklace that they had to look for.
32
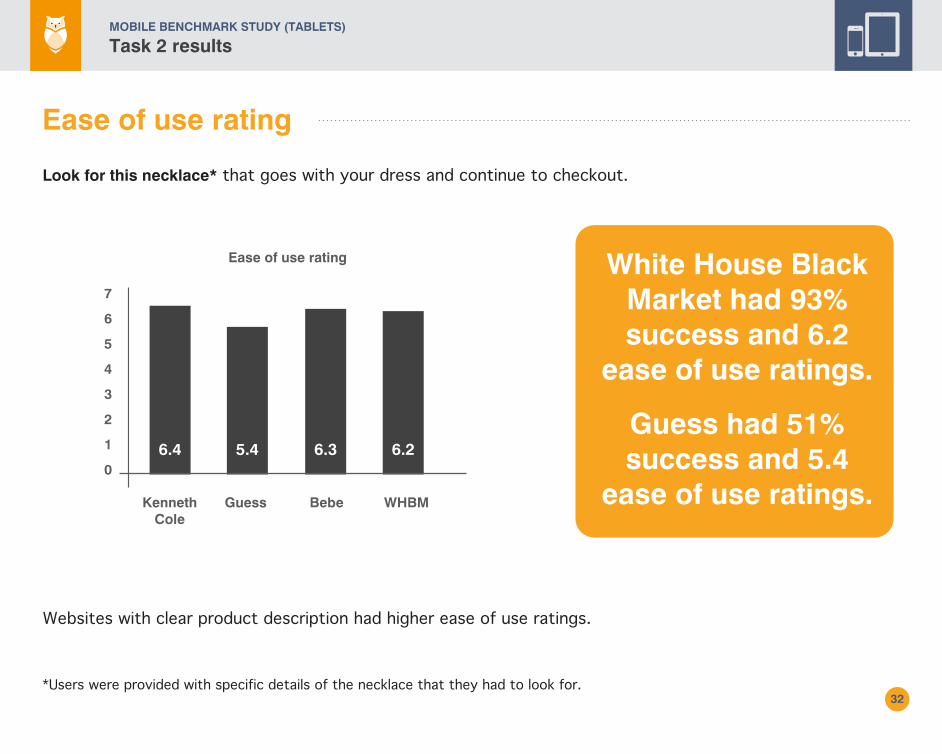
Look for this necklace* that goes with your dress and continue to checkout.
*Users were provided with specific details of the necklace that they had to look for.
Websites with clear product description had higher ease of use ratings.
WHBM
6.2
Bebe
6.3
Guess
5.4
Kenneth Cole
6.4
7
1
2
3
4
5
6
0
Ease of use rating White House Black Market had 93% success and 6.2
ease of use ratings.
Guess had 51% success and 5.4
ease of use ratings.
Ease of use rating
MOBILE BENCHMARK STUDY (TABLETS)
Task 2 results
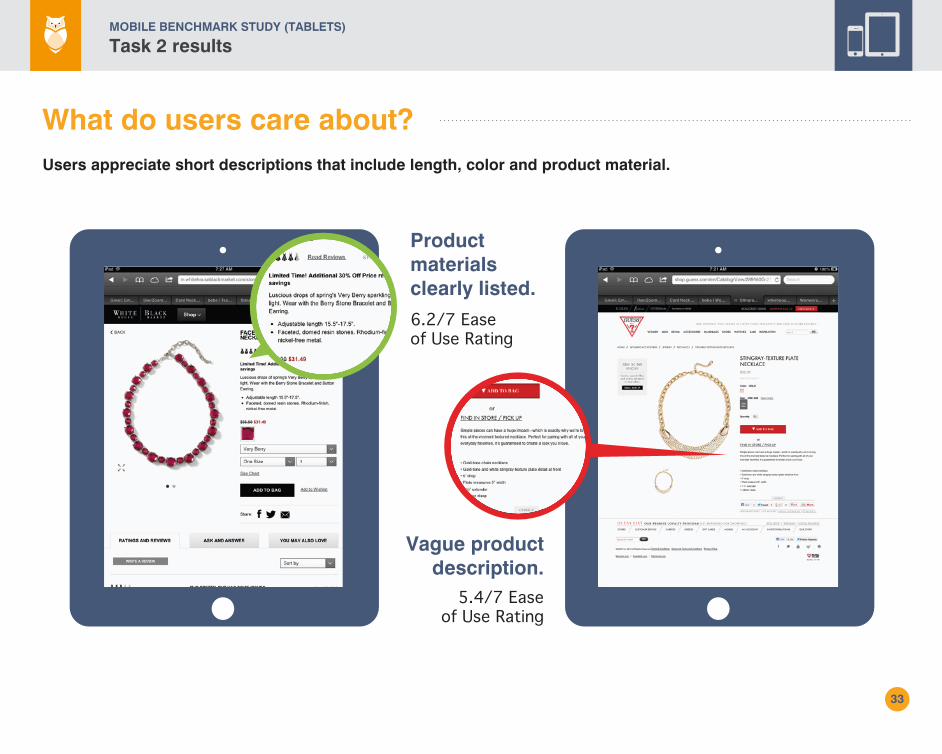
6.2/7 Easeof Use Rating
Product materials clearly listed.
5.4/7 Easeof Use Rating
Vague product description.
33
What do users care about?
MOBILE BENCHMARK STUDY (TABLETS)
Task 2 results
Users appreciate short descriptions that include length, color and product material.
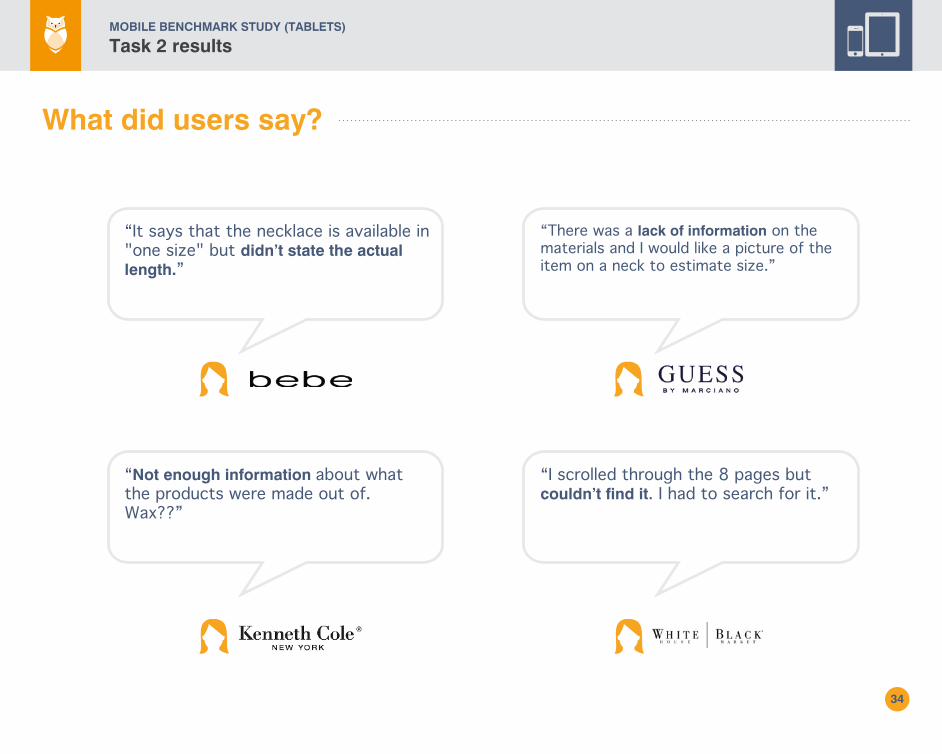
What did users say?
34
“It says that the necklace is available in "one size" but didn’t state the actual length.”
“There was a lack of information on the materials and I would like a picture of the item on a neck to estimate size.”
“Not enough information about what the products were made out of. Wax??”
“I scrolled through the 8 pages but couldn’t find it. I had to search for it.”
MOBILE BENCHMARK STUDY (TABLETS)
Task 2 results
35
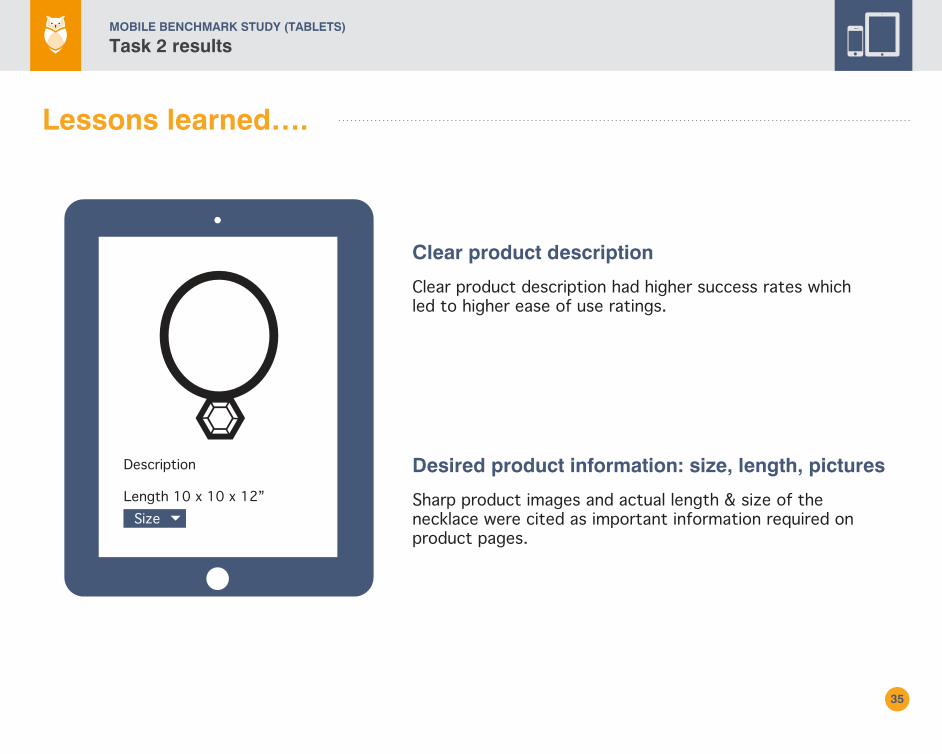
Lessons learned….
Clear product description had higher success rates which led to higher ease of use ratings.
Sharp product images and actual length & size of the necklace were cited as important information required on product pages.
Clear product description
Desired product information: size, length, picturesDescription
Length 10 x 10 x 12”Size
MOBILE BENCHMARK STUDY (TABLETS)
Task 2 results
MOBILE BENCHMARK STUDY (TABLETS)
Task 3 results
36
Task 3.Find information
about return policy inorder to return a product
purchased online.
Task 3
37
White House Black Market presented the return policy information with clear headings that made it easier to scan through.
Findings
MOBILE BENCHMARK STUDY (TABLETS)
Task 3 results
38
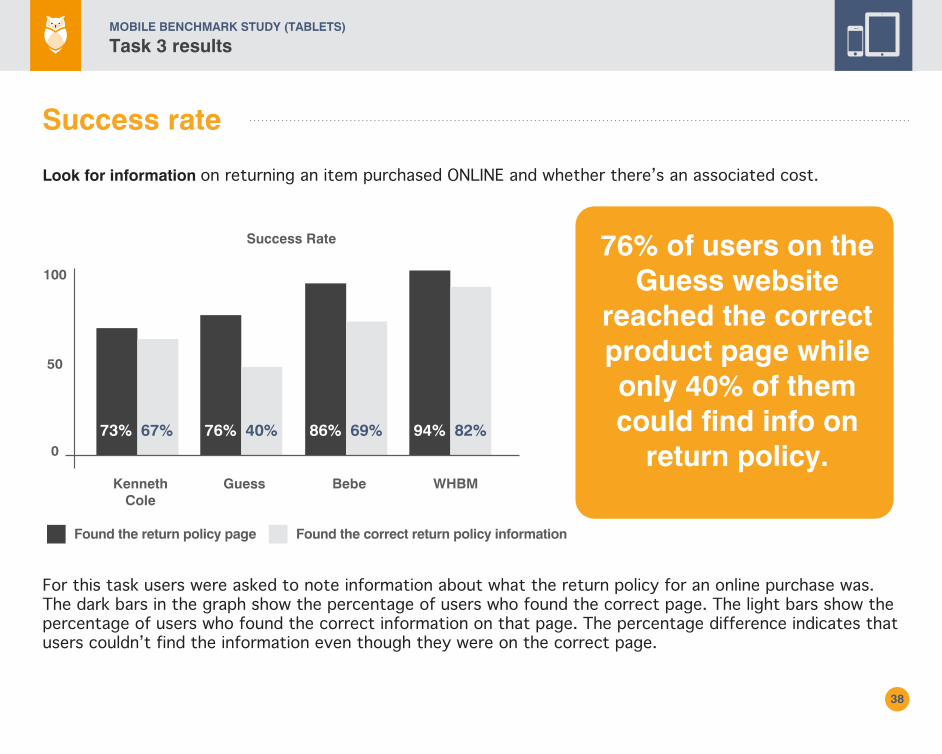
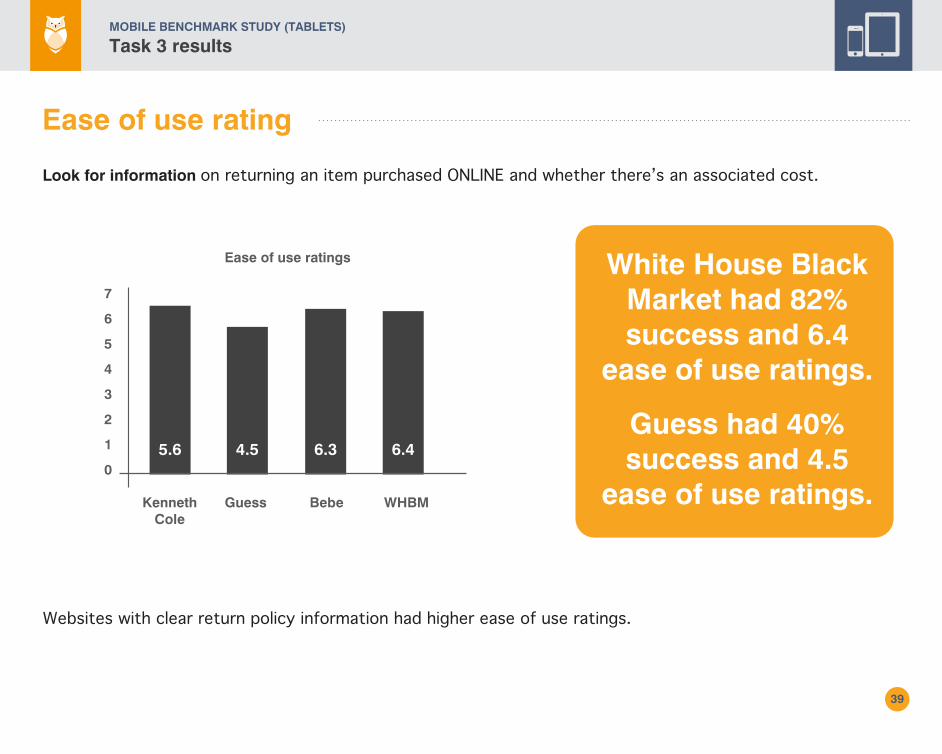
Look for information on returning an item purchased ONLINE and whether there’s an associated cost.
WHBM
94% 82%
Bebe
86% 69%
Guess
76% 40%
Kenneth Cole
73% 67%
100
50
0
Success Rate 76% of users on the Guess website
reached the correct product page while only 40% of them could find info on
return policy.
Success rate
Found the return policy page Found the correct return policy information
For this task users were asked to note information about what the return policy for an online purchase was. The dark bars in the graph show the percentage of users who found the correct page. The light bars show the percentage of users who found the correct information on that page. The percentage difference indicates that users couldn’t find the information even though they were on the correct page.
MOBILE BENCHMARK STUDY (TABLETS)
Task 3 results
39
Look for information on returning an item purchased ONLINE and whether there’s an associated cost.
Websites with clear return policy information had higher ease of use ratings.
WHBM
6.4
Bebe
6.3
Guess
4.5
Kenneth Cole
5.6
7
1
2
3
4
5
6
0
Ease of use ratings White House Black Market had 82% success and 6.4
ease of use ratings.
Guess had 40% success and 4.5
ease of use ratings.
Ease of use rating
MOBILE BENCHMARK STUDY (TABLETS)
Task 3 results
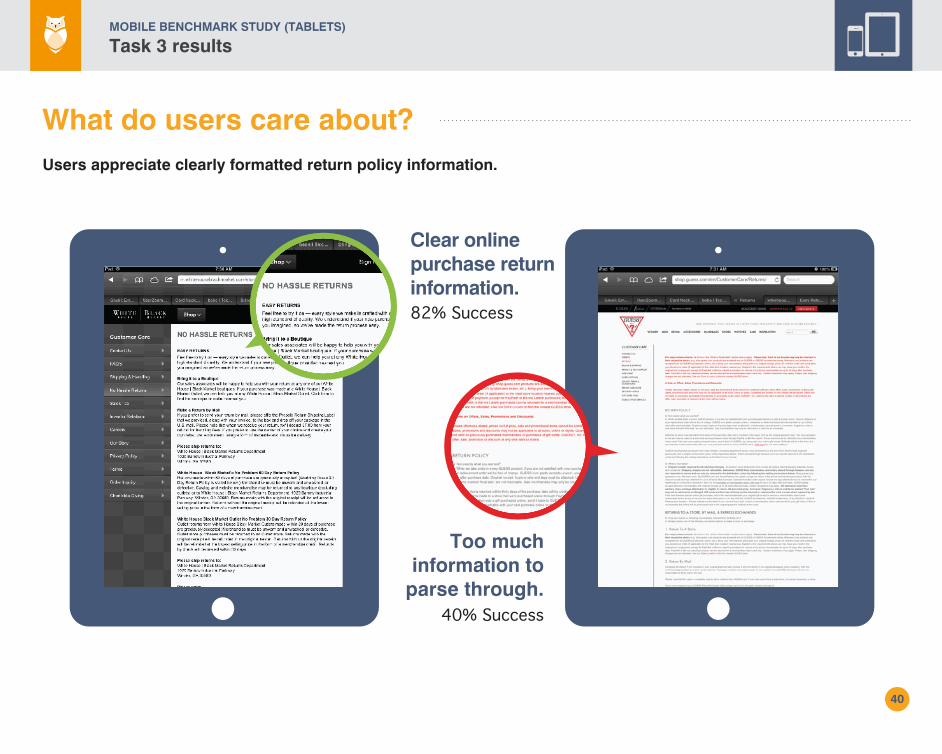
82% Success
Clear online purchase return information.
40% Success
Too much information to
parse through.
40
What do users care about?Users appreciate clearly formatted return policy information.
MOBILE BENCHMARK STUDY (TABLETS)
Task 3 results
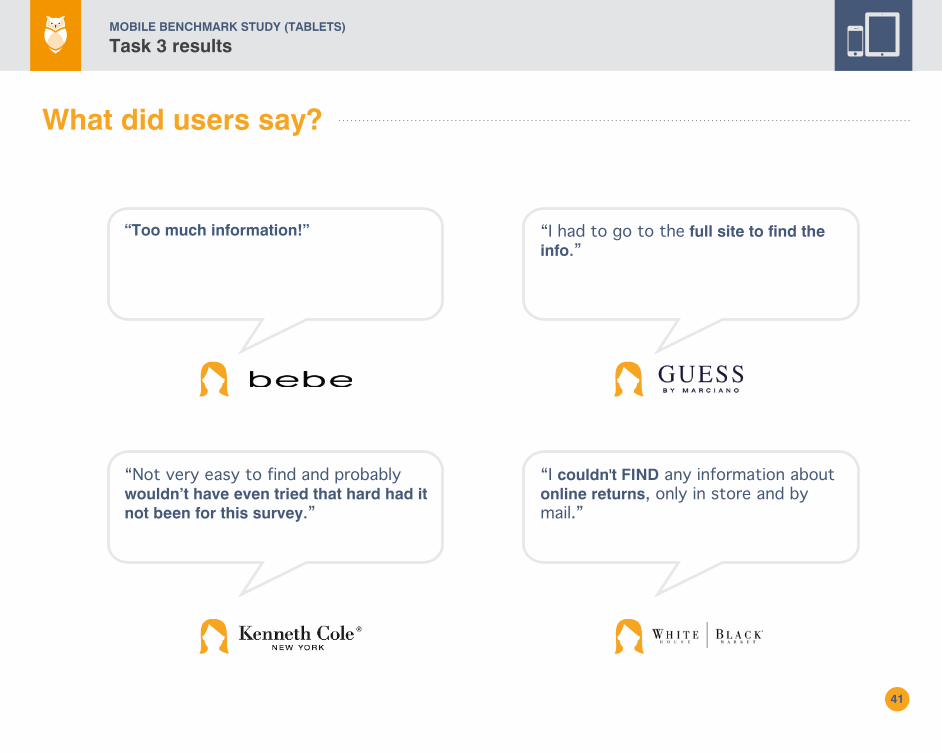
What did users say?
41
“Too much information!” “I had to go to the full site to find the info.”
“Not very easy to find and probably wouldn’t have even tried that hard had it not been for this survey.”
“I couldn't FIND any information about online returns, only in store and by mail.”
MOBILE BENCHMARK STUDY (TABLETS)
Task 3 results
42
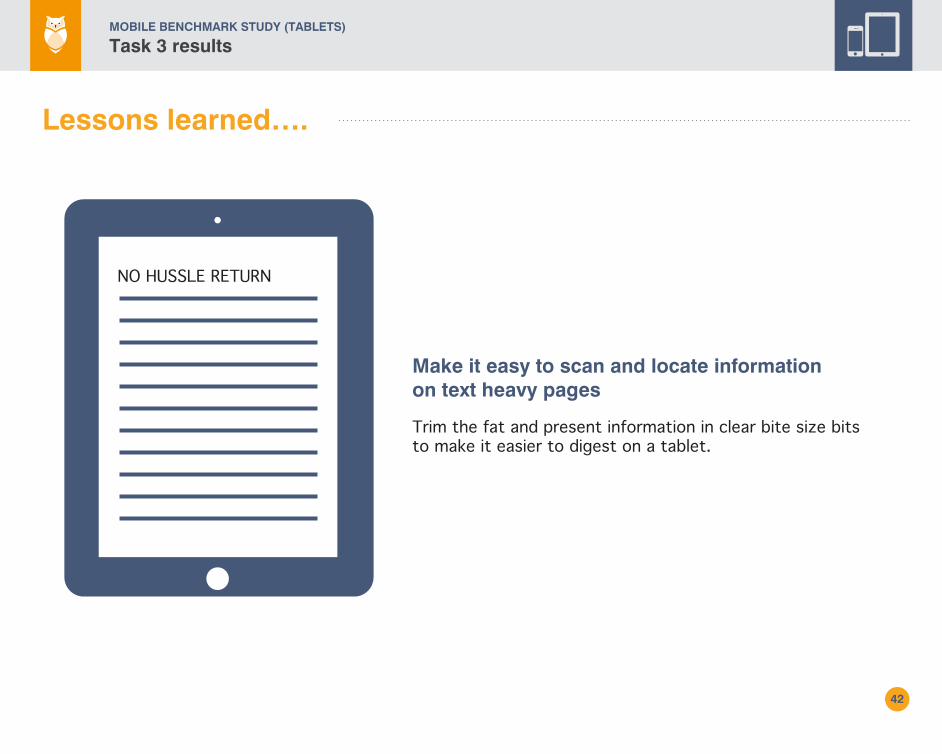
Lessons learned….
Trim the fat and present information in clear bite size bits to make it easier to digest on a tablet.
Make it easy to scan and locate informationon text heavy pages
NO HUSSLE RETURN
MOBILE BENCHMARK STUDY (TABLETS)
Task 3 results
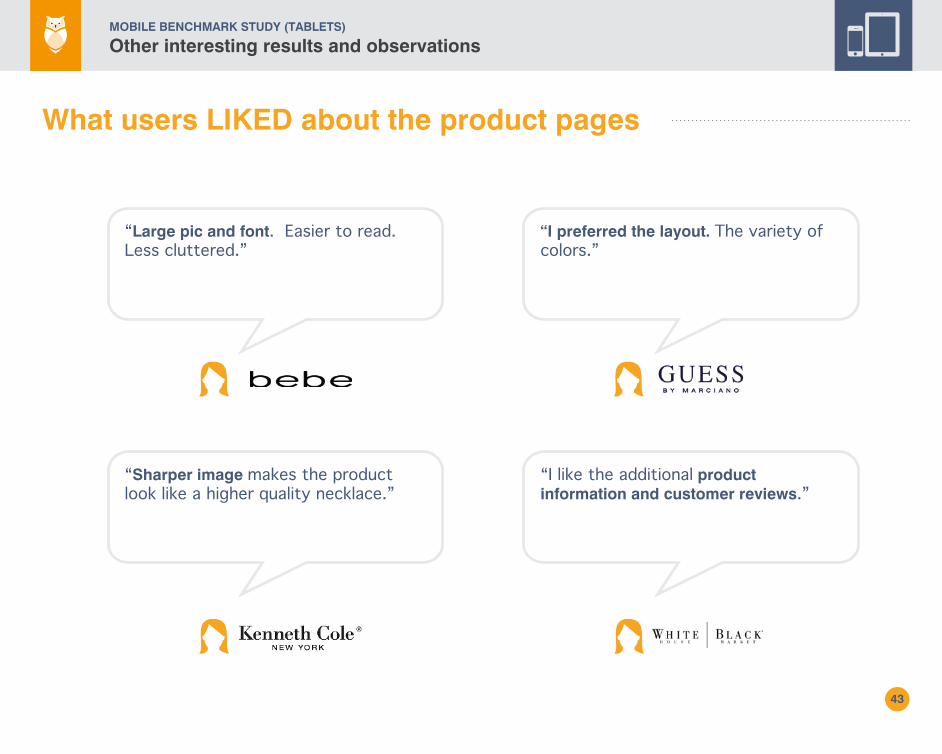
What users LIKED about the product pages
Other interesting results and observations
43
“Large pic and font. Easier to read. Less cluttered.”
“I preferred the layout. The variety of colors.”
“Sharper image makes the product look like a higher quality necklace.”
“I like the additional product information and customer reviews.”
MOBILE BENCHMARK STUDY (TABLETS)
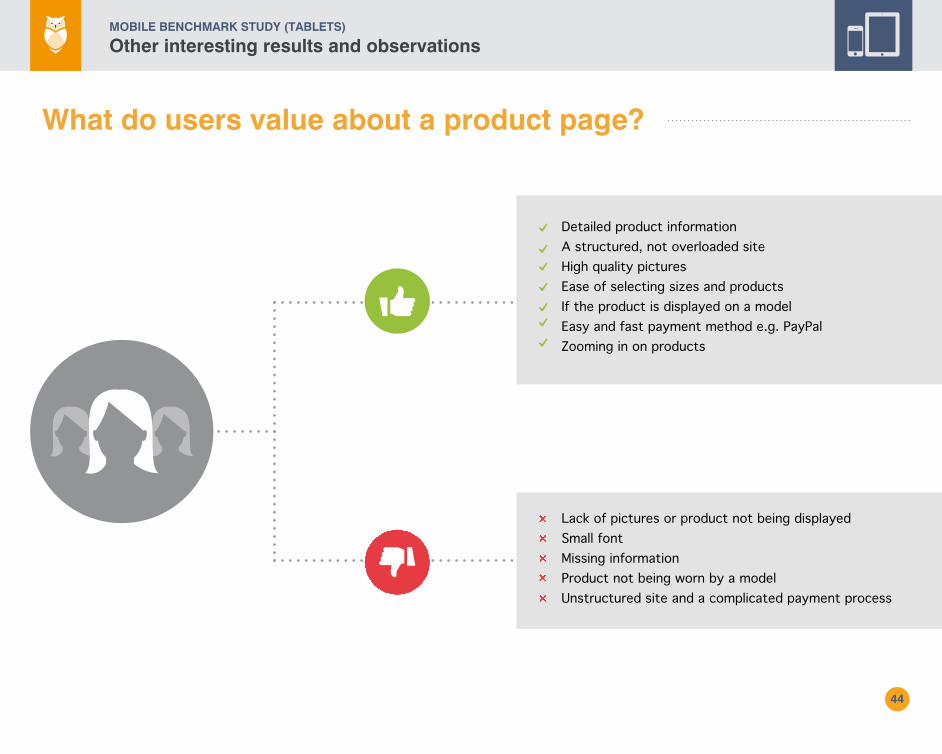
What do users value about a product page?
Other interesting results and observations
44
MOBILE BENCHMARK STUDY (TABLETS)
Detailed product informationA structured, not overloaded siteHigh quality picturesEase of selecting sizes and productsIf the product is displayed on a modelEasy and fast payment method e.g. PayPalZooming in on products
Lack of pictures or product not being displayedSmall fontMissing informationProduct not being worn by a modelUnstructured site and a complicated payment process
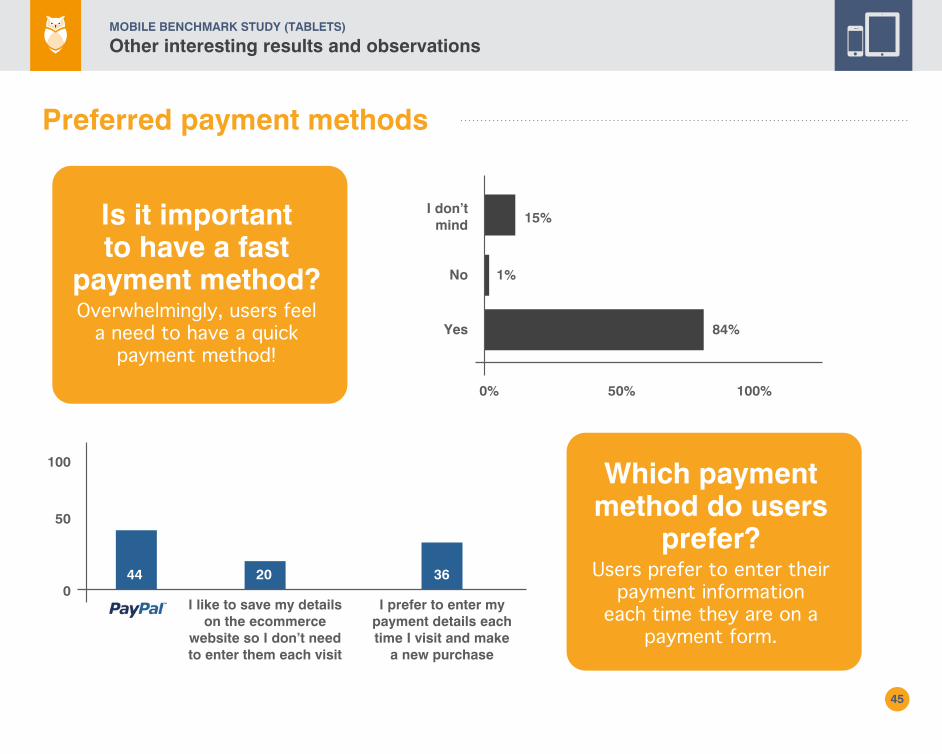
Preferred payment methods
45
100%50%0%
I don’tmind 15%
No 1%
Yes 84%
Is it importantto have a fast
payment method?Overwhelmingly, users feel
a need to have a quick payment method!
100
50
0
Which payment method do users
prefer?Users prefer to enter their
payment informationeach time they are on a
payment form.I like to save my details
on the ecommercewebsite so I don’t needto enter them each visit
I prefer to enter mypayment details eachtime I visit and make
a new purchase
44 20 36
Other interesting results and observationsMOBILE BENCHMARK STUDY (TABLETS)
46
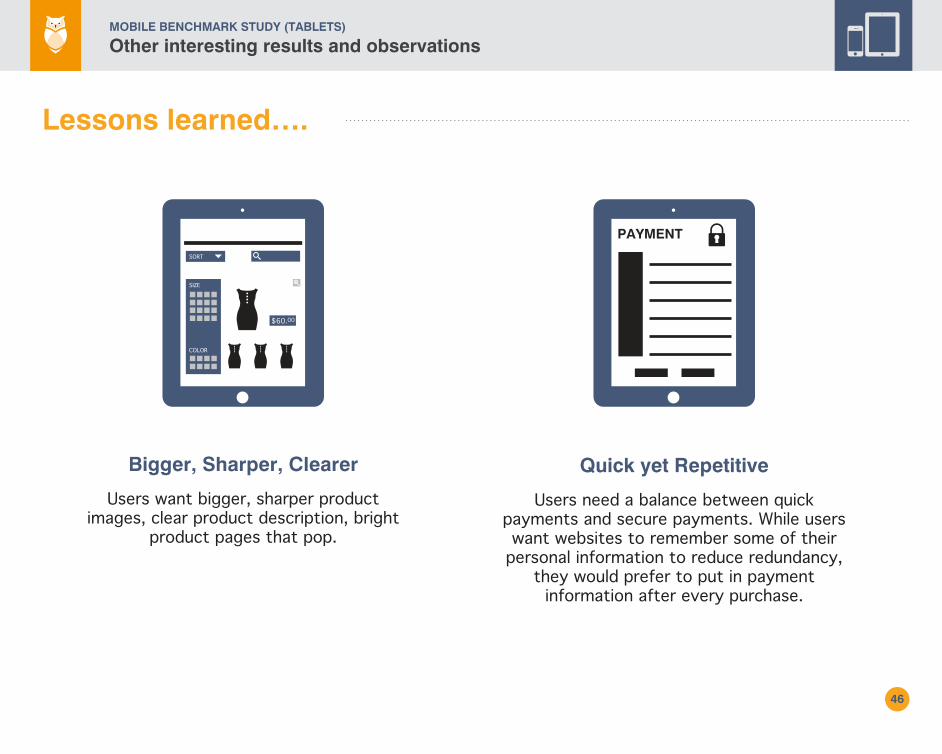
Lessons learned….
Users want bigger, sharper product images, clear product description, bright
product pages that pop.
Users need a balance between quick payments and secure payments. While users want websites to remember some of their
personal information to reduce redundancy, they would prefer to put in payment
information after every purchase.
Bigger, Sharper, Clearer Quick yet Repetitive
PAYMENTSORT
SIZE
COLOR
$60.00
Other interesting results and observationsMOBILE BENCHMARK STUDY (TABLETS)
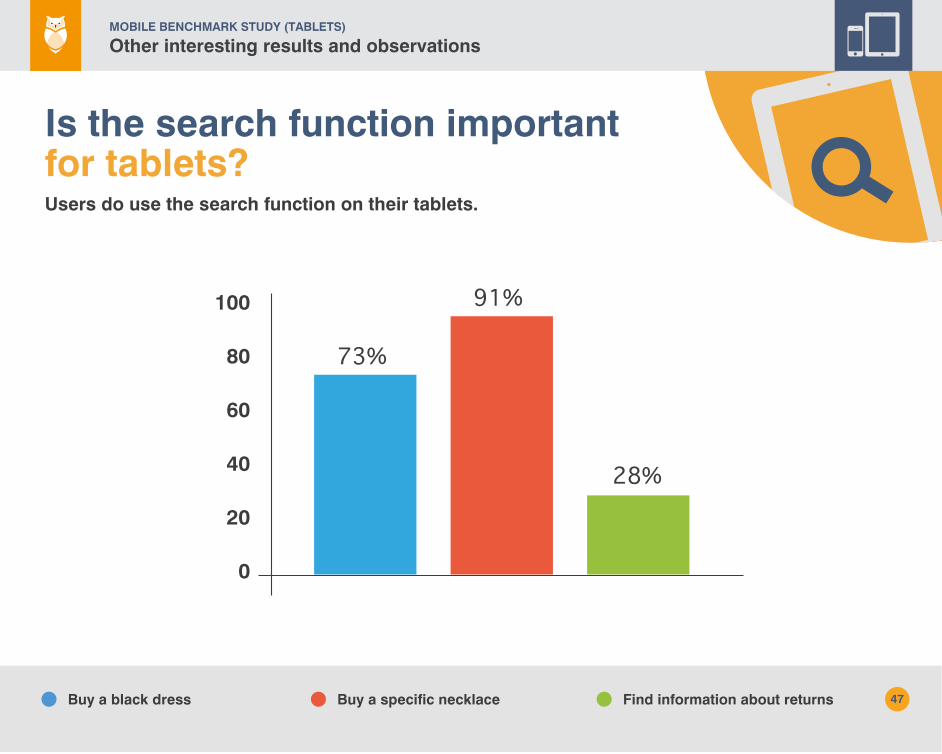
Find information about returnsBuy a black dress Buy a specific necklace
73%
91%
28%
100
80
60
40
20
0
Is the search function important
for tablets?Users do use the search function on their tablets.
47
Other interesting results and observationsMOBILE BENCHMARK STUDY (TABLETS)
48
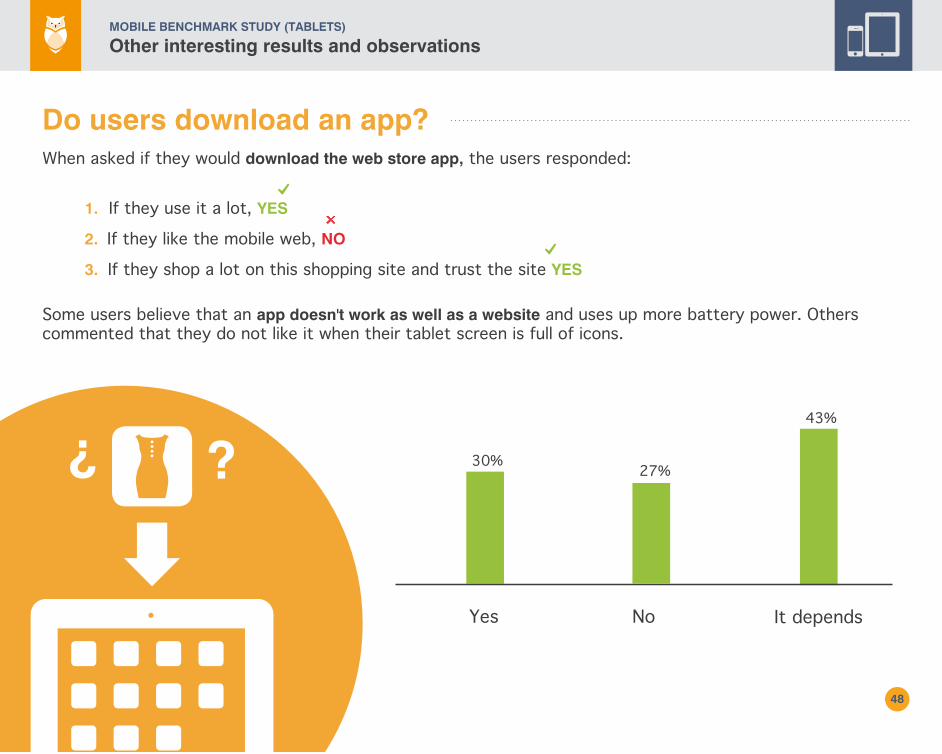
Do users download an app?
Other interesting results and observationsMOBILE BENCHMARK STUDY (TABLETS)
When asked if they would download the web store app, the users responded:
1. If they use it a lot, YES
2. If they like the mobile web, NO
3. If they shop a lot on this shopping site and trust the site YES
27%
NoYes
30%
It depends
43%
Some users believe that an app doesn't work as well as a website and uses up more battery power. Others commented that they do not like it when their tablet screen is full of icons.
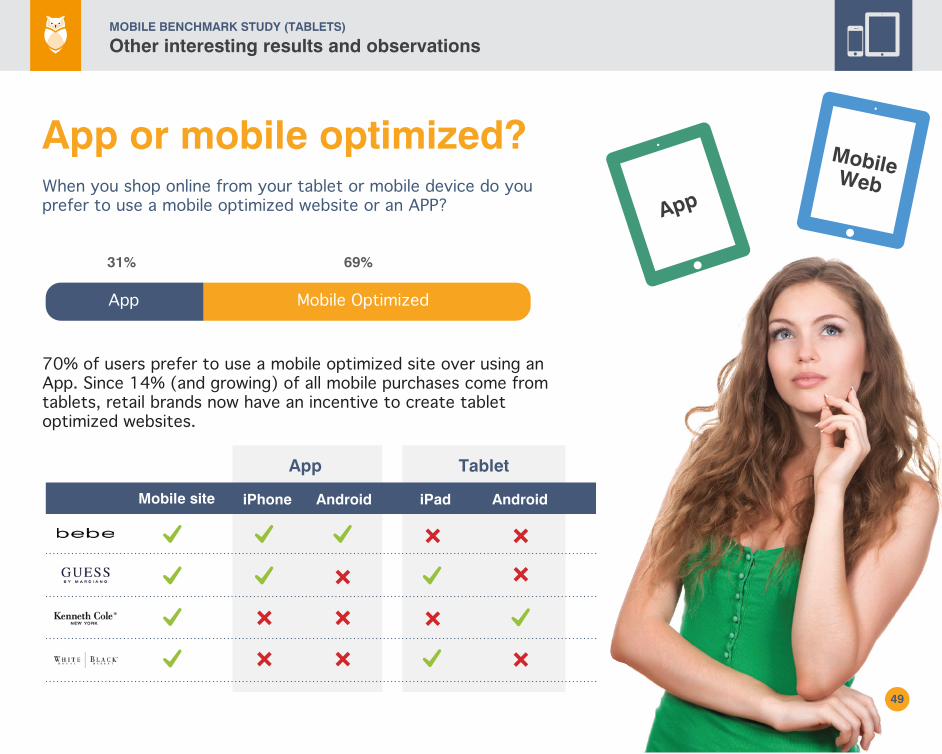
App or mobile optimized?When you shop online from your tablet or mobile device do you prefer to use a mobile optimized website or an APP?
70% of users prefer to use a mobile optimized site over using an App. Since 14% (and growing) of all mobile purchases come from tablets, retail brands now have an incentive to create tablet optimized websites.
Mobile OptimizedApp
31% 69%
TabletApp
Mobile site iPhone Android iPad Android
49
MobileWebApp
Other interesting results and observationsMOBILE BENCHMARK STUDY (TABLETS)
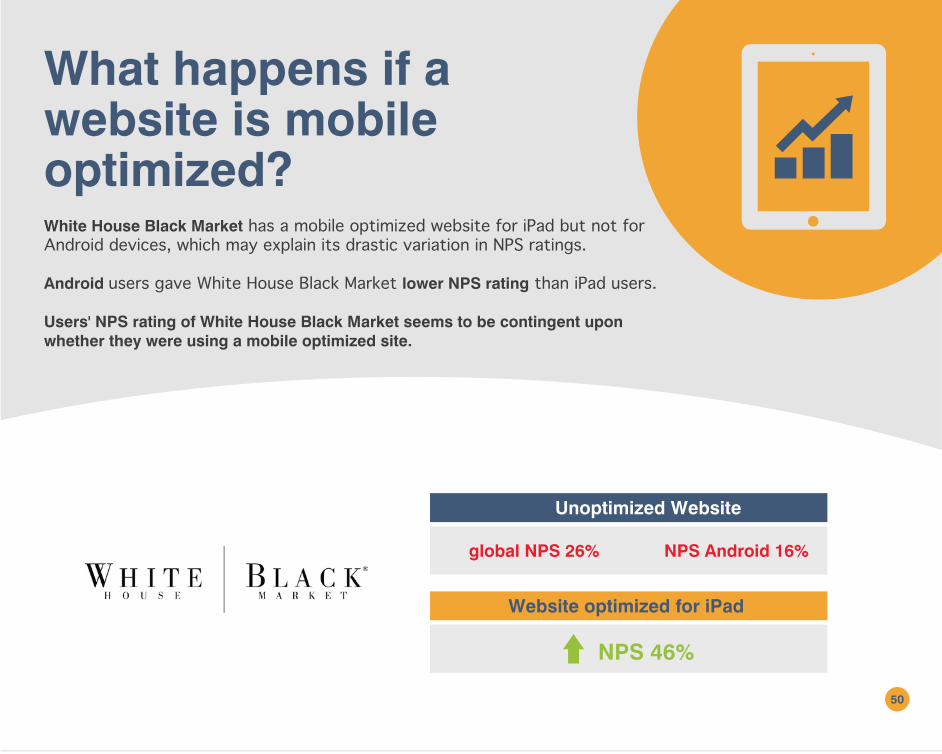
What happens if a website is mobile optimized?
50
White House Black Market has a mobile optimized website for iPad but not for Android devices, which may explain its drastic variation in NPS ratings.
Android users gave White House Black Market lower NPS rating than iPad users.
Users' NPS rating of White House Black Market seems to be contingent upon whether they were using a mobile optimized site.
Unoptimized Website
global NPS 26% NPS Android 16%
NPS 46%
Website optimized for iPad
51
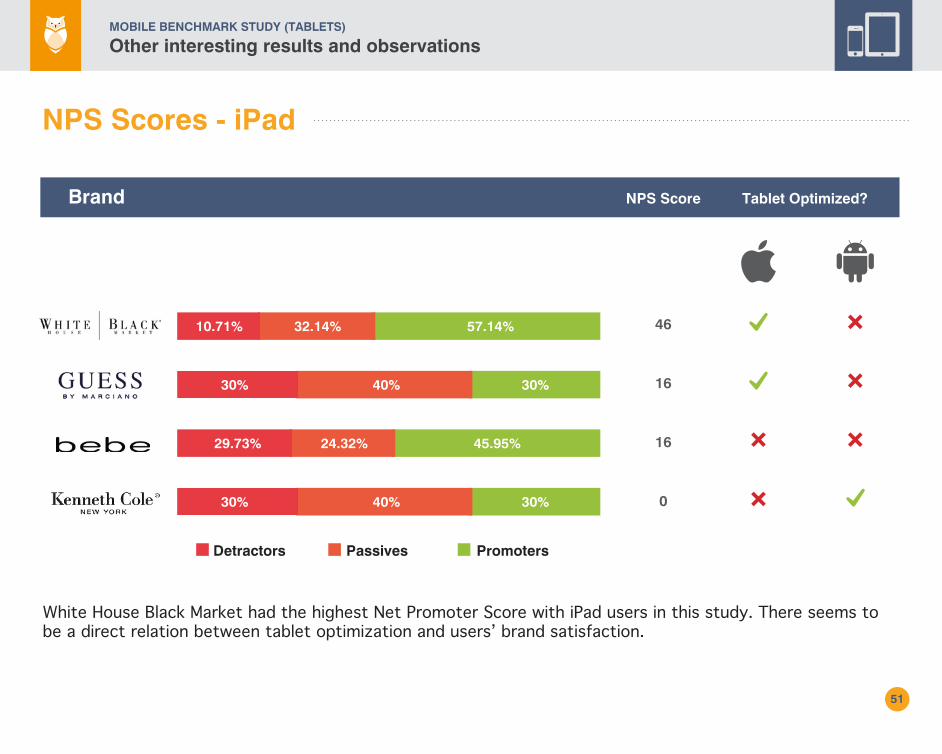
NPS Scores - iPad
White House Black Market had the highest Net Promoter Score with iPad users in this study. There seems to be a direct relation between tablet optimization and users’ brand satisfaction.
Brand NPS Score Tablet Optimized?
10.71% 32.14% 57.14%
30% 40% 30%
30% 40% 30%
29.73% 24.32% 45.95%
46
16
16
0
Detractors Passives Promoters
Other interesting results and observationsMOBILE BENCHMARK STUDY (TABLETS)
52
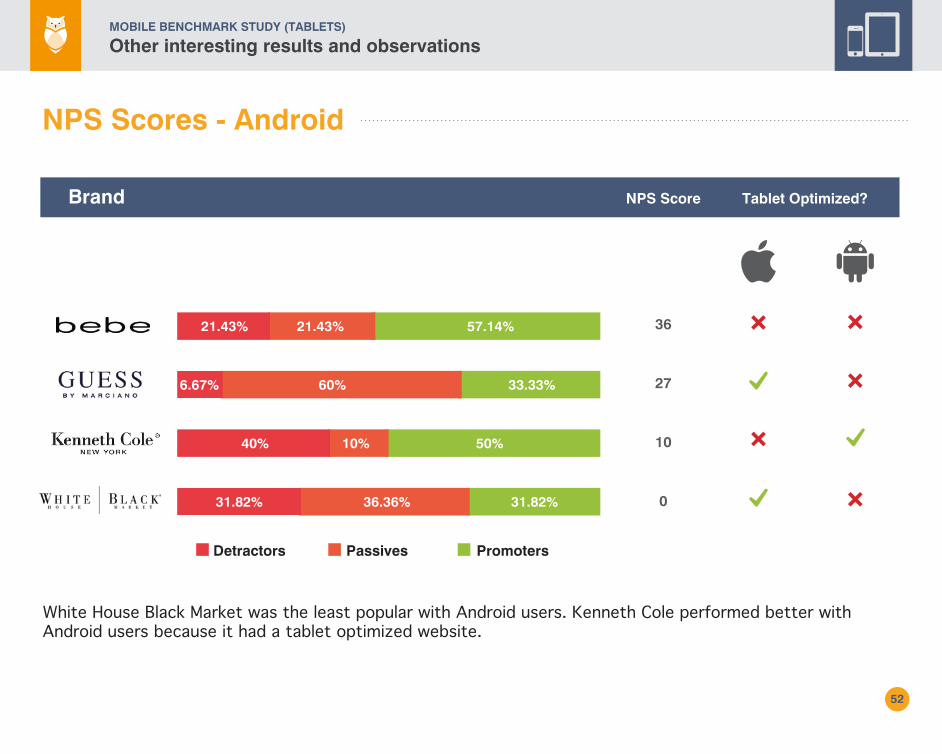
NPS Scores - Android
White House Black Market was the least popular with Android users. Kenneth Cole performed better with Android users because it had a tablet optimized website.
Brand NPS Score Tablet Optimized?
21.43% 21.43% 57.14%
6.67% 60% 33.33%
31.82% 36.36% 31.82%
40% 10% 50%
36
27
10
0
Detractors Passives Promoters
Other interesting results and observationsMOBILE BENCHMARK STUDY (TABLETS)
53
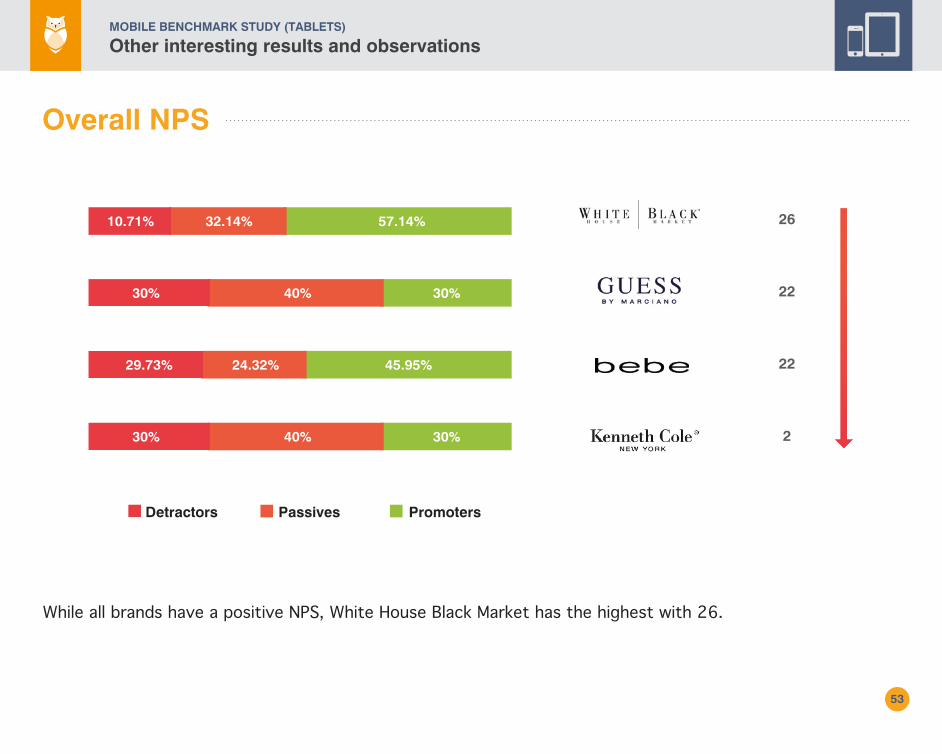
Overall NPS
While all brands have a positive NPS, White House Black Market has the highest with 26.
10.71% 32.14% 57.14%
30% 40% 30%
30% 40% 30%
29.73% 24.32% 45.95%
26
22
22
2
Detractors Passives Promoters
Other interesting results and observationsMOBILE BENCHMARK STUDY (TABLETS)
54
Lessons learned….
The results indicate that users of the White House Black Market website had the best success and ease of use ratings. It had the highest NPS of 46 with the iPad users and the lowest NPS of 0 with Android users. This may be because they have an optimized website for iOS and not for Android.
Mobile Optimized Site Affects Brand Desirability
Your Logo
Your Text
Your Text
Your Text
Your Text
Your Text
Your Text
Your Text
Other interesting results and observationsMOBILE BENCHMARK STUDY (TABLETS)
MOBILE BENCHMARK STUDY (TABLETS)
International study
55
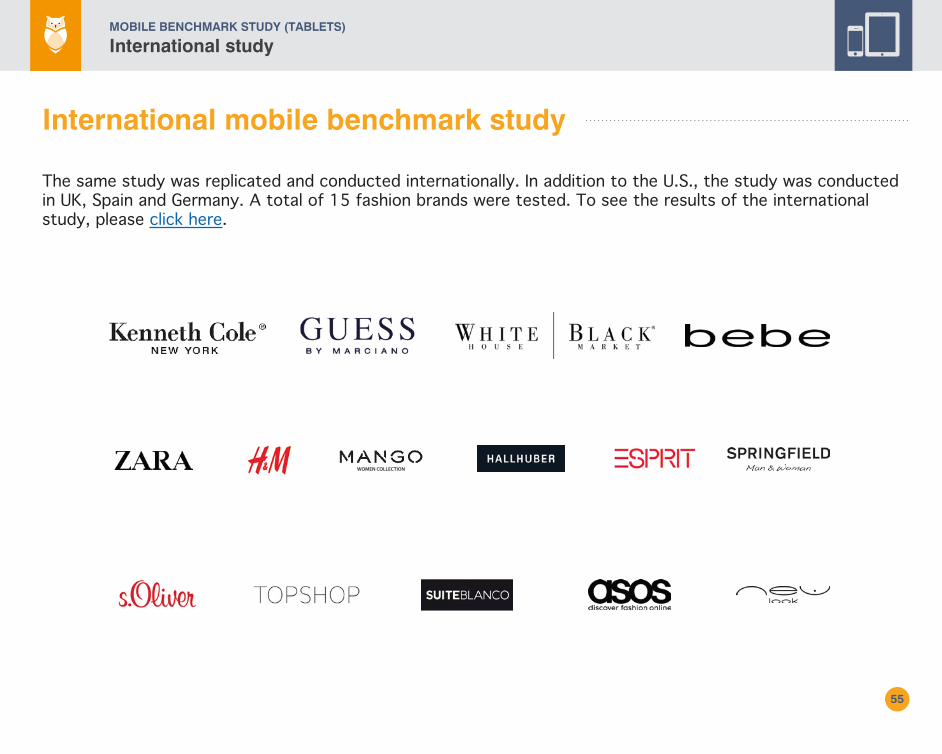
International mobile benchmark study
The same study was replicated and conducted internationally. In addition to the U.S., the study was conducted in UK, Spain and Germany. A total of 15 fashion brands were tested. To see the results of the international study, please click here.
56
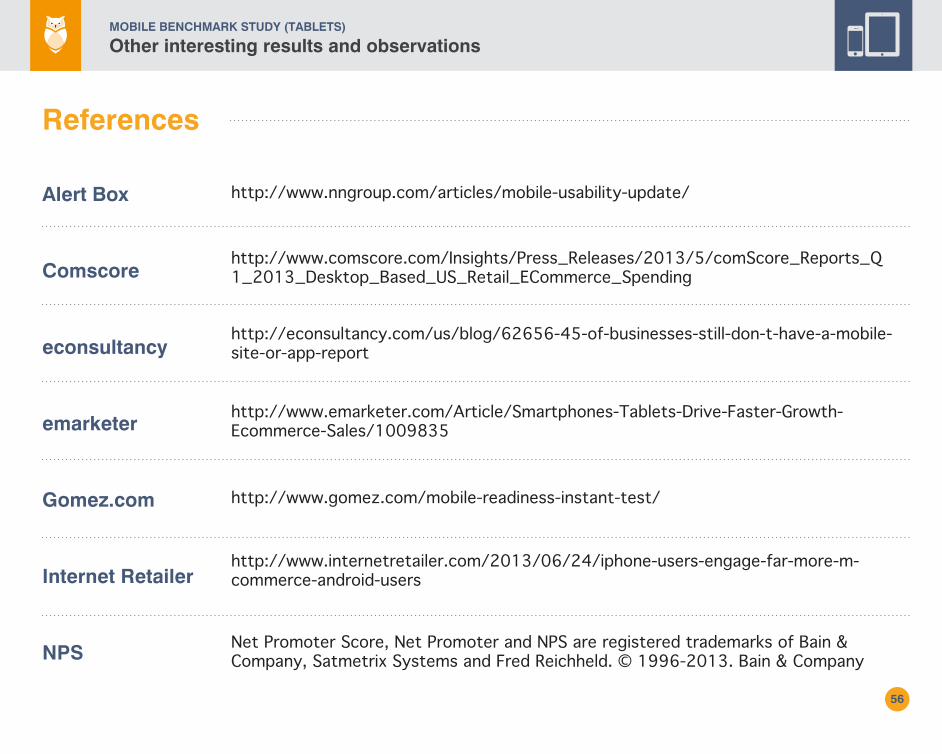
References
http://www.comscore.com/Insights/Press_Releases/2013/5/comScore_Reports_Q1_2013_Desktop_Based_US_Retail_ECommerce_Spending
http://www.nngroup.com/articles/mobile-usability-update/Alert Box
Comscore
econsultancyhttp://econsultancy.com/us/blog/62656-45-of-businesses-still-don-t-have-a-mobile- site-or-app-report
http://www.gomez.com/mobile-readiness-instant-test/
http://www.emarketer.com/Article/Smartphones-Tablets-Drive-Faster-Growth- Ecommerce-Sales/1009835
http://www.internetretailer.com/2013/06/24/iphone-users-engage-far-more-m- commerce-android-users
Net Promoter Score, Net Promoter and NPS are registered trademarks of Bain & Company, Satmetrix Systems and Fred Reichheld. © 1996-2013. Bain & Company
emarketer
Gomez.com
Internet Retailer
NPS
Other interesting results and observationsMOBILE BENCHMARK STUDY (TABLETS)
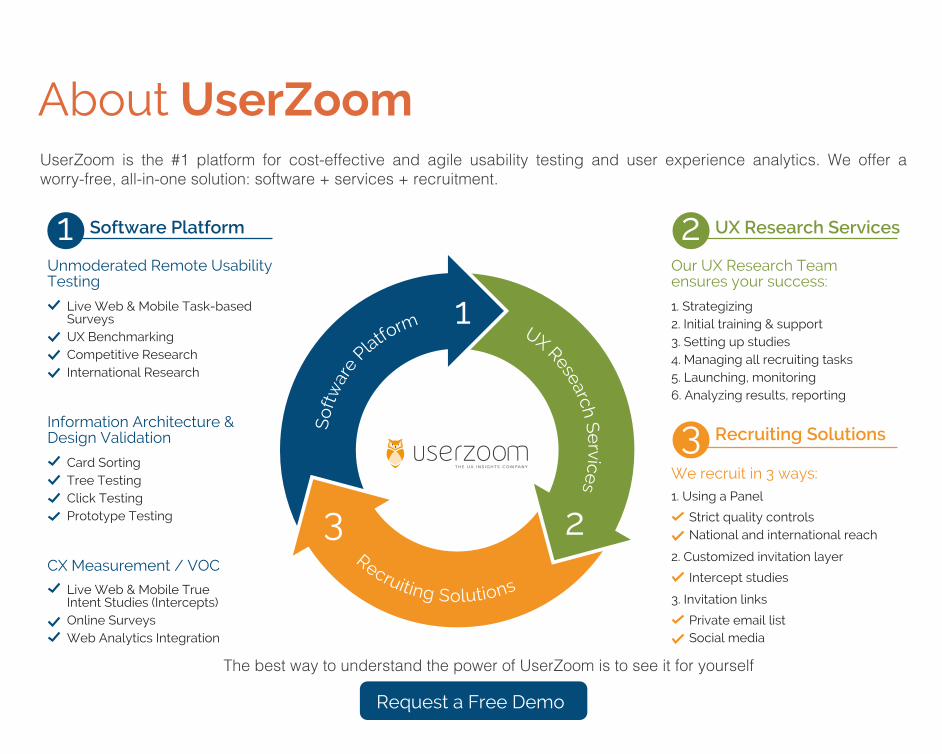
UserZoom is the #1 platform for cost-effective and agile usability testing and user experience analytics. We offer a worry-free, all-in-one solution: software + services + recruitment.
Social media
The best way to understand the power of UserZoom is to see it for yourself
About UserZoom
1
2
Live Web & Mobile Task-basedSurveysUX BenchmarkingCompetitive ResearchInternational Research
Unmoderated Remote UsabilityTesting
Card SortingTree TestingClick TestingPrototype Testing
Information Architecture &Design Validation
Live Web & Mobile TrueIntent Studies (Intercepts)Online SurveysWeb Analytics Integration
CX Measurement / VOC
Our UX Research Teamensures your success:
1. Strategizing2. Initial training & support3. Setting up studies4. Managing all recruiting tasks5. Launching, monitoring6. Analyzing results, reporting
We recruit in 3 ways:1. Using a Panel
Strict quality controlsNational and international reach
2. Customized invitation layer
Intercept studies
3. Invitation links
Private email list
Sof
twar
e Platfo
rm
Recruiting Solutions
UX Research Services
3 2
3
1 Software Platform UX Research Services
Recruiting Solutions
Request a Free Demo
THE UX INSIGHTS COMPANY
www.userzoom.com
London (UK)
Thomas House,
84 Eccleston Square
London, SW1VPXPhone: 0203 948 1360
Manchester (UK)
4-6 Bank Square Wilmslow,Cheshire SK9 1ANPhone: + 44 (0) 1625 525 650
San Jose, CA (USA)
10 Almaden Blvd #250,San Jose, CA 95113Phone: 866-599-1550
Denver, CO (USA)
1630 Welton Street #500CDenver, CO 80202
München (DE)
Kronstadterstrasse 4,81677 MünchenPhone: +49 (0)89 45 35 35 25
Madrid (Spain)
C/ O’Donnell 12, 2ª planta, 28009, MadridPhone: +(34) 91 111 48 82
Barcelona (Spain)
Av. Diagonal, 618 3ºDE08021 BarcelonaPhone: +34 93 414 7554
THE UX INSIGHTS COMPANY

THE UX INSIGHTS COMPANY
www.userzoom.com
London (UK)
Thomas House,
84 Eccleston Square
London, SW1VPXPhone: 0203 948 1360
Manchester (UK)
4-6 Bank Square Wilmslow,Cheshire SK9 1ANPhone: + 44 (0) 1625 525 650
San Jose, CA (USA)
10 Almaden Blvd #250,San Jose, CA 95113Phone: 866-599-1550
Denver, CO (USA)
1630 Welton Street #500CDenver, CO 80202
München (DE)
Kronstadterstrasse 4,81677 MünchenPhone: +49 (0)89 45 35 35 25
Madrid (Spain)
C/ O’Donnell 12, 2ª planta, 28009, MadridPhone: +(34) 91 111 48 82
Barcelona (Spain)
Av. Diagonal, 618 3ºDE08021 BarcelonaPhone: +34 93 414 7554