mixing and compaction temperatures for hot mix asphalt concrete
TRANSCRIPT
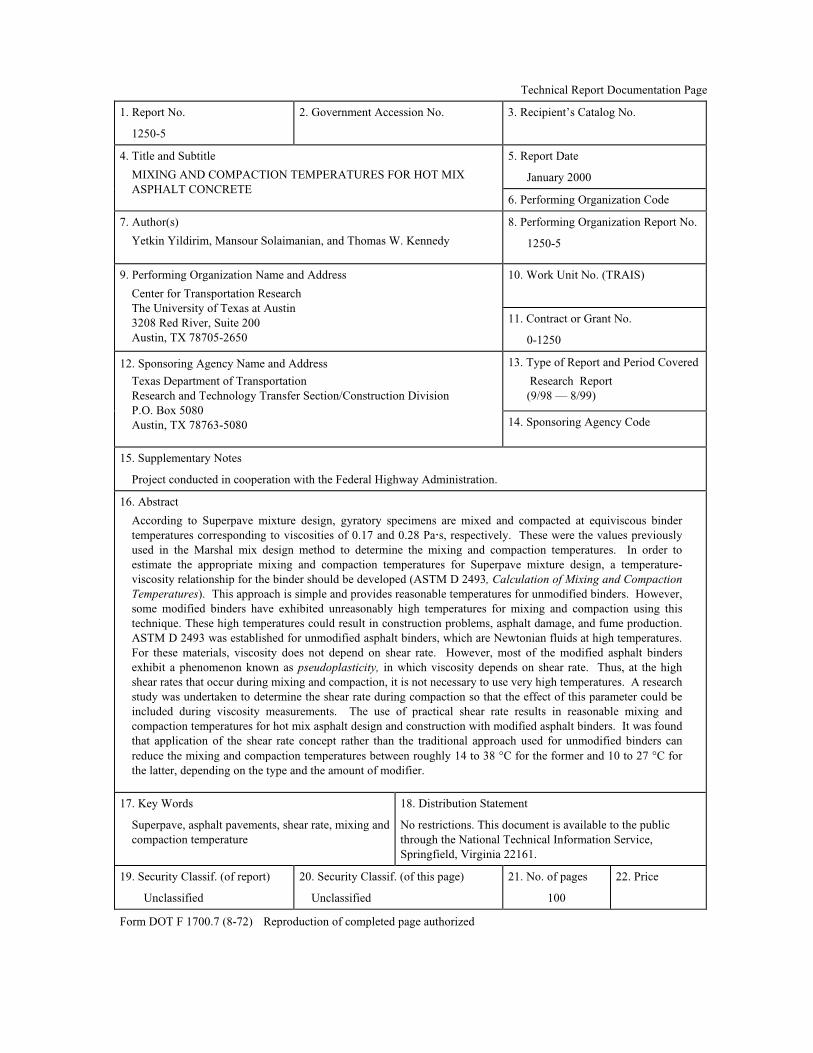
Technical Report Documentation Page
1. Report No.
1250-5
2. Government Accession No. 3. Recipient’s Catalog No.
5. Report Date
January 2000
4. Title and Subtitle
MIXING AND COMPACTION TEMPERATURES FOR HOT MIX ASPHALT CONCRETE
6. Performing Organization Code
7. Author(s)
Yetkin Yildirim, Mansour Solaimanian, and Thomas W. Kennedy
8. Performing Organization Report No.
1250-5
10. Work Unit No. (TRAIS)
9. Performing Organization Name and Address
Center for Transportation Research The University of Texas at Austin 3208 Red River, Suite 200 Austin, TX 78705-2650
11. Contract or Grant No.
0-1250
13. Type of Report and Period Covered
Research Report (9/98 — 8/99)
12. Sponsoring Agency Name and Address
Texas Department of Transportation Research and Technology Transfer Section/Construction Division P.O. Box 5080 Austin, TX 78763-5080
14. Sponsoring Agency Code
15. Supplementary Notes
Project conducted in cooperation with the Federal Highway Administration.
16. Abstract
According to Superpave mixture design, gyratory specimens are mixed and compacted at equiviscous binder temperatures corresponding to viscosities of 0.17 and 0.28 Pa�s, respectively. These were the values previously used in the Marshal mix design method to determine the mixing and compaction temperatures. In order to estimate the appropriate mixing and compaction temperatures for Superpave mixture design, a temperature-viscosity relationship for the binder should be developed (ASTM D 2493, Calculation of Mixing and Compaction Temperatures). This approach is simple and provides reasonable temperatures for unmodified binders. However, some modified binders have exhibited unreasonably high temperatures for mixing and compaction using this technique. These high temperatures could result in construction problems, asphalt damage, and fume production. ASTM D 2493 was established for unmodified asphalt binders, which are Newtonian fluids at high temperatures. For these materials, viscosity does not depend on shear rate. However, most of the modified asphalt binders exhibit a phenomenon known as pseudoplasticity, in which viscosity depends on shear rate. Thus, at the high shear rates that occur during mixing and compaction, it is not necessary to use very high temperatures. A research study was undertaken to determine the shear rate during compaction so that the effect of this parameter could be included during viscosity measurements. The use of practical shear rate results in reasonable mixing and compaction temperatures for hot mix asphalt design and construction with modified asphalt binders. It was found that application of the shear rate concept rather than the traditional approach used for unmodified binders can reduce the mixing and compaction temperatures between roughly 14 to 38 �C for the former and 10 to 27 �C for the latter, depending on the type and the amount of modifier.
17. Key Words
Superpave, asphalt pavements, shear rate, mixing and compaction temperature
18. Distribution Statement
No restrictions. This document is available to the public through the National Technical Information Service, Springfield, Virginia 22161.
19. Security Classif. (of report)
Unclassified
20. Security Classif. (of this page)
Unclassified
21. No. of pages
100
22. Price
Form DOT F 1700.7 (8-72) Reproduction of completed page authorized

MIXING AND COMPACTION TEMPERATURES FOR HOT MIX ASPHALT CONCRETE
by
Yetkin Yildirim, Mansour Solaimanian, and Thomas W. Kennedy �
Research Report Number 1250-5
�
Research Project 0-1250
South Central Superpave Center
Conducted for the
TEXAS DEPARTMENT OF TRANSPORTATION
in cooperation with the
U.S. DEPARTMENT OF TRANSPORTATION
FEDERAL HIGHWAY ADMINISTRATION
by the
CENTER FOR TRANSPORTATION RESEARCH
Bureau of Engineering Research
THE UNIVERSITY OF TEXAS AT AUSTIN
January 2000

iv
v
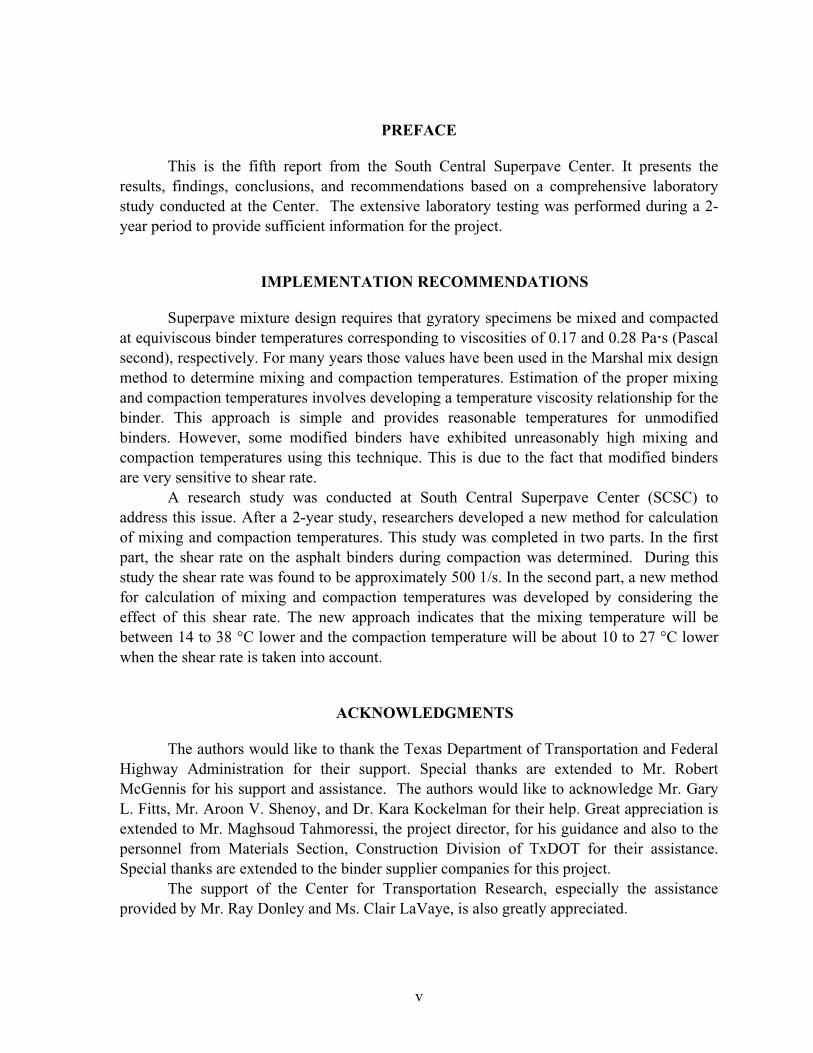
PREFACE
This is the fifth report from the South Central Superpave Center. It presents the results, findings, conclusions, and recommendations based on a comprehensive laboratory study conducted at the Center. The extensive laboratory testing was performed during a 2-year period to provide sufficient information for the project.
IMPLEMENTATION RECOMMENDATIONS
Superpave mixture design requires that gyratory specimens be mixed and compacted at equiviscous binder temperatures corresponding to viscosities of 0.17 and 0.28 Pa�s (Pascal second), respectively. For many years those values have been used in the Marshal mix design method to determine mixing and compaction temperatures. Estimation of the proper mixing and compaction temperatures involves developing a temperature viscosity relationship for the binder. This approach is simple and provides reasonable temperatures for unmodified binders. However, some modified binders have exhibited unreasonably high mixing and compaction temperatures using this technique. This is due to the fact that modified binders are very sensitive to shear rate.
A research study was conducted at South Central Superpave Center (SCSC) to address this issue. After a 2-year study, researchers developed a new method for calculation of mixing and compaction temperatures. This study was completed in two parts. In the first part, the shear rate on the asphalt binders during compaction was determined. During this study the shear rate was found to be approximately 500 1/s. In the second part, a new method for calculation of mixing and compaction temperatures was developed by considering the effect of this shear rate. The new approach indicates that the mixing temperature will be between 14 to 38 �C lower and the compaction temperature will be about 10 to 27 �C lower when the shear rate is taken into account.
ACKNOWLEDGMENTS
The authors would like to thank the Texas Department of Transportation and Federal Highway Administration for their support. Special thanks are extended to Mr. Robert McGennis for his support and assistance. The authors would like to acknowledge Mr. Gary L. Fitts, Mr. Aroon V. Shenoy, and Dr. Kara Kockelman for their help. Great appreciation is extended to Mr. Maghsoud Tahmoressi, the project director, for his guidance and also to the personnel from Materials Section, Construction Division of TxDOT for their assistance. Special thanks are extended to the binder supplier companies for this project.
The support of the Center for Transportation Research, especially the assistance provided by Mr. Ray Donley and Ms. Clair LaVaye, is also greatly appreciated.
vi
DISCLAIMERS
The contents of this report reflect the views of the authors, who are responsible for the facts and the accuracy of the data presented herein. The contents do not necessarily reflect the official views or policies of either the Federal Highway Administration or the Texas Department of Transportation. This report does not constitute a standard, specification, or regulation.
NOT INTENDED FOR CONSTRUCTION, BIDDING, OR PERMIT PURPOSES
Thomas W. Kennedy, P.E. (Texas No. 29596)
Research Supervisor
Research performed in cooperation with the Texas Department of Transportation and the U.S. Department of Transportation, Federal Highway Administration.
vii
TABLE OF CONTENTS CHAPTER 1. INTRODUCTION ............................................................................................ 1 CHAPTER 2. BACKGROUND .............................................................................................. 5
Mixing and Compaction................................................................................................ 5 Basic Terminology for Viscosity Calculations ............................................................. 5
Viscosity.................................................................................................................. 6 Newtonian Fluids .................................................................................................... 7 Non-Newtonian Fluids ............................................................................................ 8
Evaluation of Viscosity of Asphalt Binders at High Temperatures .............................. 9 Current Procedure for Calculation of Mixing and Compaction Temperatures........... 11 Shear Rate Inside the Superpave Gyratory Compactor............................................... 12
CHAPTER 3. EXPERIMENTAL PROGRAM ..................................................................... 13
Materials...................................................................................................................... 13 Asphalt Binders ........................................................................................................... 13 Performance Graded Binder Specification.................................................................. 14 Aggregates................................................................................................................... 14
Aggregate Testing Requirements .......................................................................... 14 Gradation............................................................................................................... 15 Specific Gravity of Aggregate............................................................................... 15 Mineral Aggregate Properties ............................................................................... 16 Consensus Aggregate Requirements..................................................................... 16 Source Properties................................................................................................... 17
Volumetric Test Requirements.................................................................................... 17 Equipment Used and Tests Conducted........................................................................ 19
Superpave Asphalt Binder Tests ........................................................................... 19 Superpave Gyratory Compactor............................................................................ 21
Definition of the Problem............................................................................................ 26 Calculation of Shear Rate...................................................................................... 29 Mixing Temperatures ............................................................................................ 31
Experimental Program................................................................................................. 31 Phase I: Estimation of the Relationship between Compaction Temperatures and Gmb Values ................................................................................ 32 Phase II: Estimation of the Relationship between Shear Rate and Viscosity ......................................................................................................... 32 Phase III: Application of the New Method ........................................................... 33
CHAPTER 4. RESULTS AND DISCUSSION ..................................................................... 35
viii
Calculation of Shear Rate............................................................................................ 35 CHAPTER 5. PRACTICAL APPLICATIONS OF THIS METHOD................................... 47 CHAPTER 6. CONCLUSIONS AND RECOMMENDATIONS ......................................... 55
Conclusions ................................................................................................................. 56 Future Research........................................................................................................... 57
BIBLIOGRAPHY ................................................................................................................... 59 APPENDIX A ......................................................................................................................... 61 APPENDIX B ......................................................................................................................... 65 APPENDIX C ......................................................................................................................... 71 APPENDIX D ......................................................................................................................... 75 APPENDIX E.......................................................................................................................... 79 APPENDIX F.......................................................................................................................... 83
ix
LIST OF TABLES
Table 3.1. Binders used for this study..................................................................................... 14
Table 3.2. Gradation of the mixes ........................................................................................... 15
Table 3.3: Superpave mixture design tests on HMA .............................................................. 18
Table 3.4. Compaction temperatures for Phase I .................................................................... 32
Table 3.5. Test temperatures for Phase II................................................................................ 33
Table 3.6. Shear rate values for Phase III ............................................................................... 33
Table 4.1. Estimated compaction temperatures delivering equal Gmb values......................... 40
Table 4.2. Estimated shear rates during compaction............................................................... 45
Table 5.1. Mixing and compaction temperatures at 6.8 1/s and 490 1/s shear rates............... 53
Table B.1. Verification of PG grade for multigrade PG 76-22. .............................................. 67
Table B.2. Verification of PG grade for tire rubber PG 76-22................................................ 67
Table B.3. Verification of PG grade for SBS PG 70-22. ........................................................ 68
Table B.4. Verification of PG grade for SBS PG 76-22. ........................................................ 68
Table B.5. Verification of PG grade for SBR PG 70-22......................................................... 69
Table B.6. Verification of PG grade for unmodified PG 52-28.............................................. 69
Table B.7. Verification of PG grade for unmodified PG 64-22.............................................. 70
Table D.1. Mix design properties of the mixes ....................................................................... 77
Table E.1. Power functions for Gmb and temperature relations. ............................................. 81
Table E.2. R2 values for Gmb and temperature relations........................................................... 81
Table F.1. Power functions and R2 values for viscosity vs. shear rate relations. ................... 85
x
LIST OF FIGURES
Figure 1.1. Determination of mixing and compaction temperatures, ASTM D 2493 .......... 2 Figure 2.1. Generalized curves showing rheological characteristics of Newtonian flows. ................................................................................................ 7 Figure 2.2. Generalized curves showing rheological characteristics of non-Newtonian flows.......................................................................................... 8 Figure 2.3. Generalized curves showing rheological characteristics of dilatant flows......... 9 Figure 2.4. Generalized curves showing rheological characteristics of plastic flows. ......... 9 Figure 2.5. Viscosity-temperature chart, ASTM D 2493.................................................... 11 Figure 3.1. The Brookfield viscometer, model DV II+....................................................... 20 Figure 3.2 Pine Superpave gyratory compactor, model AFGC 125X ............................... 22 Figure 3.3. SGC mold configuration................................................................................... 23 Figure 3.4. Mixture compaction characteristics from the SGC .......................................... 24 Figure 3.5. Superpave gyratory compactor specimens ....................................................... 25 Figure 3.6. Shear rate vs. viscosity for unmodified asphalt binders. .................................. 26 Figure 3.7. Temperature vs. viscosity for unmodified asphalt binders. .............................. 26 Figure 3.8. Viscosity vs. temperature for modified asphalt binders. .................................. 27 Figure 3.9. Viscosity vs. shear rate for modified asphalt binders. ...................................... 28 Figure 3.10. Viscosity vs. shear rate for a modified asphalt binder at 135C and 145C........ 29 Figure 3.11. Calculation of mixing and compaction temperatures, ASTM D2493 .............. 29 Figure 3.12. Temperature vs. Gmb relation for asphalt binders X and Y ............................... 30 Figure 3.13. Shear rate vs. viscosity for binders X and Y .................................................... 31 Figure 4.1. Gmb vs. temperature for multigrade and unmodified 1 for Mix 1...................... 36 Figure 4.2. Gmb vs. temperature for multigrade and unmodified 1 for Mix 2...................... 36 Figure 4.3. Gmb vs. temperature for TR modified and unmodified 1 for Mix 1 .................. 37 Figure 4.4. Gmb vs. temperature for TR modified and unmodified 1 for Mix 2 .................. 37 Figure 4.5. Gmb vs. temperature for multigrade and unmodified 2 for Mix 1...................... 38 Figure 4.6. Gmb vs. temperature for multigrade and unmodified 2 for Mix 2...................... 38 Figure 4.7. Gmb vs. temperature for TR modified and unmodified 2 for Mix 1 .................. 39 Figure 4.8. Gmb vs. temperature for TR modified and unmodified 2 for Mix 2 .................. 39 Figure 4.9. Estimation of shear rate during compaction for Figure 4.1. ............................. 41 Figure 4.10. Estimation of shear rate during compaction for Figure 4.2. ............................. 41 Figure 4.11. Estimation of shear rate during compaction for Figure 4.3. ............................. 42 Figure 4.12. Estimation of shear rate during compaction for Figure 4.4. ............................. 42 Figure 4.13. Estimation of shear rate during compaction for Figure 4.5. ............................. 43 Figure 4.14. Estimation of shear rate during compaction for Figure 4.6. ............................. 43 Figure 4.15. Estimation of shear rate during compaction for Figure 4.7. ............................. 44 Figure 4.16. Estimation of shear rate during compaction for Figure 4.8. ............................. 44 Figure 5.1. Calculation of mixing and compaction temperatures for multigrade at 6.8 1/s ......................................................................................... 47
xi
Figure 5.2. Calculation of mixing and compaction temperatures for multigrade at 490 1/s ........................................................................................ 48 Figure 5.3. Calculation of mixing and compaction temperatures for SBR at 6.8 1/s ......... 48 Figure 5.4. Calculation of mixing and compaction temperatures for SBR at 490 1/s ........ 49 Figure 5.5. Calculation of mixing and compaction temperatures for SBS at 6.8 1/s.......... 49 Figure 5.6. Calculation of mixing and compaction temperatures for SBS at 490 1/s......... 50 Figure 5.7. Calculation of mixing and compaction temperatures for TR at 6.8 1/s............ 50 Figure 5.8. Calculation of mixing and compaction temperatures for TR at 490 1/s........... 51 Figure 5.9. Calculation of mixing and compaction temperatures for SBS at 6.8 1/s.......... 51 Figure 5.10. Calculation of mixing and compaction temperatures for SBS at 490 1/s......... 52 Figure 5.11. Estimation of viscosity values at 490 1/s shear rate ......................................... 52 Figure C.1 Gradation of Mix 1 (12.5 mm coarse) .............................................................. 73 Figure C.2. Gradation of Mix 2 ........................................................................................... 73

xii
xiii
SUMMARY
According to Superpave mixture design, gyratory specimens are mixed and compacted at equiviscous binder temperatures corresponding to viscosities of 0.17 and 0.28 Pa�s, respectively. These were the values previously used in the Marshal mix design method to determine the mixing and compaction temperatures. In order to estimate the appropriate mixing and compaction temperatures for Superpave mixture design, a temperature-viscosity relationship for the binder should be developed (ASTM D 2493, Calculation of Mixing and Compaction Temperatures). This approach is simple and provides reasonable temperatures for unmodified binders. However, some modified binders have exhibited unreasonably high temperatures for mixing and compaction using this technique. These high temperatures could result in construction problems, asphalt damage, and fume production. ASTM D 2493 was established for unmodified asphalt binders, which are Newtonian fluids at high temperatures. For these materials, viscosity does not depend on shear rate. However, most of the modified asphalt binders exhibit a phenomenon known as pseudoplasticity, in which viscosity depends on shear rate. Thus, at the high shear rates that occur during mixing and compaction, it is not necessary to use very high temperatures. This research study was undertaken to determine the shear rate during compaction so that the effect of this parameter could be included during viscosity measurements. The use of practical shear rate results in reasonable mixing and compaction temperatures for hot mix asphalt design and construction with modified asphalt binders. It was found that application of the shear rate concept rather than the traditional approach used for unmodified binders can reduce the mixing and compaction temperatures between roughly 10 to 30 �C, depending on the type and the amount of modifier.

xiv
1
CHAPTER 1. INTRODUCTION
Superpave (SUperior PERforming Asphalt PAVEments) is a product of the Strategic Highway Research Program (SHRP). Superpave is a performance-based system used to design asphalt concrete pavements. Superpave consists of three elements: asphalt binder specifications, a volumetric design and analysis system, and mix analysis tests and a performance prediction system (Kennedy et al. 1994).
The Superpave mix design and the Marshal mix design requires that specimens be mixed and compacted at equiviscous binder temperatures corresponding to viscosities of 0.17 and 0.28 Pa�s, respectively. Those values have been used in the Marshal mix design method (ASTM D 1559) to determine mixing and compaction temperatures for many years. Estimation of proper mixing and compaction temperatures involves developing a temperature viscosity relationship for the binder (ASTM D 2493, Calculation of Mixing and Compaction Temperatures).
This approach (shown in Figure 1.1) is simple and provides reasonable temperatures for unmodified binders. However, some modified binders have exhibited unreasonably high mixing and compaction temperatures using this technique. This is because modified binders are very sensitive to shear rate (Bahia 1998). Currently, low shear rates are used to obtain viscosity values of 0.17 and 0.28 Pa�s, and neither ASTM D 2493 nor AASHTO TP4 specifies any shear rate value for viscosity measurements. It is common that modified binders tested with low shear rates result in high temperatures. Binder temperatures in excess of 190 ºC� have often been reported (Bahia 1998 and Hensley et al. 1998). Currently, mix designers address this issue by consulting with the supplier of the modified binder to obtain recommended temperatures. In many cases, however, the supplier has no solid information on which to base a recommendation. Furthermore, binder suppliers may be dealing with a material with which they have little or no experience. Thus, there is a need to establish a more rigorous and fundamentally sound procedure for selecting reasonable mixing and compaction temperatures for use in the Superpave mix design and construction. In this study the objective was to develop a new protocol for establishing sensible values for these temperatures.
It is important to emphasize that ASTM D 2493 was established for unmodified asphalt binders, which are Newtonian fluids at high temperatures. For these materials, viscosity does not depend on shear rate. However, modified asphalt binders exhibit a phenomenon known as pseudoplasticity, often referred to as shear thinning where viscosity values depend on shear rate.
The asphalt binder is sheared at a higher rate during the mixing and compaction process than it is during viscosity measurements. In other words, viscosity measurements
� Because SHRP and the Superpave system rely solely on metric units, this report will similarly use metrics. It is understood that anyone using this report or working within this area will necessarily use metric measures.
2
based on the current procedures do not reflect the binder’s viscosity values during mixing and compaction. ASTM D 2493 does not specify any shear rate value for viscosity measurements.
The current procedure for calculating mixing and compaction temperatures is defined in ASTM D 2493. This procedure appears to be appropriate for unmodified asphalt binders. Current procedure depends on the viscosity-temperature relationship. Viscosity values of 0.170�0.020 Pa�s and 0.280�0.030 Pa�s are used for determining mixing and compaction temperatures, respectively.
Viscosity is a measure of the internal friction of a fluid. Accordingly, it is an important factor during mixing and compaction. If the viscosity is too high, it will be very difficult to get the desired density, and the specimen cannot be mixed and compacted properly. If the viscosity is too low, it may be difficult to get uniform distribution of asphalt binder throughout the aggregate structure. Temperature has a significant effect on viscosity, which is why the mixing and compaction temperatures are controlled by viscosity (Hensley et al. 1998).
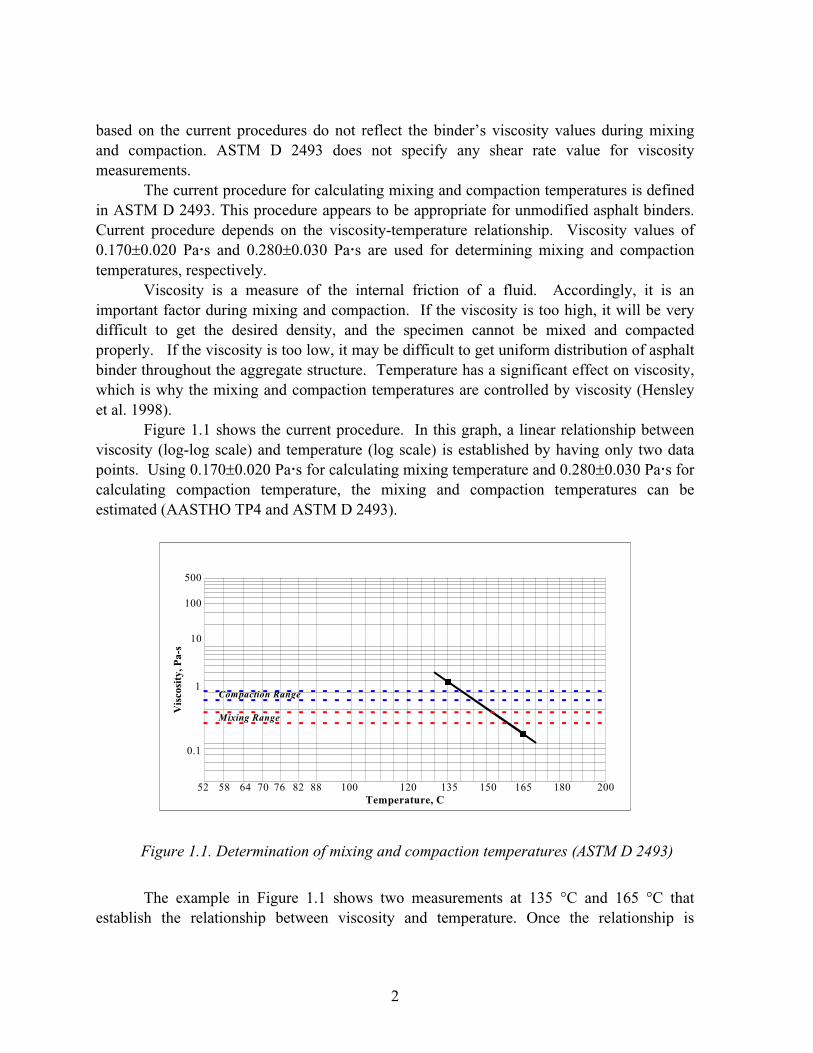
Figure 1.1 shows the current procedure. In this graph, a linear relationship between viscosity (log-log scale) and temperature (log scale) is established by having only two data points. Using 0.170�0.020 Pa�s for calculating mixing temperature and 0.280�0.030 Pa�s for calculating compaction temperature, the mixing and compaction temperatures can be estimated (AASTHO TP4 and ASTM D 2493).
�
������������
� ���� ������
���
�
��
�� �� �� ��� ��� ��� ��� ���
�����������
�� �����������
� � ��� ��� ���
���
���
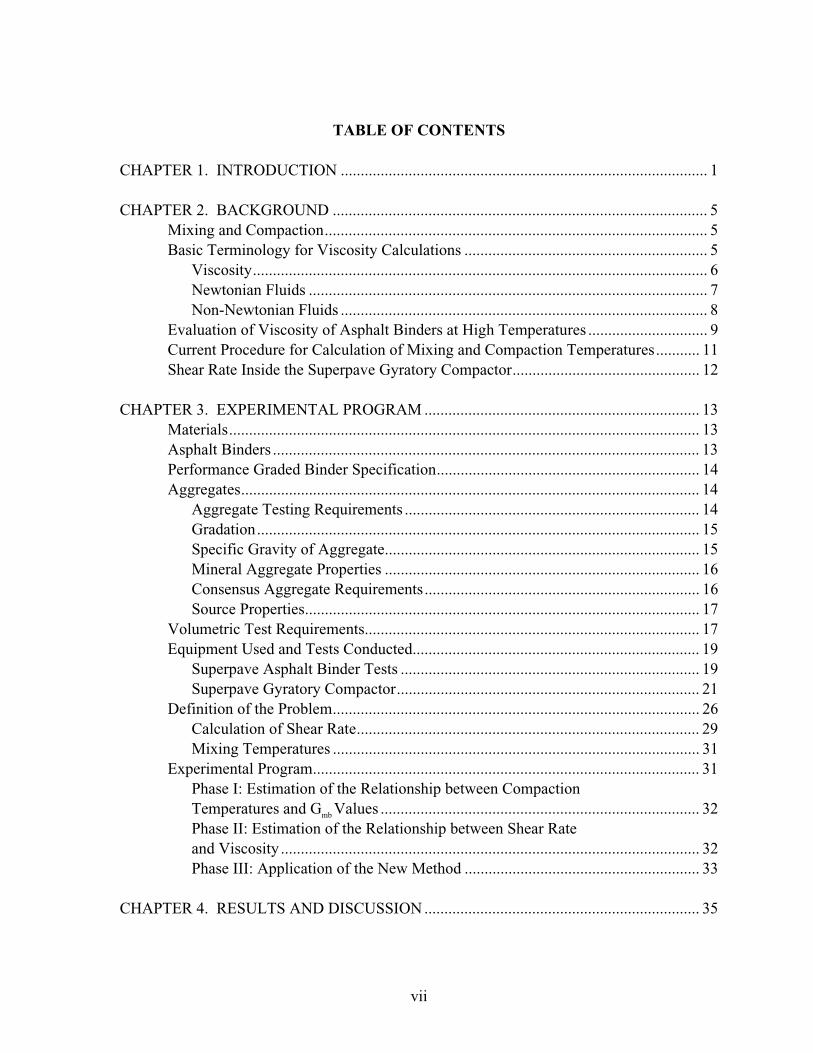
Figure 1.1. Determination of mixing and compaction temperatures (ASTM D 2493)
The example in Figure 1.1 shows two measurements at 135 �C and 165 �C that
establish the relationship between viscosity and temperature. Once the relationship is
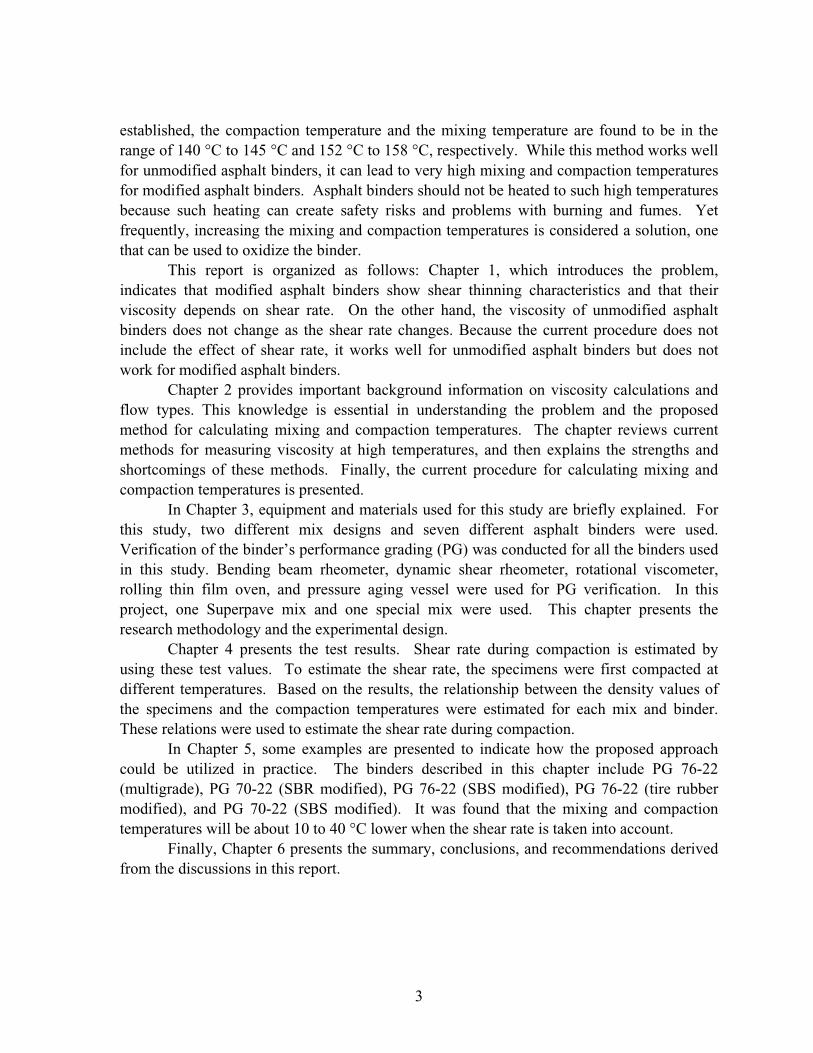
3
established, the compaction temperature and the mixing temperature are found to be in the range of 140 �C to 145 �C and 152 �C to 158 �C, respectively. While this method works well for unmodified asphalt binders, it can lead to very high mixing and compaction temperatures for modified asphalt binders. Asphalt binders should not be heated to such high temperatures because such heating can create safety risks and problems with burning and fumes. Yet frequently, increasing the mixing and compaction temperatures is considered a solution, one that can be used to oxidize the binder.
This report is organized as follows: Chapter 1, which introduces the problem, indicates that modified asphalt binders show shear thinning characteristics and that their viscosity depends on shear rate. On the other hand, the viscosity of unmodified asphalt binders does not change as the shear rate changes. Because the current procedure does not include the effect of shear rate, it works well for unmodified asphalt binders but does not work for modified asphalt binders.
Chapter 2 provides important background information on viscosity calculations and flow types. This knowledge is essential in understanding the problem and the proposed method for calculating mixing and compaction temperatures. The chapter reviews current methods for measuring viscosity at high temperatures, and then explains the strengths and shortcomings of these methods. Finally, the current procedure for calculating mixing and compaction temperatures is presented.
In Chapter 3, equipment and materials used for this study are briefly explained. For this study, two different mix designs and seven different asphalt binders were used. Verification of the binder’s performance grading (PG) was conducted for all the binders used in this study. Bending beam rheometer, dynamic shear rheometer, rotational viscometer, rolling thin film oven, and pressure aging vessel were used for PG verification. In this project, one Superpave mix and one special mix were used. This chapter presents the research methodology and the experimental design.
Chapter 4 presents the test results. Shear rate during compaction is estimated by using these test values. To estimate the shear rate, the specimens were first compacted at different temperatures. Based on the results, the relationship between the density values of the specimens and the compaction temperatures were estimated for each mix and binder. These relations were used to estimate the shear rate during compaction.
In Chapter 5, some examples are presented to indicate how the proposed approach could be utilized in practice. The binders described in this chapter include PG 76-22 (multigrade), PG 70-22 (SBR modified), PG 76-22 (SBS modified), PG 76-22 (tire rubber modified), and PG 70-22 (SBS modified). It was found that the mixing and compaction temperatures will be about 10 to 40 �C lower when the shear rate is taken into account.
Finally, Chapter 6 presents the summary, conclusions, and recommendations derived from the discussions in this report.

4
�
5
CHAPTER 2. BACKGROUND
This chapter provides important background information on mixing and compaction, viscosity calculations, and flow types. Such information is essential to an understanding of the problem and of the proposed method for calculating mixing and compaction temperatures. A review of current methods for measuring viscosity at high temperatures is presented, and strengths and shortcomings of these methods are explained. Finally, the current procedure for calculating mixing and compaction temperatures is presented.
MIXING AND COMPACTION
Asphalt is a viscoelastic material. The term viscoelastic means that asphalt shows both viscous and elastic behavior, depending on such variables as temperature and time of loading (McGennis 1995). At high temperatures, asphalt behaves like a viscous liquid and flows, and at low temperatures, asphalt behaves like an elastic solid. At intermediate temperatures, asphalt exhibits both viscous and elastic characteristics. When asphalt is heated, it acts as a lubricant, allowing binder to be mixed with aggregate. After cooling, the asphalt acts as a glue to hold the aggregates together.
In the mixing process, the aggregates are first blended, heated, and dried. Then the aggregates and the asphalt binder are heated to the mixing temperature. All the equipment used for mixing are heated to the mixing temperature. Subsequently, the aggregate and the binder are mixed. For this process, the asphalt binder should be fluid enough for uniform mixing.
After mixing, the mixture is compacted at the compaction temperature. The goal of compaction is to reach the optimum air void content. At compaction temperature, asphalt should be fluid enough to act as a lubricant in the compaction process, allowing the movement of the aggregates into a dense configuration. If the compaction temperature cools down, the asphalt becomes very stiff and compaction becomes extremely difficult (Roberts et al. 1996).
BASIC TERMINOLOGY FOR VISCOSITY CALCULATIONS
Rheology is the science dealing with the flow or deformation of matter. Rheology of asphalt binder involves the flow properties at both high and low temperatures. Rheological properties of asphalt binders are measured at high temperatures, since asphalt cements are encountered at high temperatures in processing and in application. They are also measured at low temperatures, because asphalt binders are subjected to low temperatures in service. Under hot conditions, asphalt binders behave like viscous liquids and will, accordingly, flow. At cold temperatures, asphalt cements behave like elastic solids. At intermediate temperatures, asphalt binders exhibit the characteristics of both viscous liquids and elastic
6
solids. No single instrument can be used to evaluate asphalt over a wide range of temperatures (e.g., -20 to 180 �C) (Asphalt Institute 1989).
Viscosity
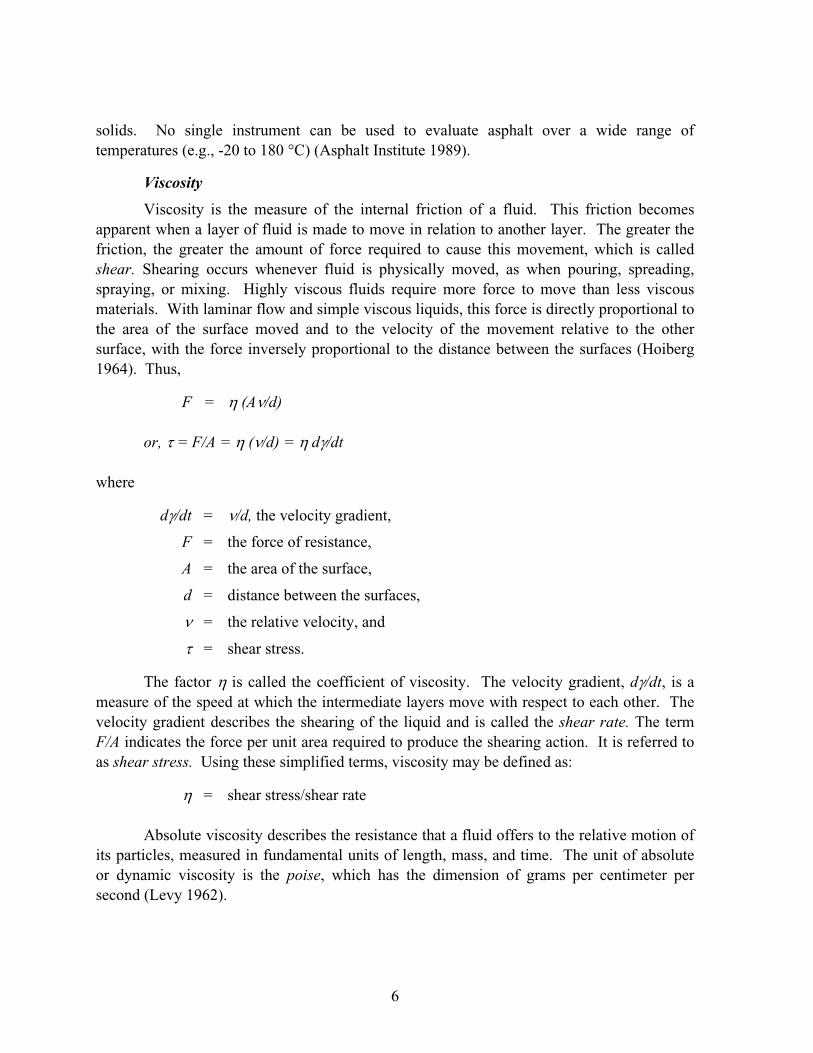
Viscosity is the measure of the internal friction of a fluid. This friction becomes apparent when a layer of fluid is made to move in relation to another layer. The greater the friction, the greater the amount of force required to cause this movement, which is called shear. Shearing occurs whenever fluid is physically moved, as when pouring, spreading, spraying, or mixing. Highly viscous fluids require more force to move than less viscous materials. With laminar flow and simple viscous liquids, this force is directly proportional to the area of the surface moved and to the velocity of the movement relative to the other surface, with the force inversely proportional to the distance between the surfaces (Hoiberg 1964). Thus,
F = � (A�/d)
or, � = F/A = � (�/d) = � d�/dt
where
d�/dt = �/d, the velocity gradient,
F = the force of resistance,
A = the area of the surface,
d = distance between the surfaces,
� = the relative velocity, and
� = shear stress.
The factor � is called the coefficient of viscosity. The velocity gradient, d�/dt, is a measure of the speed at which the intermediate layers move with respect to each other. The velocity gradient describes the shearing of the liquid and is called the shear rate. The term F/A indicates the force per unit area required to produce the shearing action. It is referred to as shear stress. Using these simplified terms, viscosity may be defined as:
� = shear stress/shear rate
Absolute viscosity describes the resistance that a fluid offers to the relative motion of its particles, measured in fundamental units of length, mass, and time. The unit of absolute or dynamic viscosity is the poise, which has the dimension of grams per centimeter per second (Levy 1962).
7
There are several parameters affecting rheological properties of asphalt binders. Temperature is one of the most obvious factors that can have an effect on the rheological behavior of asphalt cement. Because asphalt cements are subjected to large temperature variations, consideration of the effect of temperature on viscosity is essential (Wegan et al. 1999).
Shear rate is an important factor to consider in evaluating the rheological behavior of modified asphalt binders. These materials usually show non-Newtonian, pseudoplastic flow behavior. Asphalt binders are subjected to a variety of shear rates during construction. If these are not known, an estimate should be made. Viscosity measurements should then be as close as possible to the estimated values.
The condition of the sample and its environment can have considerable effect on the results of the measurements. The time elapsed under conditions of shear obviously affects thixotropic and rheopectic materials (Sherman 1994).
Previous history of the material is also important. What has happened to asphalt prior to a viscosity measurement can significantly affect the result. Thus, storage conditions and sample preparation techniques must be designed to minimize aging effect.
The amount of additives, such as polymers and solvents, is another factor affecting the viscosity of asphalts.
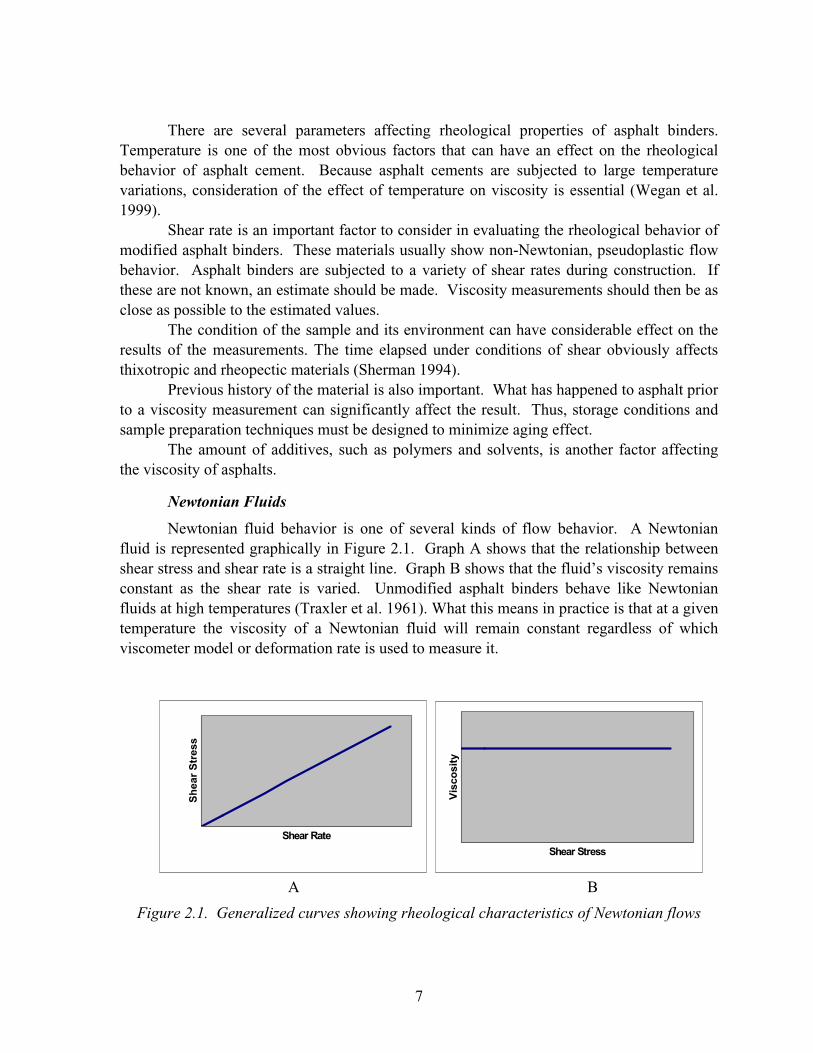
Newtonian Fluids
Newtonian fluid behavior is one of several kinds of flow behavior. A Newtonian fluid is represented graphically in Figure 2.1. Graph A shows that the relationship between shear stress and shear rate is a straight line. Graph B shows that the fluid’s viscosity remains constant as the shear rate is varied. Unmodified asphalt binders behave like Newtonian fluids at high temperatures (Traxler et al. 1961). What this means in practice is that at a given temperature the viscosity of a Newtonian fluid will remain constant regardless of which viscometer model or deformation rate is used to measure it.
����������
����������
����������
�� ���
A B
Figure 2.1. Generalized curves showing rheological characteristics of Newtonian flows
8
Non-Newtonian Fluids
A non-Newtonian fluid is broadly defined as one for which the shear stress/shear rate relationship is not a constant. In other words, when shear rate is varied, shear stress does not vary in the same proportion. The viscosity of this kind of fluid will therefore vary as the shear rate changes.
The experimental parameters of a viscometer model deformation rate all have an effect on the measured viscosity of non-Newtonian fluids. This measured viscosity is called the apparent viscosity of the fluid and is accurate only when explicit experimental parameters are furnished and adhered to (Traxler et al. 1961).
Non-Newtonian flow is probably a mechanical proposition. As nonsymmetrical objects pass each other, as happens during flow, their size, shape, and cohesiveness will determine how much force is required to move them. At another rate of shear, the orientation of the particles may be different, and more or less force may be required to maintain motion. Nonsymmetrical objects are large molecules, colloidal particles, and other suspended particles, such as clay polymers (Sherman 1994).
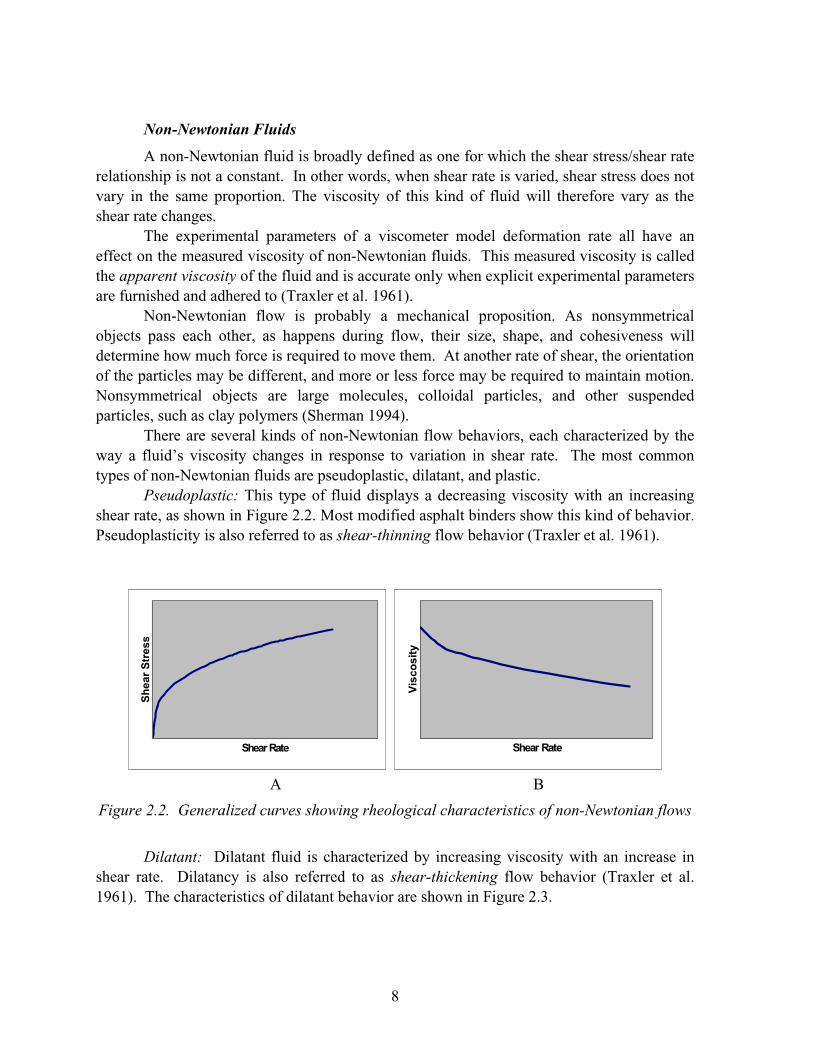
There are several kinds of non-Newtonian flow behaviors, each characterized by the way a fluid’s viscosity changes in response to variation in shear rate. The most common types of non-Newtonian fluids are pseudoplastic, dilatant, and plastic.
Pseudoplastic: This type of fluid displays a decreasing viscosity with an increasing shear rate, as shown in Figure 2.2. Most modified asphalt binders show this kind of behavior. Pseudoplasticity is also referred to as shear-thinning flow behavior (Traxler et al. 1961).
����������
����������
����������
�� ���
A B
Figure 2.2. Generalized curves showing rheological characteristics of non-Newtonian flows
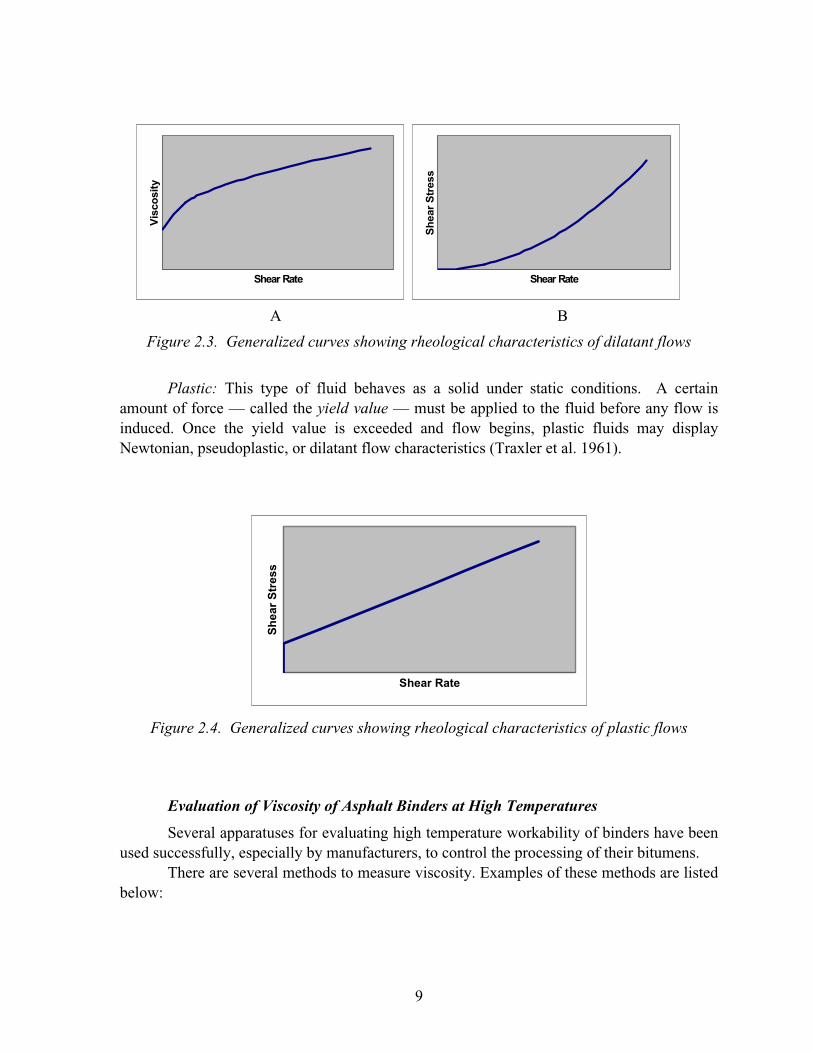
Dilatant: Dilatant fluid is characterized by increasing viscosity with an increase in
shear rate. Dilatancy is also referred to as shear-thickening flow behavior (Traxler et al. 1961). The characteristics of dilatant behavior are shown in Figure 2.3.
9
����������
�� ���
����������
����������
A B
Figure 2.3. Generalized curves showing rheological characteristics of dilatant flows
Plastic: This type of fluid behaves as a solid under static conditions. A certain
amount of force — called the yield value — must be applied to the fluid before any flow is induced. Once the yield value is exceeded and flow begins, plastic fluids may display Newtonian, pseudoplastic, or dilatant flow characteristics (Traxler et al. 1961).
�����������
����������
Figure 2.4. Generalized curves showing rheological characteristics of plastic flows
Evaluation of Viscosity of Asphalt Binders at High Temperatures
Several apparatuses for evaluating high temperature workability of binders have been used successfully, especially by manufacturers, to control the processing of their bitumens.
There are several methods to measure viscosity. Examples of these methods are listed below:
10
�� Simple shear of a thin film between parallel flat plates �� Shear between two rotating co-axial cylinders �� Flow of the liquid through a tube �� Fall of a sphere through the liquid in a wide tube �� Tension or compression tests of a bulk sample �� Tension or compression of a thin layer
Some of these methods are used to measure high temperature viscosities. There are
probably hundreds of viscometers that use these methods (Sherman 1994). Capillary tube and rotational viscometers are the most commonly used viscometers for asphalt viscosity measurements.
Capillary Tube: Probably the most widely used viscometer in the petroleum industry before SHRP was the capillary tube. This instrument was developed by Poiseulle in his experiments on the flow of blood in capillaries.
Two viscometers, the Cannon-Manning vacuum viscometer and the Asphalt Institute vacuum viscometer, are commonly used. ASTM D 2171 test method describes the test procedures. The viscometer is mounted in a thermostatically controlled, constant temperature water or oil bath. The viscometer tube is charged with asphalt cement through the large side until the level of asphalt cement reaches the filling line. After the filled viscometer tube is kept in the bath for a prescribed period of time to maintain the equilibrium temperature, a partial vacuum is applied to the small side of the viscometer tube to cause the asphalt cement to flow. Application of a partial vacuum is necessary because the asphalt cement can be too viscous. A vacuum control device and a vacuum pump are needed as part of the testing equipment after the asphalt cement starts to flow. The time required for it to flow between two timing marks is measured. The measured time is multiplied by the calibration factor for the viscometer tube to obtain the value for viscosity in poises (Roberts 1996).
The range of this viscometer is from approximately 10 to 100,000 poises. The rate of shear may be varied in this instrument, which permits measurements of the viscosities on non-Newtonian fluids. Shear rate cannot be measured by using this viscometer.
Rotational Viscometers: The rotational viscometer is used to evaluate the high temperature workability of binders. This instrument, which employs a spindle rotating at a constant speed in the liquid, has been used successfully to measure viscosities below 1,000 poises. This method of measurement of viscosity is explained in AASHTO TP48. Rotational viscosity is determined by measuring the torque required to maintain a constant rotational speed of a cylindrical spindle while submerged in a sample at a constant temperature. The torque required to rotate the spindle at a constant speed is directly related to the viscosity of the binder sample, which is determined automatically by the viscometer. The drag produced on the spindle by the viscous material is indicated on a rotating dial by a pointer attached to the spindle shaft. Shear rate can be measured by using this viscometer (Sherman 1994).
11
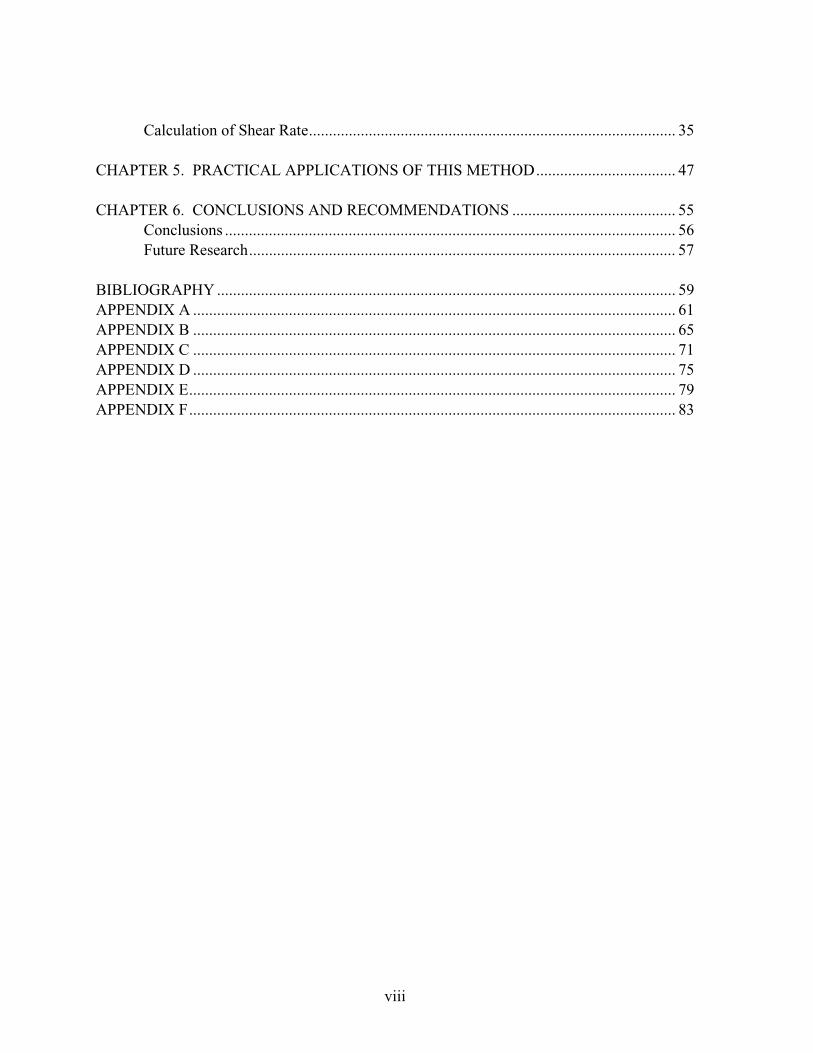
CURRENT PROCEDURE FOR CALCULATING MIXING AND COMPACTION TEMPERATURES
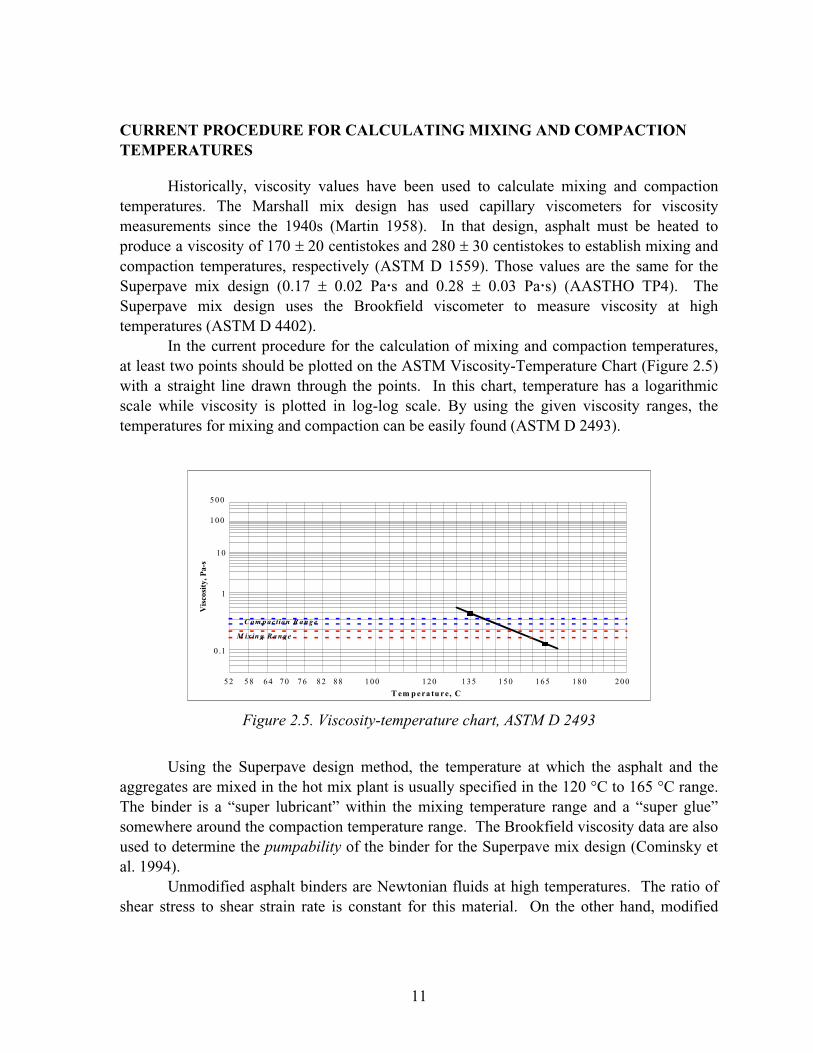
Historically, viscosity values have been used to calculate mixing and compaction temperatures. The Marshall mix design has used capillary viscometers for viscosity measurements since the 1940s (Martin 1958). In that design, asphalt must be heated to produce a viscosity of 170 ��20 centistokes and 280 ��30 centistokes to establish mixing and compaction temperatures, respectively (ASTM D 1559). Those values are the same for the Superpave mix design (0.17 � 0.02 Pa�s and 0.28 � 0.03 Pa�s) (AASTHO TP4). The Superpave mix design uses the Brookfield viscometer to measure viscosity at high temperatures (ASTM D 4402).
In the current procedure for the calculation of mixing and compaction temperatures, at least two points should be plotted on the ASTM Viscosity-Temperature Chart (Figure 2.5) with a straight line drawn through the points. In this chart, temperature has a logarithmic scale while viscosity is plotted in log-log scale. By using the given viscosity ranges, the temperatures for mixing and compaction can be easily found (ASTM D 2493).
��� ���� �����
� ���� ������
� ��
�
��
�� �� �� ��� ��� ��� ��� ���
� ���� � �����
�� ������ �� ���
� � ��� ��� ���
���
���
Figure 2.5. Viscosity-temperature chart, ASTM D 2493
Using the Superpave design method, the temperature at which the asphalt and the
aggregates are mixed in the hot mix plant is usually specified in the 120 �C to 165 �C range. The binder is a “super lubricant” within the mixing temperature range and a “super glue” somewhere around the compaction temperature range. The Brookfield viscosity data are also used to determine the pumpability of the binder for the Superpave mix design (Cominsky et al. 1994).
Unmodified asphalt binders are Newtonian fluids at high temperatures. The ratio of shear stress to shear strain rate is constant for this material. On the other hand, modified
12
asphalt binders show pseudoplastic characteristics at high temperatures and their viscosities depend on shear rate. Therefore, establishing a relationship between viscosity and temperature is not possible for modified asphalt binders by using the current procedure.
SHEAR RATE INSIDE THE SUPERPAVE GYRATORY COMPACTOR
According to Superpave mixture design, gyratory specimens are mixed and compacted at equiviscous binder temperatures corresponding to viscosities of 0.17 and 0.28 Pa.s, respectively. These viscosity values are specified in AASHTO TP4. In order to estimate mixing and compaction temperatures for Superpave mix design, a temperature-viscosity relationship for the binder should be developed as explained in ASTM D2493.
Neither ASTM D2493 nor AASHTO TP4 includes the effect of shear rate in calculation of compaction temperatures. Exclusion of the effect of shear rate leads to miscalculation of equiviscous temperatures, which eventually results in errors in the calculation of volumetric properties. At the same time excluding the effect of shear rate in viscosity measurements results in finding very high compaction temperatures, sometimes above 160°C.
It is important to understand the rheological behavior of asphalt binders at high temperatures to achieve proper compaction temperatures. Since most of the modified asphalt binders show pseudoplastic characteristics it is not possible to develop a temperature viscosity relation without including the effect of shear rate. Achieving equiviscous temperatures can be possible only by including the effect of shear rate in the SGC during viscosity measurements.
Prior to this study, there was not any experimental study on the calculation of shear rate in the SGC. Thus, there was a need for this kind of a study to understand the behavior of asphalt binders during compaction in the SGC. An experimental study was conducted with an objective of calculating the shear rate in the SGC. Calculation of the shear rate in the SGC can make it possible to include the effect of shear rate during viscosity measurements.
13
CHAPTER 3. EXPERIMENTAL PROGRAM
In this chapter, equipment and materials used for this study are briefly explained. For this study, two different mix designs and seven different asphalt binders were used. Verification of the binder’s performance grading (PG) was conducted for all the binders used in this study. Bending beam rheometer (BBR), dynamic shear rheometer (DSR), rotational viscometer, rolling thin film oven (RTFO), and pressure aging vessel (PAV) were used for PG verification. In this project, one Superpave mix (Mix 1) and one special mix (Mix 2) were designed. The research approach to develop the new method is discussed here. The research experiment is composed of three phases for this study. The objectives and the experimental designs for these phases are presented in this chapter.
The first mix used for this study, Mix 1, was designed according to AASHTO PP28-95, Standard Practice for Superpave Volumetric Design for HMA, and met all the Superpave requirements. For this mix, the design asphalt content was selected at 4 percent air voids at the selected number of design gyrations using the Pine model AFGC 125X compactor. This compactor unit was operated by the South Central Superpave Center. The Pine compactor was employed for this purpose because Mix 1 had previously been designed using the Pine compactor for roadway projects in Texas.�
A special mix, Mix 2, was prepared for the sake of comparison. This mix was composed of 4500-g natural sand with an asphalt binder content of 7 percent. No dust was used for this mix so as to eliminate the effect of dust on the stiffness of the binder.
Eighty specimens were produced. Specimens were individually batched and stored in plastic bags prior to use. The Pine model AFGC 125X compactor was used for preparation of the specimens throughout this study to reduce variability.
This chapter discusses the problems with the current procedure for calculating mixing and compaction temperatures. The approach to solving this problem and the difficulties encountered during the application of this approach are explained.
MATERIALS
Asphalt Binders
Seven different asphalt binders were used for this project. Two were unmodified asphalt binders while five were modified. The source of the binders and their grades are presented in Table 3.1. Performance graded binder specification (PG) was used to classify the asphalt binders. Requirements for the PG system�are given in Appendix A. Superpave binder tests were conducted to�verify that the binders met all the PG requirements. Results of these tests are presented in Appendix B.
14
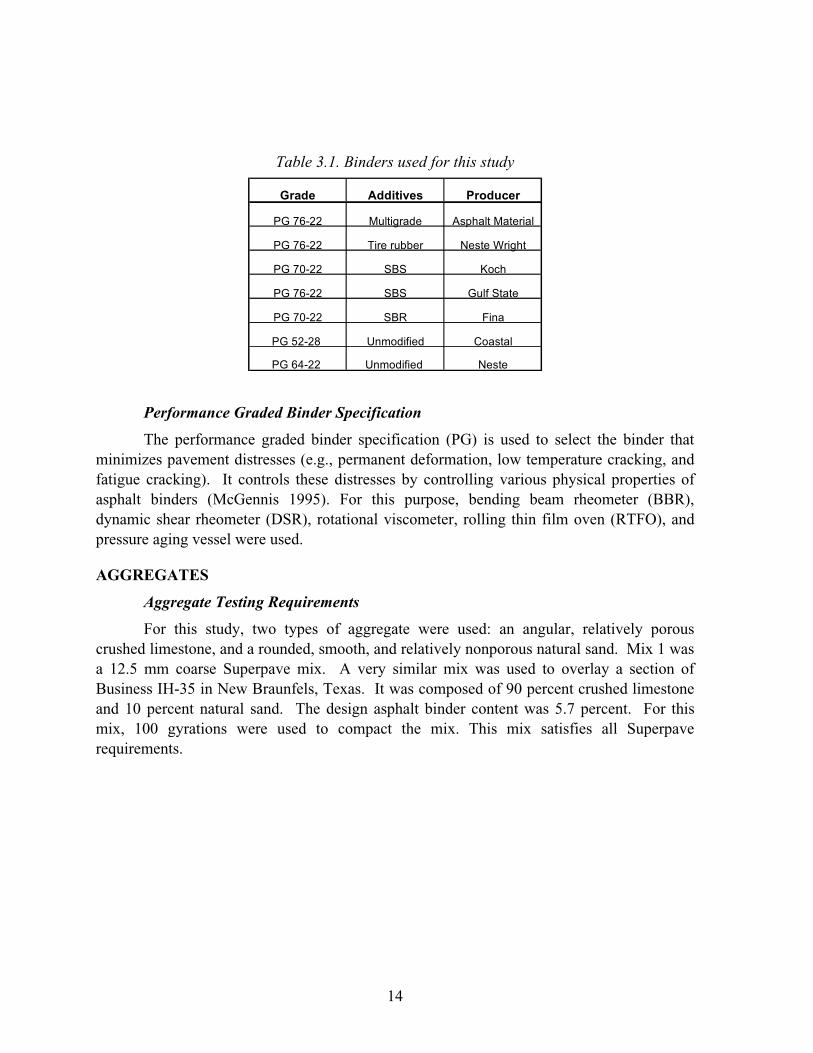
Table 3.1. Binders used for this study
����� �������� �� �����
�������� ��� ���� ��������������
�������� ���������� ��������� ��
�������� ��� ����
�������� ��� � ������
�������� ��! "�#�
���$���%� &#'��� ��� (�����
����)���� &#'��� ���� ����� �
Performance Graded Binder Specification
The performance graded binder specification (PG) is used to select the binder that minimizes pavement distresses (e.g., permanent deformation, low temperature cracking, and fatigue cracking). It controls these distresses by controlling various physical properties of asphalt binders (McGennis 1995). For this purpose, bending beam rheometer (BBR), dynamic shear rheometer (DSR), rotational viscometer, rolling thin film oven (RTFO), and pressure aging vessel were used. �
AGGREGATES
Aggregate Testing Requirements
For this study, two types of aggregate were used: an angular, relatively porous crushed limestone, and a rounded, smooth, and relatively nonporous natural sand. Mix 1 was a 12.5 mm coarse Superpave mix. A very similar mix was used to overlay a section of Business IH-35 in New Braunfels, Texas. It was composed of 90 percent crushed limestone and 10 percent natural sand. The design asphalt binder content was 5.7 percent. For this mix, 100 gyrations were used to compact the mix. This mix satisfies all Superpave requirements.
15
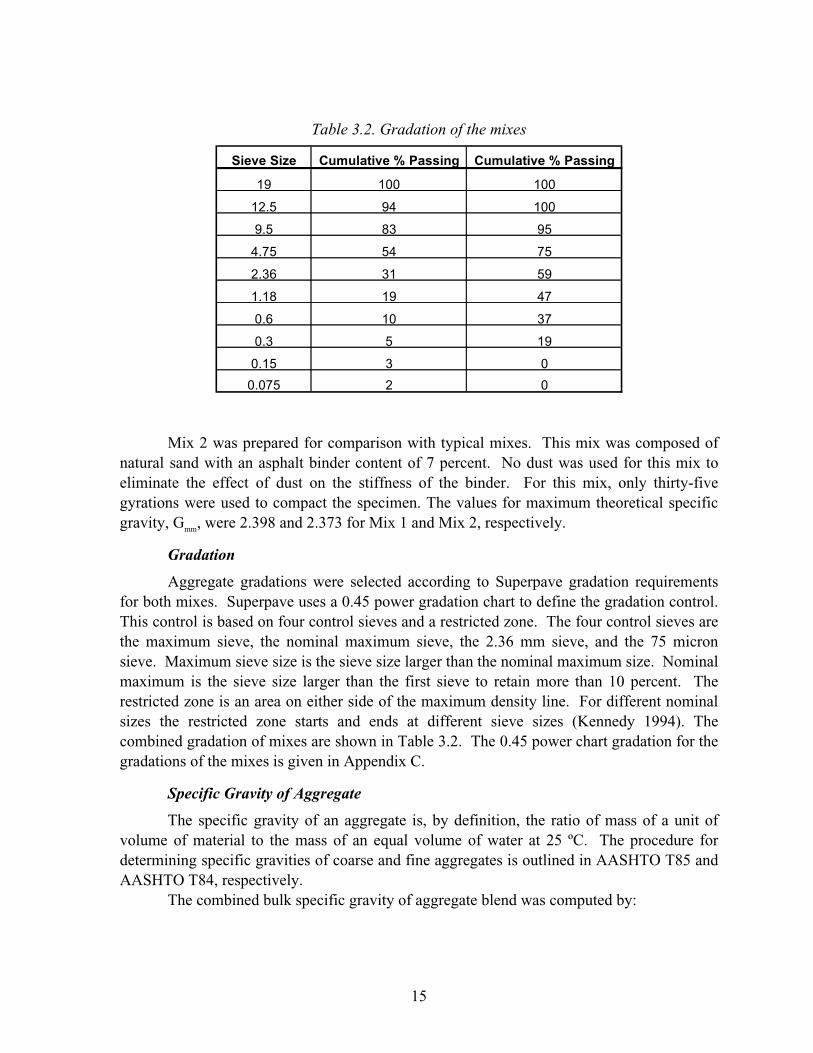
Table 3.2. Gradation of the mixes
���������� ������������������ ������������������
*+ *�� *��
*�,$ +) *��
+,$ %- +$
),�$ $) �$
�,-� -* $+
*,*% *+ )�
�,� *� -�
�,- $ *+
�,*$ - �
�,��$ � �
Mix 2 was prepared for comparison with typical mixes. This mix was composed of
natural sand with an asphalt binder content of 7 percent. No dust was used for this mix to eliminate the effect of dust on the stiffness of the binder. For this mix, only thirty-five gyrations were used to compact the specimen. The values for maximum theoretical specific gravity, Gmm, were 2.398 and 2.373 for Mix 1 and Mix 2, respectively.
Gradation
Aggregate gradations were selected according to Superpave gradation requirements for both mixes. Superpave uses a 0.45 power gradation chart to define the gradation control. This control is based on four control sieves and a restricted zone. The four control sieves are the maximum sieve, the nominal maximum sieve, the 2.36 mm sieve, and the 75 micron sieve. Maximum sieve size is the sieve size larger than the nominal maximum size. Nominal maximum is the sieve size larger than the first sieve to retain more than 10 percent. The restricted zone is an area on either side of the maximum density line. For different nominal sizes the restricted zone starts and ends at different sieve sizes (Kennedy 1994). The combined gradation of mixes are shown in Table 3.2. The 0.45 power chart gradation for the gradations of the mixes is given in Appendix C.
Specific Gravity of Aggregate
The specific gravity of an aggregate is, by definition, the ratio of mass of a unit of volume of material to the mass of an equal volume of water at 25 ºC. The procedure for determining specific gravities of coarse and fine aggregates is outlined in AASHTO T85 and AASHTO T84, respectively.
The combined bulk specific gravity of aggregate blend was computed by: �
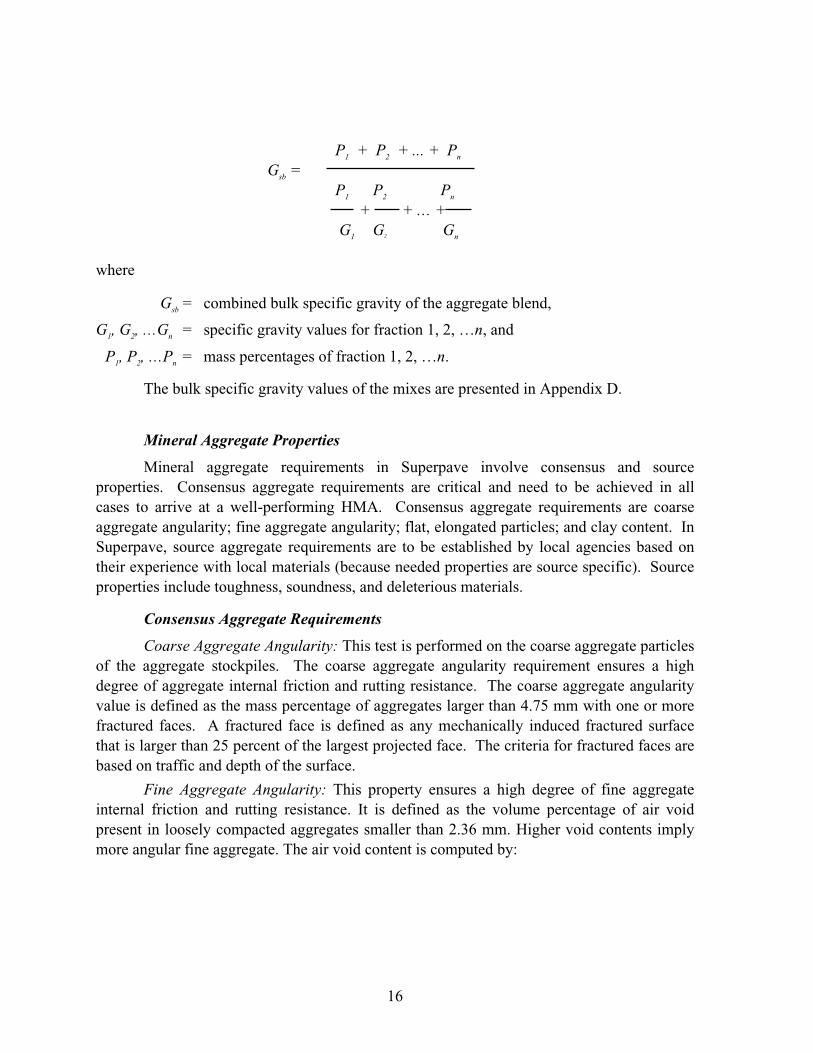
16
P1 + P2 + ... + Pn Gsb = P1 P2 Pn + + … + G1 G2 Gn where
Gsb = combined bulk specific gravity of the aggregate blend,
G1, G2, …Gn = specific gravity values for fraction 1, 2, …n, and
P1, P2, …Pn = mass percentages of fraction 1, 2, …n.
The bulk specific gravity values of the mixes are presented in Appendix D.
Mineral Aggregate Properties
Mineral aggregate requirements in Superpave involve consensus and source properties. Consensus aggregate requirements are critical and need to be achieved in all cases to arrive at a well-performing HMA. Consensus aggregate requirements are coarse aggregate angularity; fine aggregate angularity; flat, elongated particles; and clay content. In Superpave, source aggregate requirements are to be established by local agencies based on their experience with local materials (because needed properties are source specific). Source properties include toughness, soundness, and deleterious materials.
Consensus Aggregate Requirements
Coarse Aggregate Angularity: This test is performed on the coarse aggregate particles of the aggregate stockpiles. The coarse aggregate angularity requirement ensures a high degree of aggregate internal friction and rutting resistance. The coarse aggregate angularity value is defined as the mass percentage of aggregates larger than 4.75 mm with one or more fractured faces. A fractured face is defined as any mechanically induced fractured surface that is larger than 25 percent of the largest projected face. The criteria for fractured faces are based on traffic and depth of the surface.�
Fine Aggregate Angularity: This property ensures a high degree of fine aggregate internal friction and rutting resistance. It is defined as the volume percentage of air void present in loosely compacted aggregates smaller than 2.36 mm. Higher void contents imply more angular fine aggregate. The air void content is computed by:
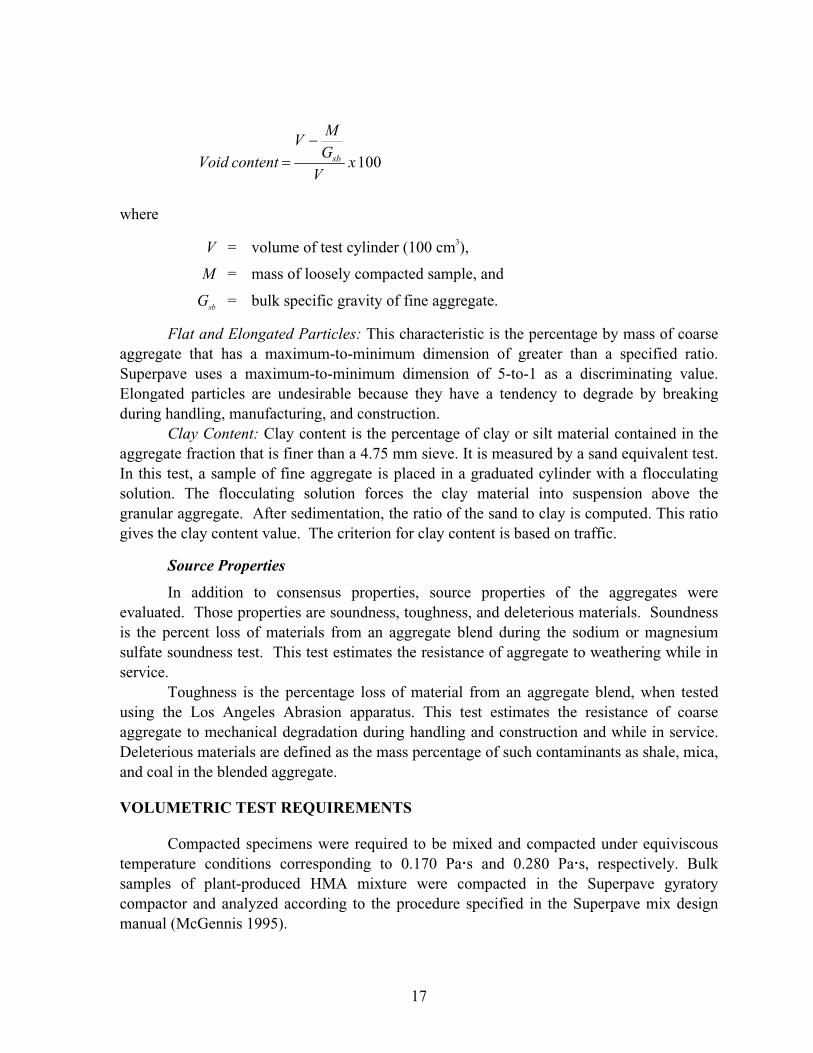
17
��� x V
GM
Vcontent Void sb
�
�
where
V = volume of test cylinder (100 cm3),
M = mass of loosely compacted sample, and
Gsb = bulk specific gravity of fine aggregate.
Flat and Elongated Particles: This characteristic is the percentage by mass of coarse aggregate that has a maximum-to-minimum dimension of greater than a specified ratio. Superpave uses a maximum-to-minimum dimension of 5-to-1 as a discriminating value. Elongated particles are undesirable because they have a tendency to degrade by breaking during handling, manufacturing, and construction.
Clay Content: Clay content is the percentage of clay or silt material contained in the aggregate fraction that is finer than a 4.75 mm sieve. It is measured by a sand equivalent test. In this test, a sample of fine aggregate is placed in a graduated cylinder with a flocculating solution. The flocculating solution forces the clay material into suspension above the granular aggregate. After sedimentation, the ratio of the sand to clay is computed. This ratio gives the clay content value. The criterion for clay content is based on traffic.
Source Properties
In addition to consensus properties, source properties of the aggregates were evaluated. Those properties are soundness, toughness, and deleterious materials. Soundness is the percent loss of materials from an aggregate blend during the sodium or magnesium sulfate soundness test. This test estimates the resistance of aggregate to weathering while in service.
Toughness is the percentage loss of material from an aggregate blend, when tested using the Los Angeles Abrasion apparatus. This test estimates the resistance of coarse aggregate to mechanical degradation during handling and construction and while in service. Deleterious materials are defined as the mass percentage of such contaminants as shale, mica, and coal in the blended aggregate.
VOLUMETRIC TEST REQUIREMENTS
Compacted specimens were required to be mixed and compacted under equiviscous temperature conditions corresponding to 0.170 Pa�s and 0.280 Pa�s, respectively. Bulk samples of plant-produced HMA mixture were compacted in the Superpave gyratory compactor and analyzed according to the procedure specified in the Superpave mix design manual (McGennis 1995).
18
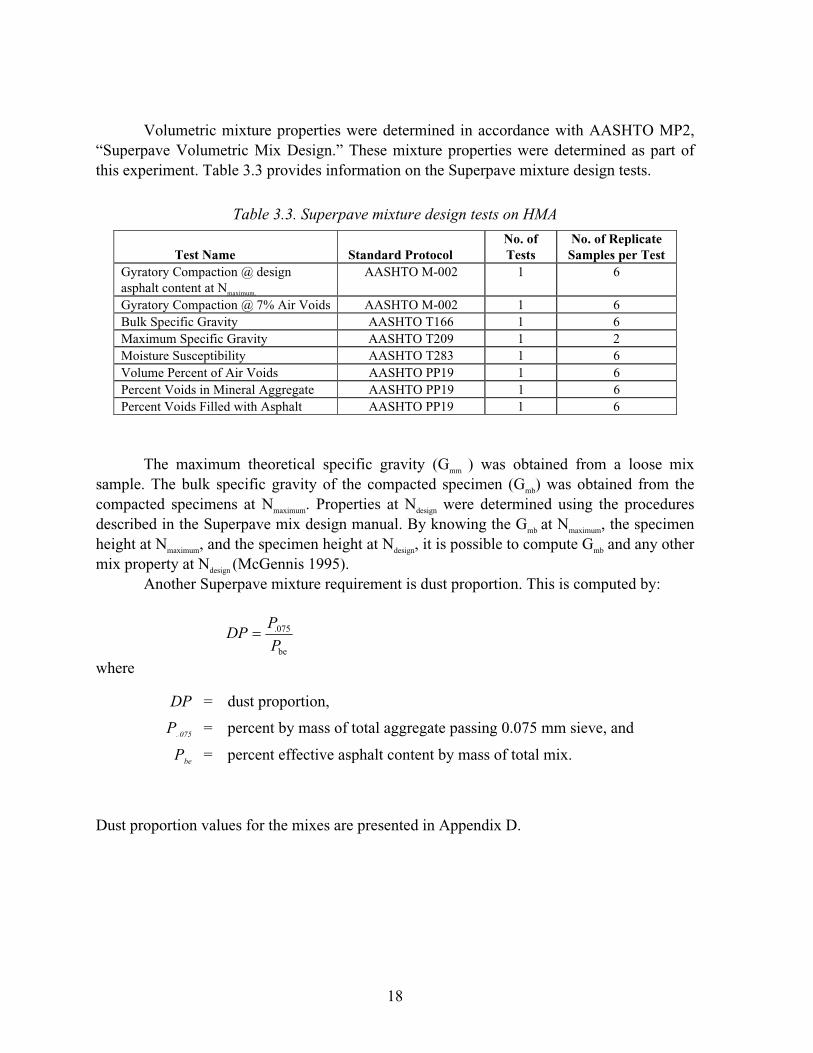
Volumetric mixture properties were determined in accordance with AASHTO MP2, “Superpave Volumetric Mix Design.” These mixture properties were determined as part of this experiment. Table 3.3 provides information on the Superpave mixture design tests.
Table 3.3. Superpave mixture design tests on HMA
Test Name
Standard Protocol
No. of Tests
No. of Replicate Samples per Test
Gyratory Compaction @ design asphalt content at Nmaximum.
AASHTO M-002 1 6
Gyratory Compaction @ 7% Air Voids AASHTO M-002 1 6 Bulk Specific Gravity AASHTO T166 1 6 Maximum Specific Gravity AASHTO T209 1 2 Moisture Susceptibility AASHTO T283 1 6 Volume Percent of Air Voids AASHTO PP19 1 6 Percent Voids in Mineral Aggregate AASHTO PP19 1 6 Percent Voids Filled with Asphalt AASHTO PP19 1 6
�
The maximum theoretical specific gravity (Gmm
� ) was obtained from a loose mix sample. The bulk specific gravity of the compacted specimen (Gmb) was obtained from the compacted specimens at Nmaximum. Properties at Ndesign were determined using the procedures described in the Superpave mix design manual. By knowing the Gmb at Nmaximum, the specimen height at Nmaximum, and the specimen height at Ndesign, it is possible to compute Gmb and any other mix property at Ndesign (McGennis 1995).
Another Superpave mixture requirement is dust proportion. This is computed by:
�
���
P
PDP �
where
DP = dust proportion,
P..075 = percent by mass of total aggregate passing 0.075 mm sieve, and
Pbe = percent effective asphalt content by mass of total mix.
Dust proportion values for the mixes are presented in Appendix D.
19
EQUIPMENT USED AND TESTS CONDUCTED
For this study, a Brookfield rotational viscometer was used for viscosity measurements at high temperatures. By using this rotational viscometer, the shear rate and the temperature can be controlled. Brookfield viscometer data were used to estimate the relation between viscosity and shear rate. The shear rate that the Brookfield can apply on the binder is between 0.1 and 93 1/s when spindles number 21 and 27 are used. To verify the results obtained from a rotational viscometer, DSR and cone-and-plate viscometers were used. Other than the Brookfield viscometer, DSR, BBR, RTFO, and PAV were used for PG verification of the asphalt binders.
For compaction, a Pine model AFGC 125X Superpave gyratory compactor was used. All of the specimens were compacted with this equipment. A single operator was used throughout the experiments.
A series of specimens were produced for the two mixes. Aggregates were weighed into 4550-g and 4500-g batches for Mix 1 and Mix 2, respectively. The asphalt binder content was 5.7 percent for Mix 1 and 7 percent for Mix 2.
Superpave Asphalt Binder Tests
The performance graded binder specification (PG) for Superpave controls the binder quality for such pavement distresses as permanent deformation, low temperature cracking, and fatigue cracking. The specification controls these distresses by controlling various physical properties measured with several pieces of equipment. For this purpose, bending beam rheometer (BBR), dynamic shear rheometer (DSR), rotational viscometer, rolling thin film oven (RTFO), and pressure aging vessel are used. These tests are briefly explained. In this study, verification of the performance grading (PG) was conducted for all the binders. The results of the following tests are presented in Appendix B.
Rolling Thin Film Oven: The rolling thin film oven (RTFO) test simulates the aging that occurs in asphalt plants during manufacturing of hot mix asphalt. Thus, in addition to the tests conducted on the unaged binder, the binder was aged using the RTFO. After this aging, the DSR was run on these asphalt binders.
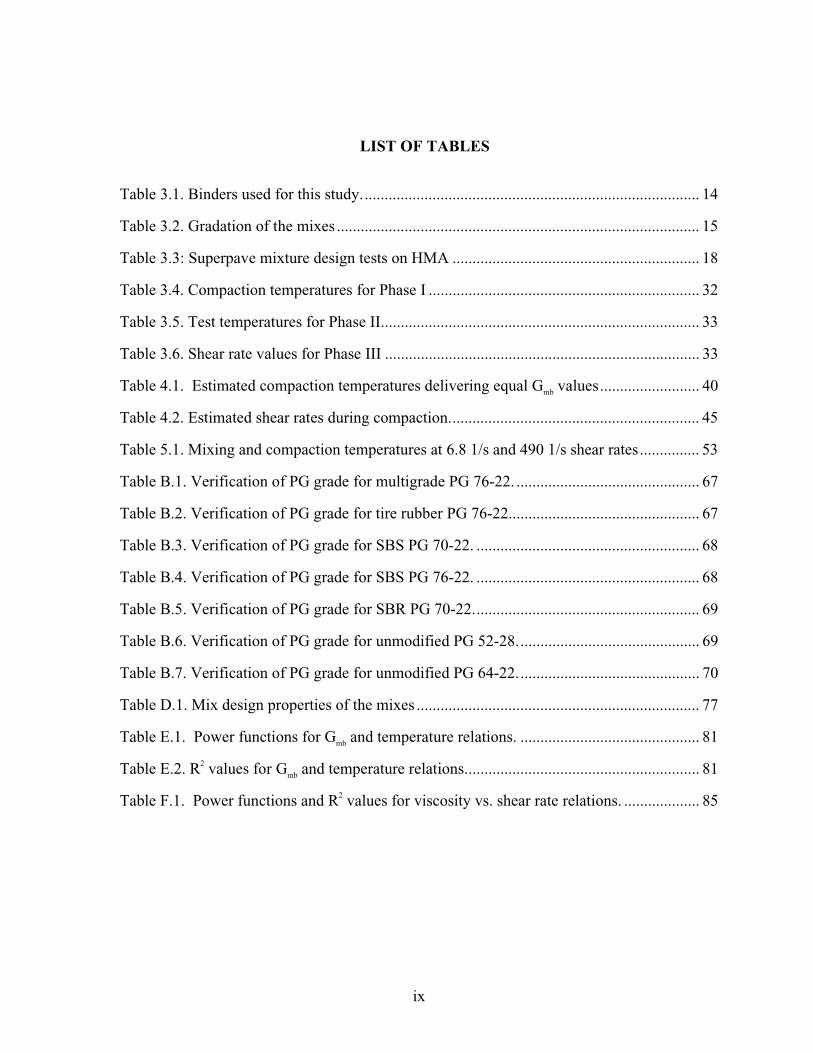
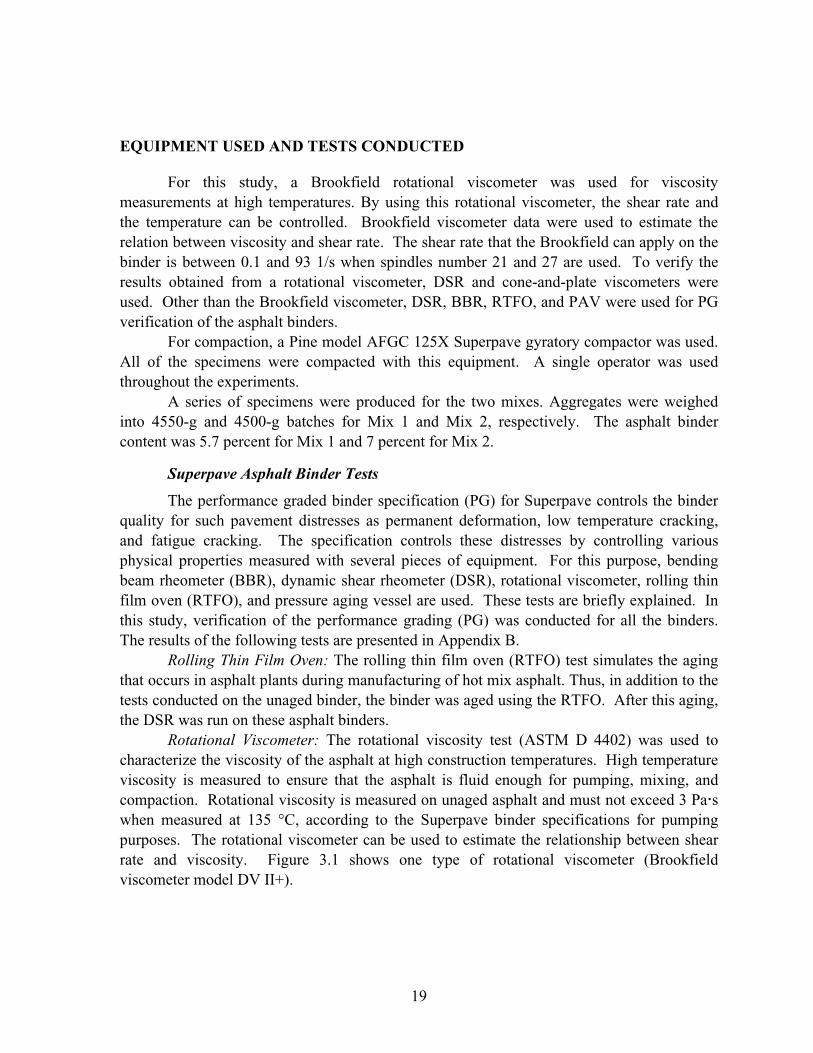
Rotational Viscometer: The rotational viscosity test (ASTM D 4402) was used to characterize the viscosity of the asphalt at high construction temperatures. High temperature viscosity is measured to ensure that the asphalt is fluid enough for pumping, mixing, and compaction. Rotational viscosity is measured on unaged asphalt and must not exceed 3 Pa�s when measured at 135 �C, according to the Superpave binder specifications for pumping purposes. The rotational viscometer can be used to estimate the relationship between shear rate and viscosity. Figure 3.1 shows one type of rotational viscometer (Brookfield viscometer model DV II+).
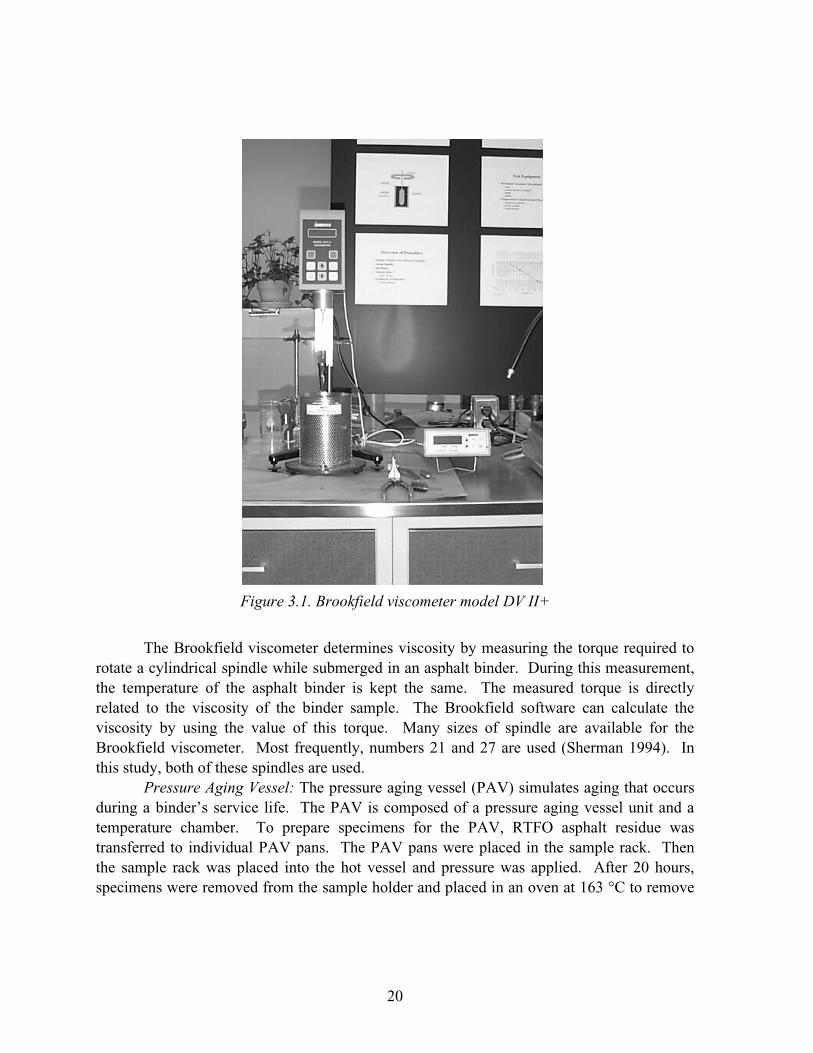
20
Figure 3.1. Brookfield viscometer model DV II+
The Brookfield viscometer determines viscosity by measuring the torque required to
rotate a cylindrical spindle while submerged in an asphalt binder. During this measurement, the temperature of the asphalt binder is kept the same. The measured torque is directly related to the viscosity of the binder sample. The Brookfield software can calculate the viscosity by using the value of this torque. Many sizes of spindle are available for the Brookfield viscometer. Most frequently, numbers 21 and 27 are used (Sherman 1994). In this study, both of these spindles are used.
Pressure Aging Vessel: The pressure aging vessel (PAV) simulates aging that occurs during a binder’s service life. The PAV is composed of a pressure aging vessel unit and a temperature chamber. To prepare specimens for the PAV, RTFO asphalt residue was transferred to individual PAV pans. The PAV pans were placed in the sample rack. Then the sample rack was placed into the hot vessel and pressure was applied. After 20 hours, specimens were removed from the sample holder and placed in an oven at 163 �C to remove
21
entrapped air from the samples. After aging the asphalt binders using the PAV, the DSR and BBR tests were conducted on the asphalt binders.
Dynamic Shear Rheometer: The dynamic shear rheometer (DSR) test (AASHTO TP5) was used to characterize binder stiffness when loaded in oscillatory shear. It measures the complex shear modulus (G*) and the phase angle (�). In Superpave, binder stiffness is designated by the stiffness parameter G*/sin �. Binder properties were measured in three states: the unaged binder, the RTFO-aged binder, and the RTFO-PAV-aged binder at the required temperatures shown in the Appendix A.
G*/sin � values and G*sin � values for the binders used in this study are shown in Appendix B for the original binder, the RTFO aged asphalt binders, and the PAV aged binders.
Bending Beam Rheometer: The bending beam rheometer (BBR) characterizes the low temperature stiffness and relaxation properties of binders. For this test, only the PAV-aged binders were used. This test measures creep stiffness (S) and logarithmic creep rate (m). Specification requirements are shown in Appendix A.
The creep stiffness value for the binder used was 138 MPa and the m-value was 0.324 at -12 �C.
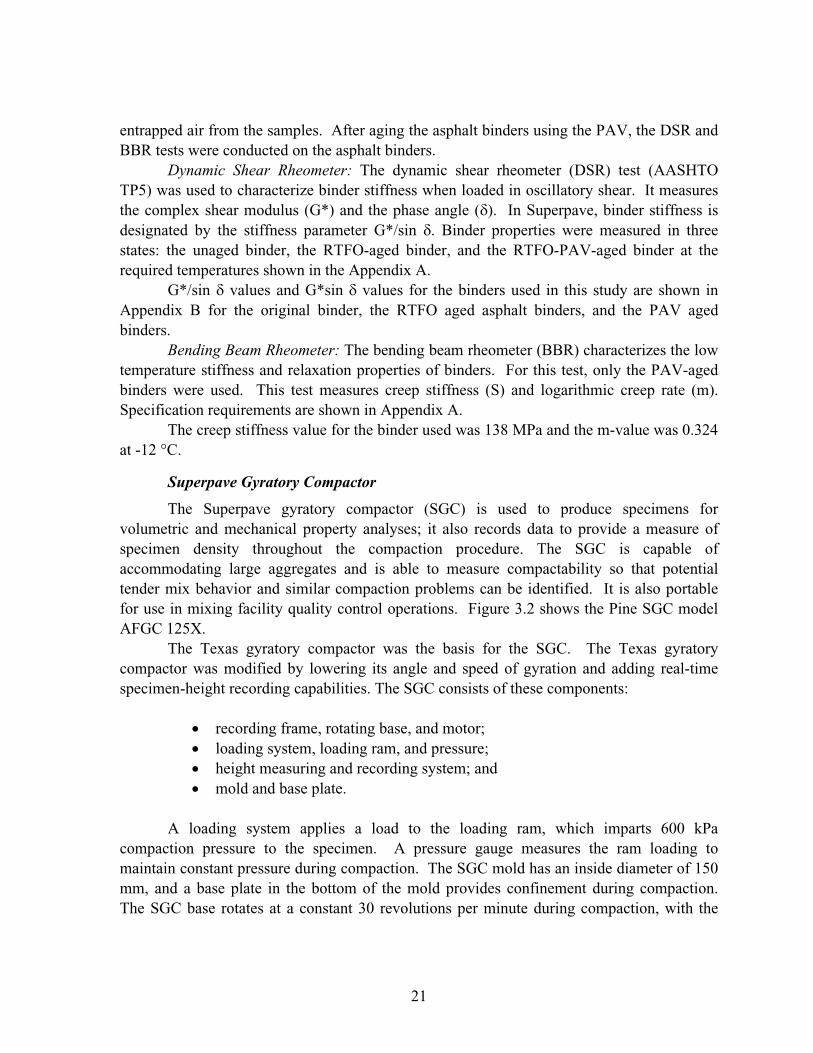
Superpave Gyratory Compactor
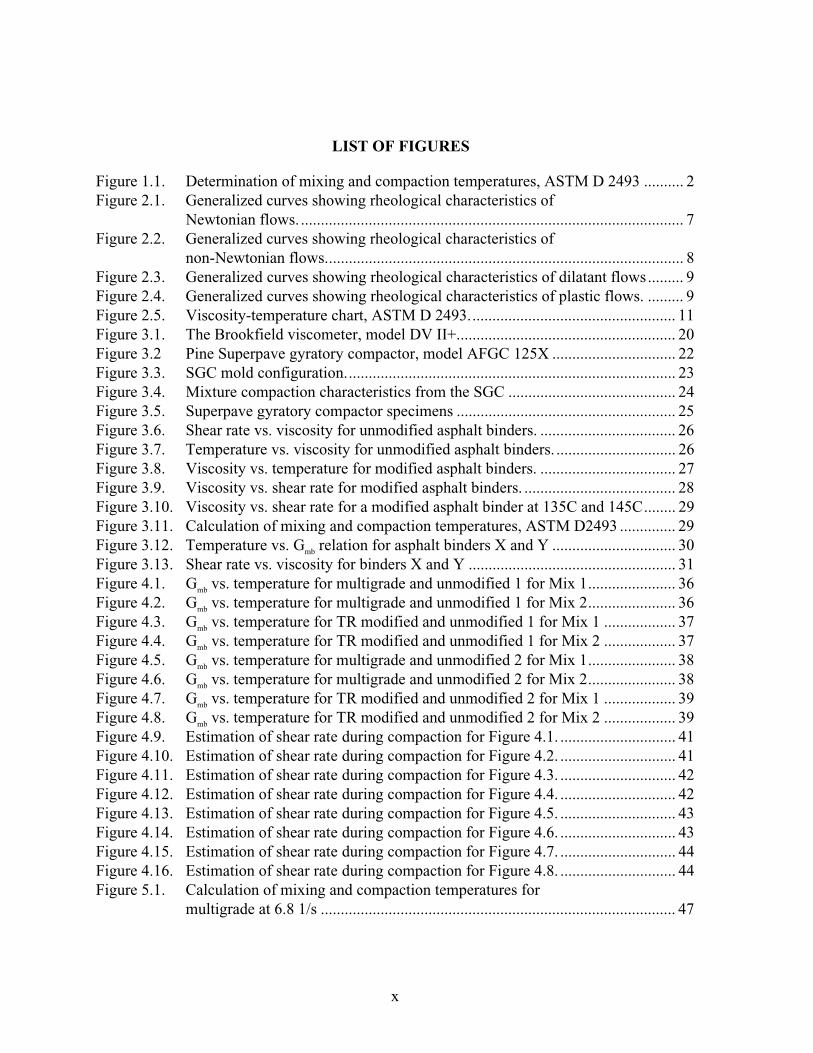
The Superpave gyratory compactor (SGC) is used to produce specimens for volumetric and mechanical property analyses; it also records data to provide a measure of specimen density throughout the compaction procedure. The SGC is capable of accommodating large aggregates and is able to measure compactability so that potential tender mix behavior and similar compaction problems can be identified. It is also portable for use in mixing facility quality control operations. Figure 3.2 shows the Pine SGC model AFGC 125X.
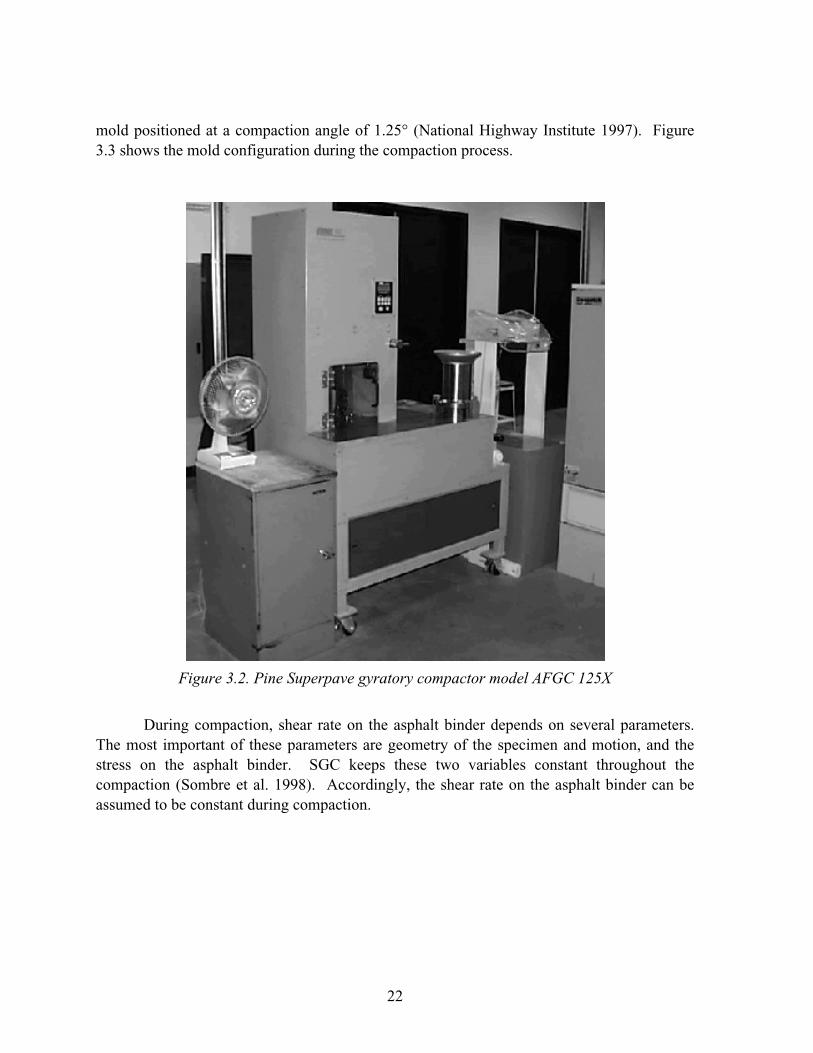
The Texas gyratory compactor was the basis for the SGC. The Texas gyratory compactor was modified by lowering its angle and speed of gyration and adding real-time specimen-height recording capabilities. The SGC consists of these components:
�
�� recording frame, rotating base, and motor; �� loading system, loading ram, and pressure; �� height measuring and recording system; and �� mold and base plate.
�
A loading system applies a load to the loading ram, which imparts 600 kPa compaction pressure to the specimen. A pressure gauge measures the ram loading to maintain constant pressure during compaction. The SGC mold has an inside diameter of 150 mm, and a base plate in the bottom of the mold provides confinement during compaction. The SGC base rotates at a constant 30 revolutions per minute during compaction, with the�
22
mold positioned at a compaction angle of 1.25° (National Highway Institute 1997).� �Figure 3.3 shows the mold configuration during the compaction process.
Figure 3.2. Pine Superpave gyratory compactor model AFGC 125X
During compaction, shear rate on the asphalt binder depends on several parameters.
The most important of these parameters are geometry of the specimen and motion, and the stress on the asphalt binder. SGC keeps these two variables constant throughout the compaction (Sombre et al. 1998). Accordingly, the shear rate on the asphalt binder can be assumed to be constant during compaction.�
23
�
�
��
�
�
�
���������������������������������������������������������������������
�
�
�
� � � � � � � � � ������� �
�
�
�
�
� � �
Figure 3.3. SGC mold configuration
�
Specimen height measurement is an important function of the SGC. By knowing the mass of the material placed in the mold and the specimen height, an estimate of specimen density can be made at any time throughout the compaction process. Specimen density is computed by dividing the mass by the volume of the specimen. Height is measured by recording the position of the ram throughout the test. By this method, a compaction characteristic is developed as the specimen is compacted.
�
����.����
��'��������
-�� /�����#������'�#���
*,�$��� �����
24
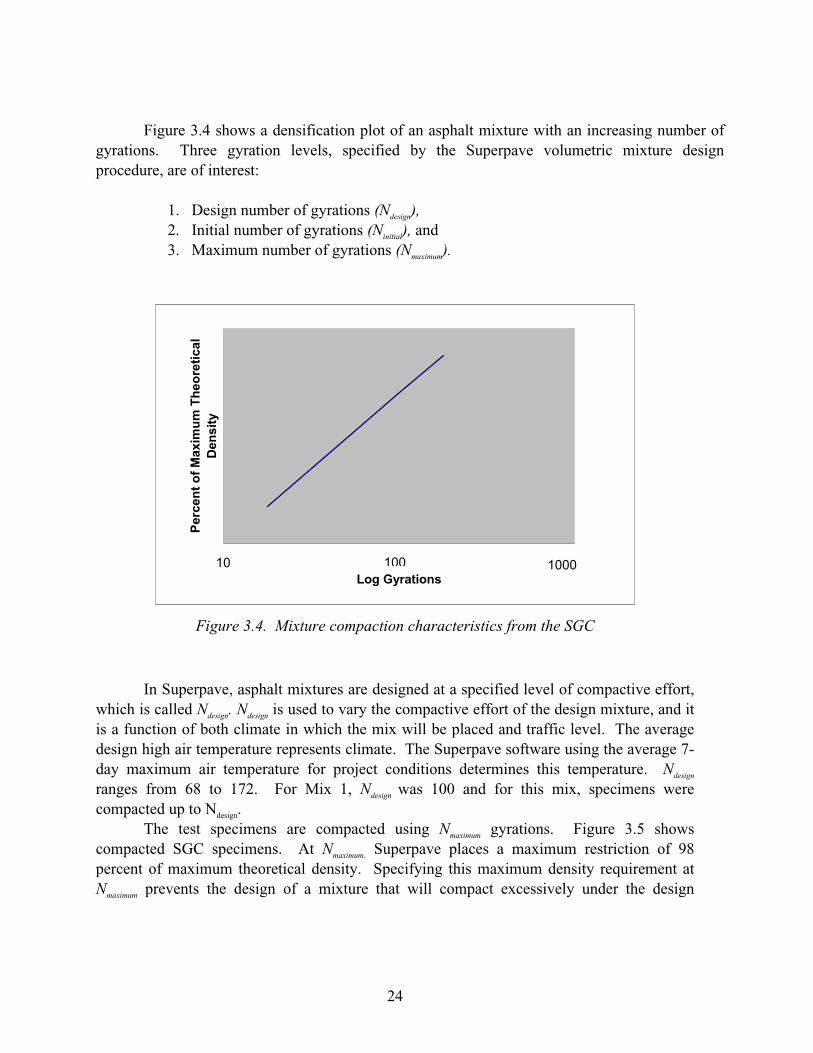
Figure 3.4 shows a densification plot of an asphalt mixture with an increasing number of gyrations. Three gyration levels, specified by the Superpave volumetric mixture design procedure, are of interest:
1. Design number of gyrations (Ndesign), 2. Initial number of gyrations (Ninitial), and 3. Maximum number of gyrations (Nmaximum).
� �������� ��
�������� ���������� �� ��������
!�����
�
Figure 3.4. Mixture compaction characteristics from the SGC
�
In Superpave, asphalt mixtures are designed at a specified level of compactive effort, which is called Ndesign. Ndesign is used to vary the compactive effort of the design mixture, and it is a function of both climate in which the mix will be placed and traffic level. The average design high air temperature represents climate. The Superpave software using the average 7-day maximum air temperature for project conditions determines this temperature. Ndesign ranges from 68 to 172. For Mix 1, Ndesign was 100 and for this mix, specimens were compacted up to Ndesign.
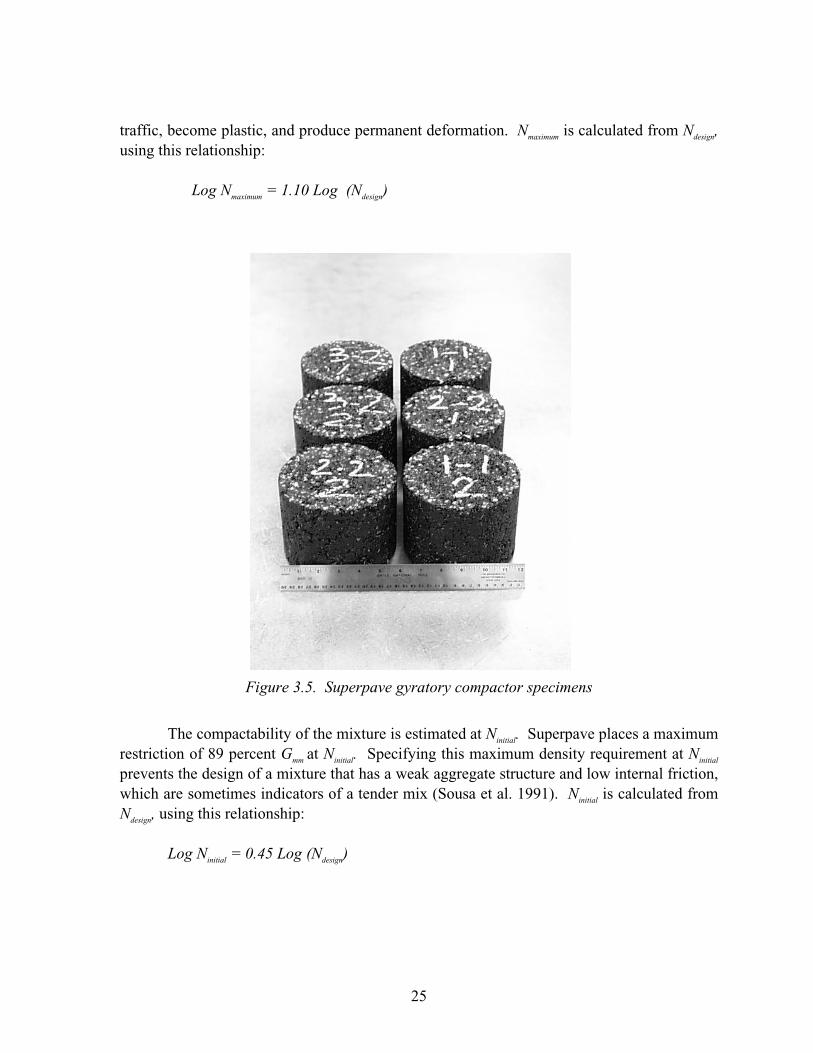
The test specimens are compacted using Nmaximum gyrations. Figure 3.5 shows compacted SGC specimens. At Nmaximum, Superpave places a maximum restriction of 98 percent of maximum theoretical density. Specifying this maximum density requirement at Nmaximum prevents the design of a mixture that will compact excessively� under the design
*����*�� *��
25
traffic, become plastic, and produce permanent deformation. Nmaximum is calculated from Ndesign, using this relationship:
Log Nmaximum = 1.10 Log (Ndesign)
�
Figure 3.5. Superpave gyratory compactor specimens
The compactability of the mixture is estimated at Ninitial. Superpave places a maximum
restriction of 89 percent Gmm at Ninitial. Specifying this maximum density requirement at Ninitial prevents the design of a mixture that has a weak aggregate structure and low internal friction, which are sometimes indicators of a tender mix (Sousa et al. 1991). Ninitial is calculated from Ndesign, using this relationship:
Log Ninitial = 0.45 Log (Ndesign)
26
DEFINITION OF THE PROBLEM
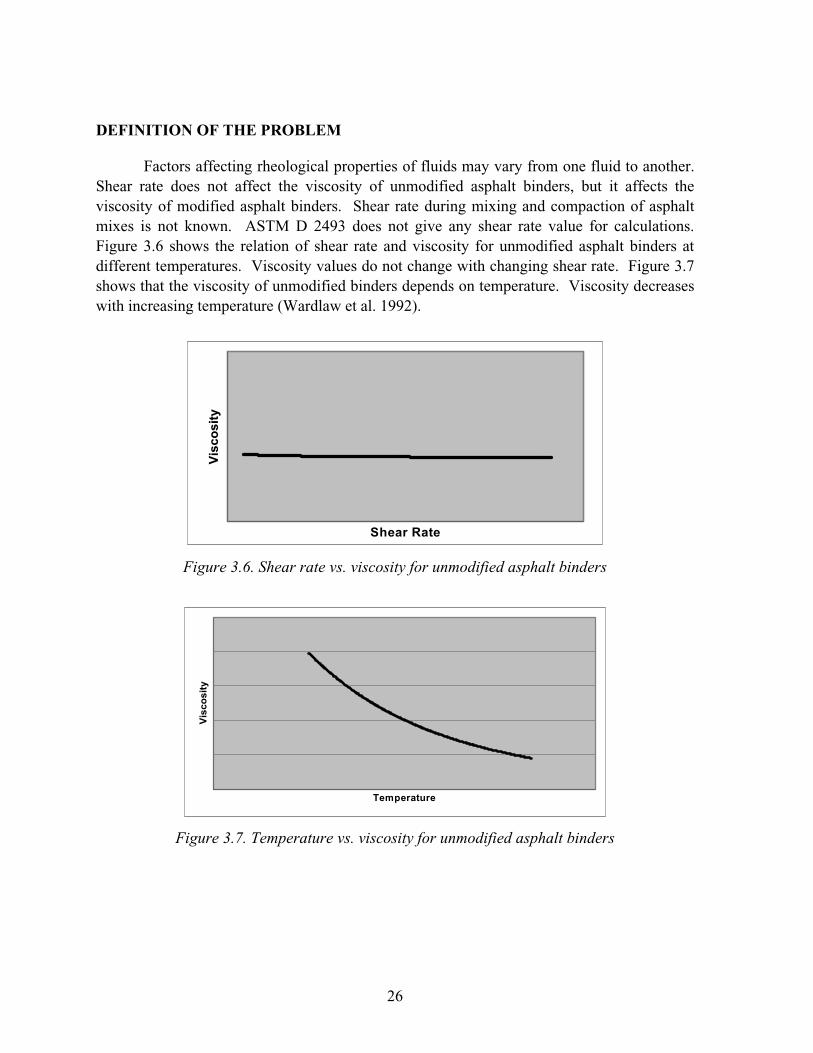
Factors affecting rheological properties of fluids may vary from one fluid to another. Shear rate does not affect the viscosity of unmodified asphalt binders, but it affects the viscosity of modified asphalt binders. Shear rate during mixing and compaction of asphalt mixes is not known. ASTM D 2493 does not give any shear rate value for calculations. Figure 3.6 shows the relation of shear rate and viscosity for unmodified asphalt binders at different temperatures. Viscosity values do not change with changing shear rate. Figure 3.7 shows that the viscosity of unmodified binders depends on temperature. Viscosity decreases with increasing temperature (Wardlaw et al. 1992).
����������
�� ����
Figure 3.6. Shear rate vs. viscosity for unmodified asphalt binders
��"�������
�� ���
Figure 3.7. Temperature vs. viscosity for unmodified asphalt binders
27
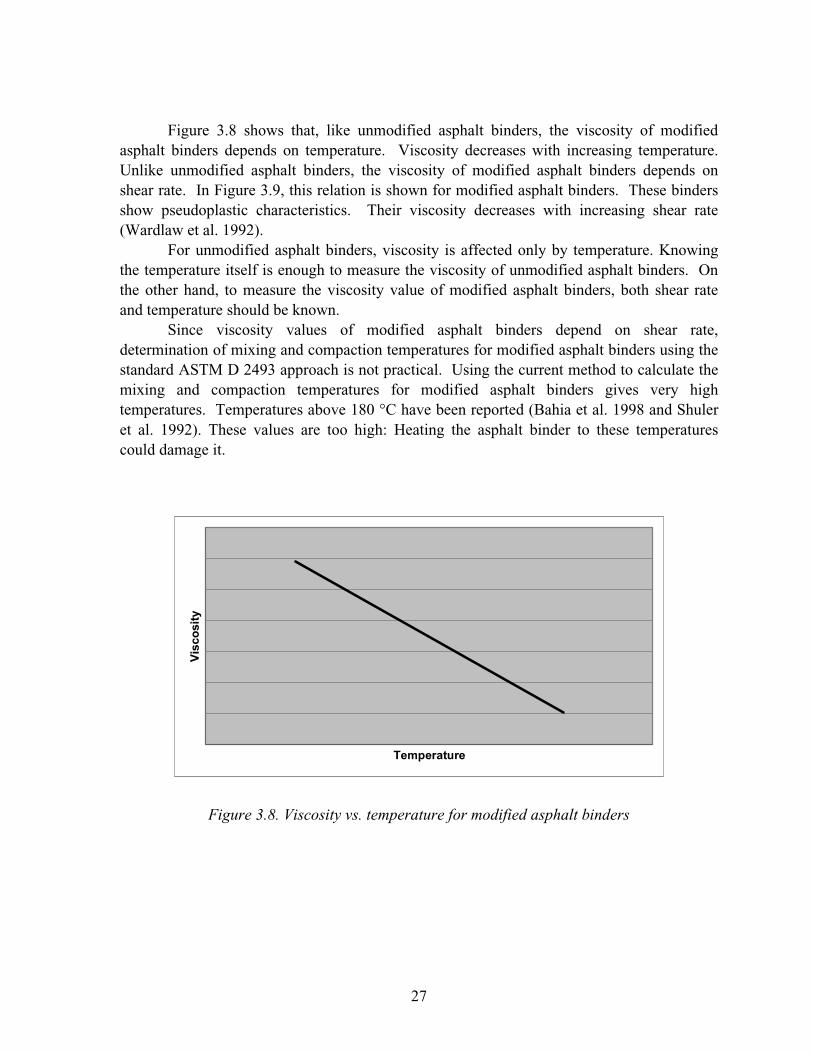
Figure 3.8 shows that, like unmodified asphalt binders, the viscosity of modified asphalt binders depends on temperature. Viscosity decreases with increasing temperature. Unlike unmodified asphalt binders, the viscosity of modified asphalt binders depends on shear rate. In Figure 3.9, this relation is shown for modified asphalt binders. These binders show pseudoplastic characteristics. Their viscosity decreases with increasing shear rate (Wardlaw et al. 1992).
For unmodified asphalt binders, viscosity is affected only by temperature. Knowing the temperature itself is enough to measure the viscosity of unmodified asphalt binders. On the other hand, to measure the viscosity value of modified asphalt binders, both shear rate and temperature should be known.
Since viscosity values of modified asphalt binders depend on shear rate, determination of mixing and compaction temperatures for modified asphalt binders using the standard ASTM D 2493 approach is not practical. Using the current method to calculate the mixing and compaction temperatures for modified asphalt binders gives very high temperatures. Temperatures above 180 �C have been reported (Bahia et al. 1998 and Shuler et al. 1992). These values are too high: Heating the asphalt binder to these temperatures could damage it.
��"�������
�� ���
Figure 3.8. Viscosity vs. temperature for modified asphalt binders
28
�
$��
*���
*$��
����
�$��
� *� �� -� )� $�
����������
�� ���
Figure 3.9. Viscosity vs. shear rate for modified asphalt binders
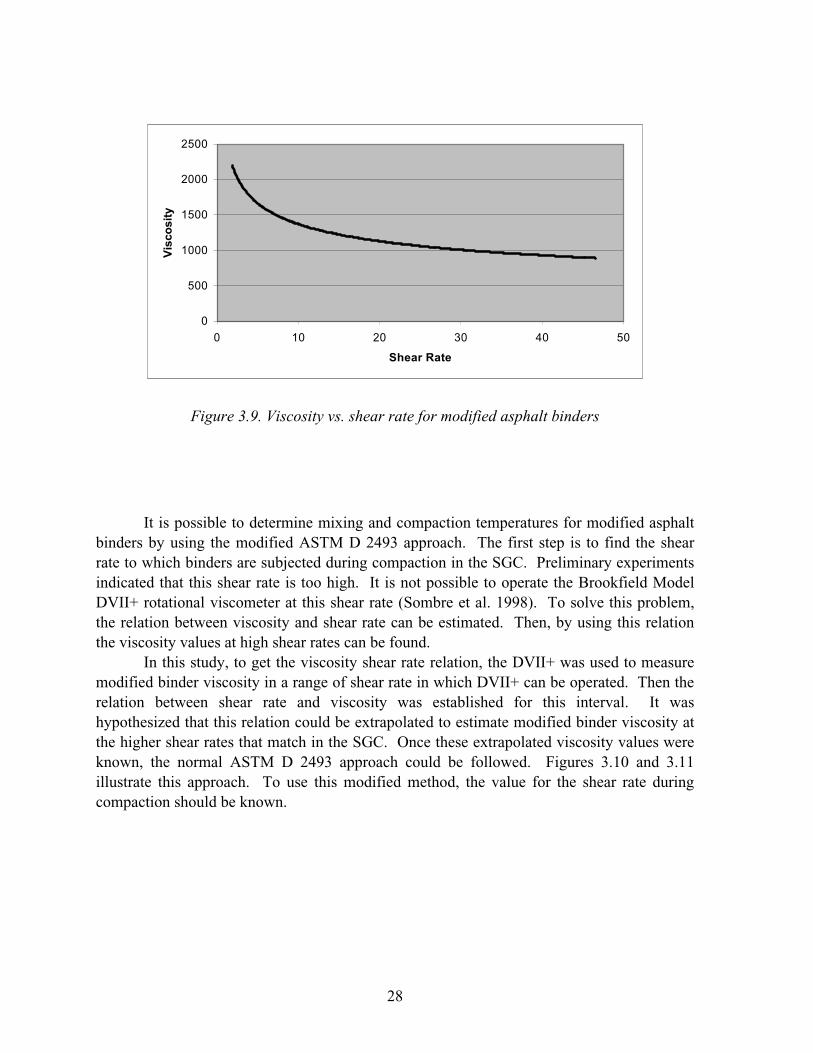
It is possible to determine mixing and compaction temperatures for modified asphalt
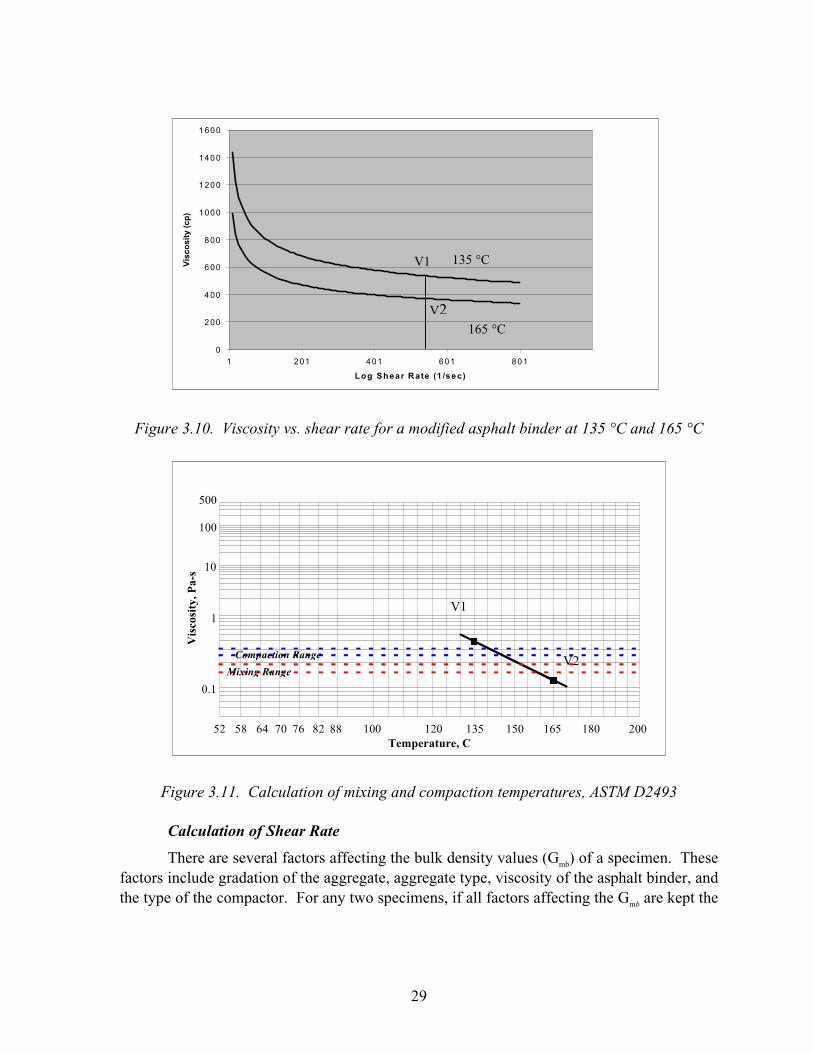
binders by using the modified ASTM D 2493 approach. The first step is to find the shear rate to which binders are subjected during compaction in the SGC. Preliminary experiments indicated that this shear rate is too high. It is not possible to operate the Brookfield Model DVII+ rotational viscometer at this shear rate (Sombre et al. 1998). To solve this problem, the relation between viscosity and shear rate can be estimated. Then, by using this relation the viscosity values at high shear rates can be found.
In this study, to get the viscosity shear rate relation, the DVII+ was used to measure modified binder viscosity in a range of shear rate in which DVII+ can be operated. Then the relation between shear rate and viscosity was established for this interval. It was hypothesized that this relation could be extrapolated to estimate modified binder viscosity at the higher shear rates that match in the SGC. Once these extrapolated viscosity values were known, the normal ASTM D 2493 approach could be followed. Figures 3.10 and 3.11 illustrate this approach. To use this modified method, the value for the shear rate during compaction should be known.
29
Figure 3.10. Viscosity vs. shear rate for a modified asphalt binder at 135 °C and 165 °C
������������
� ���� ������
���
�
��
�� �� �� ��� ��� ��� ��� ���
�����������
�� �����������
� � ��� ��� ���
���
���
Figure 3.11. Calculation of mixing and compaction temperatures, ASTM D2493
Calculation of Shear Rate
There are several factors affecting the bulk density values (Gmb) of a specimen. These factors include gradation of the aggregate, aggregate type, viscosity of the asphalt binder, and the type of the compactor. For any two specimens, if all factors affecting the Gmb are kept the
V1
V2
�
� ��
) ��
� ��
% ��
* �� �
* �� �
* )� �
* �� �
* � �* ) �* � �* % �*
� �������������#$ %��&
�� ����#�"&
135 �C
165 �C
V1
V2
30
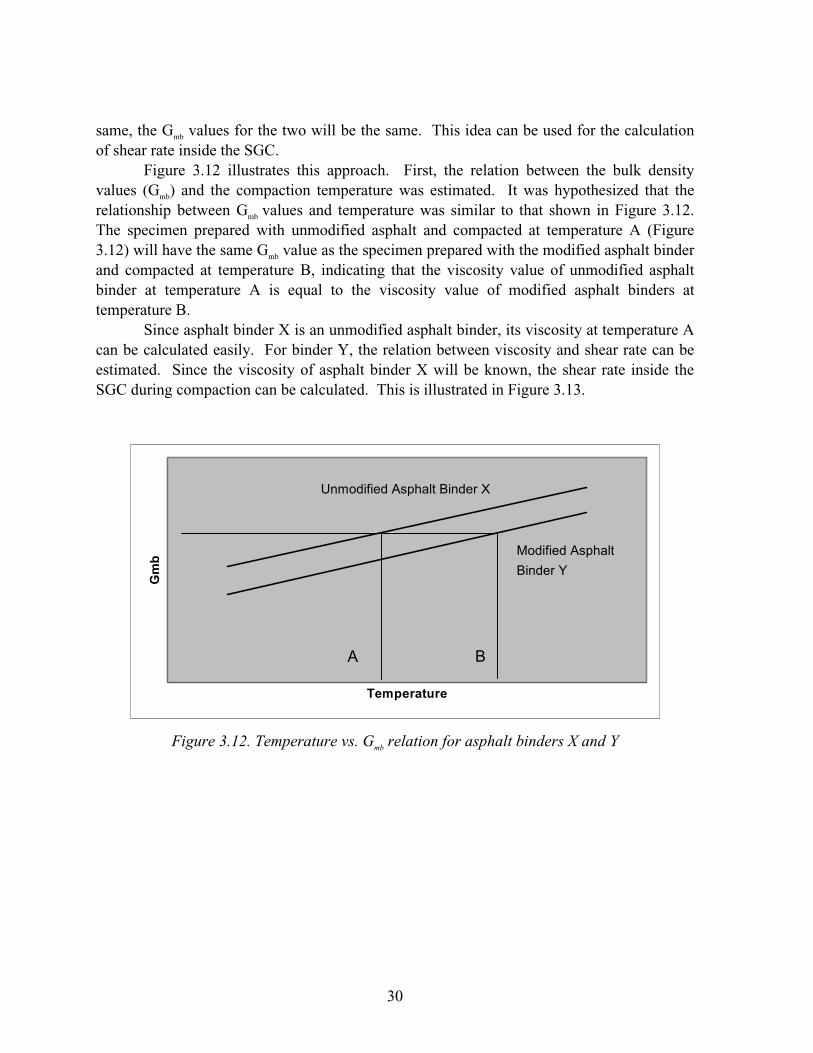
same, the Gmb values for the two will be the same. This idea can be used for the calculation of shear rate inside the SGC.
Figure 3.12 illustrates this approach. First, the relation between the bulk density values (Gmb) and the compaction temperature was estimated. It was hypothesized that the relationship between Gmb values and temperature was similar to that shown in Figure 3.12. The specimen prepared with unmodified asphalt and compacted at temperature A (Figure 3.12) will have the same Gmb value as the specimen prepared with the modified asphalt binder and compacted at temperature B, indicating that the viscosity value of unmodified asphalt binder at temperature A is equal to the viscosity value of modified asphalt binders at temperature B.
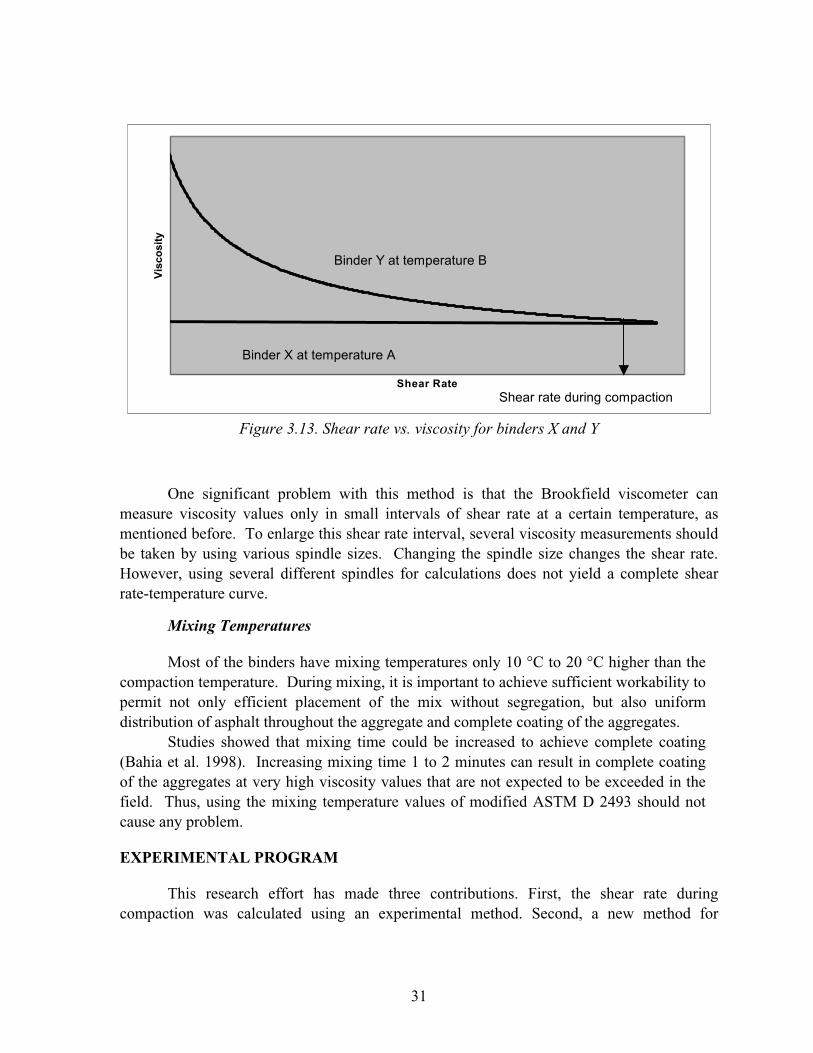
Since asphalt binder X is an unmodified asphalt binder, its viscosity at temperature A can be calculated easily. For binder Y, the relation between viscosity and shear rate can be estimated. Since the viscosity of asphalt binder X will be known, the shear rate inside the SGC during compaction can be calculated. This is illustrated in Figure 3.13.
��"�������
��'
Figure 3.12. Temperature vs. Gmb relation for asphalt binders X and Y
&#'��� �������������#����0�
���� �����������
��#����1�
����
31
����������
�� ���
Figure 3.13. Shear rate vs. viscosity for binders X and Y
One significant problem with this method is that the Brookfield viscometer can measure viscosity values only in small intervals of shear rate at a certain temperature, as mentioned before. To enlarge this shear rate interval, several viscosity measurements should be taken by using various spindle sizes. Changing the spindle size changes the shear rate. However, using several different spindles for calculations does not yield a complete shear rate-temperature curve.
Mixing Temperatures
Most of the binders have mixing temperatures only 10 �C to 20 �C higher than the compaction temperature. During mixing, it is important to achieve sufficient workability to permit not only efficient placement of the mix without segregation, but also uniform distribution of asphalt throughout the aggregate and complete coating of the aggregates.
Studies showed that mixing time could be increased to achieve complete coating (Bahia et al. 1998). Increasing mixing time 1 to 2 minutes can result in complete coating of the aggregates at very high viscosity values that are not expected to be exceeded in the field. Thus, using the mixing temperature values of modified ASTM D 2493 should not cause any problem.
EXPERIMENTAL PROGRAM
This research effort has made three contributions. First, the shear rate during compaction was calculated using an experimental method. Second, a new method for
��#����1������'����������
��#����0������'����������
��������������# ���'������#�
32
calculation of mixing and compaction temperatures was developed. Finally, some practical applications of this method were shown.
The overall research experiment is composed of three phases. The first phase involves estimating the relation between compaction temperatures and bulk density values (Gmb). The next phase estimates the relation between shear rates and viscosity values. The last phase discusses applications of the new method.
Phase I: Estimation of the Relation between Compaction Temperatures and Gmb
Values
In this phase, the relations between compaction temperatures and Gmb values are estimated. For each test, one unmodified asphalt binder and one modified asphalt binder were used. Then the estimated relations for these binders were compared. Specimens were compacted by using the Superpave gyratory compactor at five different temperatures and calculating their Gmb values. Compaction temperatures are listed in Table 3.4. The same Superpave gyratory compactor was used throughout the experiment. Twenty specimens were prepared (two binders times five different temperatures times two replicates) for each test. This experiment was repeated for four different asphalt binders and two different mixes. Each of the modified asphalt binders was compared with two unmodified asphalt binders. The least squares method was used to estimate the relation between compaction temperatures and Gmb values. The model used for these estimations is y = a x b. In this model a and b are constants, y represents the Gmb values, and x represents the compaction temperatures.
Table 3.4. Compaction temperatures for Phase I
Compaction Temperatures
MIX 1 55 �C 65 �C 75 �C 85 �C 95 �C
MIX 2 50 �C 60 �C 70 �C 80 �C 90 �C
Compaction temperatures usually range from 80 �C to 155 �C (Asphalt Institute
1989). However, for this research study, temperatures between 50 �C and 95 �C were used to better evaluate the effect of temperature on the Gmb. At higher temperatures the viscosity of asphalt binder decreases; consequently, it becomes difficult to see the effect of compaction temperatures in the gyratory compactor.
Phase II: Estimation of the Relation between Shear Rate and Viscosity
In this phase, the relationship between shear rate and viscosity was estimated. The Brookfield viscometer was used for viscosity measurements. For each data point three measurements were completed. The average of these three data points was used to estimate the relation between shear rate and viscosity. The test temperatures for this phase are given
33
in Table 3.5. For each test temperature, the viscosity values were measured at fifteen different shear rate values. For each measurement, three replicates were recorded.
Table 3.5. Test temperatures for Phase II
Test Temperatures Multigrade 90 �C 91 �C 93 �C TR 89 �C 91 �C 94 �C 95 �C Unmodified 1 73 �C 78 �C 80 �C 83 �C Unmodified 2 64 �C 68 �C 70 �C 71 �C
To estimate the relation between shear rate and viscosity, the Ostwald-de Waele
power-law model was used. This is the most popular model (Shenoy 1999), with the equation given as � � � � n –1, where � and n values are constant (Reiner 1960). � reflects the consistency index of the polymer. Higher values of � are an indicator of more viscous materials; n�is the power-law index giving a measure of the pseudoplasticity, with higher values indicating more shear-thinning characteristics. In this model � represents the viscosity and � represents the shear rate.
Phase III: Application of the New Method
In this phase, the mixing and compaction temperatures for five modified asphalt binders were calculated by using ASTM D 2493 and the new method. The relations between shear rate and viscosity were estimated for all the binders used in this phase. The Brookfield viscometer was used for these experiments. Data were collected at different shear rate values at 135 �C and 165 �C. Three replicates were used. The Ostwald-de Waele power-law model was used to estimate the relation between shear rate and viscosity. The shear rate values used in this phase are presented in Table 3.6.
Table 3.6. Shear rate values for Phase III
Shear Rate (1/s) 135 �C 5.6 9.3 11.2 18.6 27.9 46.5 55.8 93.0 165 �C 5.6 9.3 11.2 18.6 27.9 46.5 55.8 93.0

34
35
CHAPTER 4. RESULTS AND DISCUSSION
CALCULATION OF SHEAR RATE
This chapter presents the test results. Shear rate during compaction is estimated by using these test values. To estimate the shear rate, first the specimens were compacted at different temperatures. By using these values, the relation between the density values (Gmb) of the specimens and the compaction temperatures was estimated for all mixes and binders. These relations were used to estimate the shear rate during compaction.
The relationships between Gmb and temperature were estimated for four asphalt binders and two mixes. The Superpave performance grades of binders used in this chapter are PG 52-28, PG 64-22, PG 70-22, and PG 76-22.
The comparison between mixes is presented in Figures 4.1 through Figure 4.8. As expected, Gmb values increase with increasing temperature because increasing temperature reduces mix resistance during compaction. The two unmodified asphalt binders used in this chapter, PG 64-22 and PG 58-28, are labeled as Unmodified 1 and Unmodified 2 in the graphs, respectively. The relationship between Gmb values and compaction temperatures was estimated for Mix 1 and Mix 2. For Mix 1, specimens were compacted at five different temperatures: 55 �C, 65 �C, 75 �C, 85 �C, and 95 �C. For Mix 2, temperatures used were 50 �C, 60 �C, 70 �C, 80 �C, and 90 �C. The least squares method was used to estimate the relations between the temperature and Gmb values. The functions and R2 values for the regressions are presented in Appendix E.
For each graph a Gmb value was chosen. Typically, a value at the higher end of temperature is selected. These Gmb values are listed in Table 4.1. In each figure the relationship between Gmb values and compaction temperatures was estimated for one modified asphalt binder and for one unmodified asphalt binder. Subsequently, the corresponding compaction temperatures were estimated using the selected Gmb value.
There are many factors affecting the shear rate on the binder. The most important of these factors are aggregate type, aggregate properties, asphalt content, compactor type, pressure during compaction, and gyration speed. In this study these variables were held constant. The same Superpave gyratory compactor was used throughout the preparation of the specimens. Calibration of this equipment was regularly controlled.
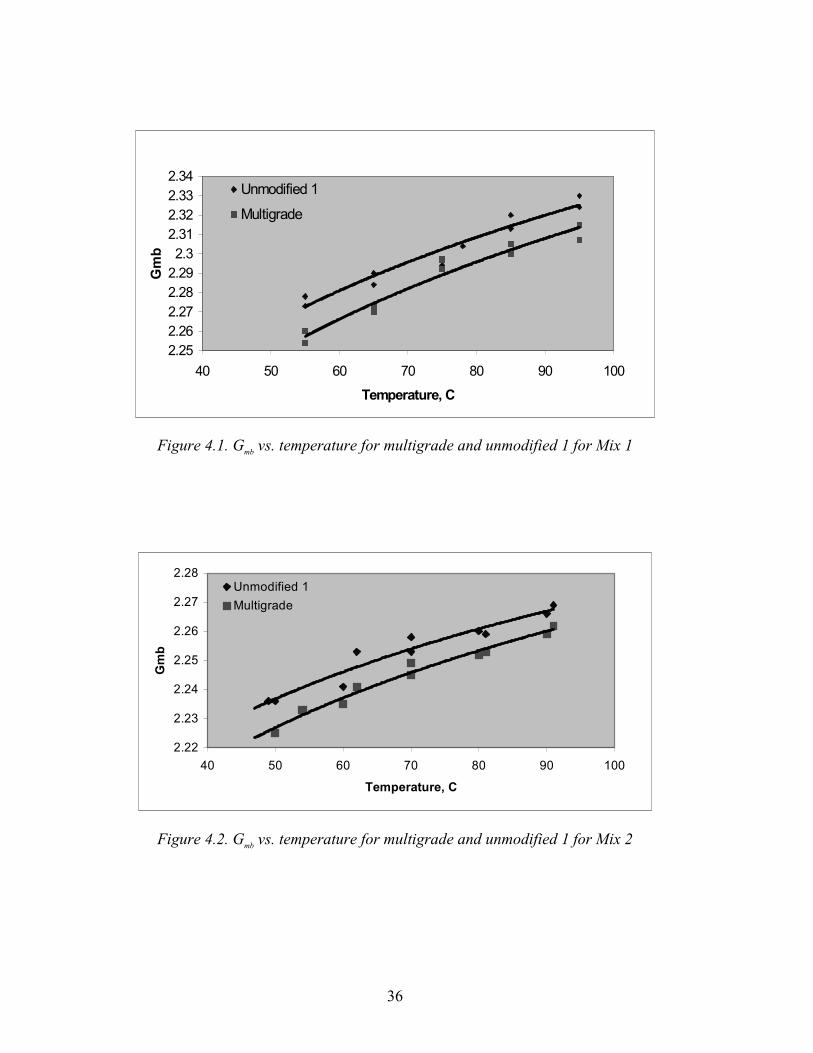
36
�,�$
�,��
�,��
�,�%
�,�+
�,-
�,-*
�,-�
�,--
�,-)
)� $� �� �� %� +� *��
��"�������(��
��'
&#'��� ����*
��� ����
Figure 4.1. Gmb vs. temperature for multigrade and unmodified 1 for Mix 1
�,��
�,�-
�,�)
�,�$
�,��
�,��
�,�%
)� $� �� �� %� +� *��
��"�������(��
��'
&#'��� ����*
��� ����
Figure 4.2. Gmb vs. temperature for multigrade and unmodified 1 for Mix 2
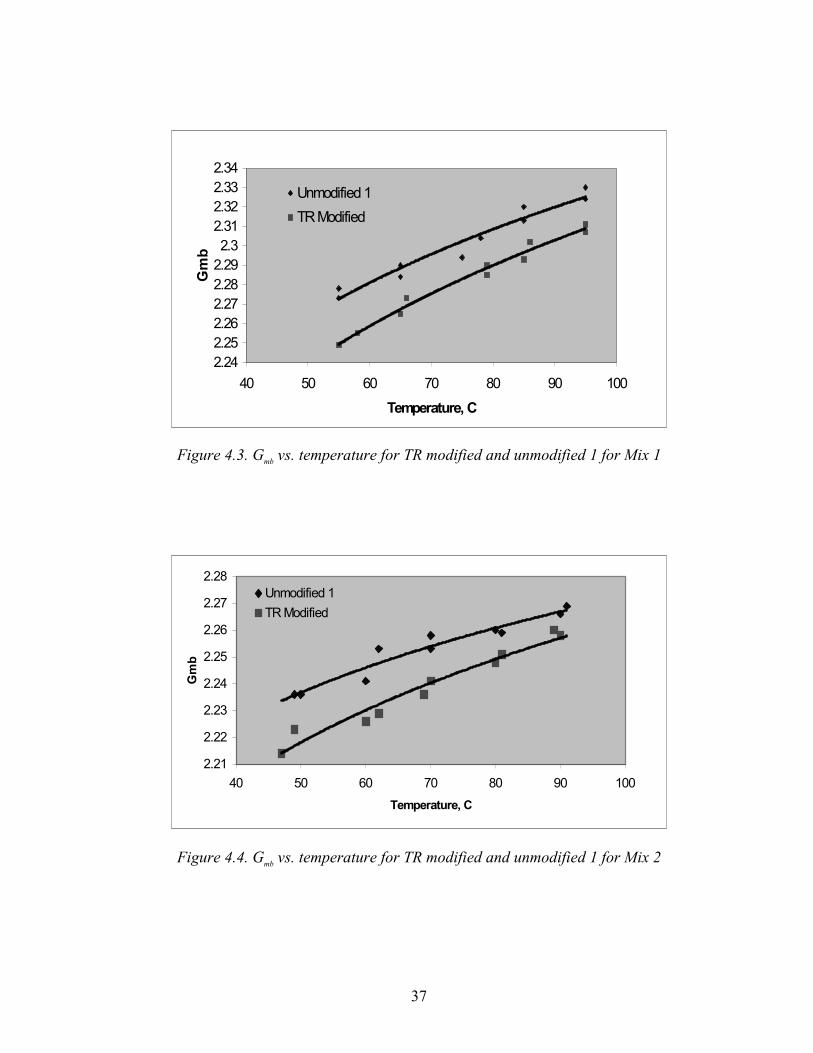
37
�,�)
�,�$
�,��
�,��
�,�%
�,�+
�,-
�,-*
�,-�
�,--
�,-)
)� $� �� �� %� +� *��
��"�������(��
��'
&#'��� ����*
�!����� ���
Figure 4.3. Gmb vs. temperature for TR modified and unmodified 1 for Mix 1
�,�*
�,��
�,�-
�,�)
�,�$
�,��
�,��
�,�%
)� $� �� �� %� +� *��
��"�������(��
��'
&#'��� ����*
�!����� ���
Figure 4.4. Gmb vs. temperature for TR modified and unmodified 1 for Mix 2
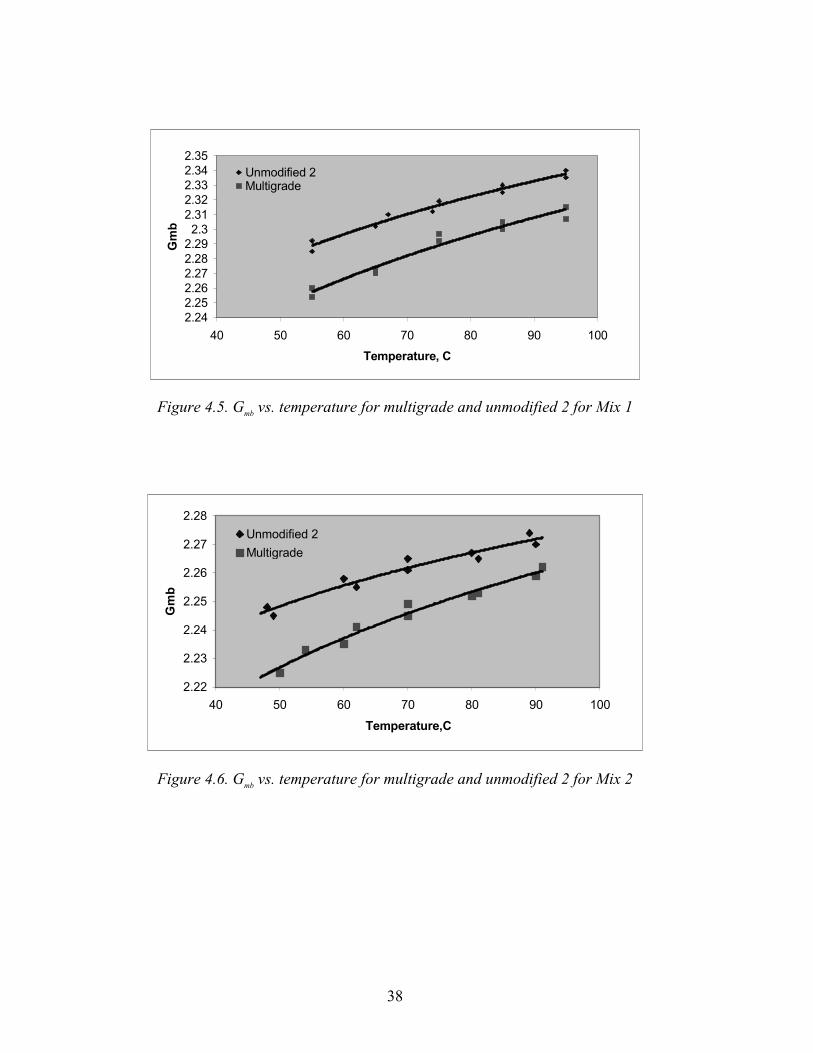
38
�,�)
�,�$
�,��
�,��
�,�%
�,�+
�,-
�,-*
�,-�
�,--
�,-)
�,-$
)� $� �� �� %� +� *��
��"�������(��
��'
&#'��� �������� ����
Figure 4.5. Gmb vs. temperature for multigrade and unmodified 2 for Mix 1
�,��
�,�-
�,�)
�,�$
�,��
�,��
�,�%
)� $� �� �� %� +� *��
��"�������(�
��'
&#'��� �����
��� ����
Figure 4.6. Gmb vs. temperature for multigrade and unmodified 2 for Mix 2
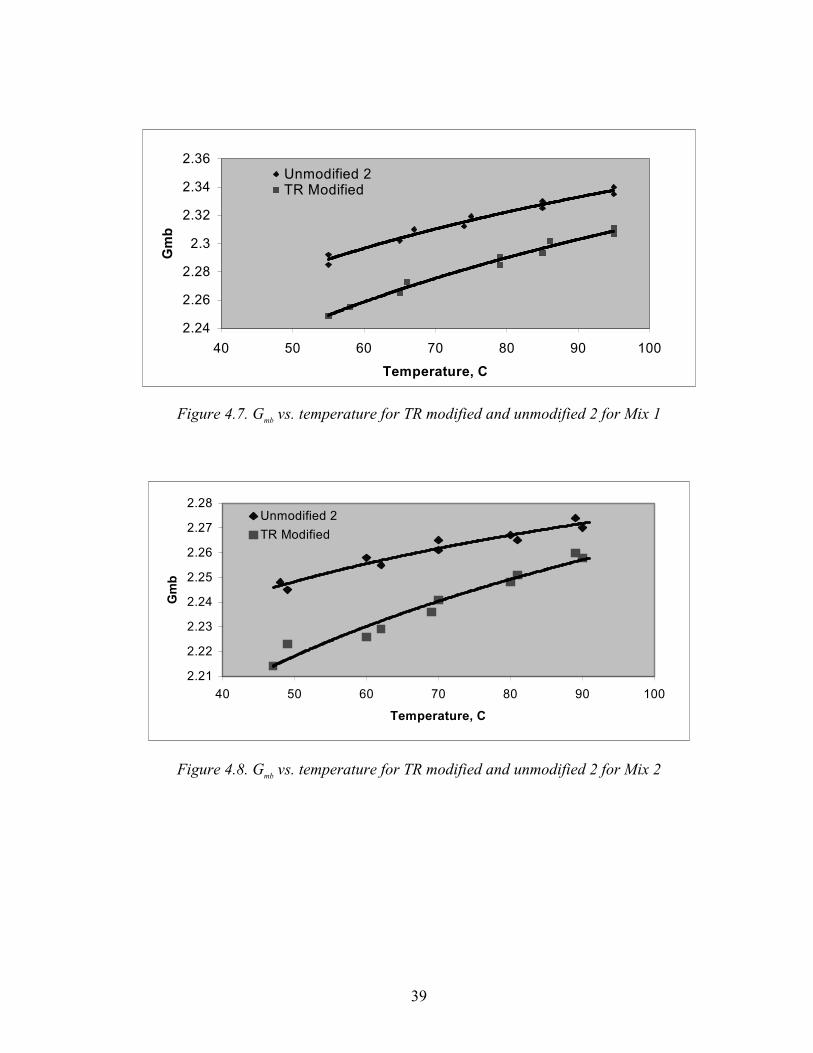
39
�,�)
�,��
�,�%
�,-
�,-�
�,-)
�,-�
)� $� �� �� %� +� *��
��"�������(��
��'
&#'��� ������!����� ���
Figure 4.7. Gmb vs. temperature for TR modified and unmodified 2 for Mix 1
�,�*
�,��
�,�-
�,�)
�,�$
�,��
�,��
�,�%
)� $� �� �� %� +� *��
��"�������(��
��'
&#'��� �����
�!����� ���
Figure 4.8. Gmb vs. temperature for TR modified and unmodified 2 for Mix 2
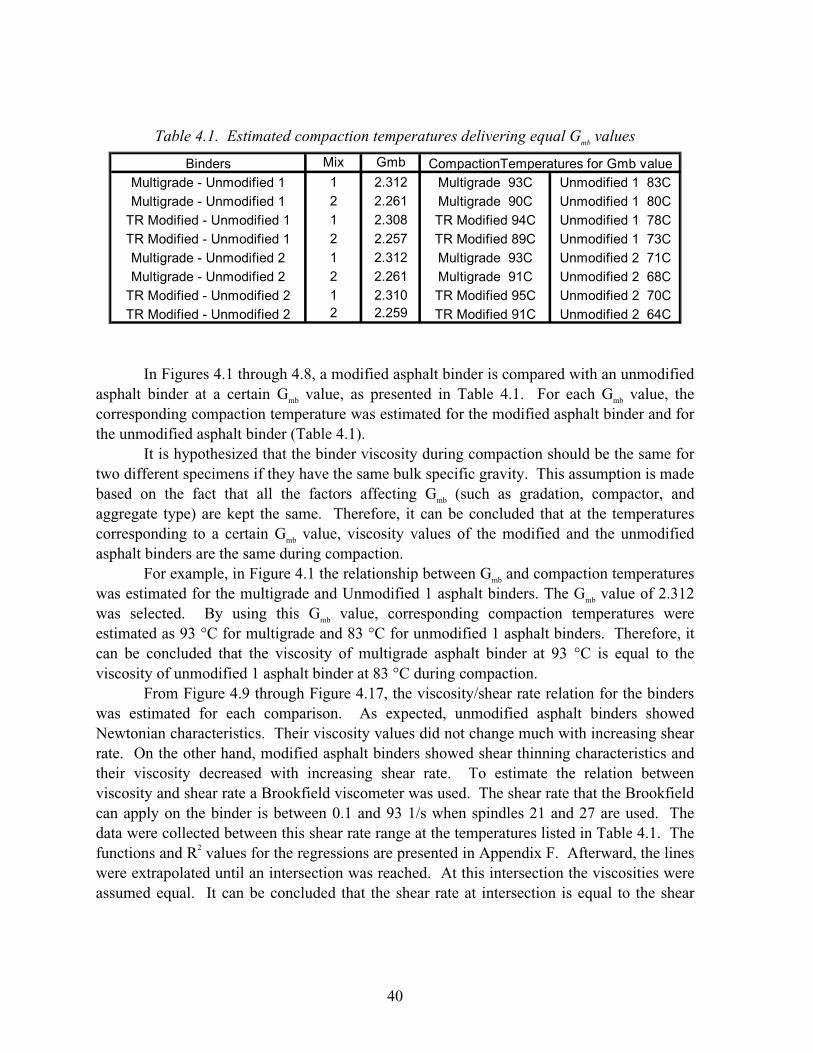
40
Table 4.1. Estimated compaction temperatures delivering equal Gmb values
��2 �'�
* �,-*�
� �,��*
* �,-�%
� �,�$�
* �,-*�
� �,��*
* �,-*�
� �,�$+�!����� ������&#'��� ����� �!����� ����+*( &#'��� ��������)(
��� �������&#'��� ����� ��� ������+*( &#'��� ��������%(
�!����� ������&#'��� ����� �!����� ����+$( &#'��� ���������(
�!����� ������&#'��� ����* �!����� ����%+( &#'��� ����*���-(
��� �������&#'��� ����� ��� ������+-( &#'��� ��������*(
��� �������&#'��� ����* ��� ������+�( &#'��� ����*��%�(
�!����� ������&#'��� ����* �!����� ����+)( &#'��� ����*���%(
��#���� (�'������#��'��������� ����'��3��
��� �������&#'��� ����* ��� ������+-( &#'��� ����*��%-(
In Figures 4.1 through 4.8, a modified asphalt binder is compared with an unmodified
asphalt binder at a certain Gmb value, as presented in Table 4.1. For each Gmb value, the corresponding compaction temperature was estimated for the modified asphalt binder and for the unmodified asphalt binder (Table 4.1).
It is hypothesized that the binder viscosity during compaction should be the same for two different specimens if they have the same bulk specific gravity. This assumption is made based on the fact that all the factors affecting Gmb (such as gradation, compactor, and aggregate type) are kept the same. Therefore, it can be concluded that at the temperatures corresponding to a certain Gmb value, viscosity values of the modified and the unmodified asphalt binders are the same during compaction.
For example, in Figure 4.1 the relationship between Gmb and compaction temperatures was estimated for the multigrade and Unmodified 1 asphalt binders. The Gmb value of 2.312 was selected. By using this Gmb value, corresponding compaction temperatures were estimated as 93 �C for multigrade and 83 �C for unmodified 1 asphalt binders. Therefore, it can be concluded that the viscosity of multigrade asphalt binder at 93 �C is equal to the viscosity of unmodified 1 asphalt binder at 83 �C during compaction.
From Figure 4.9 through Figure 4.17, the viscosity/shear rate relation for the binders was estimated for each comparison. As expected, unmodified asphalt binders showed Newtonian characteristics. Their viscosity values did not change much with increasing shear rate. On the other hand, modified asphalt binders showed shear thinning characteristics and their viscosity decreased with increasing shear rate. To estimate the relation between viscosity and shear rate a Brookfield viscometer was used. The shear rate that the Brookfield can apply on the binder is between 0.1 and 93 1/s when spindles 21 and 27 are used. The data were collected between this shear rate range at the temperatures listed in Table 4.1. The functions and R2 values for the regressions are presented in Appendix F. Afterward, the lines were extrapolated until an intersection was reached. At this intersection the viscosities were assumed equal. It can be concluded that the shear rate at intersection is equal to the shear
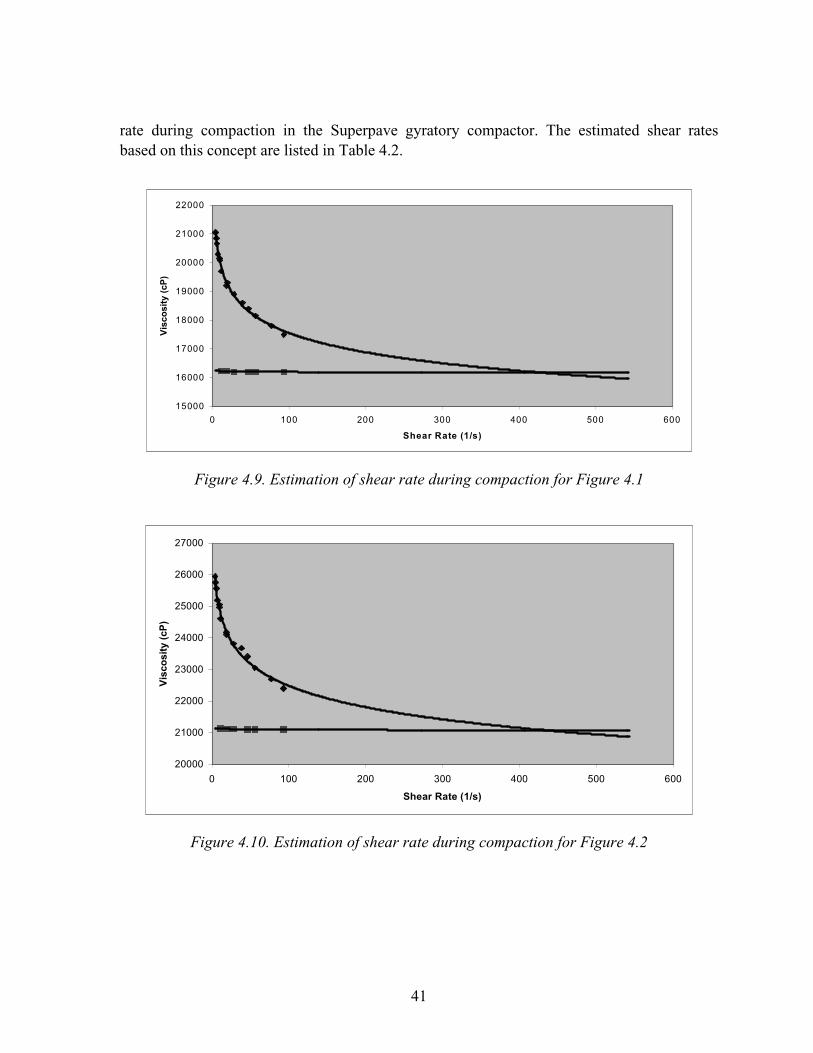
41
rate during compaction in the Superpave gyratory compactor. The estimated shear rates based on this concept are listed in Table 4.2.
*$���
*����
*����
*%���
*+���
�����
�*���
�����
� *�� ��� -�� )�� $�� ���
�����������#$%&
�� ����#��&
Figure 4.9. Estimation of shear rate during compaction for Figure 4.1
�����
�*���
�����
�-���
�)���
�$���
�����
�����
� *�� ��� -�� )�� $�� ���
�����������#$%&
�� ����#��&
Figure 4.10. Estimation of shear rate during compaction for Figure 4.2
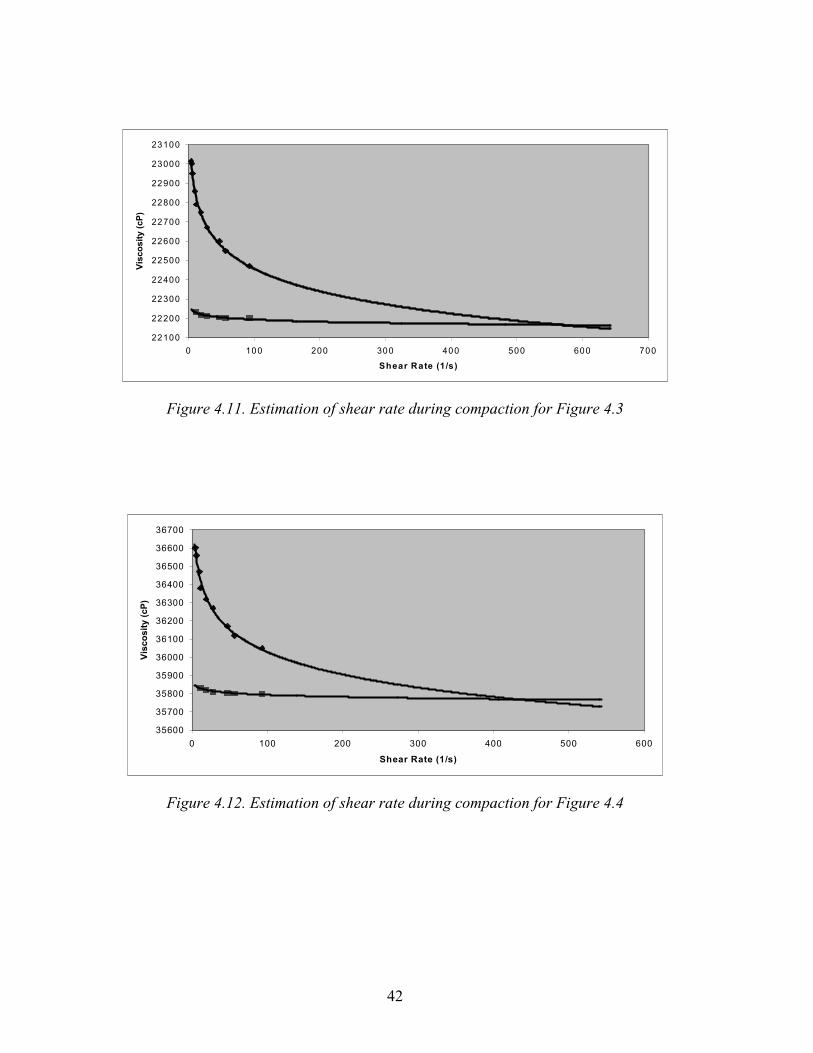
42
��*��
�����
��-��
��)��
��$��
�����
�����
��%��
��+��
�-���
�-*��
� *�� ��� -�� )�� $�� ��� ���
�����������#$%&
�� ����#��&
Figure 4.11. Estimation of shear rate during compaction for Figure 4.3
-$���
-$���
-$%��
-$+��
-����
-�*��
-����
-�-��
-�)��
-�$��
-����
-����
� *�� ��� -�� )�� $�� ���
�����������#$%&
�� ����#��&
Figure 4.12. Estimation of shear rate during compaction for Figure 4.4
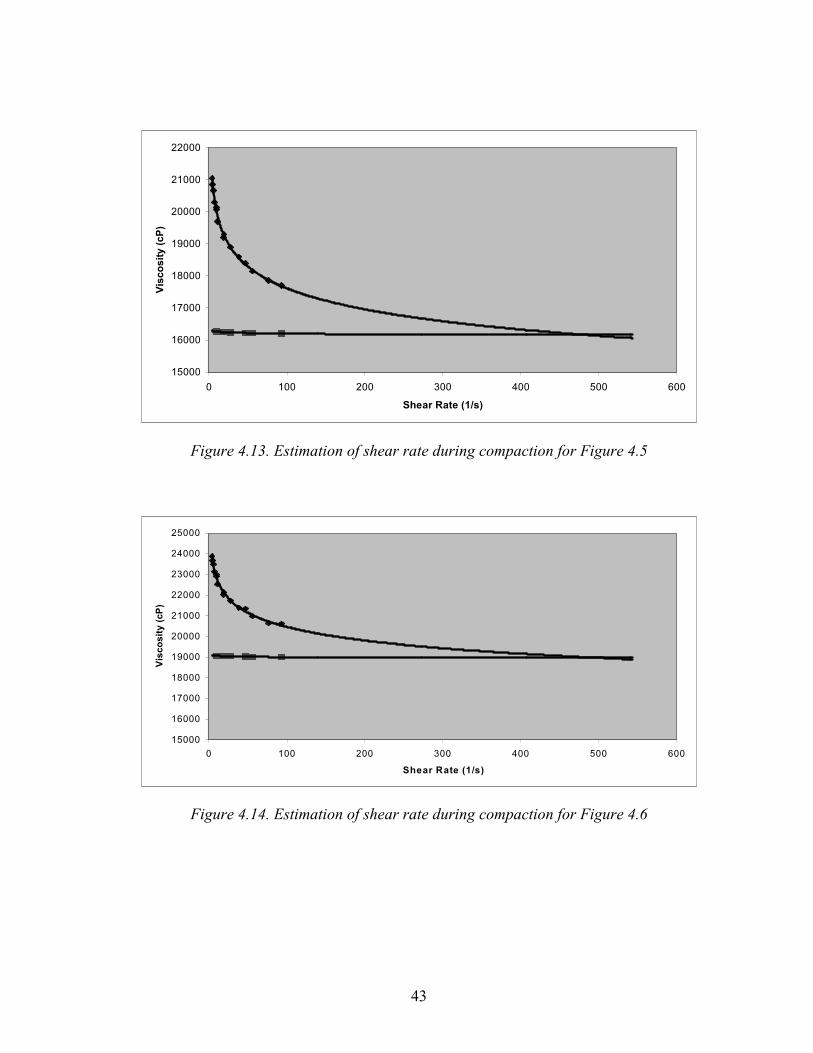
43
*$���
*����
*����
*%���
*+���
�����
�*���
�����
� *�� ��� -�� )�� $�� ���
�����������#$%&
�� ����#��&
Figure 4.13. Estimation of shear rate during compaction for Figure 4.5
*$���
*����
*����
*%���
*+���
�����
�*���
�����
�-���
�)���
�$���
� *�� ��� -�� )�� $�� ���
�����������#$%&
�� ����#��&
Figure 4.14. Estimation of shear rate during compaction for Figure 4.6
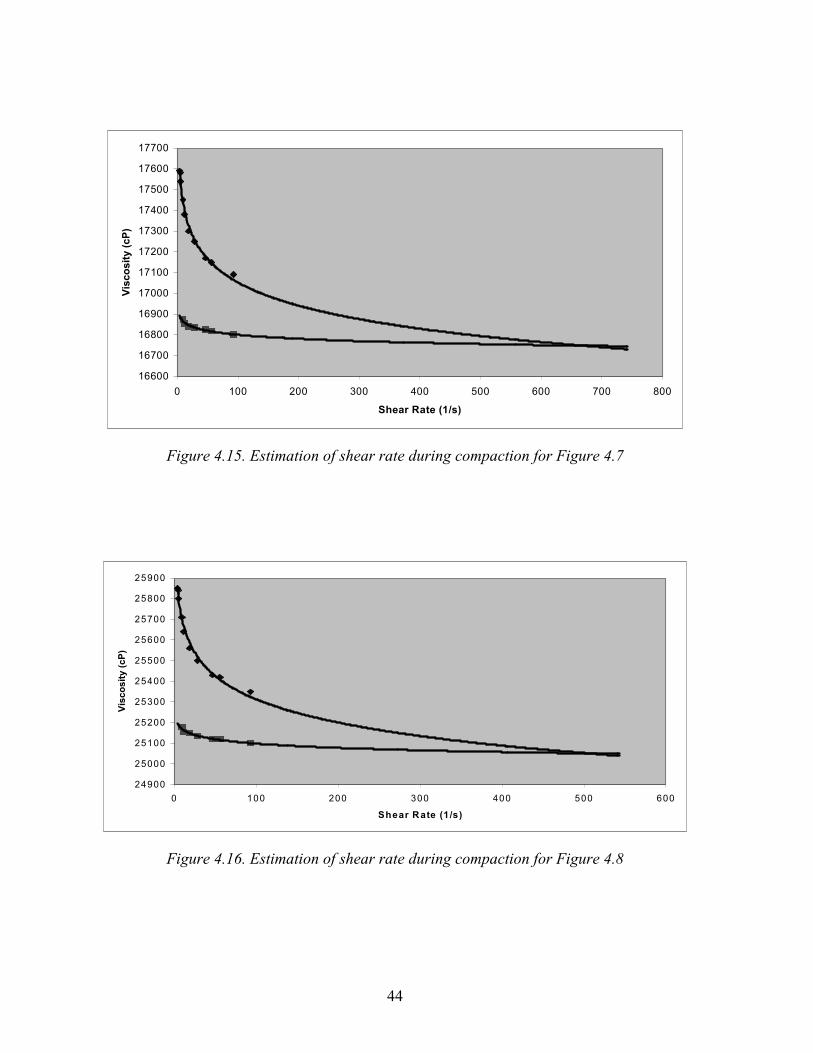
44
*����
*����
*�%��
*�+��
*����
*�*��
*����
*�-��
*�)��
*�$��
*����
*����
� *�� ��� -�� )�� $�� ��� ��� %��
�����������#$%&
�� ����#��&
Figure 4.15. Estimation of shear rate during compaction for Figure 4.7
�)+��
�$���
�$*��
�$���
�$-��
�$)��
�$$��
�$���
�$���
�$%��
�$+��
� *�� ��� -�� )�� $�� ���
�����������#$%&
�� ����#��&
Figure 4.16. Estimation of shear rate during compaction for Figure 4.8
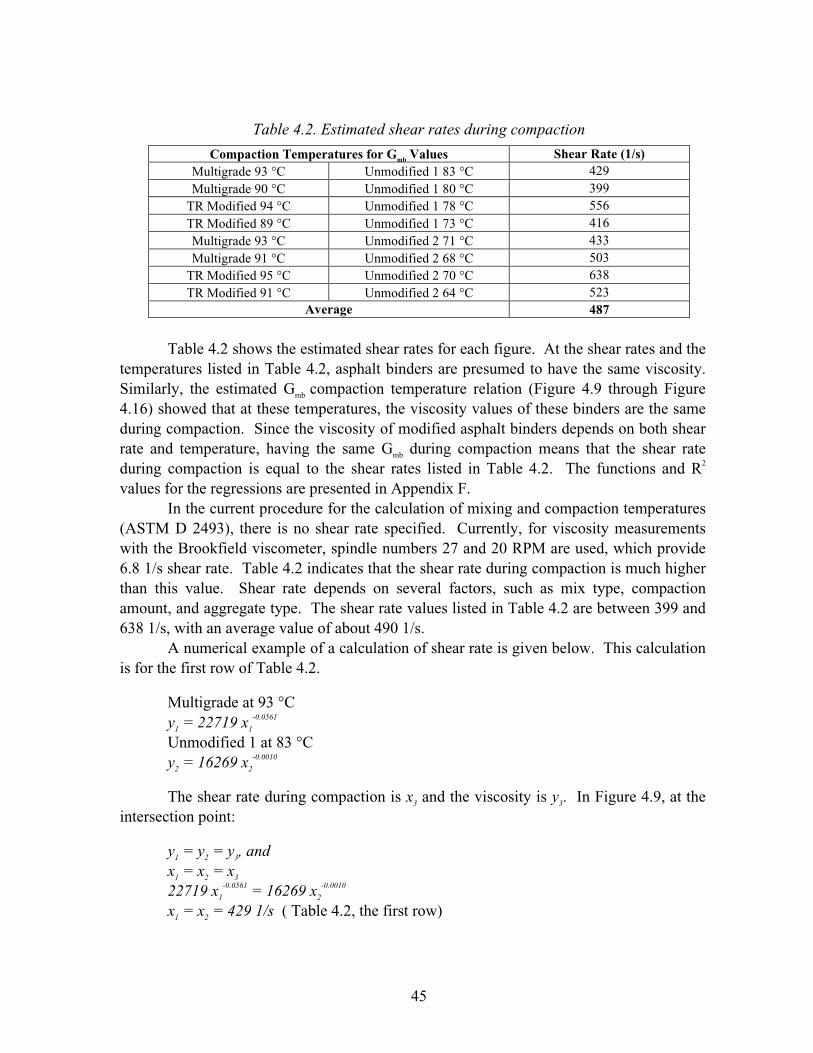
45
Table 4.2. Estimated shear rates during compaction
Compaction Temperatures for Gmb Values ��������������
Multigrade 93 �C Unmodified 1 83 �C 429 Multigrade 90 �C Unmodified 1 80 �C 399
TR Modified 94 �C Unmodified 1 78 �C 556 TR Modified 89 �C Unmodified 1 73 �C 416 Multigrade 93 �C Unmodified 2 71 �C 433 Multigrade 91 �C Unmodified 2 68 �C 503
TR Modified 95 �C Unmodified 2 70 �C 638 TR Modified 91 �C Unmodified 2 64 �C 523
������� 487
Table 4.2 shows the estimated shear rates for each figure. At the shear rates and the
temperatures listed in Table 4.2, asphalt binders are presumed to have the same viscosity. Similarly, the estimated Gmb compaction temperature relation (Figure 4.9 through Figure 4.16) showed that at these temperatures, the viscosity values of these binders are the same during compaction. Since the viscosity of modified asphalt binders depends on both shear rate and temperature, having the same Gmb during compaction means that the shear rate during compaction is equal to the shear rates listed in Table 4.2. The functions and R2 values for the regressions are presented in Appendix F.
In the current procedure for the calculation of mixing and compaction temperatures (ASTM D 2493), there is no shear rate specified. Currently, for viscosity measurements with the Brookfield viscometer, spindle numbers 27 and 20 RPM are used, which provide 6.8 1/s shear rate. Table 4.2 indicates that the shear rate during compaction is much higher than this value. Shear rate depends on several factors, such as mix type, compaction amount, and aggregate type. The shear rate values listed in Table 4.2 are between 399 and 638 1/s, with an average value of about 490 1/s.
A numerical example of a calculation of shear rate is given below. This calculation is for the first row of Table 4.2.
Multigrade at 93 �C y1 = 22719 x1
-0.0561 Unmodified 1 at 83 �C y2 = 16269 x2
-0.0010
The shear rate during compaction is x3 and the viscosity is y3. In Figure 4.9, at the intersection point:
y1 = y2 = y3, and x1 = x2 = x3 22719 x1
-0.0561 = 16269 x2
-0.0010 x1 = x2 = 429 1/s ( Table 4.2, the first row)

46
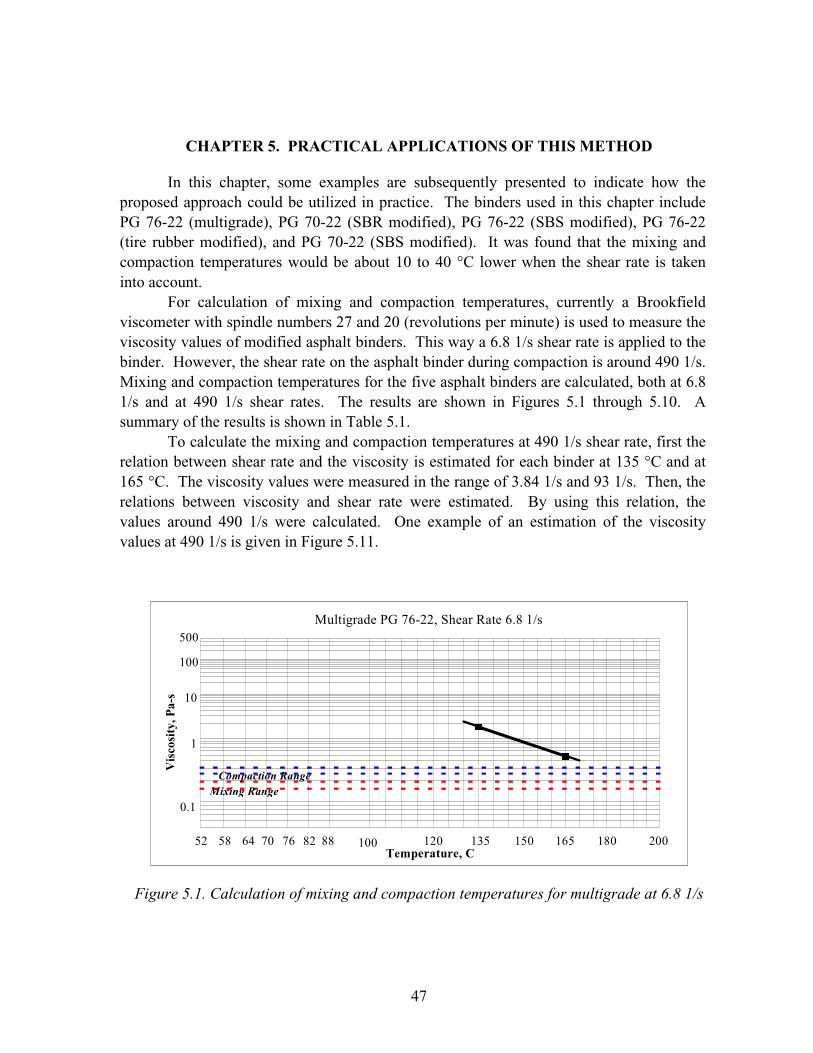
47
CHAPTER 5. PRACTICAL APPLICATIONS OF THIS METHOD
In this chapter, some examples are subsequently presented to indicate how the proposed approach could be utilized in practice. The binders used in this chapter include PG 76-22 (multigrade), PG 70-22 (SBR modified), PG 76-22 (SBS modified), PG 76-22 (tire rubber modified), and PG 70-22 (SBS modified). It was found that the mixing and compaction temperatures would be about 10 to 40 �C lower when the shear rate is taken into account.
For calculation of mixing and compaction temperatures, currently a Brookfield viscometer with spindle numbers 27 and 20 (revolutions per minute) is used to measure the viscosity values of modified asphalt binders. This way a 6.8 1/s shear rate is applied to the binder. However, the shear rate on the asphalt binder during compaction is around 490 1/s. Mixing and compaction temperatures for the five asphalt binders are calculated, both at 6.8 1/s and at 490 1/s shear rates. The results are shown in Figures 5.1 through 5.10. A summary of the results is shown in Table 5.1.
To calculate the mixing and compaction temperatures at 490 1/s shear rate, first the relation between shear rate and the viscosity is estimated for each binder at 135 �C and at 165 �C. The viscosity values were measured in the range of 3.84 1/s and 93 1/s. Then, the relations between viscosity and shear rate were estimated. By using this relation, the values around 490 1/s were calculated. One example of an estimation of the viscosity values at 490 1/s is given in Figure 5.11.
������������
� ���� ������
���
�
��
�� �� �� ��� ��� ��� ��� ���
�����������
�� �����������
� � ��� ��� ���
���
���
��������� ������������ ������ ��������
Figure 5.1. Calculation of mixing and compaction temperatures for multigrade at 6.8 1/s
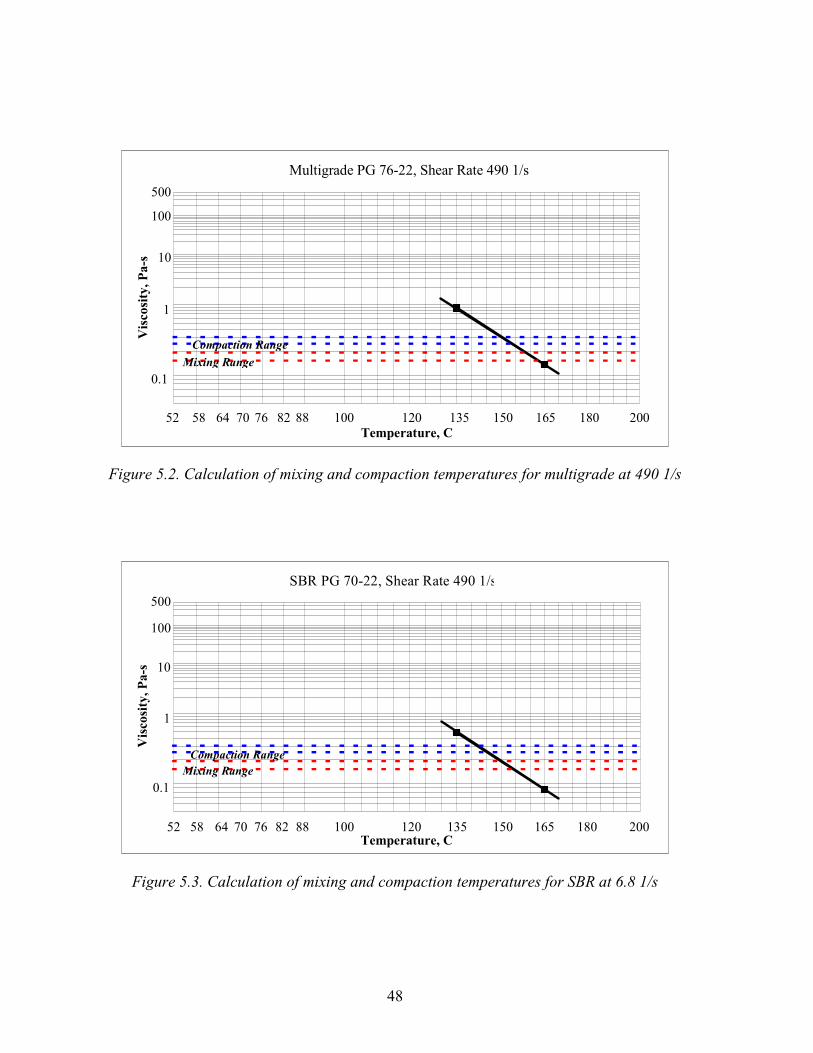
48
������������
� ���� ������
���
�
��
�� �� �� ��� ��� ��� ��� ���
�����������
�� �����������
� � ��� ��� ���
���
���
��������� ������������ ������ � �����
Figure 5.2. Calculation of mixing and compaction temperatures for multigrade at 490 1/s
������������
� ���� ������
���
�
��
�� �� �� ��� ��� ��� ��� ���
�����������
�� �����������
� � ��� ��� ���
���
���
�!������������� ������ � �����
Figure 5.3. Calculation of mixing and compaction temperatures for SBR at 6.8 1/s
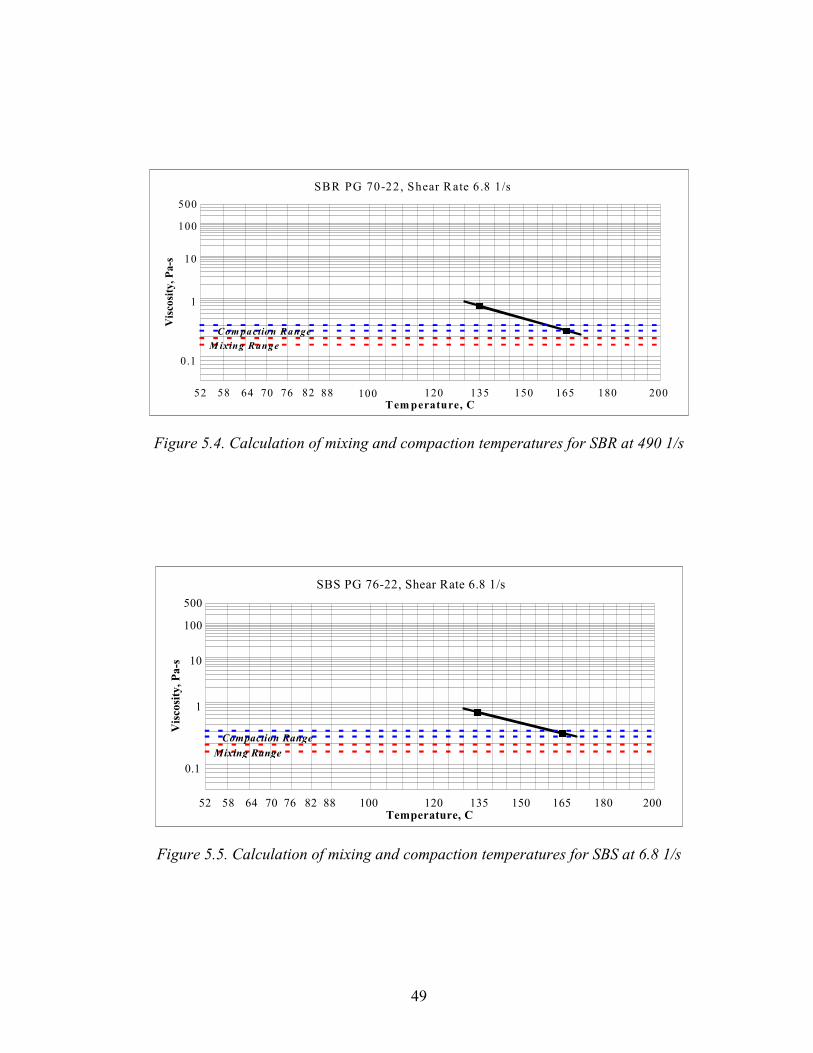
49
������������
� ���� ������
���
�
��
�� �� �� ��� ��� ��� ��� ���
�����������
�� �����������
� � ��� ��� ���
���
���
�!������������� ������ �� �� ����
Figure 5.4. Calculation of mixing and compaction temperatures for SBR at 490 1/s
������������
� ���� ������
���
�
��
�� �� �� ��� ��� ��� ��� ���
�����������
�� �����������
� � ��� ��� ���
���
���
�!������������� ������ ��������
Figure 5.5. Calculation of mixing and compaction temperatures for SBS at 6.8 1/s
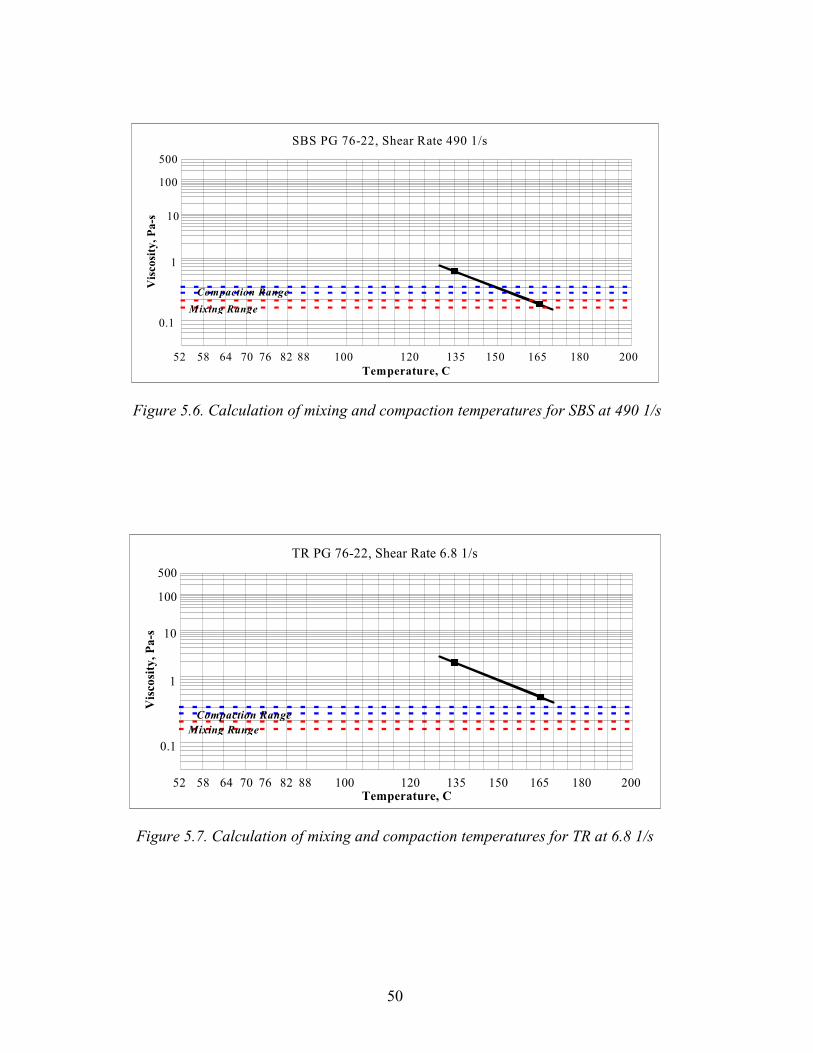
50
������������
� ���� ������
���
�
��
�� �� �� ��� ��� ��� ��� ���
�����������
�� �����������
� � ��� ��� ���
���
���
�!������������� ������ � �����
Figure 5.6. Calculation of mixing and compaction temperatures for SBS at 490 1/s
������������
� ���� ������
���
�
��
�� �� �� ��� ��� ��� ��� ���
�����������
�� �����������
� � ��� ��� ���
���
���
"������������� ������ ��������
Figure 5.7. Calculation of mixing and compaction temperatures for TR at 6.8 1/s
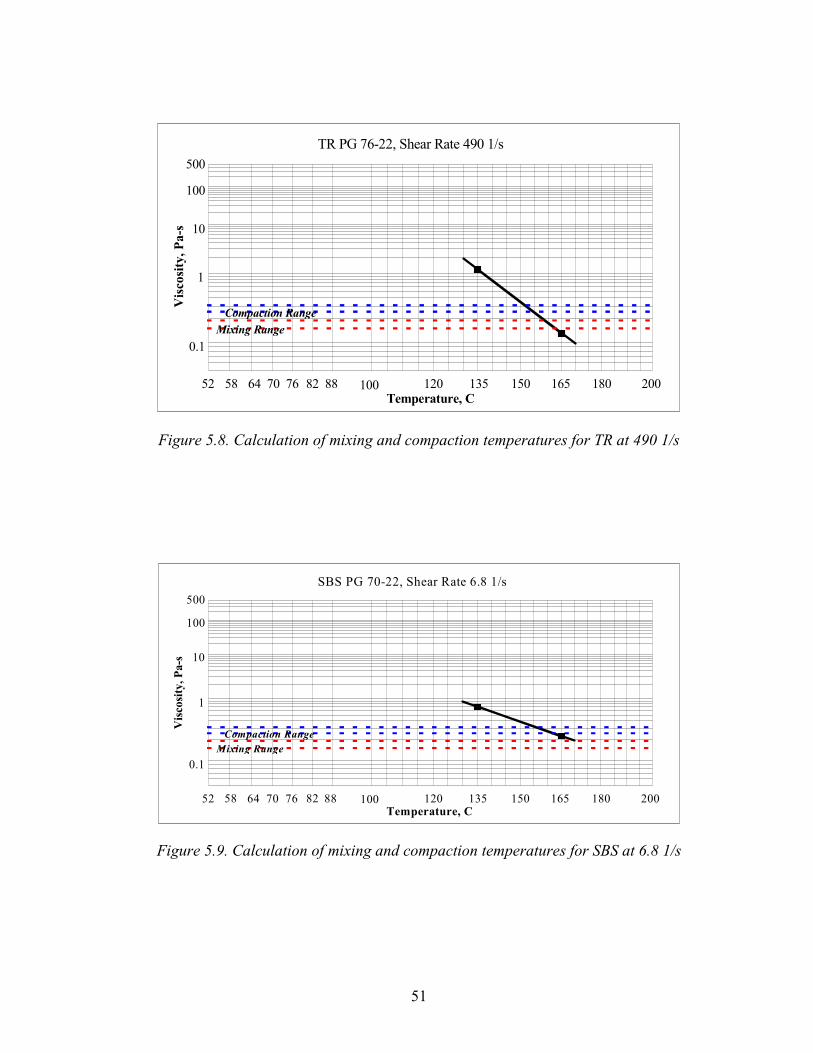
51
������������
� ���� ������
���
�
��
�� �� �� ��� ��� ��� ��� ���
�����������
�� �����������
� � ��� ��� ���
���
���
"������������� ������ � �����
Figure 5.8. Calculation of mixing and compaction temperatures for TR at 490 1/s
������������
� ���� ������
���
�
��
�� �� �� ��� ��� ��� ��� ���
�����������
�� �����������
� � ��� ��� ���
���
���
�!������������� ������ ��������
Figure 5.9. Calculation of mixing and compaction temperatures for SBS at 6.8 1/s
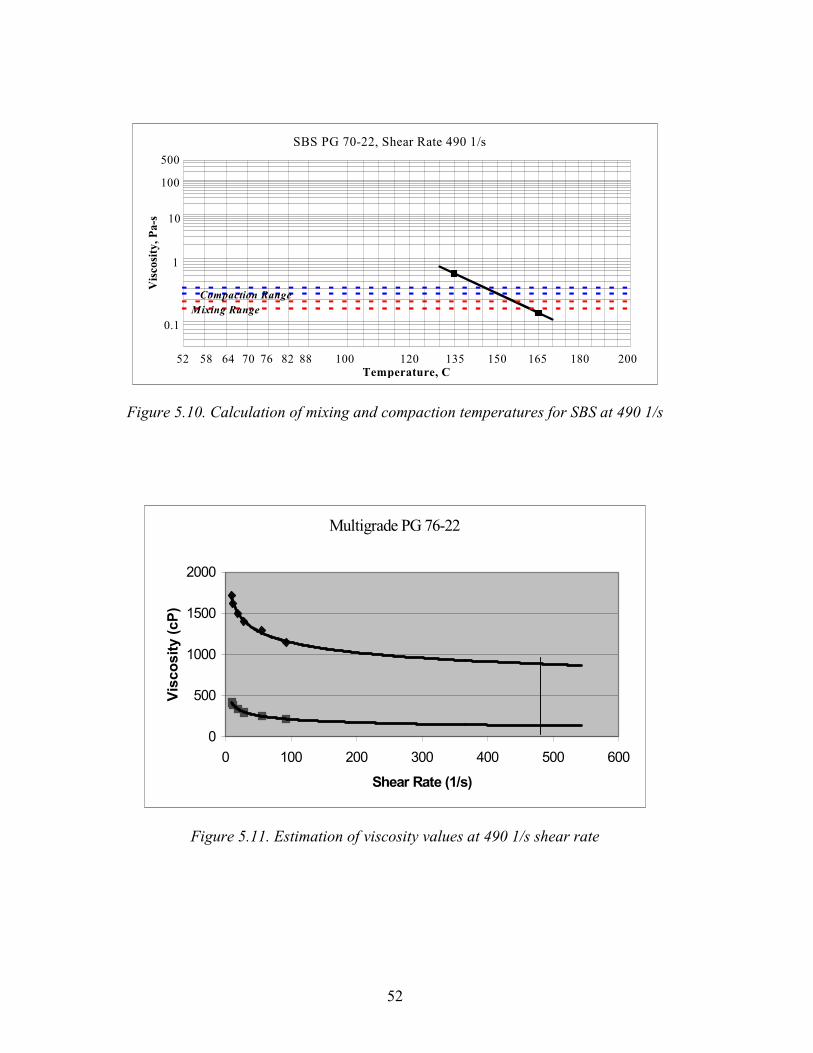
52
������������
� ���� ������
���
�
��
�� �� �� ��� ��� ��� ��� ���
�����������
�� �����������
� � ��� ��� ���
���
���
�!������������� ������ � �����
Figure 5.10. Calculation of mixing and compaction temperatures for SBS at 490 1/s
��������� ��������
�
$��
*���
*$��
����
� *�� ��� -�� )�� $�� ���
�����������#$%&
�� ����#��&
Figure 5.11. Estimation of viscosity values at 490 1/s shear rate
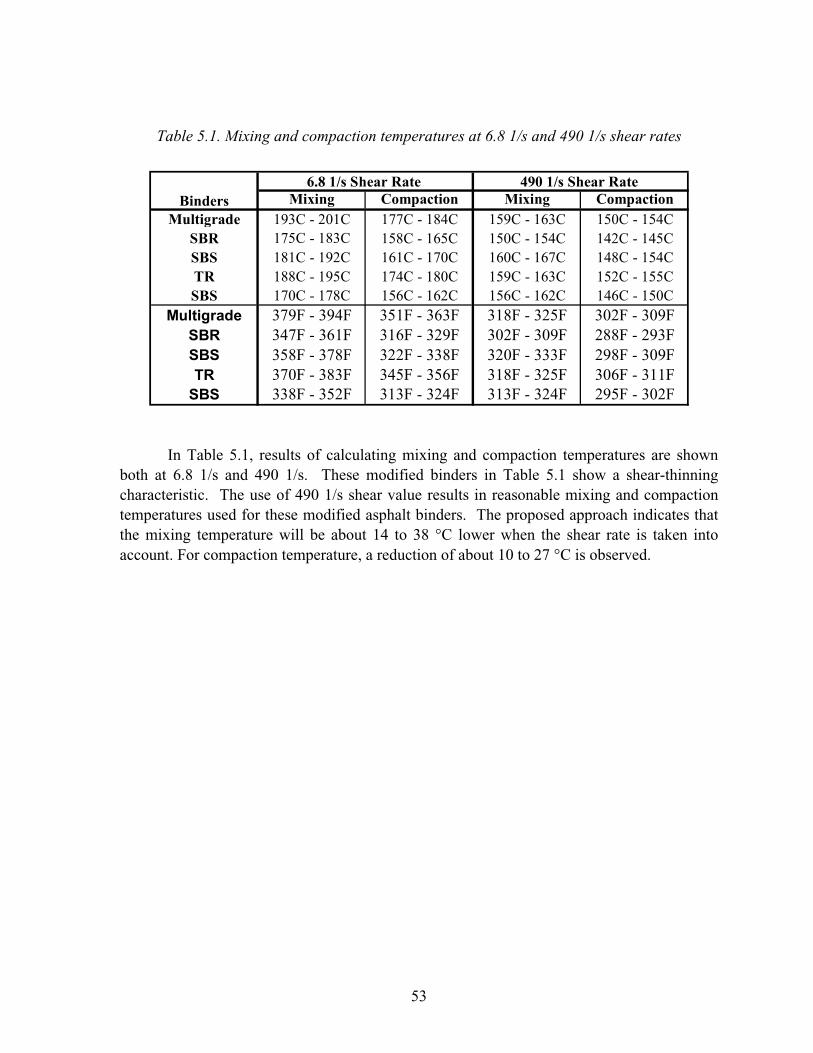
53
Table 5.1. Mixing and compaction temperatures at 6.8 1/s and 490 1/s shear rates
� � � ������� � � � � ������� �
��!� ���"� � �#������# �#�����# �� #������# ���#�����#
�#� ��#������# ���#������# ���#�����# ��#�����#
�#� ���#���� �# ���#�����# ���#�����# ��#�����#
�� ���#���� �# �#������# �� #������# ���#������#
�#� ��#�����# ���#������# ���#������# ��#������#
���������� � $���� $ ���$������$ ���$������$ ���$����� $
�)� �$������$ ���$����� $ ���$����� $ ���$���� �$
�)� ���$�����$ ���$������$ ���$������$ � �$����� $
� ��$������$ ��$������$ ���$������$ ���$������$
�)� ���$������$ ���$�����$ ���$�����$ � �$������$
$%&������������ '()������������
# "���
In Table 5.1, results of calculating mixing and compaction temperatures are shown both at 6.8 1/s and 490 1/s. These modified binders in Table 5.1 show a shear-thinning characteristic. The use of 490 1/s shear value results in reasonable mixing and compaction temperatures used for these modified asphalt binders. The proposed approach indicates that the mixing temperature will be about 14 to 38 �C lower when the shear rate is taken into account. For compaction temperature, a reduction of about 10 to 27 �C is observed.

54
55
CHAPTER 6. CONCLUSIONS AND RECOMMENDATIONS
This report focuses on the development of a new procedure for calculating mixing and compaction temperatures for modified asphalt binders. The existing approach for determination of mixing and compaction temperatures for modified asphalt binders results in high temperatures, which in some cases can cause problems. The new procedure takes the shear rate dependency of asphalt binder into account in determining mixing and compaction temperatures. Because most of the modified asphalt binders are shear thinning at high temperatures, their viscosity values decrease with increasing shear rate. To calculate the viscosity values during compaction, the effect of shear rate should be considered for viscosity measurements. The shear rate was calculated during compaction to include its effect on viscosity. In this study, shear rate inside the SGC was calculated approximately 490 1/s. This value is the average of 8 different shear rate value calculated in different situations. The proposed approach indicates that the mixing and compaction temperatures will be about 10 to 40 �C lower when the shear rate is taken into account.
Chapter 1 underscored the importance of mixing and compaction temperatures. The problem with the current procedure and its reasons were explained. Most of the modified binders showed shear-thinning characteristics, but the unmodified asphalt binders showed Newtonian characteristics. The current procedure was established for Newtonian binders. It is not capable of measuring the mixing and compaction temperatures for modified asphalt binders.
In Chapter 2, background information necessary for understanding the concept was given. First, the behaviors of fluids were explained. The relation between shear rate, shear stress, and viscosity was presented. Shear-thinning, shear-thickening, and Newtonian behaviors were discussed. It was shown that the viscosities of different binders depend on different parameters. The methods and test equipment used for measuring viscosity at high temperatures were explained. The ASTM D 2493 procedure was summarized.
In Chapter 3, experimental features were presented. Materials and the test equipment used for this study were explained. Verification of performance grading (PG) was conducted for all the binders used in this study. All PG test equipment was introduced in this chapter. The Superpave gyratory compactor used for preparing the specimens for this study was explained. Aggregates used in this study and mineral aggregate properties were presented. The research approach to develop the new procedure and the experimental design was discussed.
In Chapter 4, the results of the experiments were presented. Five binders and two mixes were used to estimate the shear rate in the Superpave gyratory compactor. First, the relations between Gmb values and the compaction temperatures were estimated for different binders. For each experiment one modified and one unmodified asphalt binder was compared. The compaction temperatures giving the same Gmb values were calculated. At these temperatures, viscosity-shear rate relations were estimated for the binders. Finally, the
56
shear rate giving the same viscosity value for estimated relations was calculated. This shear rate was assumed to be equal to the shear rate during compaction. This procedure was repeated eight times (two mixes times four binders). All the data for these experiments and the calculated shear rate values were presented in this chapter.
In Chapter 5, mixing and compaction temperatures for five different asphalt binders were calculated using the new method and the current method, ASTM D 2493. The results were compared and presented in this chapter. It was found that the new method gives more reasonable mixing and compaction temperatures.
CONCLUSIONS
In this research it was observed that Gmb values were increasing with increasing compaction temperature. If the compaction temperature varies, the Gmb values, which are an important factor for design, vary as well, with such variation affecting all the results for design.
This research effort sought to find and verify a new method for calculating mixing and compaction temperatures for modified asphalt binders. This method is composed of three phases. The first phase involves estimating the relation between compaction temperatures and the Gmb. The second phase estimates the relation between the shear rates and the viscosity values, while the last phase discusses applications of the new method. The first two phases involve calculation of the shear rate during compaction.
In the first phase, it was observed that there was a good correlation between compaction temperatures and the Gmb values for all mix and binder combinations. There was a consistent increase in Gmb values with increasing compaction temperatures. In all cases the estimated relation was similar to the hypothesized relation.
In the second phase, the effect of shear rate on modified and unmodified asphalt binders was observed. Based on the test results of this phase, it was concluded that shear rate has a very significant effect on the viscosity of polymer-modified asphalt binders. However, the effect of shear rate on the viscosity of unmodified asphalt binders was very small, such that this effect could be ignored during viscosity measurements.
In the third phase, it was observed that, in using the new method, reasonable mixing and compaction temperatures for modified asphalt binders are obtained. All the modified asphalt binders used in this phase showed shear-thinning characteristics.
Since the current procedure, ASTM D 2493, considers only the effect of temperature on the binder for viscosity measurement, both the capillary viscometer and the rotational viscometer can be used for viscosity measurements. However, the new procedure considers the effect of the shear rate during measurements. The capillary viscometer cannot measure the effect of shear rate on the binder. Therefore, only rotational viscometers can be used for this new method.
57
FUTURE RESEARCH
There are many different kinds of polymer-modified asphalt binders on the market. In this research study, only five different modified asphalt binders were used. This method should be applied to other binders on the market to calculate the mixing and compaction temperatures.
This research concentrated on lab mixed specimens. A new research on mixing and compaction temperatures for modified asphalt binders should be conducted in the field. There are many differences between lab compaction and field compaction. The factors affecting the shear rate in the field should be determined. Shear rate during field compaction should be calculated. The relation between the factors affecting the viscosity in the field and at the lab should be established. This will help to calculate the field mixing and compaction temperatures at the lab.
In this study, the viscosity values were measured in the range of 3.84 1/s and 93 1/s. Then, the relations between viscosity and shear rate were estimated. By using this relation, the values around 490 1/s were calculated. A new research study should be conducted to verify these extrapolated viscosity values.
In this study, modified binders ranging from PG 52-28 to PG 76-22 were used. Every day new polymer-modified binders emerge on the market and higher PG grade binders are produced. Recently, it has been possible to find PG 88-28 on the market. For future study, this kind of highly modified asphalt binder should be considered — binders whose viscosity values at high temperatures are higher than those used in this study. Such values may cause new problems in using these calculations.

58
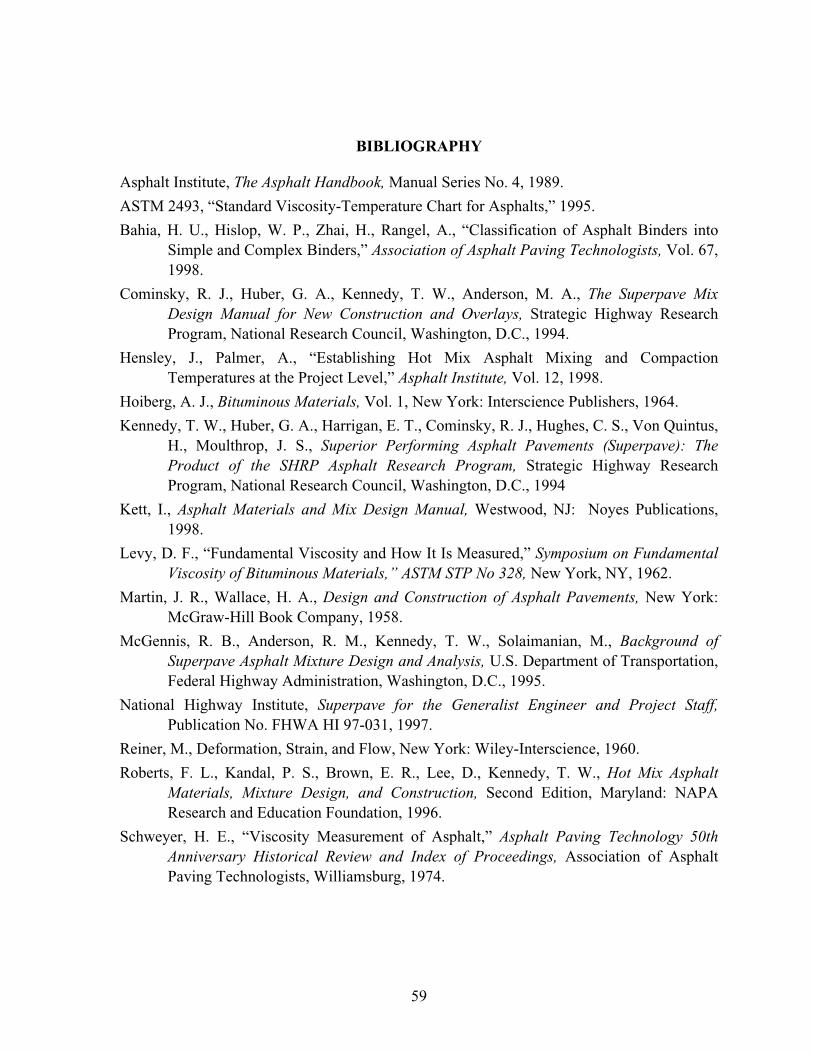
59
BIBLIOGRAPHY
Asphalt Institute, The Asphalt Handbook, Manual Series No. 4, 1989.
ASTM 2493, “Standard Viscosity-Temperature Chart for Asphalts,” 1995.
Bahia, H. U., Hislop, W. P., Zhai, H., Rangel, A., “Classification of Asphalt Binders into Simple and Complex Binders,” Association of Asphalt Paving Technologists, Vol. 67, 1998.
Cominsky, R. J., Huber, G. A., Kennedy, T. W., Anderson, M. A., The Superpave Mix Design Manual for New Construction and Overlays, Strategic Highway Research Program, National Research Council, Washington, D.C., 1994.
Hensley, J., Palmer, A., “Establishing Hot Mix Asphalt Mixing and Compaction Temperatures at the Project Level,” Asphalt Institute, Vol. 12, 1998.
Hoiberg, A. J., Bituminous Materials, Vol. 1, New York: Interscience Publishers, 1964.
Kennedy, T. W., Huber, G. A., Harrigan, E. T., Cominsky, R. J., Hughes, C. S., Von Quintus, H., Moulthrop, J. S., Superior Performing Asphalt Pavements (Superpave): The Product of the SHRP Asphalt Research Program, Strategic Highway Research Program, National Research Council, Washington, D.C., 1994
Kett, I., Asphalt Materials and Mix Design Manual, Westwood, NJ: Noyes Publications, 1998.
Levy, D. F., “Fundamental Viscosity and How It Is Measured,” Symposium on Fundamental Viscosity of Bituminous Materials,” ASTM STP No 328, New York, NY, 1962.
Martin, J. R., Wallace, H. A., Design and Construction of Asphalt Pavements, New York: McGraw-Hill Book Company, 1958.
McGennis, R. B., Anderson, R. M., Kennedy, T. W., Solaimanian, M., Background of Superpave Asphalt Mixture Design and Analysis, U.S. Department of Transportation, Federal Highway Administration, Washington, D.C., 1995.
National Highway Institute, Superpave for the Generalist Engineer and Project Staff, Publication No. FHWA HI 97-031, 1997.
Reiner, M., Deformation, Strain, and Flow, New York: Wiley-Interscience, 1960.
Roberts, F. L., Kandal, P. S., Brown, E. R., Lee, D., Kennedy, T. W., Hot Mix Asphalt Materials, Mixture Design, and Construction, Second Edition, Maryland: NAPA Research and Education Foundation, 1996.
Schweyer, H. E., “Viscosity Measurement of Asphalt,” Asphalt Paving Technology 50th Anniversary Historical Review and Index of Proceedings, Association of Asphalt Paving Technologists, Williamsburg, 1974.
60
Shuler, T. S., Hanson, D. I., McKeen, R. G., Design and Construction of Asphalt Concrete Using Polymer Modified Asphalt Binders, ASTM Publication, Code Number 04-011080-08, Baltimore, MD, 1992.
Shenoy, A. V., Rheology of Filled Polymer Systems, Great Britain: Kluwer Academic Publishers, 1999.
Sherman, C. C., More Solutions to Sticky Problems, Brookfield Viscometer Guide, Brookfield Engineering Laboratories, Stoughton, MA, 1994.
Solaimanian M., Yildirim, Y., McGennis, R. B., Kennedy, W. T., Evaluation of Superpave Gyratory Compactors, Center for Transportation Research, The University of Texas at Austin, Austin, TX, 1999.
Sombre, R. D., Newcomb, D. E., Chadbourn B., Voller V., “Parameters to Define the Laboratory Compaction Temperature Range of Hot-Mix Asphalt,” Association of Asphalt Paving Technologists, Vol. 67, 1998.
Sousa, J. B., Harvey, J., Painter, L., Deacon, J. A., Monismith, C. L., Evaluation of Laboratory Procedures for Compacting Asphalt Aggregate Mixtures, Institute of Transportation Studies, University of California, 1991.
Traxler, R. N., Asphalt, New York: Reinhold Publishing Corporation, 1961.
The Asphalt Institute, The Asphalt Handbook (MS-4), Maryland, 1967.
Yildirim, Y., Kennedy, T. W., Solaimanian, M., Mixing and Compaction Temperatures for Modified Asphalt Binders, South Central Superpave Center, The University of Texas at Austin, Austin, TX, 1999.
Wardlaw, K. R., Shuler, S., Polymer Modified Asphalt Binders, ASTM Publication, Code Number 04-011080-08, Baltimore, MD, 1992.
Wegan, V., Brule, B., “The Structure of Polymer Modified Binders and Corresponding Asphalt Mixtures,” Association of Asphalt Paving Technologists, Vol. 68, 1999.

61
APPENDIX A

62
63
Performance Grade PG 52 PG 58 PG 64 PG 70
-10 -16 -22 -28 -34 -40 -46 -16 -22 -28 -34 -40 -16 -22 -28 -34 -40 -10 -16 -22 -28
Average 7-day Maximum Pavement Design
Temperature, �C a
<52 <58 <64 <70
Minimum Pavement Design Temperature,
�C a
>-10 >-16 >-22 >-28 >-34 >-40 >-46 >-16 >-22 >-28 >-34 >-40 >-16 >-22 >-28 >-34 >-40 >-10 >-16 >-22 >-28
Original Binder
Flash Point Temp, T48: Minimum �C 230
Viscosity, ASTM D 4402: b Maximum, 3 Pas (3000 cP), Test Temp, �C
135
Dynamic Shear, TP5: c G*/sin �, Minimum, 1.00 kPa Test Temperature @ 10 rad/s, �C
52
58 ı
64
70
Rolling Thin Film Oven (T240)
Mass Loss, Maximum, % 1.00
Dynamic Shear, TP5: G*/sin �, Minimum, 2.20 kPa Test Temp @ 10 rad/sec, �C
52
58
64
70
Pressure Aging Vessel Residue (PP1)
PAV Aging Temperature, �Cd 90 100 100 100(110)
Dynamic Shear, TP5: G*sin �, Maximum, 5000 kPa Test Temp @ 10 rad/sec, �C
25
22
19
16
13
10
7
25
22
19
16
13
28
25
22
19
16
34
31
28
25
Physical Hardening e Report
Creep Stiffness, TP1: f S, Maximum, 300 MPa m-value, Minimum, 0.300 Test Temp, @ 60 sec, �C
0
-6
-12
-18
-24
-30
-36
-6
-12
-18
-24
-30
-6
-12
-18
-24
-30
0
-6
-12
-18
Direct Tension, TP3: f Failure Strain, Minimum, 1.0% Test Temp @ 1.0 mm/min, �C
0
-6
-12
-18
-24
-30
-36
-6
-12
-18
-24
-30
-6
-12
-18
-24
-30
0
-6
-12
-18
Notes:
a. Pavement temperatures can be estimated from air temperatures using an algorithm contained in the SUPERPAVE software
program or may be provided by the specifying agency, or by following the procedures as outlined in PPX. b. This requirement may be waived at the discretion of the specifying agency if the supplier warrants that the asphalt binder can be
adequately pumped and mixed at temperatures that meet all applicable safety standards. c. For quality control of unmodified asphalt cement production, measurement of the viscosity of the original asphalt cement may be
substituted for dynamic shear measurements of G*/sin � at test temperatures where the asphalt is a Newtonian fluid. Any

64
suitable standard means of viscosity measurement may be used, including capillary or rotational viscometry (AASHTO T 201 or T 202).
d. The PAV aging temperature is based on simulated climatic conditions and is one of three temperatures; 90 �C, 100 �C, or 110 �
C. The PAV aging temperature is 100 �C for PG 58- and above, except in desert climates, where it is 110 �C. e. Physical Hardening - TP 1 is performed on a set of asphalt beams according to Section 13.1, except the conditioning time is
extended to 24 hrs + 10 minutes at 10 �C above the minimum performance temperature. The 24-hour stiffness and m-value are reported for information purposes only.
f. If the creep stiffness is below 300 MPa, the direct tension test is not required. If the creep stiffness is between 300 and 600 MPa,
the direct tension failure strain requirement can be used in lieu of the creep stiffness requirement. The m-value requirement must be satisfied in both cases.

65
�
�
APPENDIX B

66
�
�
67
Table B.1. Verification of PG grade for multigrade PG 76-22
Grade Additives Procedure PG 76-22 Multigrade Asphalt Material
DSR DSR Sample Type Original Sample Type RTFO Residue Test Temperature (C) 76 Test Temperature (C) 76 Modulus (G*) (Pascal) 1.0325 x 10 3 Modulus (G*) (Pascal) 2.6249 x 10 3
Phase Angle (�) (degrees ) 75.3 Phase Angle (�) (degrees ) 72.9 G* / sin � (Pascal) 1.0677 x 10 3 G* / sin � (Pascal) 2.7460 x 10 3
Test Status PASSED Test Status PASSED DSR BBR Sample Type PAV Residue Sample Type PAV Residue Test Temperature (C) 31 Test Temperature (C) - 12 Modulus (G*) (Pascal) 2.6989 x 10 3 S 126 Phase Angle (�)(degrees ) 43.7 m – value 0.303 G* sin � (Pascal) 1.8655 x 10 6 Test Status PASSED Test Status PASSED
�
Table B.2. Verification of PG grade for tire rubber PG 76-22
Grade Additives Procedure PG 76-22 Tire rubber Neste Wright
DSR DSR Sample Type Original Sample Type RTFO Residue Test Temperature (C) 76 Test Temperature (C) 76 Modulus (G*) (Pascal) 1.0236 x 10 3 Modulus (G*) (Pascal) 2.324 x 10 3
Phase Angle (�) (degrees ) 70.7 Phase Angle (�) (degrees ) 64.9 G* / sin � (Pascal) 1.0844 x 10 3 G* / sin � (Pascal) 2.5667 x 10 3
Test Status PASSED Test Status PASSED DSR BBR Sample Type PAV Residue Sample Type PAV Residue Test Temperature (C) 31 Test Temperature (C) - 12 Modulus (G*) (Pascal) 2.1693 x 10 3 S 145 Phase Angle (�)(degrees ) 44.3 m – value 0.304 G* sin � (Pascal) 1.5158 x 10 6 Test Status PASSED Test Status PASSED
68
Table B.3. Verification of PG grade for SBS PG 70-22
Grade Additives Procedure PG 70-22 SBS Koch
DSR DSR Sample Type Original Sample Type RTFO Residue Test Temperature (C) 70 " ���" %& ����� �'#(� 70 Modulus (G*) (Pascal) 1.2731 x 10 3 Modulus (G*) (Pascal) 2.5207 x 10 3
Phase Angle (�) (degrees ) 80.3 Phase Angle (�) (degrees ) 81.4 G* / sin � (Pascal) 1.2913 x 10 3 G* / sin � (Pascal) 2.5494 x 10 3
Test Status PASSED Test Status PASSED DSR BBR Sample Type PAV Residue Sample Type PAV Residue Test Temperature (C) 28 Test Temperature (C) - 12 Modulus (G*) (Pascal) 1.9078 x 10 3 S 111 Phase Angle (�)(degrees ) 50.0 m – value 0.329 G* sin � (Pascal) 1.4609 x 10 6 Test Status PASSED Test Status PASSED
�
Table B.4. Verification of PG grade for SBS PG 76-22
Grade Additives Procedure PG 76-22 SBS Gulf State
DSR DSR Sample Type Original Sample Type RTFO Residue Test Temperature (C) 76 Test Temperature (C) 76 Modulus (G*) (Pascal) 1.4044 x 10 3 Modulus (G*) (Pascal) 2.7556 x 10 3
Phase Angle (�) (degrees ) 87.1 Phase Angle (�) (degrees ) 83.3 G* / sin � (Pascal) 1.4062 x 10 3 G* / sin � (Pascal) 2.7747 x 10 3
Test Status PASSED Test Status PASSED DSR BBR Sample Type PAV Residue Sample Type PAV Residue Test Temperature (C) 31 Test Temperature (C) - 12 Modulus (G*) (Pascal) 2.6979 x 10 3 S 106 Phase Angle (�)(degrees ) 56.1 m – value 0.402 G* sin � (Pascal) 2.2396 x 10 6 Test Status PASSED Test Status PASSED
�
�

69
Table B.5. Verification of PG grade for SBR PG 70-22
Grade Additives Procedure PG 70-22 SBR Fina
DSR DSR Sample Type Original Sample Type RTFO Residue Test Temperature (C) 70 Test Temperature (C) 70 Modulus (G*) (Pascal) 1.0736 x 10 3 Modulus (G*) (Pascal) 2.2087 x 10 3
Phase Angle (�) (degrees ) 84.0 Phase Angle (�) (degrees ) 81.1 G* / sin � (Pascal) 1.0795 x 10 3 G* / sin � (Pascal) 2.2356 x 10 3
Test Status PASSED Test Status PASSED DSR BBR Sample Type PAV Residue Sample Type PAV Residue Test Temperature (C) 28 Test Temperature (C) - 12 Modulus (G*) (Pascal) 2.4400 x 10 3 S 95 Phase Angle (�)(degrees ) 49.7 m – value 0.323 G* sin � (Pascal) 1.8607 x 10 6 Test Status PASSED Test Status PASSED
�
Table B.6. Verification of PG grade for unmodified PG 52-28
Grade Additives Procedure PG 52-28 Unmodified Coastal
DSR DSR Sample Type Original Sample Type RTFO Residue Test Temperature (C) 52 Test Temperature (C) 52 Modulus (G*) (Pascal) 1.4909 x 10 3 Modulus (G*) (Pascal) 2.4632 x 10 3
Phase Angle (�) (degrees ) 73.3 Phase Angle (�) (degrees ) 72.6 G* / sin � (Pascal) 1.5565 x 10 3 G* / sin � (Pascal) 2.5821 x 10 3
Test Status PASSED Test Status PASSED DSR BBR Sample Type PAV Residue Sample Type PAV Residue Test Temperature (C) 16 Test Temperature (C) - 18 Modulus (G*) (Pascal) 2.4559 x 10 3 S 174 Phase Angle (�)(degrees ) 57.7 m – value 0.337 G* sin � (Pascal) 2.0764 x 10 6 Test Status PASSED Test Status PASSED
�
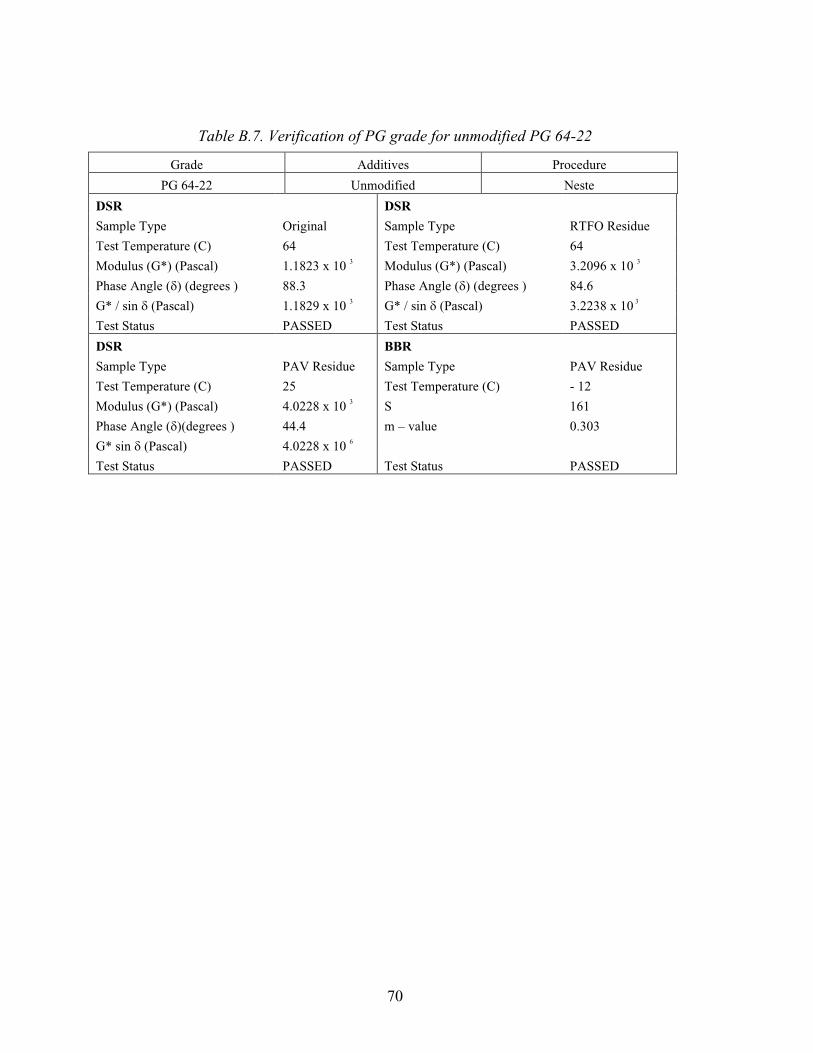
70
Table B.7. Verification of PG grade for unmodified PG 64-22
Grade Additives Procedure
PG 64-22 Unmodified Neste
DSR DSR
Sample Type Original Sample Type RTFO Residue
Test Temperature (C) 64 Test Temperature (C) 64
Modulus (G*) (Pascal) 1.1823 x 10 3 Modulus (G*) (Pascal) 3.2096 x 10 3
Phase Angle (�) (degrees ) 88.3 Phase Angle (�) (degrees ) 84.6
G* / sin � (Pascal) 1.1829 x 10 3 G* / sin � (Pascal) 3.2238 x 10 3
Test Status PASSED Test Status PASSED
DSR BBR
Sample Type PAV Residue Sample Type PAV Residue
Test Temperature (C) 25 Test Temperature (C) - 12
Modulus (G*) (Pascal) 4.0228 x 10 3 S 161
Phase Angle (�)(degrees ) 44.4 m – value 0.303
G* sin � (Pascal) 4.0228 x 10 6
Test Status PASSED Test Status PASSED

71
�
�
APPENDIX C

72
�
�
�
�
�
�
�
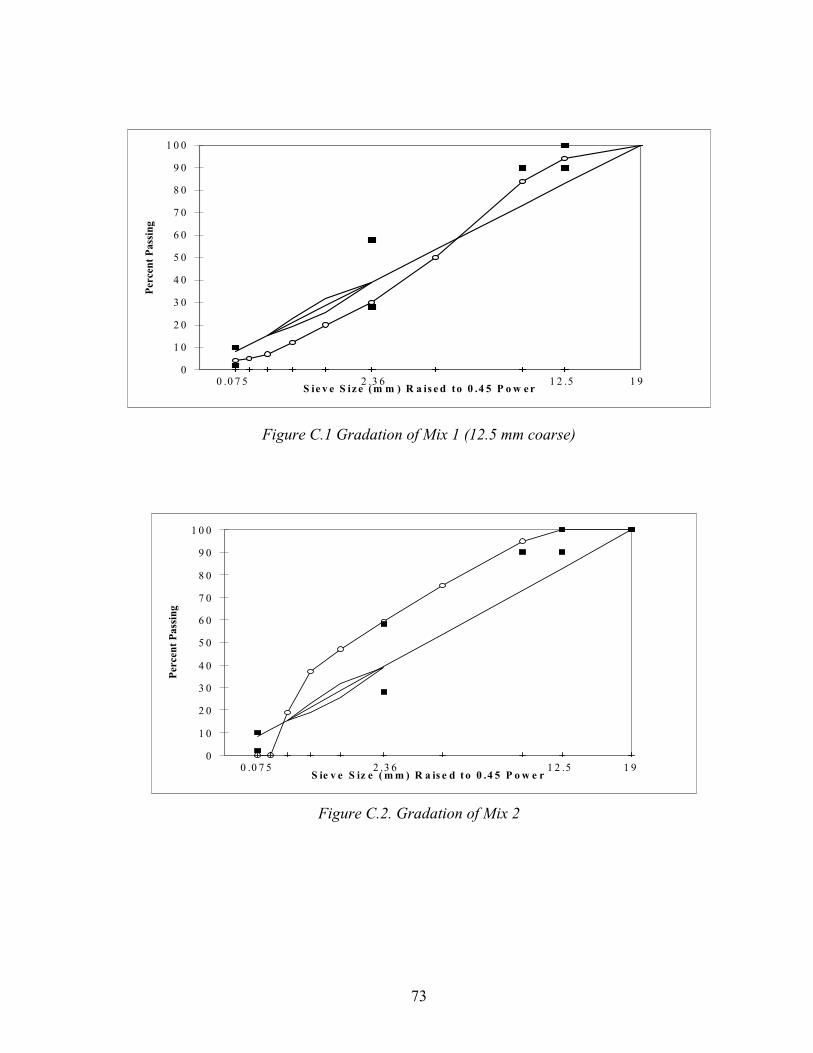
73
�
� �
� �
� �
�
� �
� �
�
� �
�
� � �
� � � � � * � �� � � � � � � " �� ) %' + � �, ��
����� ����� �
� � � ��� �� �� �� �
Figure C.1 Gradation of Mix 1 (12.5 mm coarse)
Figure C.2. Gradation of Mix 2
�
� �
� �
� �
�
� �
� �
�
� �
�
� � �
� � � � � * � ��� � � � � � " � � ) %' + � �, � �
����� ����� �
� � � ��� �� �� �� �

74

75
�
APPENDIX D

76
�
�
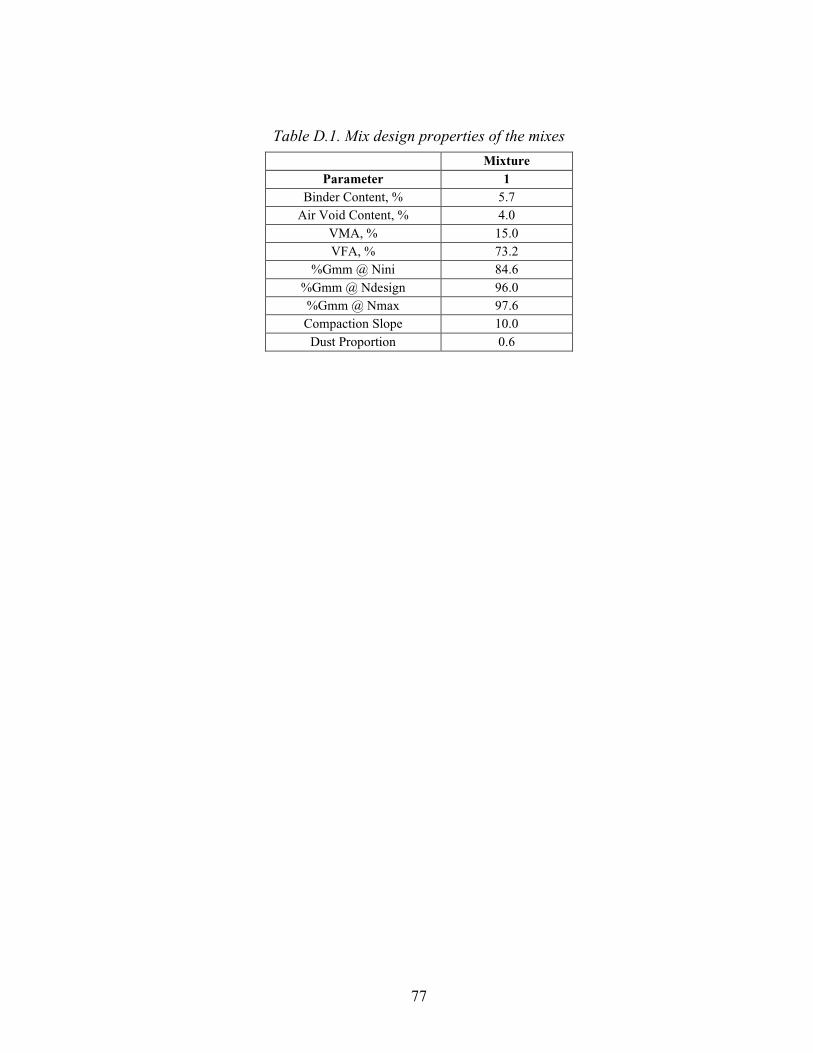
77
Table D.1. Mix design properties of the mixes�
Mixture Parameter 1
Binder Content, % 5.7 Air Void Content, % 4.0
VMA, % 15.0 VFA, % 73.2
%Gmm @ Nini 84.6 %Gmm @ Ndesign 96.0 %Gmm @ Nmax 97.6 Compaction Slope 10.0 Dust Proportion 0.6

78

79
APPENDIX E

80
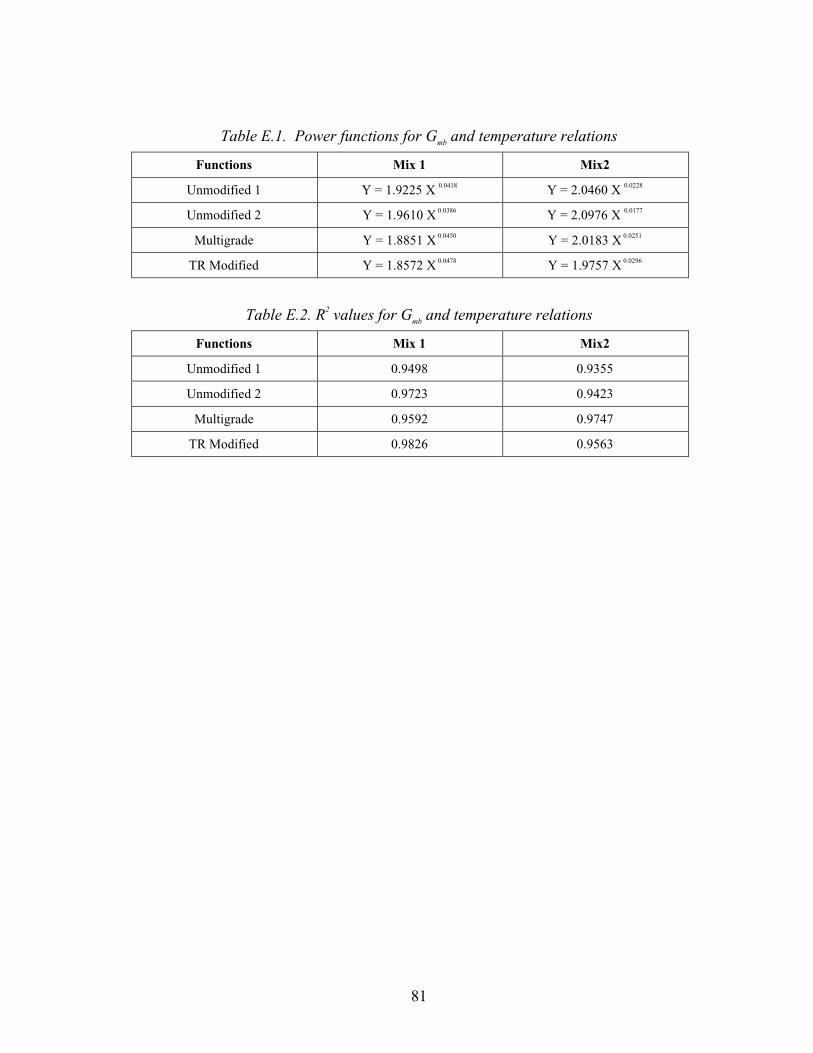
81
Table E.1. Power functions for Gmb and temperature relations
Functions Mix 1 Mix2
Unmodified 1 Y = 1.9225 X 0.0418 Y = 2.0460 X 0.0228
Unmodified 2 Y = 1.9610 X 0.0386 Y = 2.0976 X 0.0177
Multigrade Y = 1.8851 X 0.0450 Y = 2.0183 X 0.0251
TR Modified Y = 1.8572 X 0.0478 Y = 1.9757 X 0.0296
Table E.2. R2 values for Gmb and temperature relations
Functions Mix 1 Mix2
Unmodified 1 0.9498 0.9355
Unmodified 2 0.9723 0.9423
Multigrade 0.9592 0.9747
TR Modified 0.9826 0.9563

82

83
APPENDIX F

84
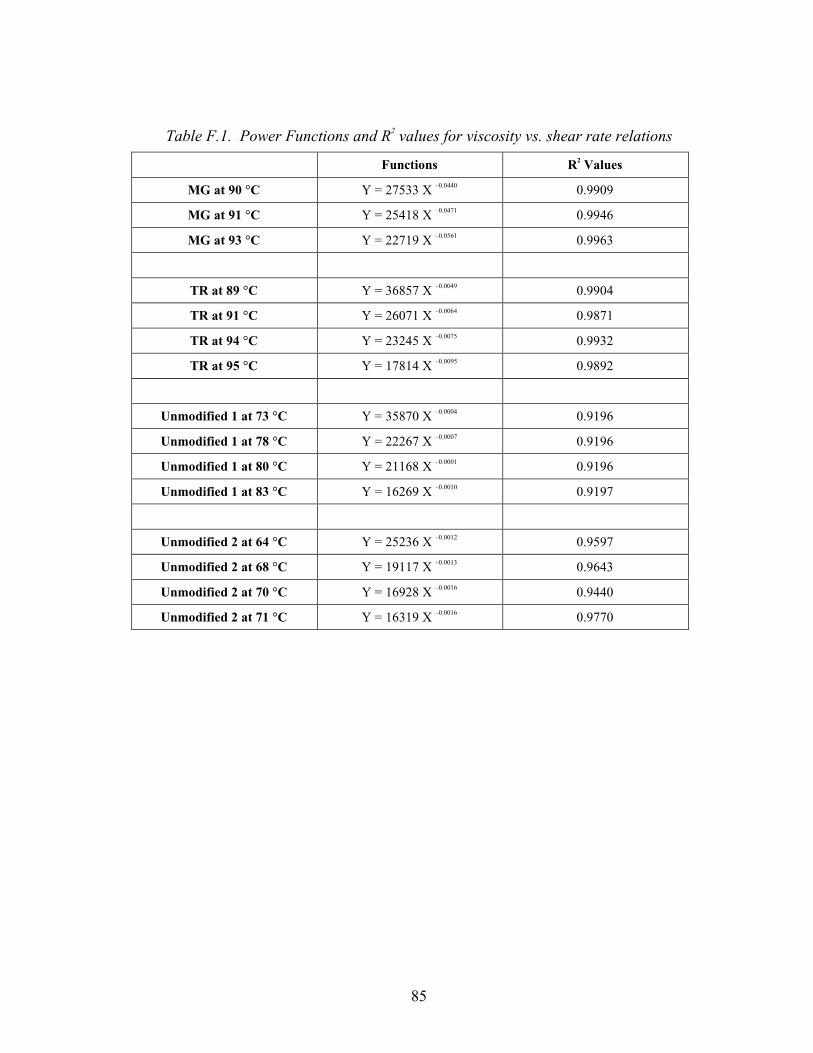
85
Table F.1. Power Functions and R2 values for viscosity vs. shear rate relations
Functions R2 Values
MG at 90 �C Y = 27533 X –0.0440 0.9909
MG at 91 �C Y = 25418 X –0.0471 0.9946
MG at 93 �C Y = 22719 X –0.0561 0.9963
TR at 89 �C Y = 36857 X –0.0049 0.9904
TR at 91 �C Y = 26071 X –0.0064 0.9871
TR at 94 �C Y = 23245 X –0.0075 0.9932
TR at 95 �C Y = 17814 X –0.0095 0.9892
Unmodified 1 at 73 �C Y = 35870 X –0.0004 0.9196
Unmodified 1 at 78 �C Y = 22267 X –0.0007 0.9196
Unmodified 1 at 80 �C Y = 21168 X –0.0001 0.9196
Unmodified 1 at 83 �C Y = 16269 X –0.0010 0.9197
Unmodified 2 at 64 �C Y = 25236 X –0.0012 0.9597
Unmodified 2 at 68 �C Y = 19117 X –0.0013 0.9643
Unmodified 2 at 70 �C Y = 16928 X –0.0016 0.9440
Unmodified 2 at 71 �C Y = 16319 X –0.0016 0.9770