methodological considerations in developing hospital ... · methodological considerations in...
TRANSCRIPT
Methodological Considerations in Methodological Considerations in Developing Hospital Composite Developing Hospital Composite
Performance MeasuresPerformance MeasuresSean M. OSean M. O’’Brien, PhDBrien, PhD
Department of Biostatistics & BioinformaticsDepartment of Biostatistics & Bioinformatics Duke University Medical CenterDuke University Medical Center
sean.osean.o’’[email protected]@dcri.duke.edu
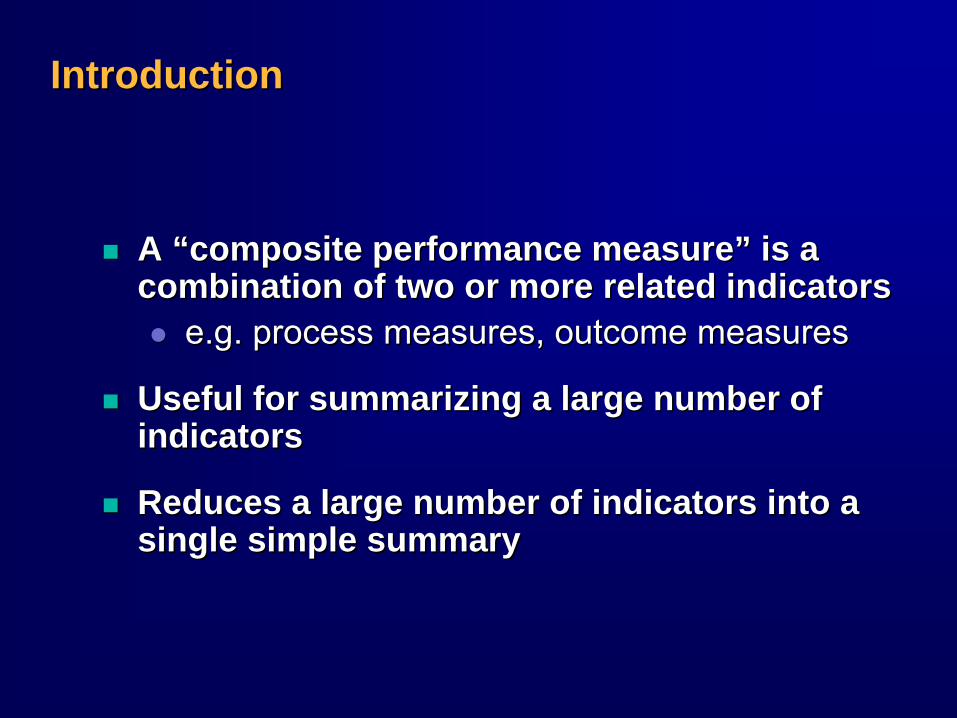
IntroductionIntroduction
A A ““composite performance measurecomposite performance measure”” is a is a combination of two or more related indicatorscombination of two or more related indicators
e.g. process measures, outcome measurese.g. process measures, outcome measures
Useful for summarizing a large number of Useful for summarizing a large number of indicatorsindicators
Reduces a large number of indicators into a Reduces a large number of indicators into a single simple summarysingle simple summary
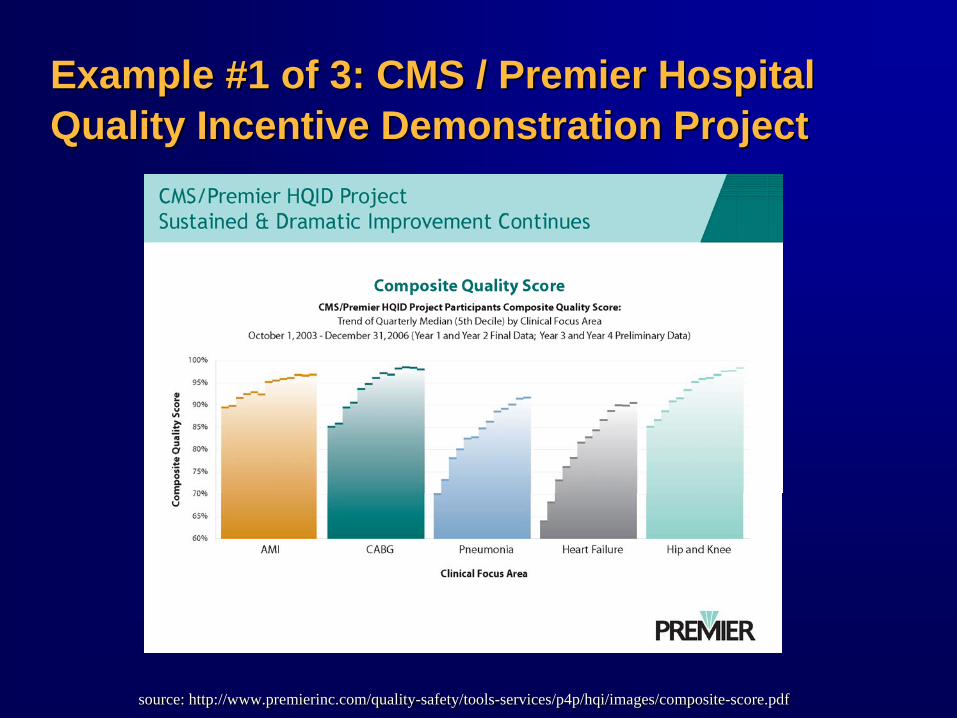
Example #1 of 3: CMS / Premier Hospital Example #1 of 3: CMS / Premier Hospital Quality Incentive Demonstration ProjectQuality Incentive Demonstration Project
source: http://www.premierinc.com/quality-safety/tools-services/p4p/hqi/images/composite-score.pdfsource: http://www.premierinc.com/quality-safety/tools-services/p4p/hqi/images/composite-score.pdf
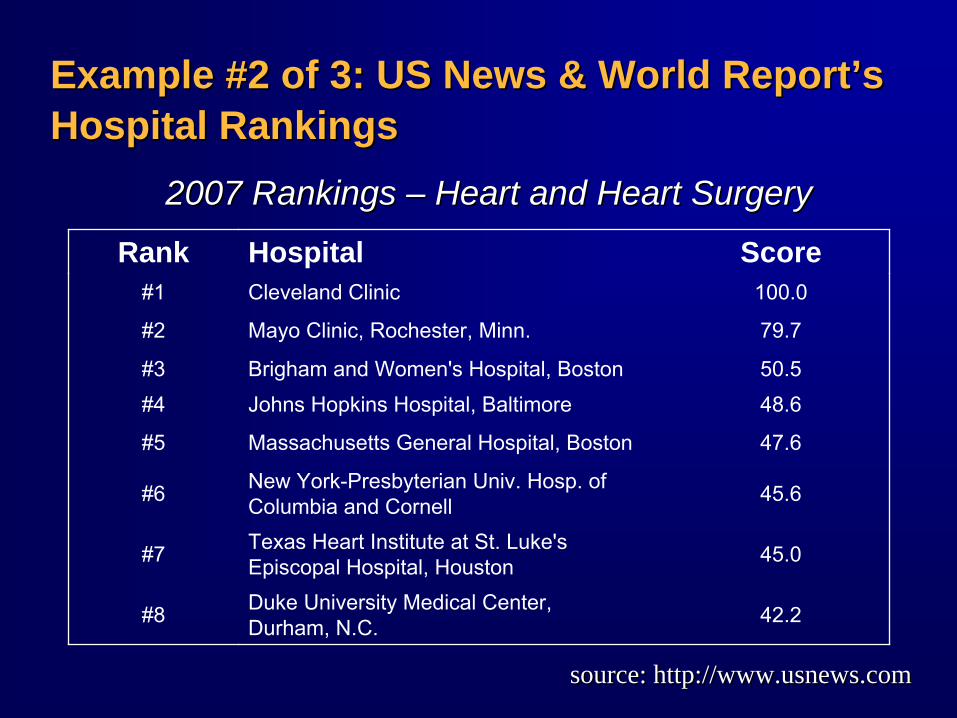
Example #2 of 3: US News & World ReportExample #2 of 3: US News & World Report’’s s Hospital RankingsHospital Rankings
Rank Hospital Score#1 Cleveland Clinic 100.0
#2 Mayo Clinic, Rochester, Minn. 79.7
#3 Brigham and Women's Hospital, Boston 50.5#4 Johns Hopkins Hospital, Baltimore 48.6
#5 Massachusetts General Hospital, Boston 47.6
#6 New York-Presbyterian Univ. Hosp. of Columbia and Cornell 45.6
#7 Texas Heart Institute at St. Luke's Episcopal Hospital, Houston 45.0
#8 Duke University Medical Center, Durham, N.C. 42.2
source: http://www.usnews.comsource: http://www.usnews.com
2007 Rankings 2007 Rankings –– Heart and Heart SurgeryHeart and Heart Surgery
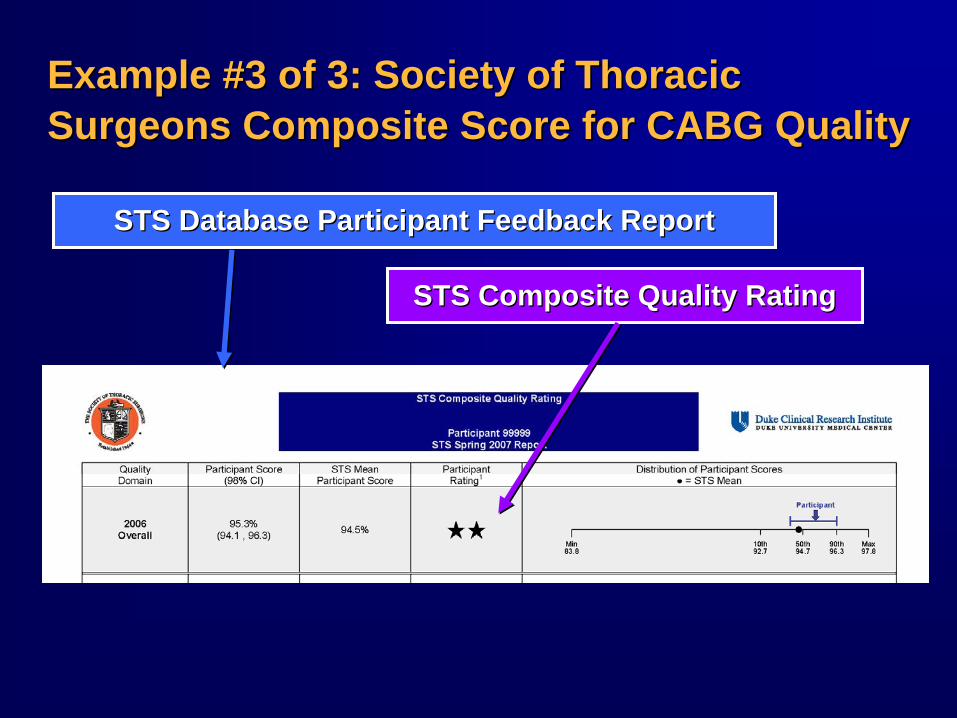
Example #3 of 3: Society of Thoracic Example #3 of 3: Society of Thoracic Surgeons Composite Score for CABG Quality Surgeons Composite Score for CABG Quality
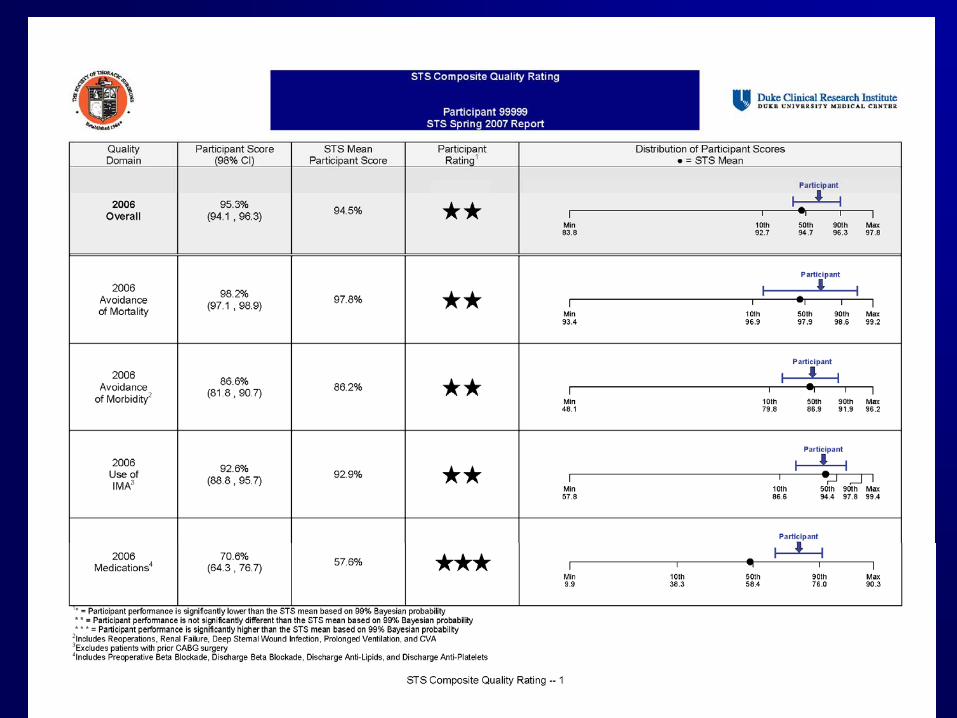
STS Composite Quality RatingSTS Composite Quality Rating
STS Database Participant Feedback ReportSTS Database Participant Feedback Report
Why Composite Measures?Why Composite Measures?
Simplifies reportingSimplifies reporting
Facilitates rankingFacilitates ranking
More comprehensive than single measureMore comprehensive than single measure
More precision than single measureMore precision than single measure
Limitations of Composite MeasuresLimitations of Composite Measures
Loss of informationLoss of information
Requires subjective weightingRequires subjective weightingNo single objective methodologyNo single objective methodology
Hospital rankings may depend on weights Hospital rankings may depend on weights
Hard to interpretHard to interpretMay seem like a May seem like a ““black boxblack box””Not always clear what is being measuredNot always clear what is being measured
GoalsGoals
Discuss methodological issues & approaches Discuss methodological issues & approaches for constructing composite scoresfor constructing composite scores
Illustrate inherent limitations of composite Illustrate inherent limitations of composite scoresscores
OutlineOutline
Motivating Example: Motivating Example: US News & World Reports US News & World Reports ““Best HospitalsBest Hospitals””
Case Study:Case Study:Developing a Composite Score for CABGDeveloping a Composite Score for CABG
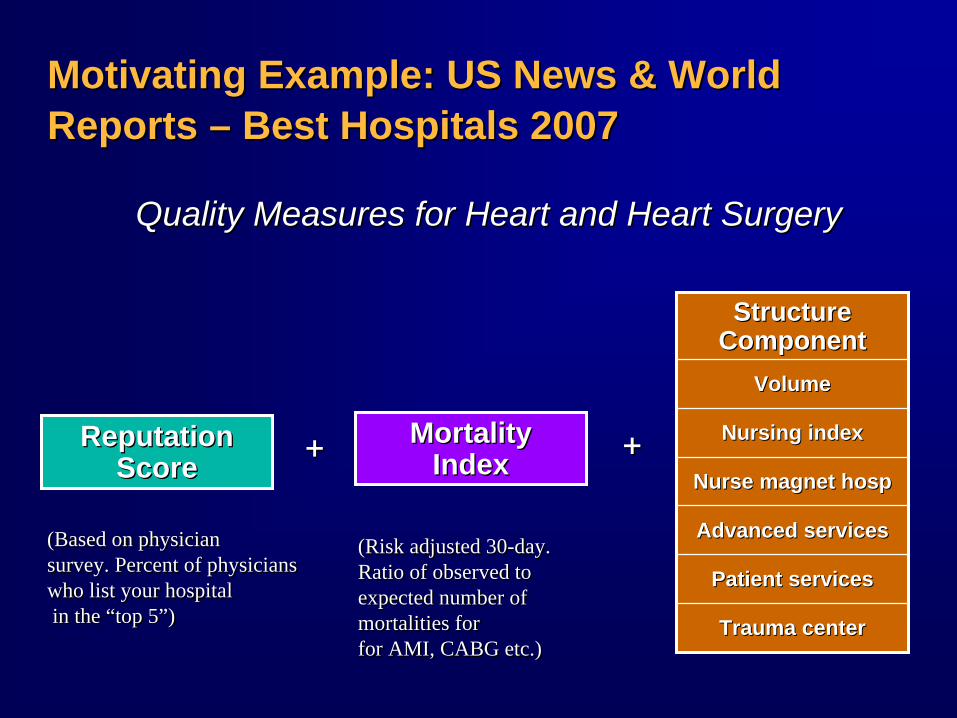
Reputation Reputation ScoreScore
Motivating Example: US News & World Motivating Example: US News & World Reports Reports –– Best Hospitals 2007Best Hospitals 2007
Quality Measures for Heart and Heart SurgeryQuality Measures for Heart and Heart Surgery
Mortality Mortality IndexIndex
Structure Structure ComponentComponent
VolumeVolume
Nursing indexNursing index
Nurse magnet hospNurse magnet hosp
Advanced servicesAdvanced services
Patient servicesPatient services
Trauma centerTrauma center
(Based on physician survey. Percent of physicians who list your hospital in the “top 5”)
(Based on physician survey. Percent of physicians who list your hospital in the “top 5”)
(Risk adjusted 30-day. Ratio of observed to expected number of mortalities for for AMI, CABG etc.)
(Risk adjusted 30-day. Ratio of observed to expected number of mortalities for for AMI, CABG etc.)
++++
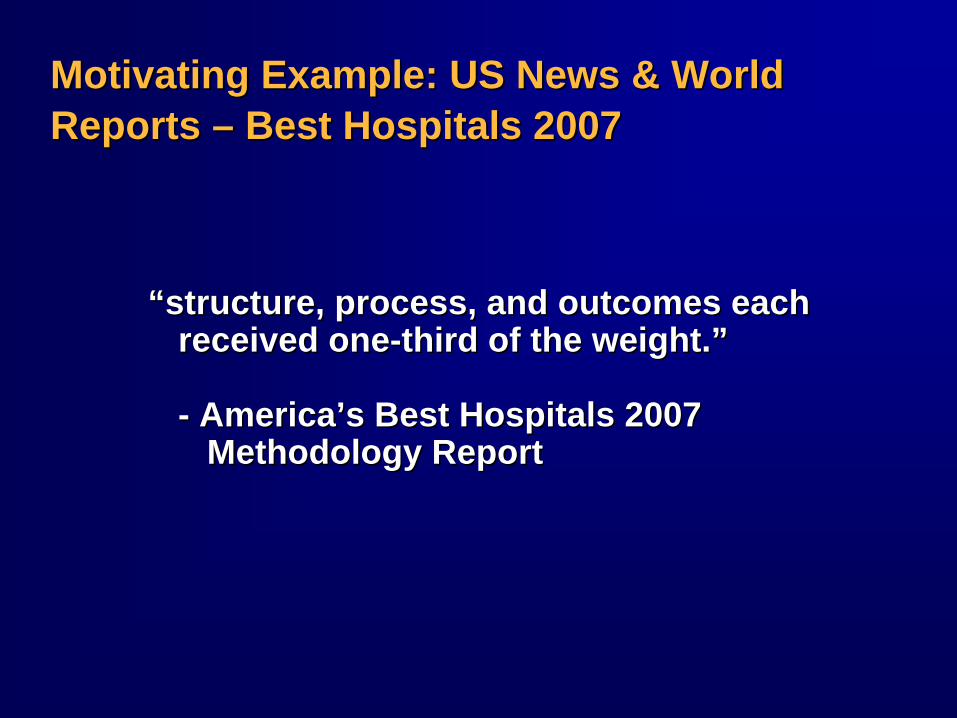
Motivating Example: US News & World Motivating Example: US News & World Reports Reports –– Best Hospitals 2007Best Hospitals 2007
““structure, process, and outcomes each structure, process, and outcomes each received onereceived one--third of the weight.third of the weight.””
-- AmericaAmerica’’s Best Hospitals 2007s Best Hospitals 2007 Methodology ReportMethodology Report
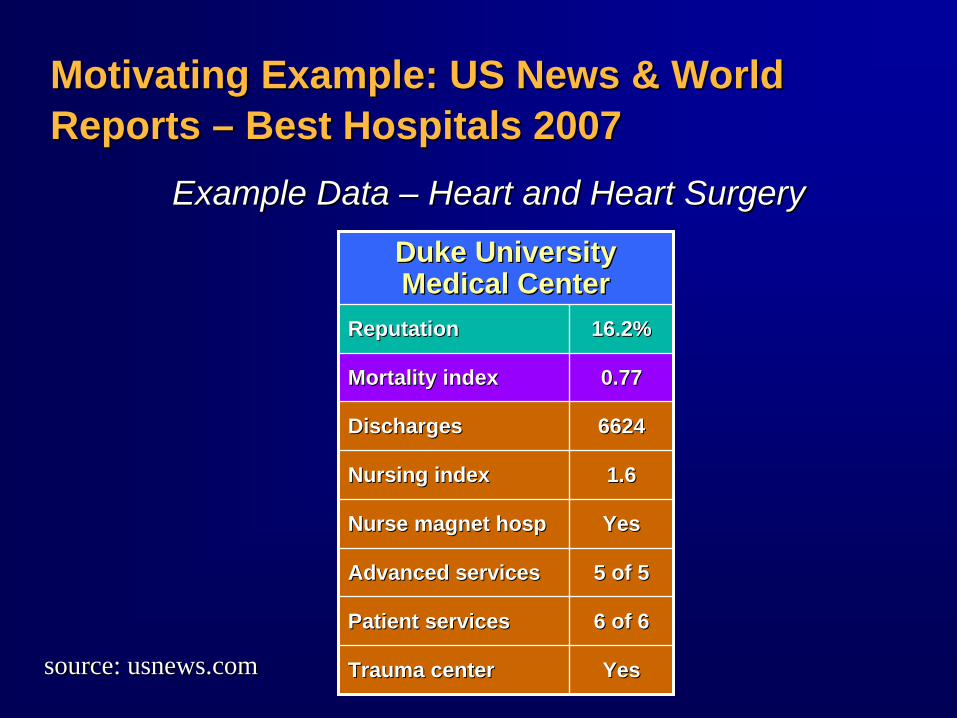
Duke University Duke University Medical CenterMedical Center
ReputationReputation 16.2%16.2%
Mortality indexMortality index 0.770.77
DischargesDischarges 66246624
Nursing indexNursing index 1.61.6
Nurse magnet hospNurse magnet hosp YesYes
Advanced servicesAdvanced services 5 of 55 of 5
Patient servicesPatient services 6 of 66 of 6
Trauma centerTrauma center YesYes
Motivating Example: US News & World Motivating Example: US News & World Reports Reports –– Best Hospitals 2007 Best Hospitals 2007
Example Data Example Data –– Heart and Heart SurgeryHeart and Heart Surgery
source: usnews.comsource: usnews.com
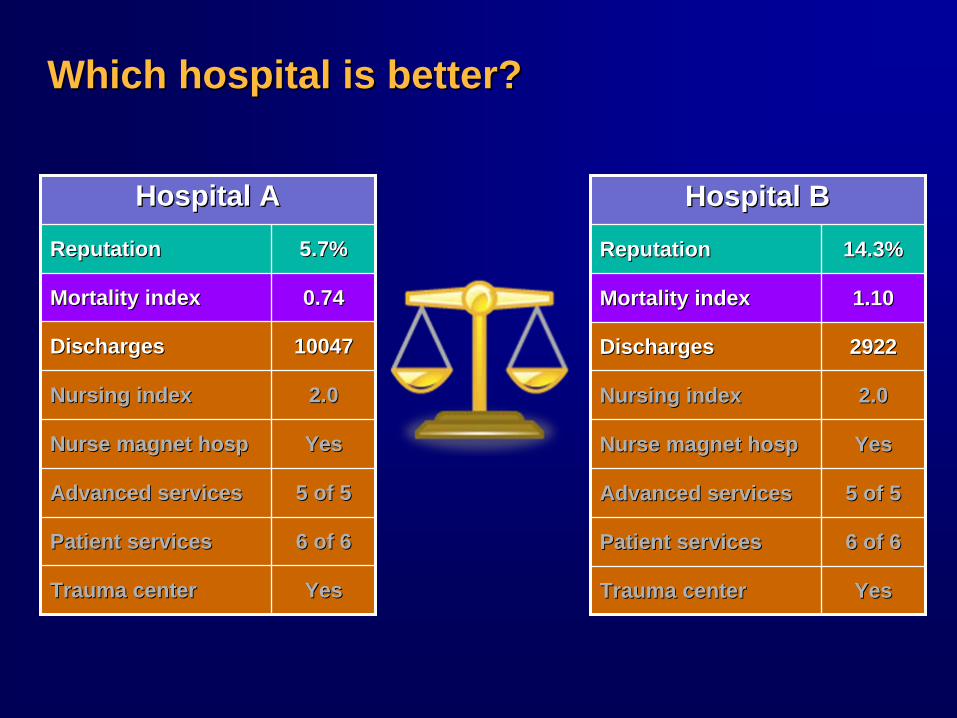
Which hospital is better? Which hospital is better?
Hospital AHospital A
ReputationReputation 5.7%5.7%
Mortality indexMortality index 0.740.74
DischargesDischarges 1004710047
Nursing indexNursing index 2.02.0
Nurse magnet hospNurse magnet hosp YesYes
Advanced servicesAdvanced services 5 of 55 of 5
Patient servicesPatient services 6 of 66 of 6
Trauma centerTrauma center YesYes
Hospital BHospital B
ReputationReputation 14.3%14.3%
Mortality indexMortality index 1.101.10
DischargesDischarges 29222922
Nursing indexNursing index 2.02.0
Nurse magnet hospNurse magnet hosp YesYes
Advanced servicesAdvanced services 5 of 55 of 5
Patient servicesPatient services 6 of 66 of 6
Trauma centerTrauma center YesYes
40
50
60
70
80
90
100
10% 20% 30% 40% 50% 60% 70%
Reputation Score
Ove
rall
Scor
e
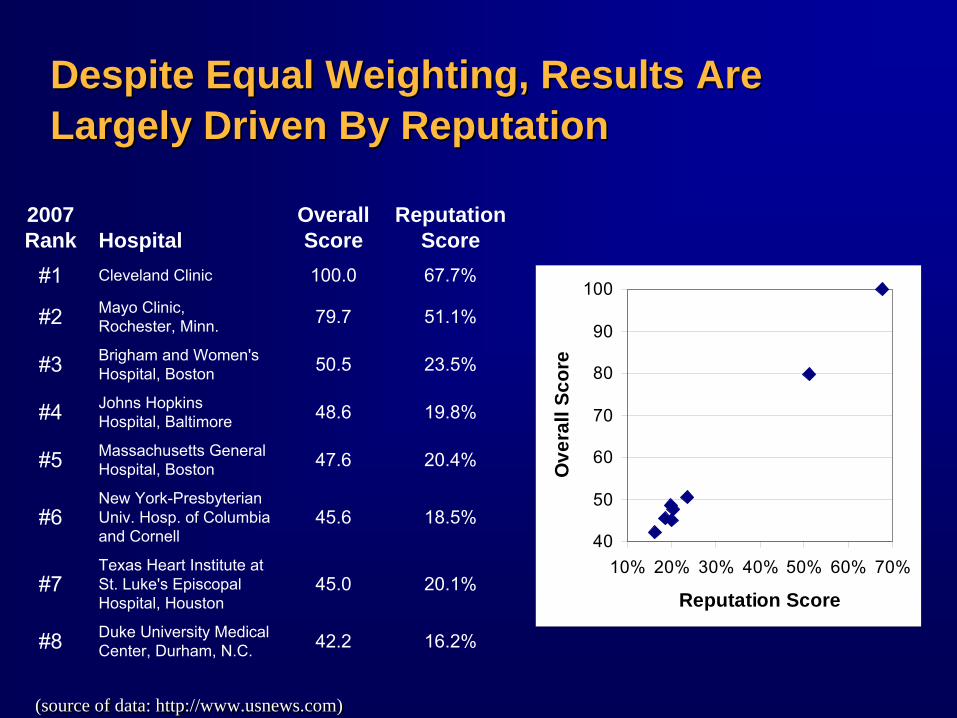
Despite Equal Weighting, Results Are Despite Equal Weighting, Results Are Largely Driven By ReputationLargely Driven By Reputation
2007 Rank Hospital
OverallScore
ReputationScore
#1 Cleveland Clinic 100.0 67.7%
#2 Mayo Clinic, Rochester, Minn. 79.7 51.1%
#3 Brigham and Women's Hospital, Boston 50.5 23.5%
#4 Johns Hopkins Hospital, Baltimore 48.6 19.8%
#5 Massachusetts General Hospital, Boston 47.6 20.4%
#6New York-Presbyterian Univ. Hosp. of Columbia and Cornell
45.6 18.5%
#7Texas Heart Institute at St. Luke's Episcopal Hospital, Houston
45.0 20.1%
#8 Duke University Medical Center, Durham, N.C. 42.2 16.2%
(source of data: http://www.usnews.com)(source of data: http://www.usnews.com)
Lesson for Hospital Administrators (?)Lesson for Hospital Administrators (?)
Best way to improve your score is to boost Best way to improve your score is to boost your reputationyour reputation
Focus on publishing, research, etc.Focus on publishing, research, etc.
Improving your mortality rate may have a Improving your mortality rate may have a modest impactmodest impact
Lesson for Composite Measure DevelopersLesson for Composite Measure Developers
No single No single ““objectiveobjective”” method of choosing method of choosing weightsweights
““Equal weightingEqual weighting”” may not always behave may not always behave like it soundslike it sounds
Case Study: Composite Measurement for Case Study: Composite Measurement for Coronary Artery Bypass SurgeryCoronary Artery Bypass Surgery
BackgroundBackground
Society of Thoracic Surgeons (STS) Society of Thoracic Surgeons (STS) ––Adult Cardiac DatabaseAdult Cardiac Database
Since 1990Since 1990Largest quality improvement registry for Largest quality improvement registry for adult cardiac surgeryadult cardiac surgeryPrimarily for internal feedbackPrimarily for internal feedbackIncreasingly used for reporting to 3Increasingly used for reporting to 3rdrd partiesparties
STS Quality Measurement Taskforce (QMTF)STS Quality Measurement Taskforce (QMTF)Created in 2005Created in 2005First task: Develop a composite score for First task: Develop a composite score for CABG for use by 3CABG for use by 3rdrd party payersparty payers
Why Not Use the CMS HQID Composite Why Not Use the CMS HQID Composite Score?Score?
Choice of measuresChoice of measuresSome HQID measures not available in STSSome HQID measures not available in STS
(Also, some nationally endorsed measures (Also, some nationally endorsed measures are not included in HQID)are not included in HQID)
Weighting of process vs. outcome measuresWeighting of process vs. outcome measuresHQID is heavily weighted toward HQID is heavily weighted toward process measuresprocess measuresSTS QMTF surgeons wanted a score that STS QMTF surgeons wanted a score that was heavily driven by outcomeswas heavily driven by outcomes
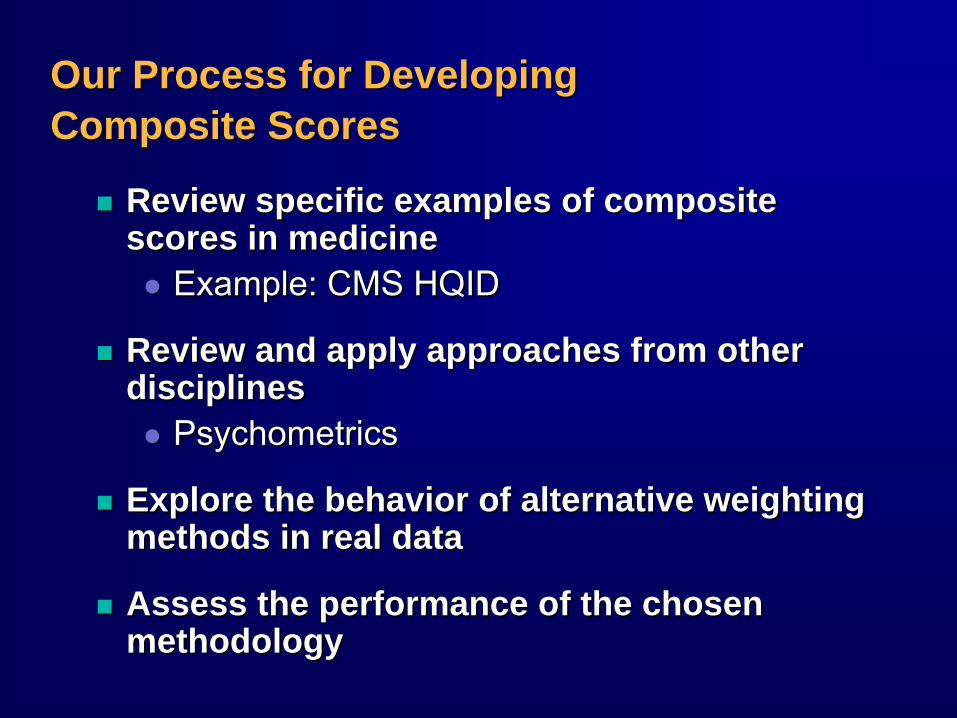
Our Process for Developing Our Process for Developing Composite ScoresComposite Scores
Review specific examples of composite Review specific examples of composite scores in medicinescores in medicine
Example: CMS HQIDExample: CMS HQID
Review and apply approaches from other Review and apply approaches from other disciplinesdisciplines
PsychometricsPsychometrics
Explore the behavior of alternative weighting Explore the behavior of alternative weighting methods in real datamethods in real data
Assess the performance of the chosen Assess the performance of the chosen methodologymethodology
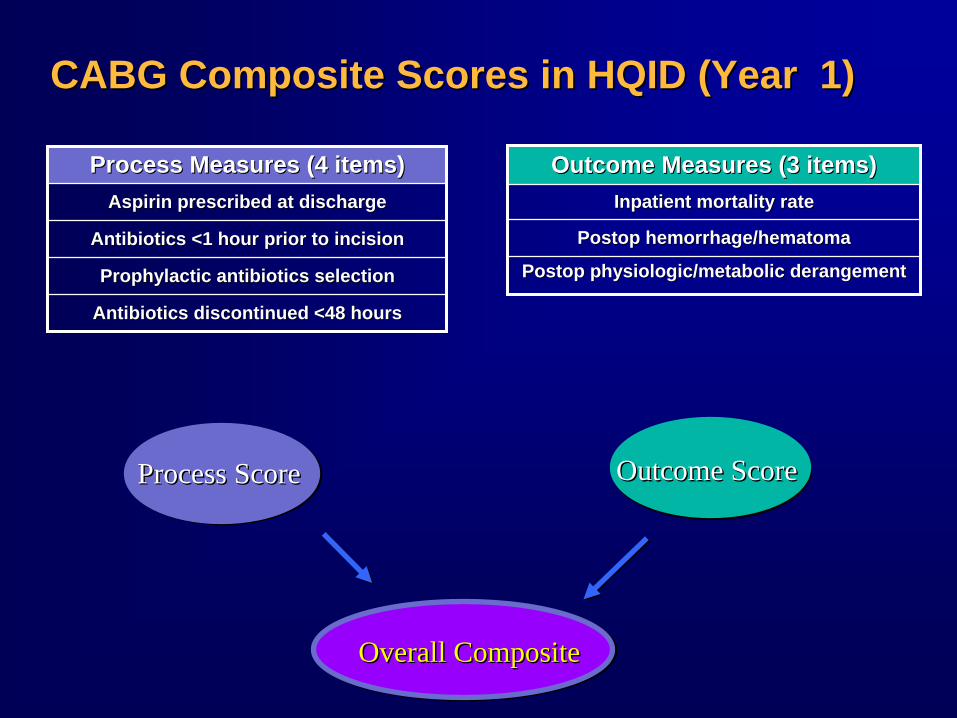
CABG Composite Scores in HQID (Year 1)CABG Composite Scores in HQID (Year 1)
Process Measures (4 items)Process Measures (4 items)Aspirin prescribed at dischargeAspirin prescribed at discharge
Antibiotics <1 hour prior to incisionAntibiotics <1 hour prior to incision
Prophylactic antibiotics selectionProphylactic antibiotics selection
Antibiotics discontinued <48 hoursAntibiotics discontinued <48 hours
Outcome Measures (3 items)Outcome Measures (3 items)Inpatient mortality rateInpatient mortality rate
PostopPostop hemorrhage/hemorrhage/hematomahematoma
PostopPostop physiologic/metabolic derangementphysiologic/metabolic derangement
Process ScoreProcess Score Outcome ScoreOutcome Score
Overall CompositeOverall Composite
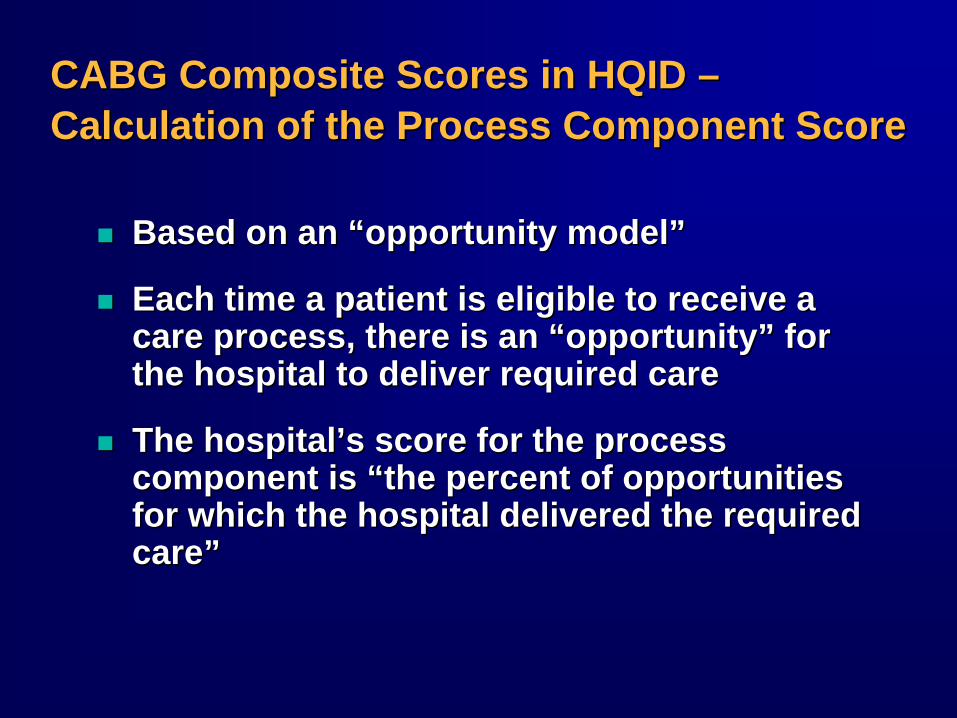
CABG Composite Scores in HQID CABG Composite Scores in HQID –– Calculation of the Process Component ScoreCalculation of the Process Component Score
Based on an Based on an ““opportunity modelopportunity model””
Each time a patient is eligible to receive a Each time a patient is eligible to receive a care process, there is an care process, there is an ““opportunityopportunity”” for for the hospital to deliver required carethe hospital to deliver required care
The hospitalThe hospital’’s score for the process s score for the process component is component is ““the percent of opportunities the percent of opportunities for which the hospital delivered the required for which the hospital delivered the required carecare””
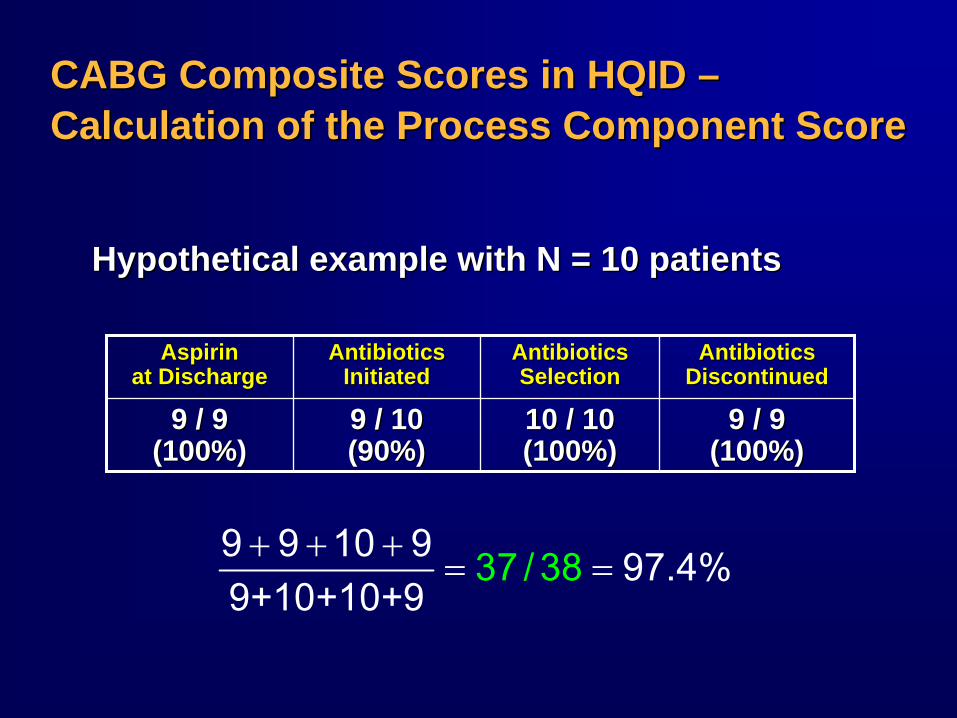
CABG Composite Scores in HQID CABG Composite Scores in HQID –– Calculation of the Process Component ScoreCalculation of the Process Component Score
AspirinAspirin at Dischargeat Discharge
AntibioticsAntibiotics InitiatedInitiated
AntibioticsAntibiotics SelectionSelection
AntibioticsAntibiotics DiscontinuedDiscontinued
9 / 99 / 9 (100%)(100%)
9 / 109 / 10 (90%)(90%)
10 / 1010 / 10 (100%)(100%)
9 / 99 / 9 (100%)(100%)
Hypothetical example with N = 10 patientsHypothetical example with N = 10 patients
9 9 10 9 97.4%9+10+10
37 / 38+9
+ + += =
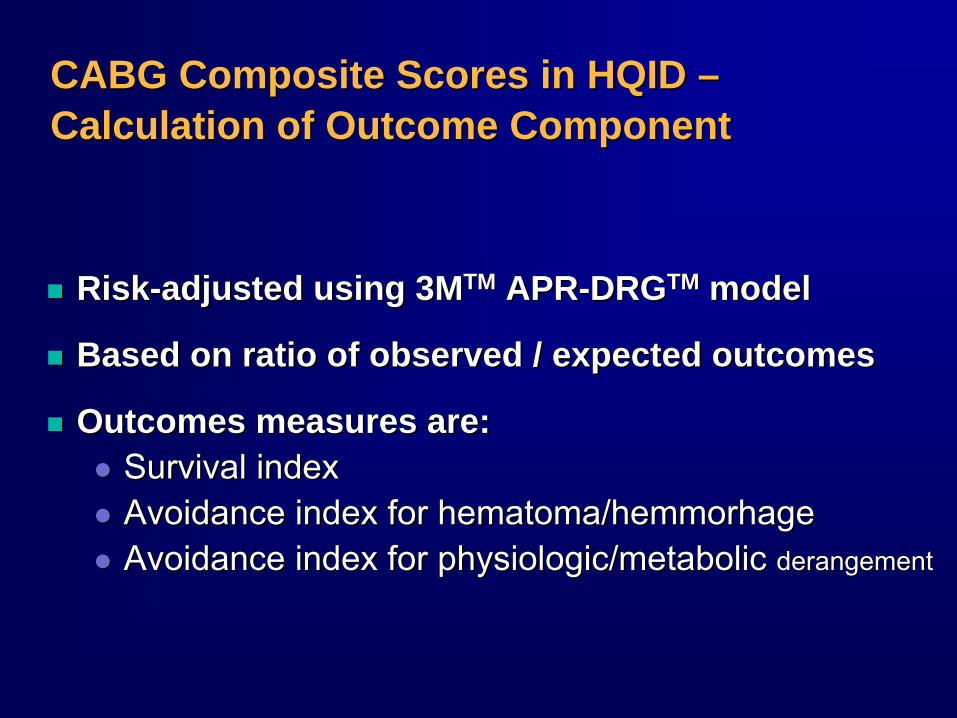
CABG Composite Scores in HQID CABG Composite Scores in HQID –– Calculation of Outcome ComponentCalculation of Outcome Component
RiskRisk--adjusted using 3Madjusted using 3MTMTM APRAPR--DRGDRGTMTM modelmodel
Based on ratio of observed / expected outcomesBased on ratio of observed / expected outcomes
Outcomes measures are:Outcomes measures are:Survival indexSurvival indexAvoidance index for Avoidance index for hematoma/hemmorhagehematoma/hemmorhageAvoidance index for physiologic/metabolic Avoidance index for physiologic/metabolic derangementderangement
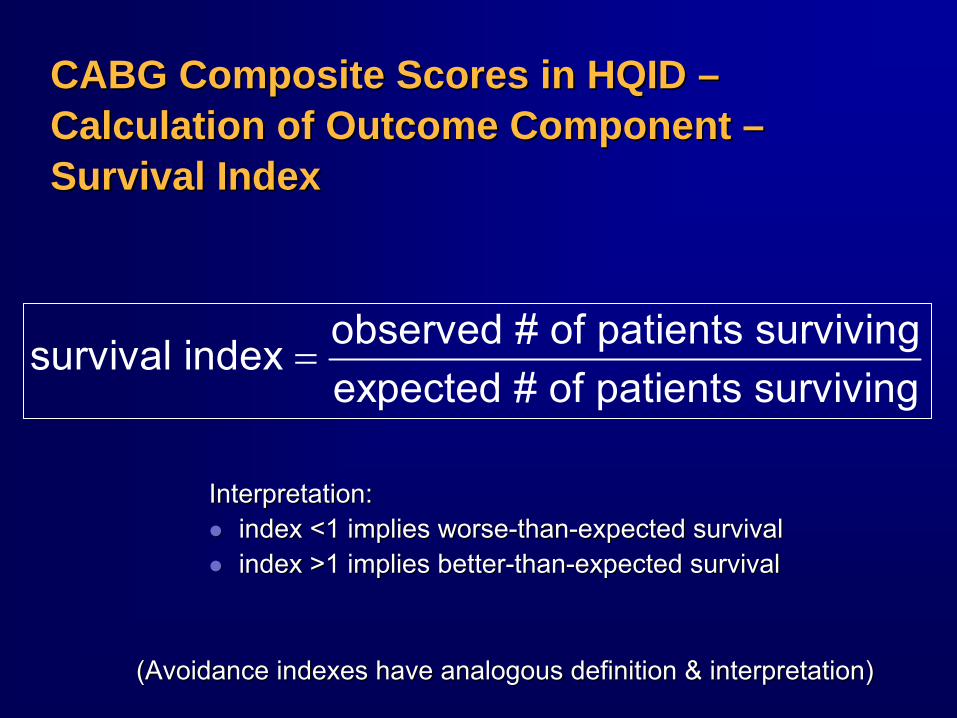
CABG Composite Scores in HQID CABG Composite Scores in HQID –– Calculation of Outcome Component Calculation of Outcome Component –– Survival IndexSurvival Index
observed # of patients survivingsurvival indexexpected # of patients surviving
=
Interpretation:Interpretation:index <1 implies worseindex <1 implies worse--thanthan--expected survivalexpected survivalindex >1 implies betterindex >1 implies better--thanthan--expected survivalexpected survival
(Avoidance indexes have analogous definition & interpretation)(Avoidance indexes have analogous definition & interpretation)
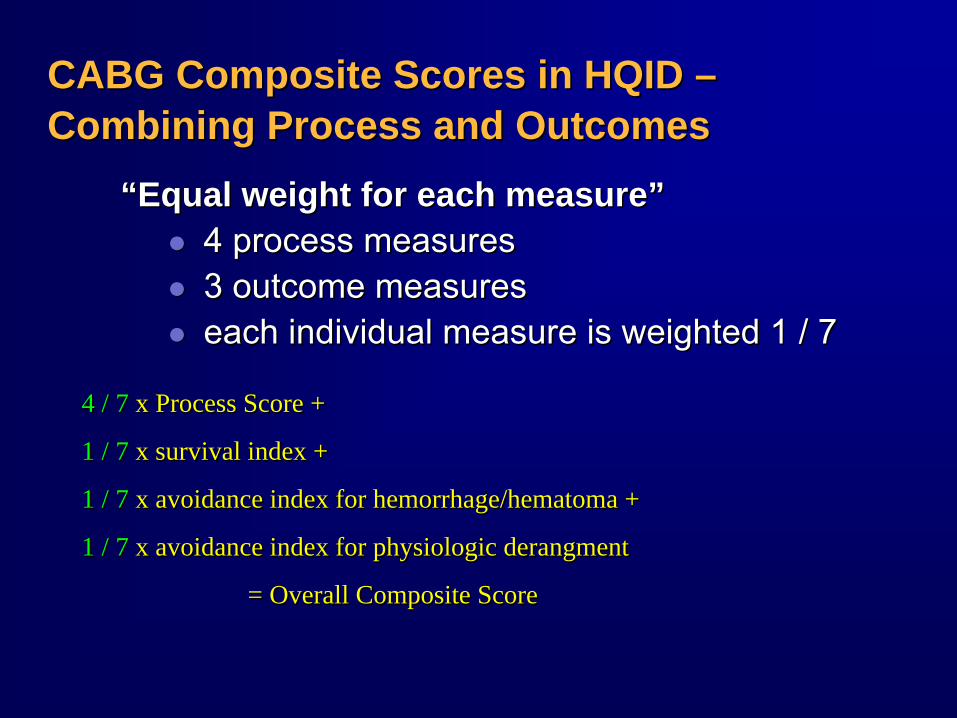
CABG Composite Scores in HQID CABG Composite Scores in HQID –– Combining Process and OutcomesCombining Process and Outcomes
4 / 7 x Process Score +
1 / 7 x survival index +
1 / 7 x avoidance index for hemorrhage/hematoma +
1 / 7 x avoidance index for physiologic derangment
= Overall Composite Score
4 / 7 x Process Score +
1 / 7 x survival index +
1 / 7 x avoidance index for hemorrhage/hematoma +
1 / 7 x avoidance index for physiologic derangment
= Overall Composite Score
““Equal weight for each measureEqual weight for each measure””4 process measures4 process measures3 outcome measures3 outcome measureseach individual measure is weighted 1 / 7each individual measure is weighted 1 / 7
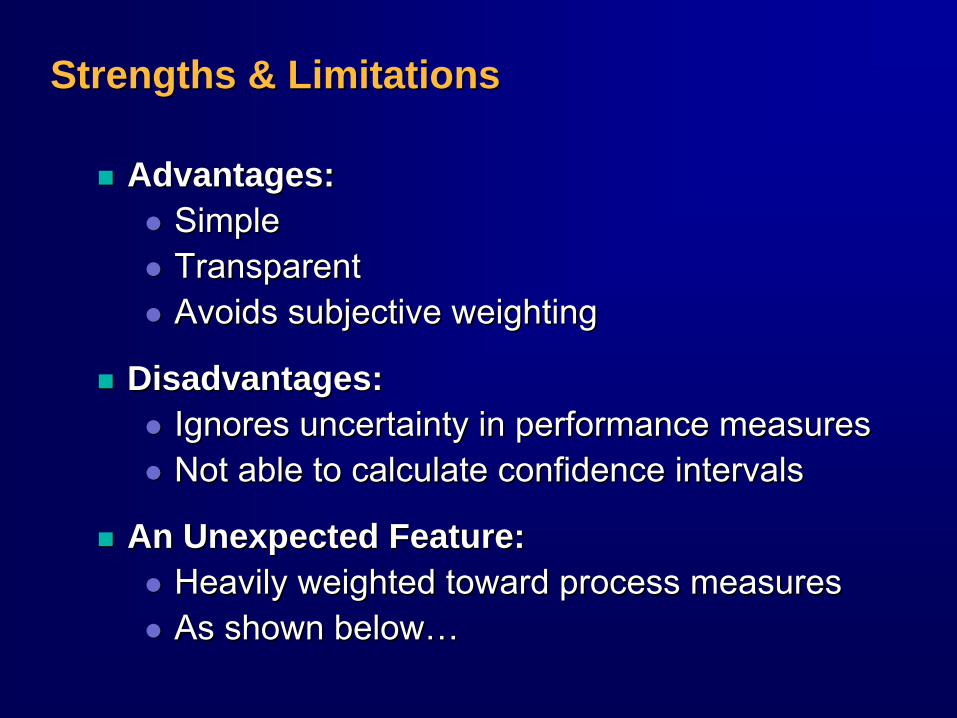
Strengths & LimitationsStrengths & Limitations
Advantages:Advantages:Simple Simple TransparentTransparentAvoids subjective weightingAvoids subjective weighting
Disadvantages:Disadvantages:Ignores uncertainty in performance measuresIgnores uncertainty in performance measuresNot able to calculate confidence intervalsNot able to calculate confidence intervals
An Unexpected Feature:An Unexpected Feature:Heavily weighted toward process measuresHeavily weighted toward process measuresAs shown belowAs shown below……
CABG Composite Scores in HQID CABG Composite Scores in HQID –– Exploring the Implications of Equal WeightingExploring the Implications of Equal Weighting
HQID performance measures are publicly HQID performance measures are publicly reported for the top 50% of hospitalsreported for the top 50% of hospitals
Used these publicly reported data to study Used these publicly reported data to study the weighting of process vs. outcomesthe weighting of process vs. outcomes
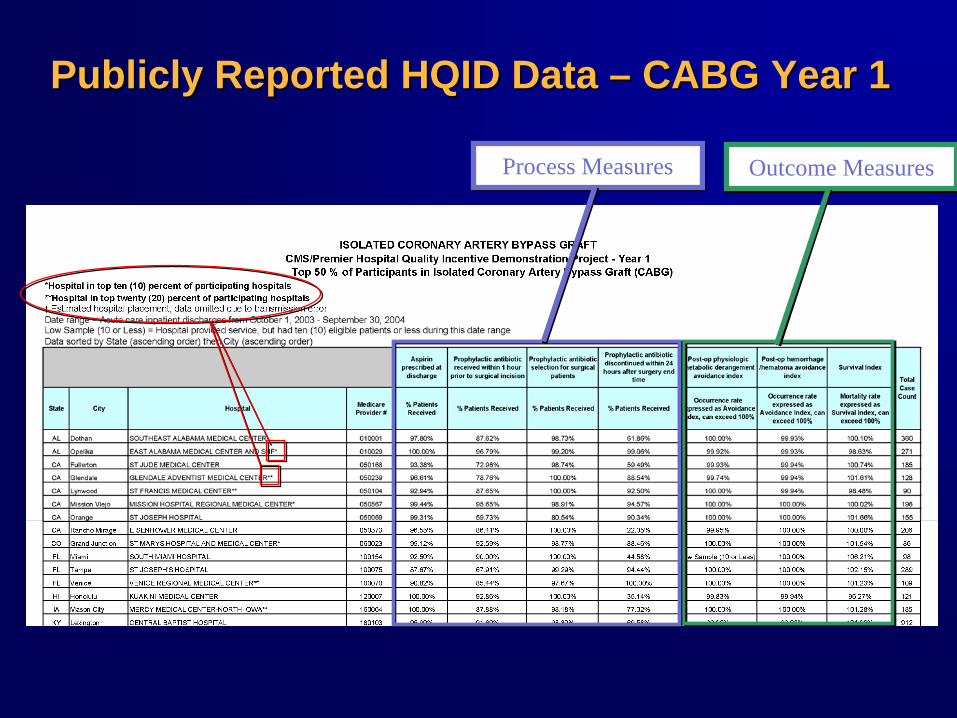
Publicly Reported HQID Data Publicly Reported HQID Data –– CABG Year 1CABG Year 1
Process MeasuresProcess Measures Outcome MeasuresOutcome Measures
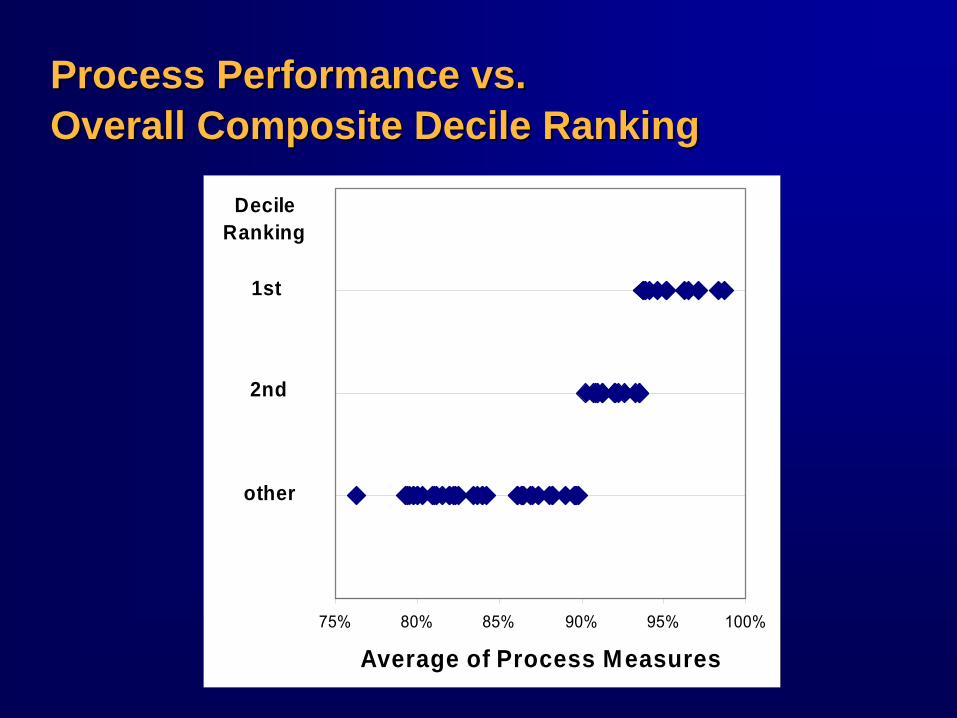
Process Performance vs.Process Performance vs. Overall Composite Overall Composite DecileDecile RankingRanking
75% 80% 85% 90% 95% 100%
Average of Process Measures
1st
2nd
other
DecileRanking
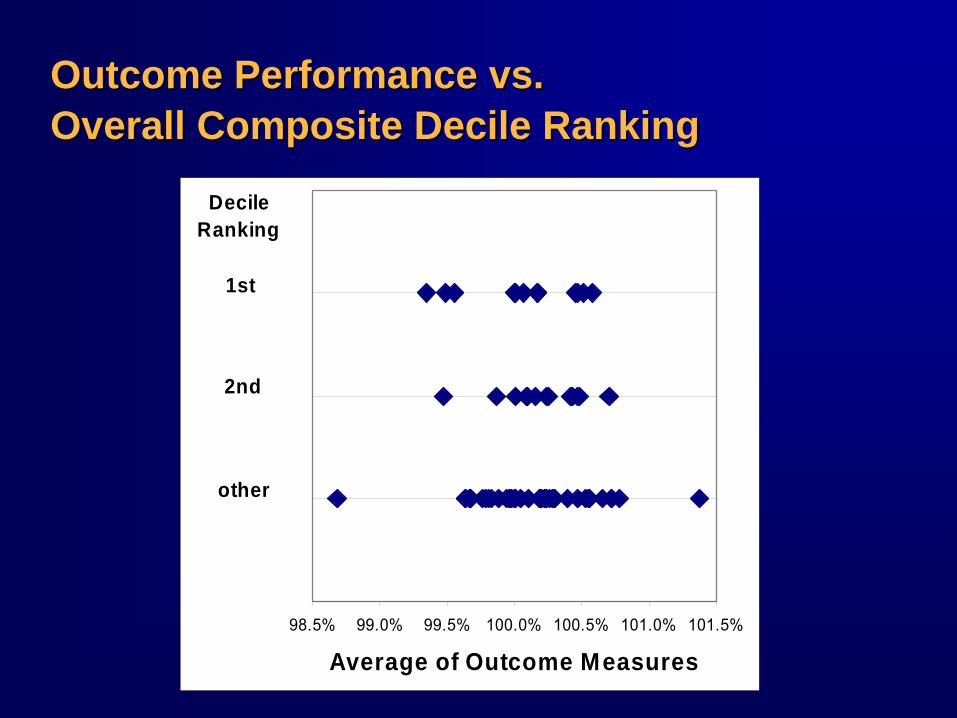
Outcome Performance vs.Outcome Performance vs. Overall Composite Overall Composite DecileDecile RankingRanking
98.5% 99.0% 99.5% 100.0% 100.5% 101.0% 101.5%
Average of Outcome Measures
1st
2nd
other
DecileRanking
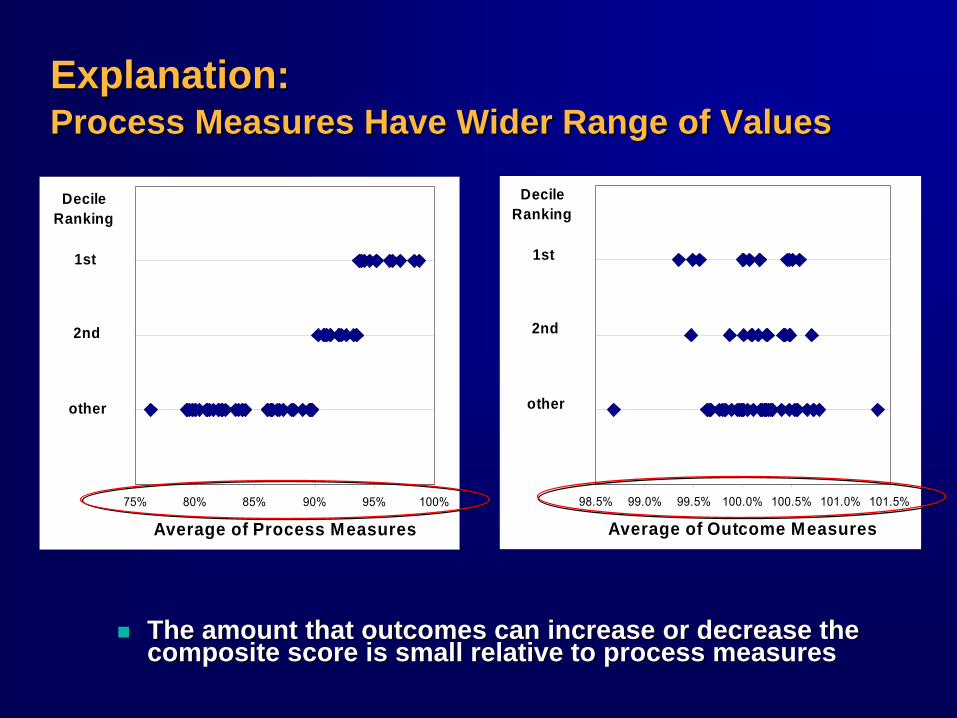
Explanation:Explanation: Process Measures Have Wider Range of ValuesProcess Measures Have Wider Range of Values
The amount that outcomes can increase or decrease the The amount that outcomes can increase or decrease the composite score is small relative to process measurescomposite score is small relative to process measures
75% 80% 85% 90% 95% 100%
Average of Process Measures
1st
2nd
other
DecileRanking
98.5% 99.0% 99.5% 100.0% 100.5% 101.0% 101.5%
Average of Outcome Measures
1st
2nd
other
DecileRanking
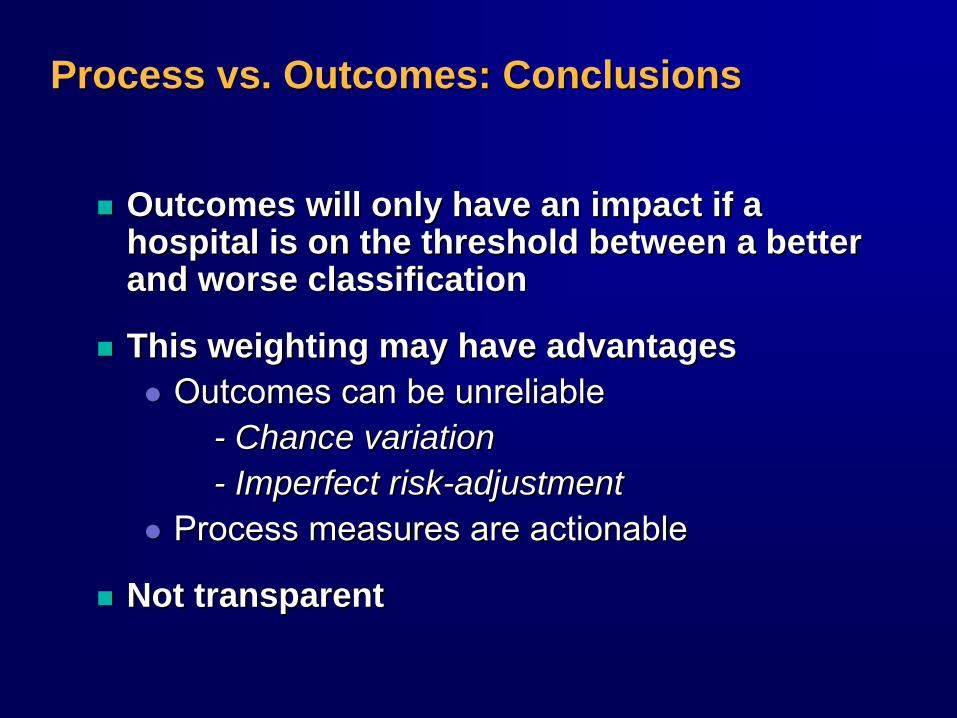
Process vs. Outcomes: ConclusionsProcess vs. Outcomes: Conclusions
Outcomes will only have an impact if a Outcomes will only have an impact if a hospital is on the threshold between a better hospital is on the threshold between a better and worse classificationand worse classification
This weighting may have advantagesThis weighting may have advantagesOutcomes can be unreliableOutcomes can be unreliable
-- Chance variationChance variation-- Imperfect riskImperfect risk--adjustmentadjustment
Process measures are actionableProcess measures are actionable
Not transparentNot transparent
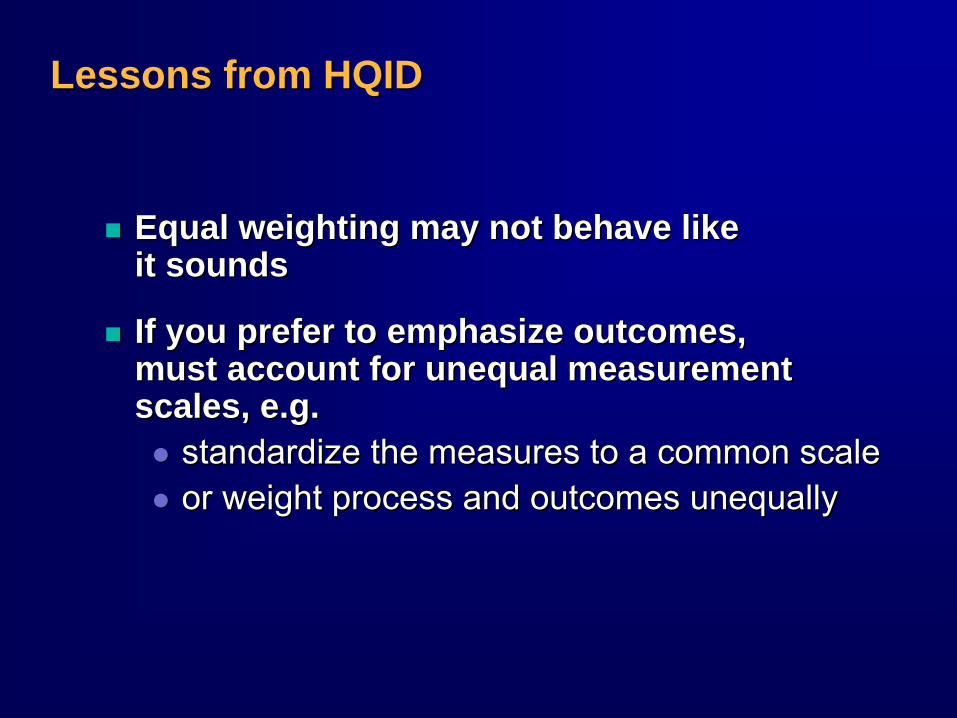
Lessons from HQIDLessons from HQID
Equal weighting may not behave like Equal weighting may not behave like it soundsit sounds
If you prefer to emphasize outcomes,If you prefer to emphasize outcomes,must account for unequal measurement must account for unequal measurement scales, e.g.scales, e.g.
standardize the measures to a common scalestandardize the measures to a common scaleor weight process and outcomes unequallyor weight process and outcomes unequally
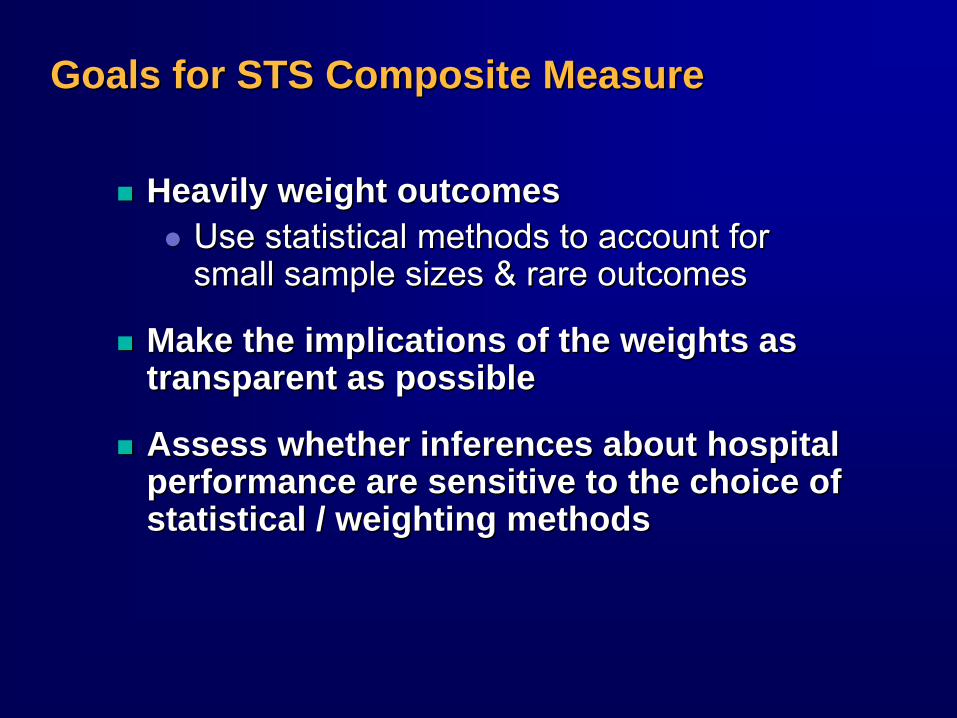
Goals for STS Composite MeasureGoals for STS Composite Measure
Heavily weight outcomesHeavily weight outcomesUse statistical methods to account for Use statistical methods to account for small sample sizes & rare outcomessmall sample sizes & rare outcomes
Make the implications of the weights as Make the implications of the weights as transparent as possibletransparent as possible
Assess whether inferences about hospital Assess whether inferences about hospital performance are sensitive to the choice of performance are sensitive to the choice of statistical / weighting methodsstatistical / weighting methods
OutlineOutline
Measure selectionMeasure selection
DataData
Latent variable approach to composite Latent variable approach to composite measuresmeasures
STS approach to composite measuresSTS approach to composite measures
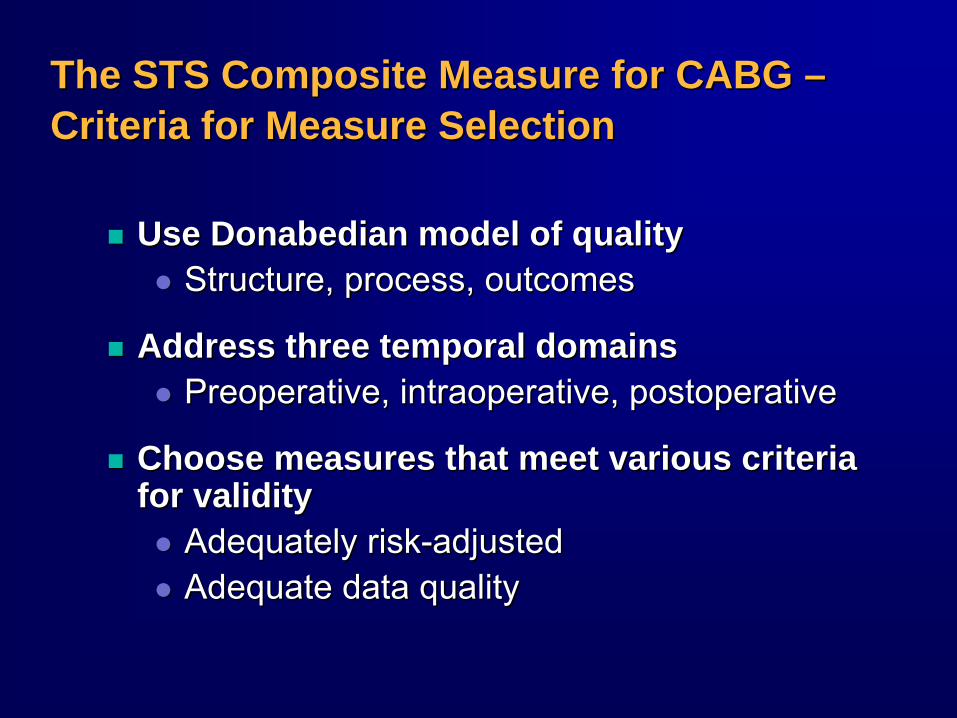
The STS Composite Measure for CABG The STS Composite Measure for CABG –– Criteria for Measure SelectionCriteria for Measure Selection
Use Use DonabedianDonabedian model of qualitymodel of qualityStructure, process, outcomesStructure, process, outcomes
Address three temporal domainsAddress three temporal domainsPreoperative, Preoperative, intraoperativeintraoperative, postoperative, postoperative
Choose measures that meet various criteria Choose measures that meet various criteria for validityfor validity
Adequately riskAdequately risk--adjustedadjustedAdequate data qualityAdequate data quality
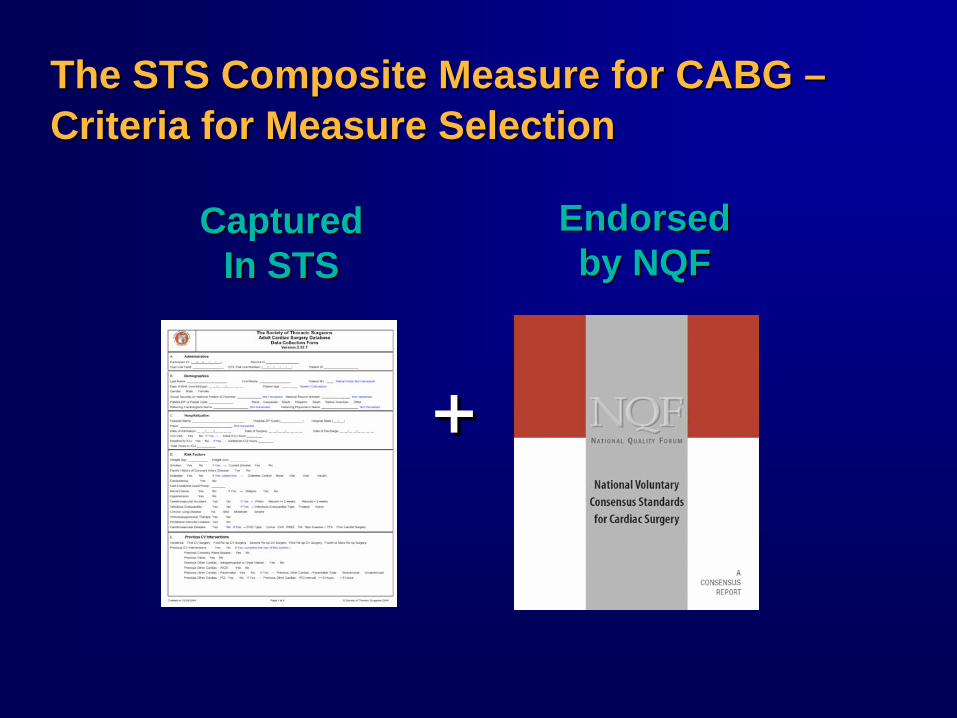
The STS Composite Measure for CABG The STS Composite Measure for CABG –– Criteria for Measure SelectionCriteria for Measure Selection
++
Endorsed by NQF
Endorsed by NQF
Captured In STS
Captured In STS
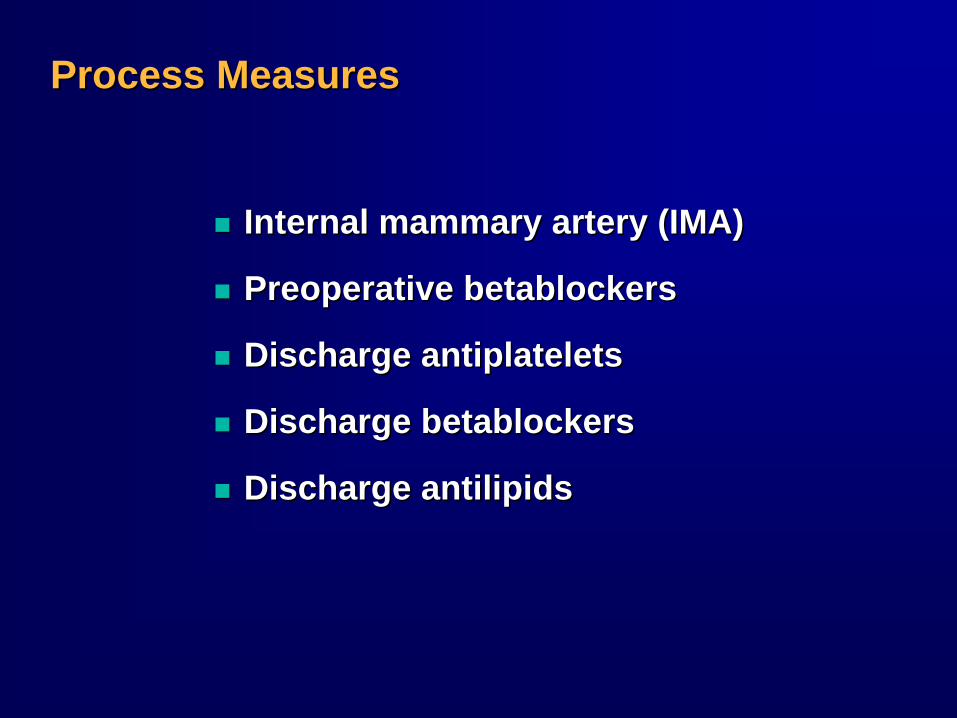
Process MeasuresProcess Measures
Internal mammary artery (IMA) Internal mammary artery (IMA)
Preoperative Preoperative betablockersbetablockers
Discharge Discharge antiplateletsantiplatelets
Discharge Discharge betablockersbetablockers
Discharge Discharge antilipidsantilipids
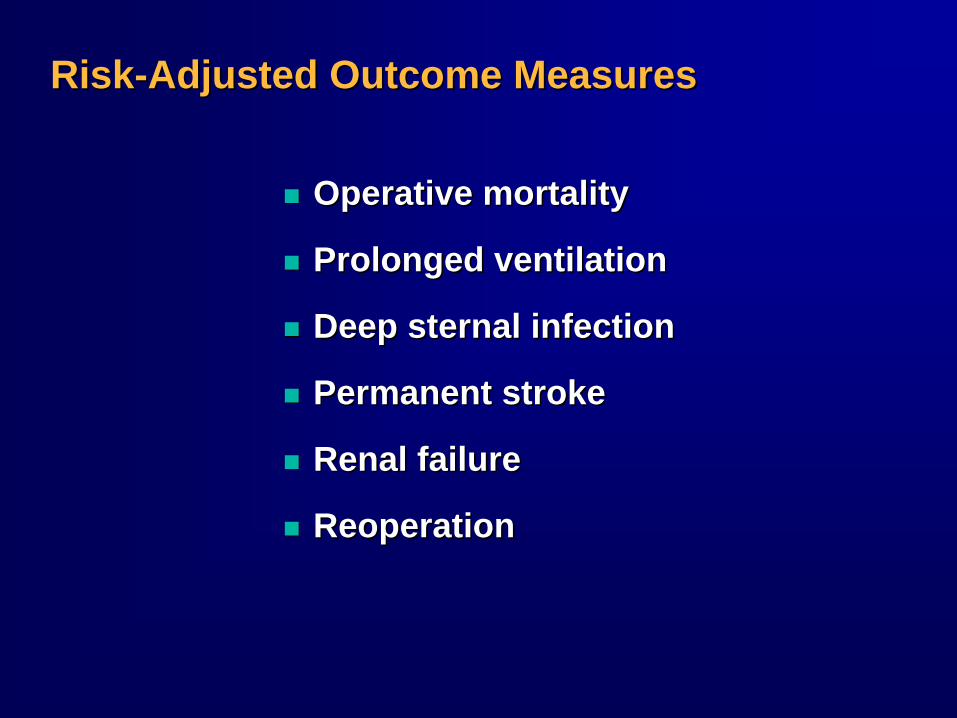
RiskRisk--Adjusted Outcome MeasuresAdjusted Outcome Measures
Operative mortalityOperative mortality
Prolonged ventilationProlonged ventilation
Deep Deep sternalsternal infectioninfection
Permanent strokePermanent stroke
Renal failureRenal failure
ReoperationReoperation
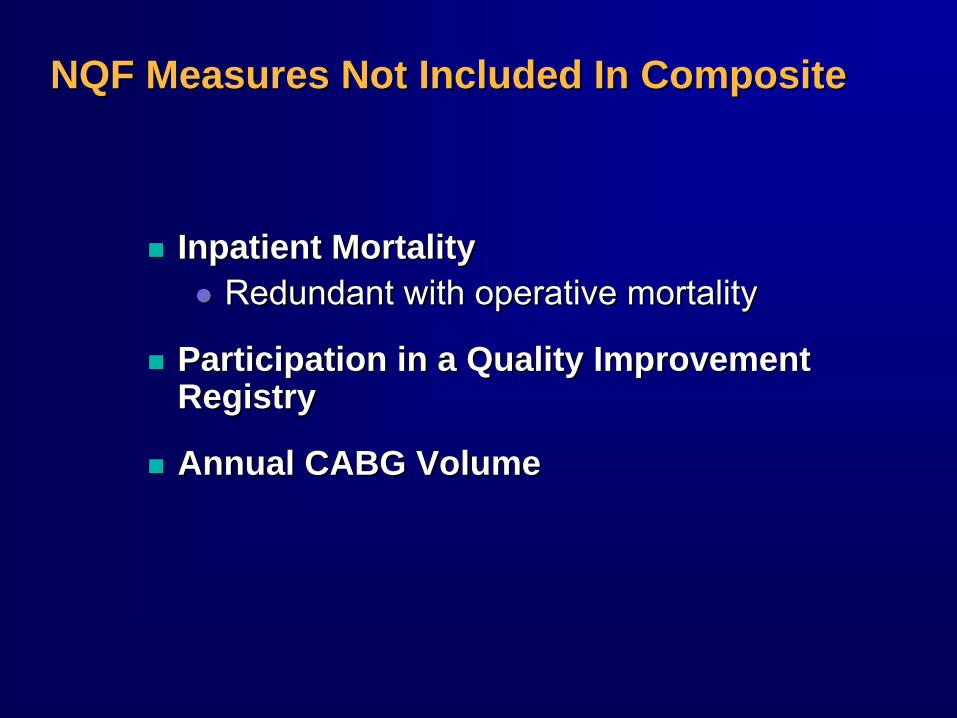
NQF Measures Not Included In CompositeNQF Measures Not Included In Composite
Inpatient MortalityInpatient MortalityRedundant with operative mortalityRedundant with operative mortality
Participation in a Quality Improvement Participation in a Quality Improvement RegistryRegistry
Annual CABG VolumeAnnual CABG Volume
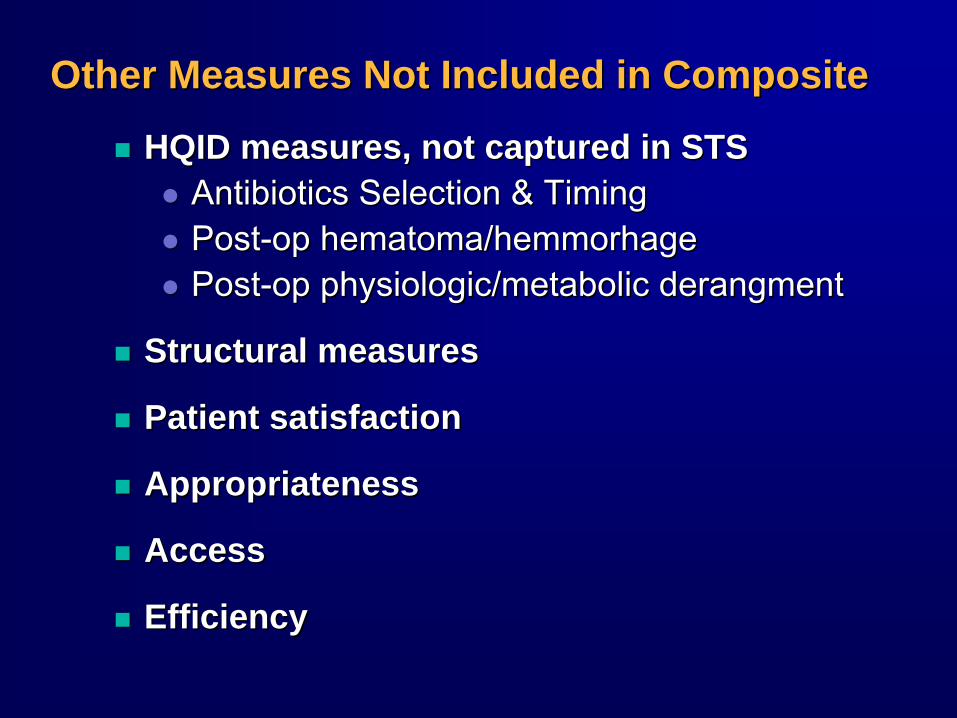
Other Measures Not Included in CompositeOther Measures Not Included in Composite
HQID measures, not captured in STSHQID measures, not captured in STSAntibiotics Selection & TimingAntibiotics Selection & TimingPostPost--op op hematoma/hemmorhagehematoma/hemmorhagePostPost--op physiologic/metabolic op physiologic/metabolic derangmentderangment
Structural measuresStructural measures
Patient satisfactionPatient satisfaction
Appropriateness Appropriateness
AccessAccess
EfficiencyEfficiency
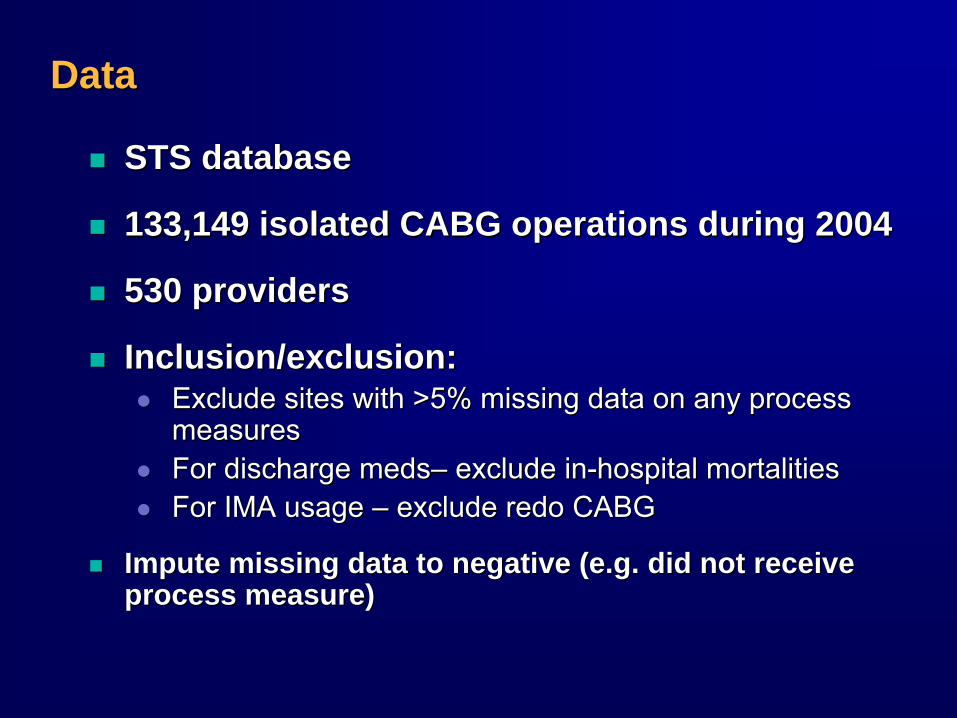
DataData
STS databaseSTS database
133,149 isolated CABG operations during 2004133,149 isolated CABG operations during 2004
530 providers530 providers
Inclusion/exclusion:Inclusion/exclusion:Exclude sites with >5% missing data on any process Exclude sites with >5% missing data on any process measuresmeasuresFor discharge medsFor discharge meds–– exclude inexclude in--hospital mortalitieshospital mortalitiesFor IMA usage For IMA usage –– exclude redo CABGexclude redo CABG
Impute missing data to negative (e.g. did not receive Impute missing data to negative (e.g. did not receive process measure)process measure)
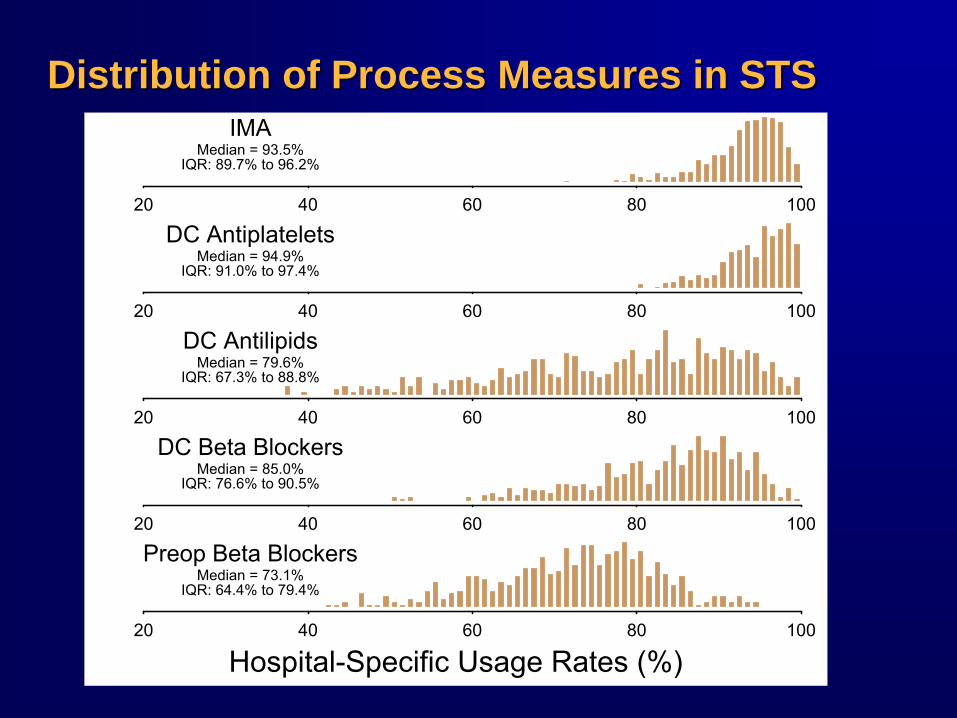
Distribution of Process Measures in STS Distribution of Process Measures in STS
20 40 60 80 100
IMAMedian = 93.5%
IQR: 89.7% to 96.2%
20 40 60 80 100
DC AntiplateletsMedian = 94.9%
IQR: 91.0% to 97.4%
20 40 60 80 100
DC AntilipidsMedian = 79.6%
IQR: 67.3% to 88.8%
20 40 60 80 100
DC Beta BlockersMedian = 85.0%
IQR: 76.6% to 90.5%
20 40 60 80 100
Preop Beta BlockersMedian = 73.1%
IQR: 64.4% to 79.4%
Hospital-Specific Usage Rates (%)

Distribution of Outcomes Measures in STSDistribution of Outcomes Measures in STS
0 10 30
Prolonged VentilationMedian = 7.7%
IQR: 4.9% to 11.2%
0 1 2 3
Sternal InfectionMedian = 0.2%
IQR: 0.0% to 0.7%
0 1 2 3 4
StrokeMedian = 1.1%
IQR: 0.6% to 1.7%
0 4 8 12
Renal FailureMedian = 2.8%
IQR: 1.7% to 4.6%
0 10 20
ReoperationMedian = 4.8%
IQR: 3.3% to 6.8%
0 4 8
MortalityMedian = 2.2%
IQR: 1.3% to 3.3%
Hospital-Specific Unadjusted Event Rates (%)
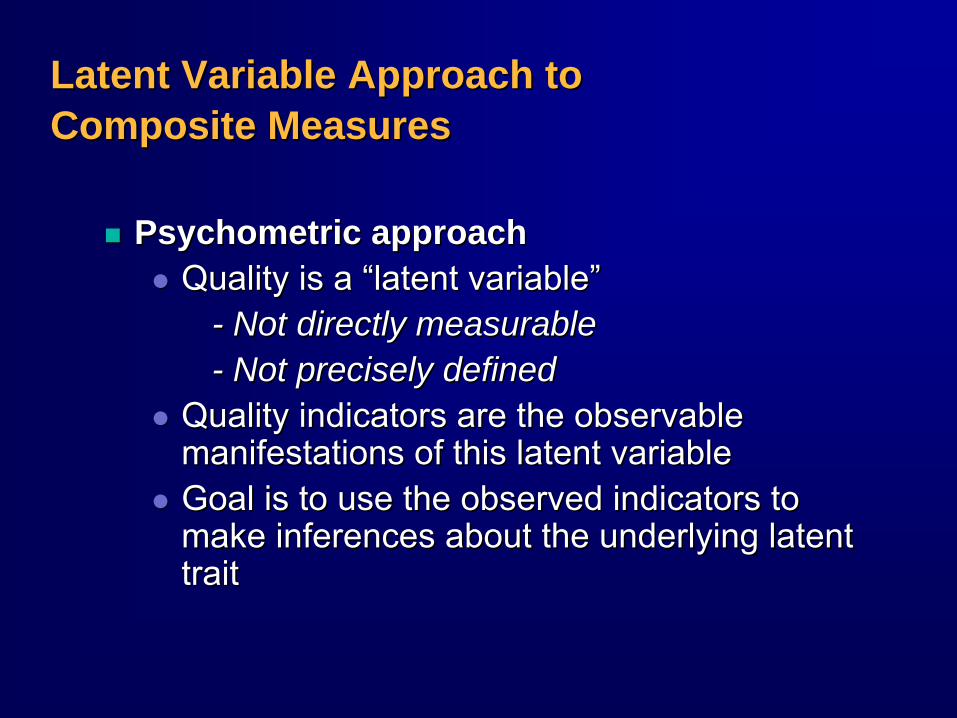
Latent Variable Approach to Latent Variable Approach to Composite MeasuresComposite Measures
Psychometric approachPsychometric approachQuality is a Quality is a ““latent variablelatent variable””
-- Not directly measurableNot directly measurable-- Not precisely definedNot precisely defined
Quality indicators are the observable Quality indicators are the observable manifestations of this latent variablemanifestations of this latent variableGoal is to use the observed indicators to Goal is to use the observed indicators to make inferences about the underlying latent make inferences about the underlying latent traittrait

(“Quality”)
X1 X1
X2 X2
X3 X3X4 X4
X5 X5
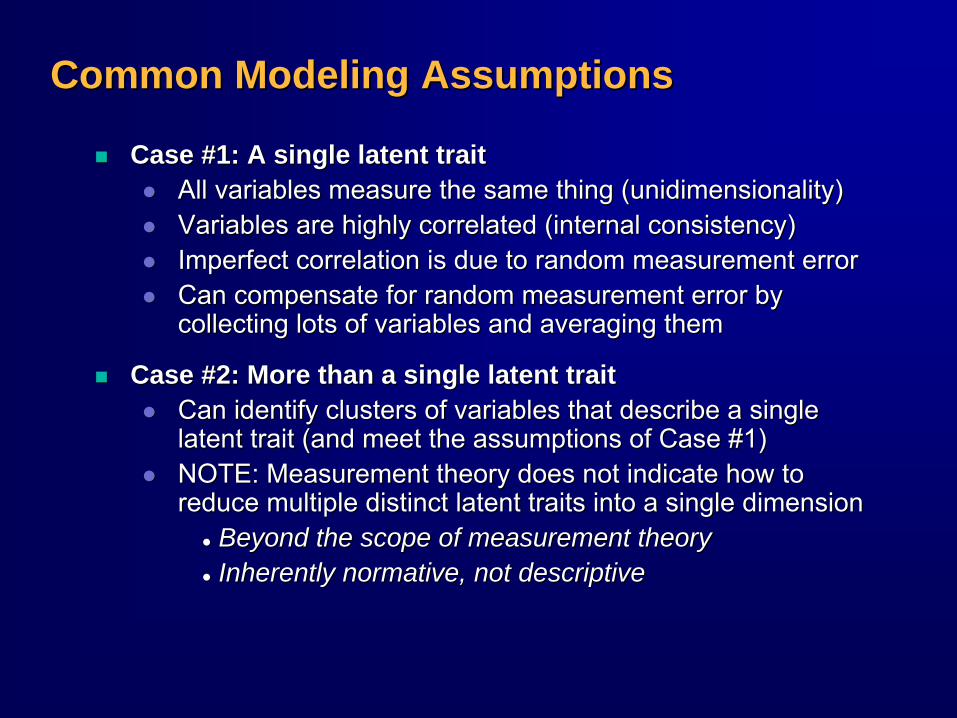
Common Modeling AssumptionsCommon Modeling Assumptions
Case #1: A single latent traitCase #1: A single latent traitAll variables measure the same thing (All variables measure the same thing (unidimensionalityunidimensionality))Variables are highly correlated (internal consistency)Variables are highly correlated (internal consistency)Imperfect correlation is due to random measurement errorImperfect correlation is due to random measurement errorCan compensate for random measurement error by Can compensate for random measurement error by collecting lots of variables and averaging themcollecting lots of variables and averaging them
Case #2: More than a single latent traitCase #2: More than a single latent traitCan identify clusters of variables that describe a single Can identify clusters of variables that describe a single latent trait (and meet the assumptions of Case #1)latent trait (and meet the assumptions of Case #1)NOTE: Measurement theory does not indicate how to NOTE: Measurement theory does not indicate how to reduce multiple distinct latent traits into a single dimensionreduce multiple distinct latent traits into a single dimension
Beyond the scope of measurement theoryBeyond the scope of measurement theoryInherently normative, not descriptiveInherently normative, not descriptive
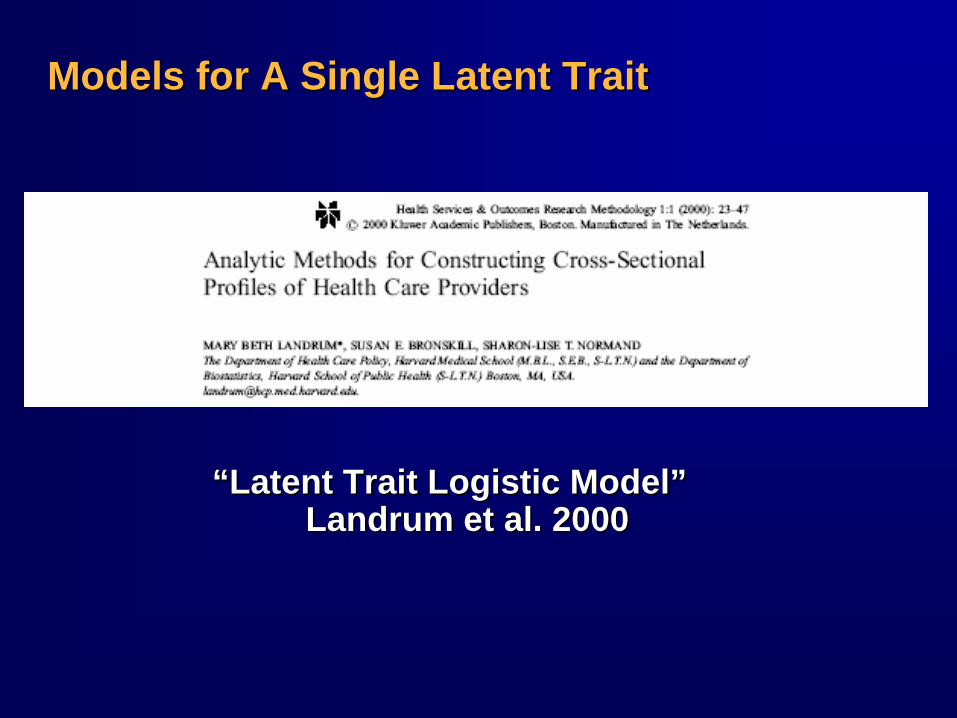
Models for A Single Latent TraitModels for A Single Latent Trait
““Latent Trait Logistic ModelLatent Trait Logistic Model”” Landrum et al. 2000Landrum et al. 2000
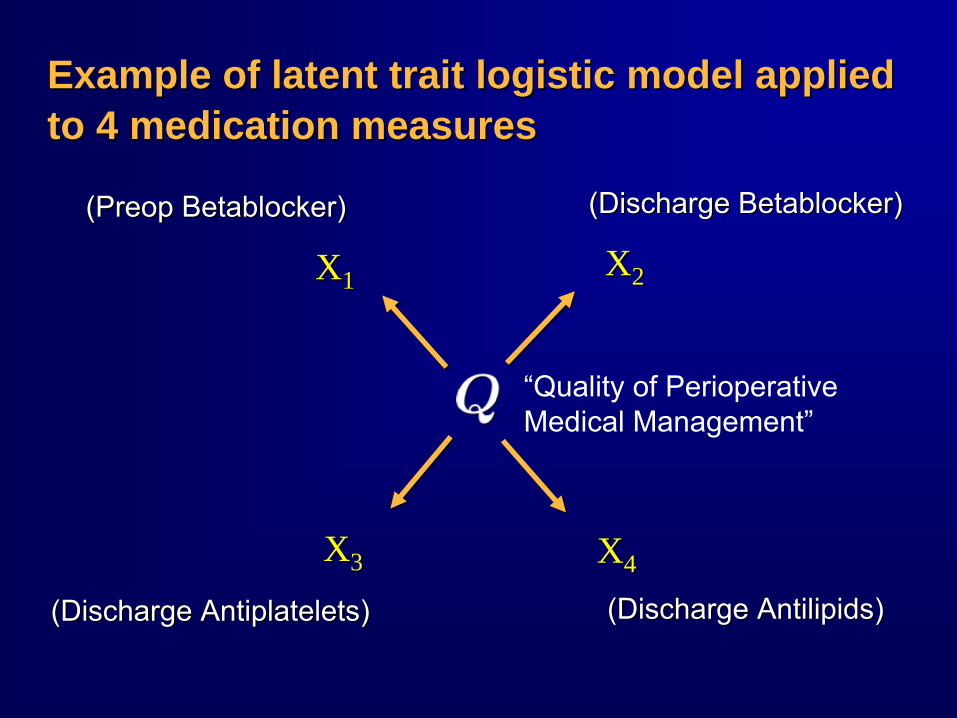
Example of latent trait logistic model applied Example of latent trait logistic model applied to 4 medication measuresto 4 medication measures
(Discharge (Discharge BetablockerBetablocker))((PreopPreop
BetablockerBetablocker))
(Discharge (Discharge AntiplateletsAntiplatelets)) (Discharge (Discharge AntilipidsAntilipids))
“Quality of Perioperative Medical Management”
X1 X1 X2 X2
X4 X4X3 X3
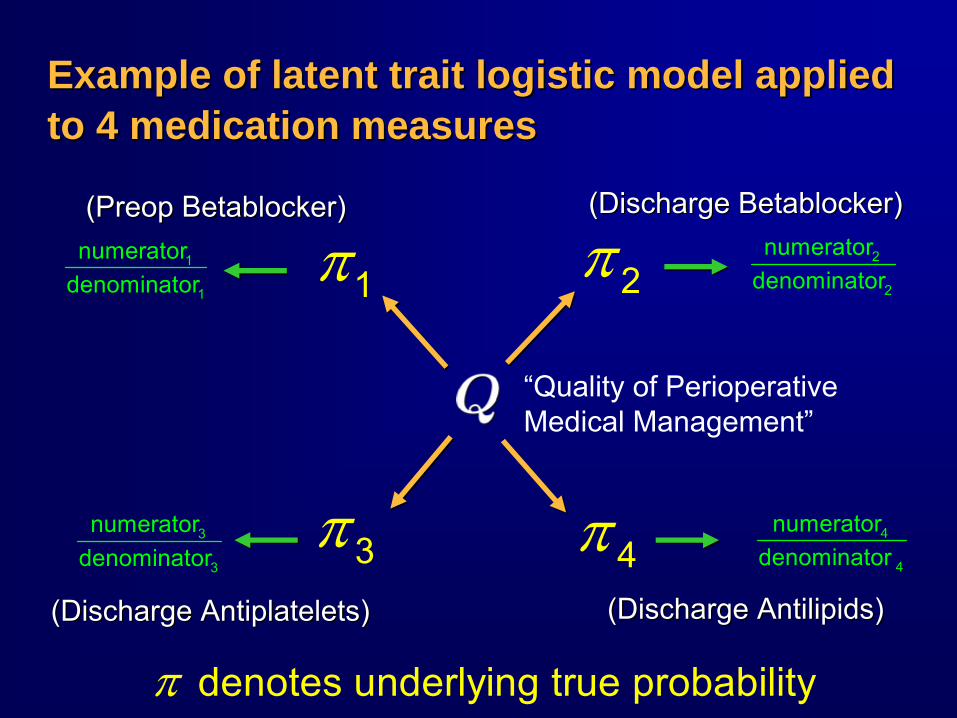
Example of latent trait logistic model applied Example of latent trait logistic model applied to 4 medication measuresto 4 medication measures
π2
π 4π3
π1
denotes underlying true probabilityπ
3
3
numeratordenominator
1
1
numeratordenominator
2
2
numeratordenominator
4
4
numeratordenominator
(Discharge (Discharge BetablockerBetablocker))((PreopPreop
BetablockerBetablocker))
(Discharge (Discharge AntiplateletsAntiplatelets)) (Discharge (Discharge AntilipidsAntilipids))
“Quality of Perioperative Medical Management”
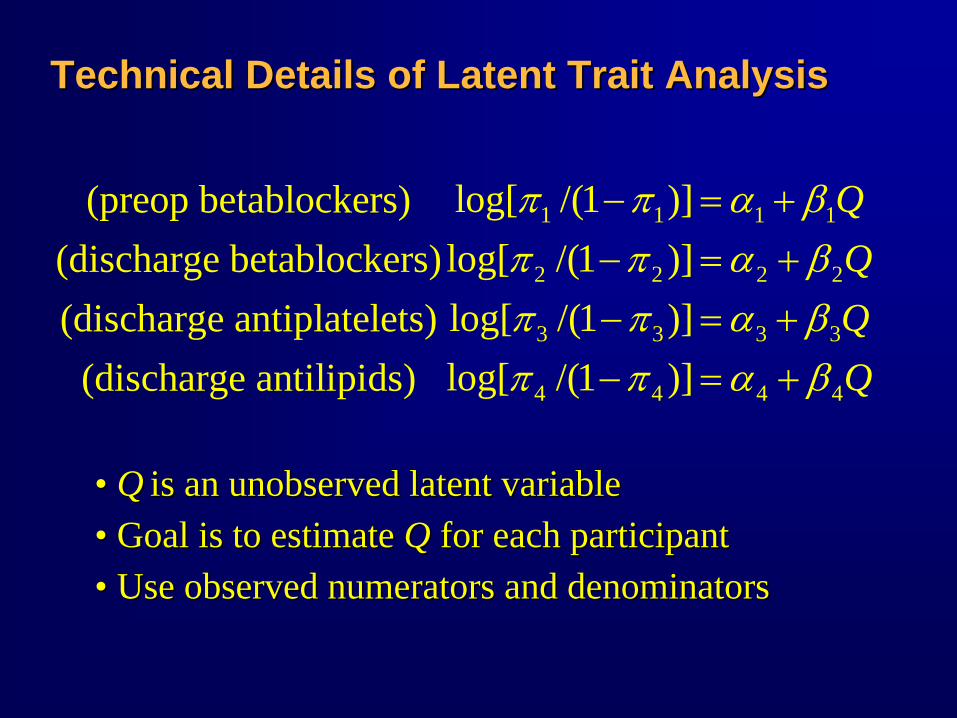
Technical Details of Latent Trait AnalysisTechnical Details of Latent Trait Analysis
• Q is an unobserved latent variable• Goal is to estimate Q for each participant• Use observed numerators and denominators
• Q is an unobserved latent variable• Goal is to estimate Q for each participant• Use observed numerators and denominators
1 1 1 1
2 2 2 2
3 3 3 3
4 4 4 4
log[ /(1 )](preop betablockers)log[ /(1 )](discharge betablockers)log[ /(1 )](discharge antiplatelets)log[ /(1 )](discharge antilipids)
QQQQ
π π α βπ π α βπ π α βπ π α β
− = +− = +− = +− = +
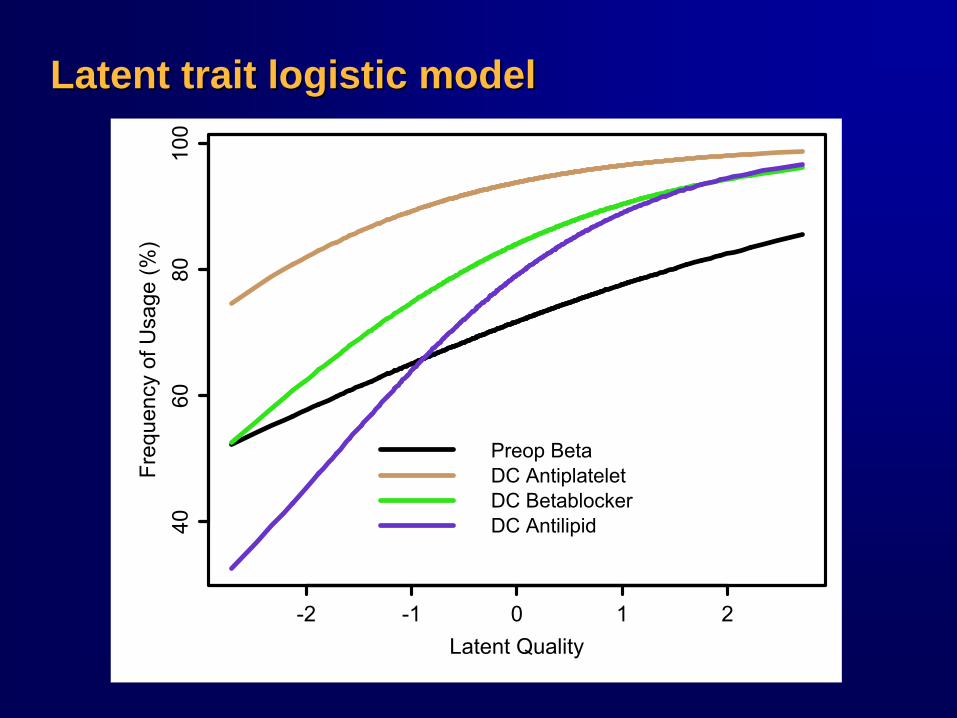
Latent trait logistic modelLatent trait logistic model
Latent Quality
Freq
uenc
y of
Usa
ge (%
)
-2 -1 0 1 2
4060
8010
0
Preop BetaDC AntiplateletDC BetablockerDC Antilipid
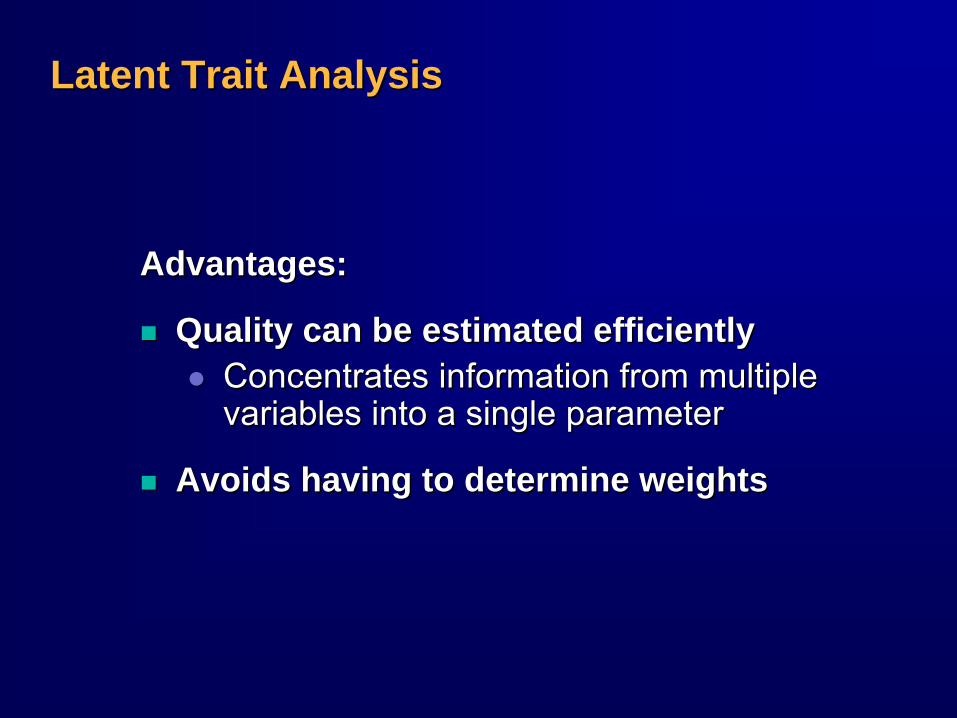
Latent Trait AnalysisLatent Trait Analysis
Advantages:Advantages:
Quality can be estimated efficientlyQuality can be estimated efficientlyConcentrates information from multiple Concentrates information from multiple variables into a single parametervariables into a single parameter
Avoids having to determine weightsAvoids having to determine weights
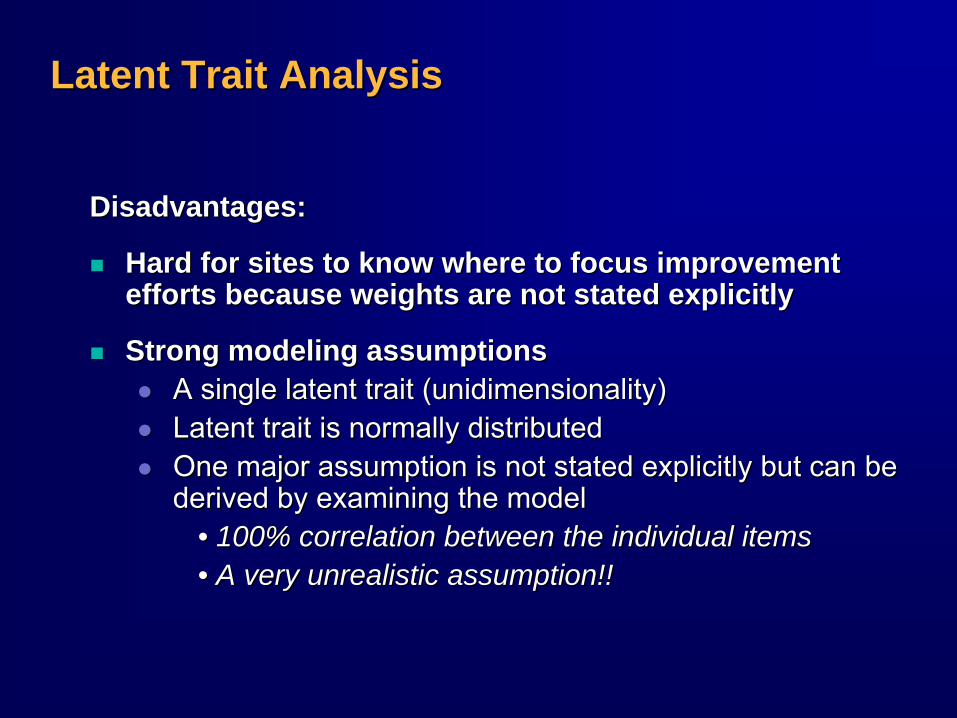
Latent Trait AnalysisLatent Trait Analysis
Disadvantages:Disadvantages:
Hard for sites to know where to focus improvement Hard for sites to know where to focus improvement efforts because weights are not stated explicitlyefforts because weights are not stated explicitly
Strong modeling assumptionsStrong modeling assumptionsA single latent trait (A single latent trait (unidimensionalityunidimensionality))Latent trait is normally distributedLatent trait is normally distributedOne major assumption is not stated explicitly but can be One major assumption is not stated explicitly but can be derived by examining the modelderived by examining the model
•• 100% correlation between the individual items100% correlation between the individual items•• A very unrealistic assumption!!A very unrealistic assumption!!
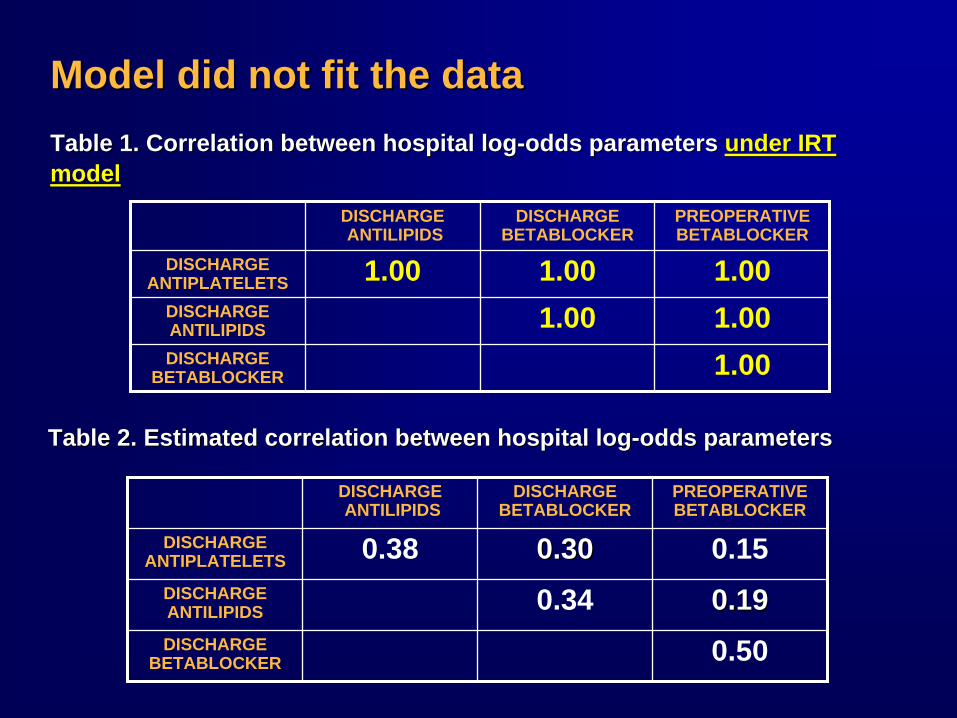
Table 1. Correlation between hospital logTable 1. Correlation between hospital log--odds parameters odds parameters under IRT under IRT modelmodel
DISCHARGE ANTILIPIDS
DISCHARGE BETABLOCKER
PREOPERATIVE BETABLOCKER
DISCHARGE ANTIPLATELETS 0.38 0.300.30 0.15
DISCHARGE ANTILIPIDS 0.34 0.190.19DISCHARGE
BETABLOCKER 0.50
DISCHARGE ANTILIPIDS
DISCHARGE BETABLOCKER
PREOPERATIVE BETABLOCKER
DISCHARGE ANTIPLATELETS 1.00 1.00 1.00
DISCHARGE ANTILIPIDS 1.00 1.00DISCHARGE
BETABLOCKER 1.00
Table 2. Estimated correlation between hospital logTable 2. Estimated correlation between hospital log--odds parametersodds parameters
Model did not fit the dataModel did not fit the data
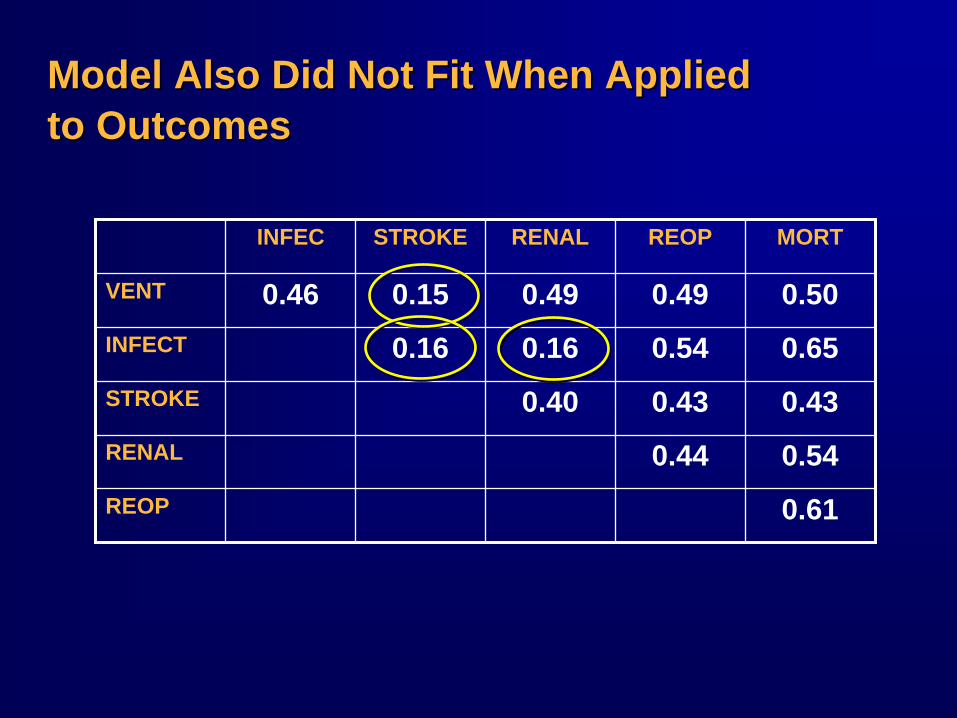
Model Also Did Not Fit When Applied Model Also Did Not Fit When Applied to Outcomesto Outcomes
INFEC STROKE RENAL REOP MORT
VENT 0.46 0.15 0.49 0.49 0.50INFECT 0.16 0.16 0.54 0.65STROKE 0.40 0.43 0.43RENAL 0.44 0.54REOP 0.61
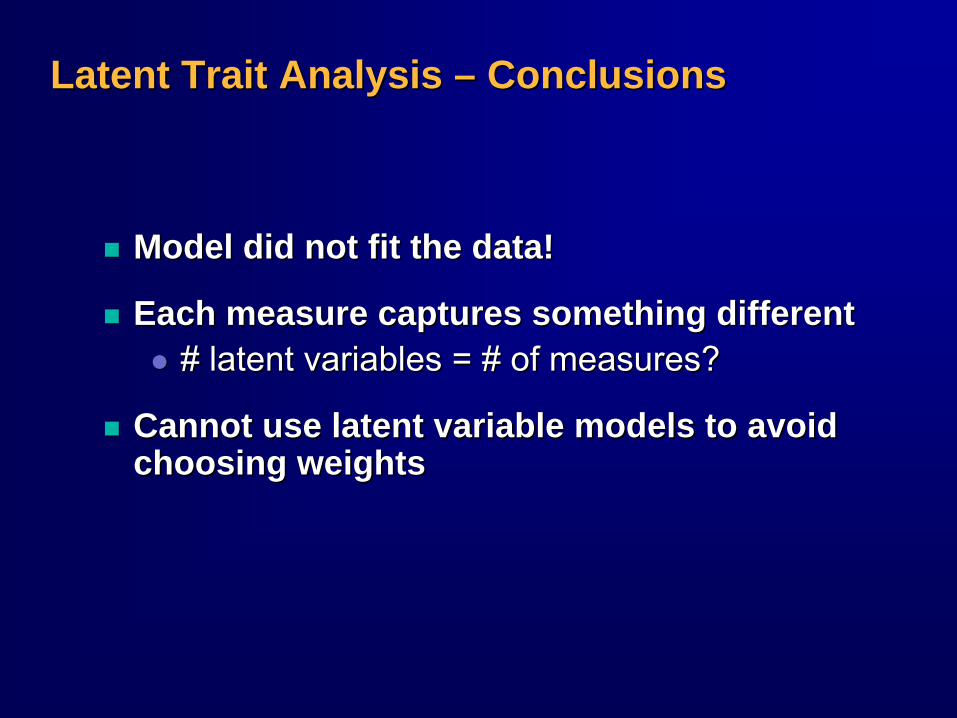
Latent Trait Analysis Latent Trait Analysis –– ConclusionsConclusions
Model did not fit the data!Model did not fit the data!
Each measure captures something differentEach measure captures something different# latent variables = # of measures?# latent variables = # of measures?
Cannot use latent variable models to avoid Cannot use latent variable models to avoid choosing weightschoosing weights

The STS Composite MethodThe STS Composite Method
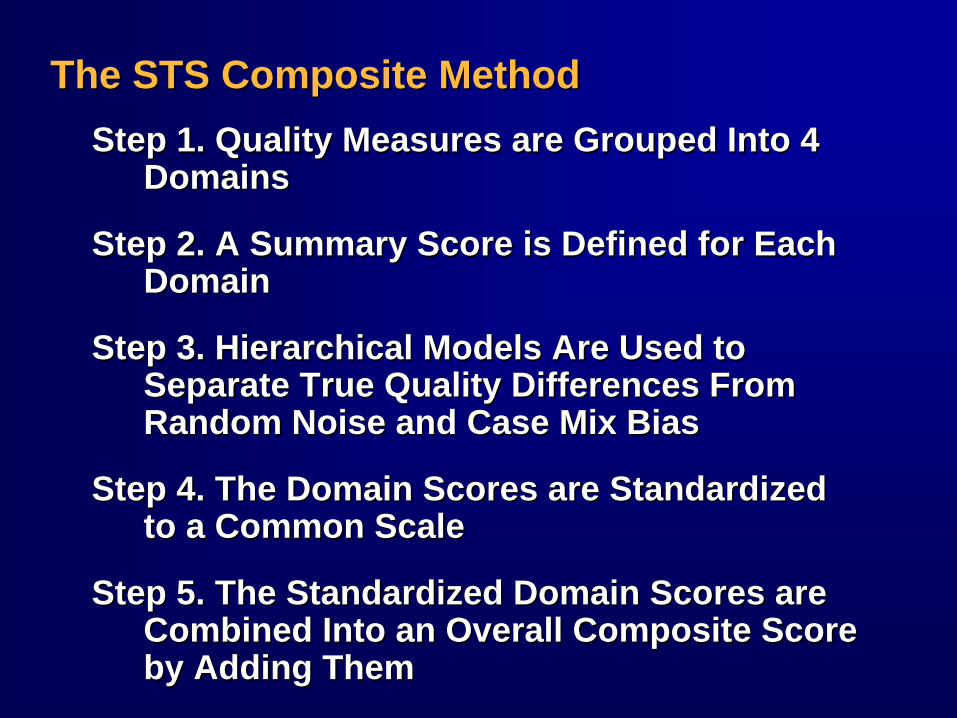
The STS Composite MethodThe STS Composite MethodStep 1. Quality Measures are Grouped Into 4 Step 1. Quality Measures are Grouped Into 4
DomainsDomains
Step 2. A Summary Score is Defined for Each Step 2. A Summary Score is Defined for Each DomainDomain
Step 3. Hierarchical Models Are Used to Step 3. Hierarchical Models Are Used to Separate True Quality Differences From Separate True Quality Differences From Random Noise and Case Mix BiasRandom Noise and Case Mix Bias
Step 4. The Domain Scores are Standardized Step 4. The Domain Scores are Standardized to a Common Scaleto a Common Scale
Step 5. The Standardized Domain Scores are Step 5. The Standardized Domain Scores are Combined Into an Overall Composite Score Combined Into an Overall Composite Score by Adding Themby Adding Them
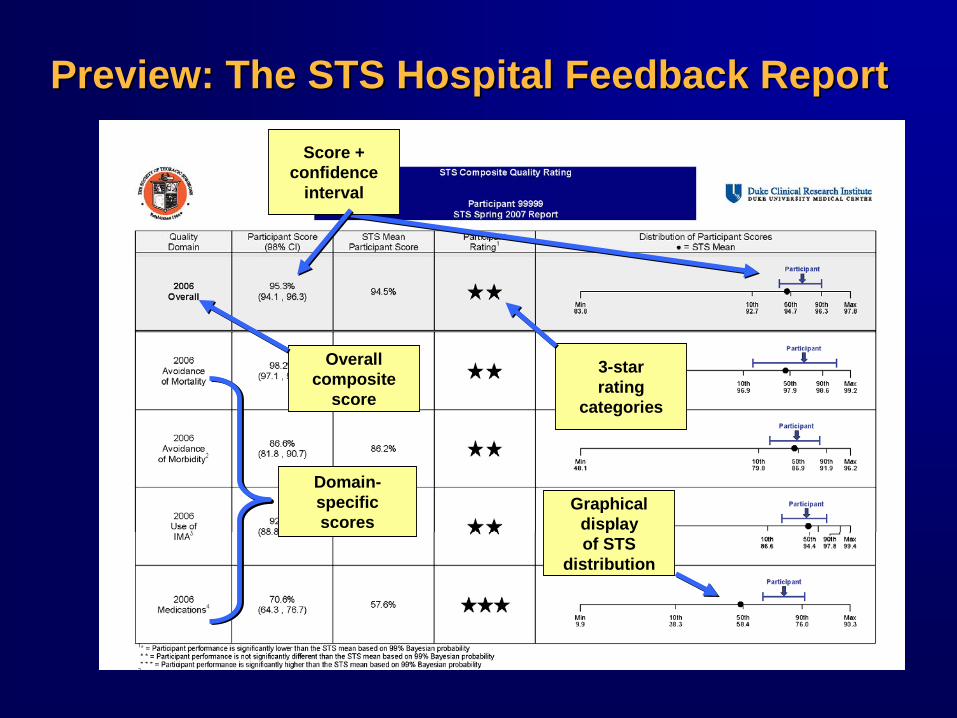
Domain-specific scores
Overall composite
score
3-starrating
categories
Graphical display of STS
distribution
Score + confidence
interval
Preview: The STS Hospital Feedback ReportPreview: The STS Hospital Feedback Report
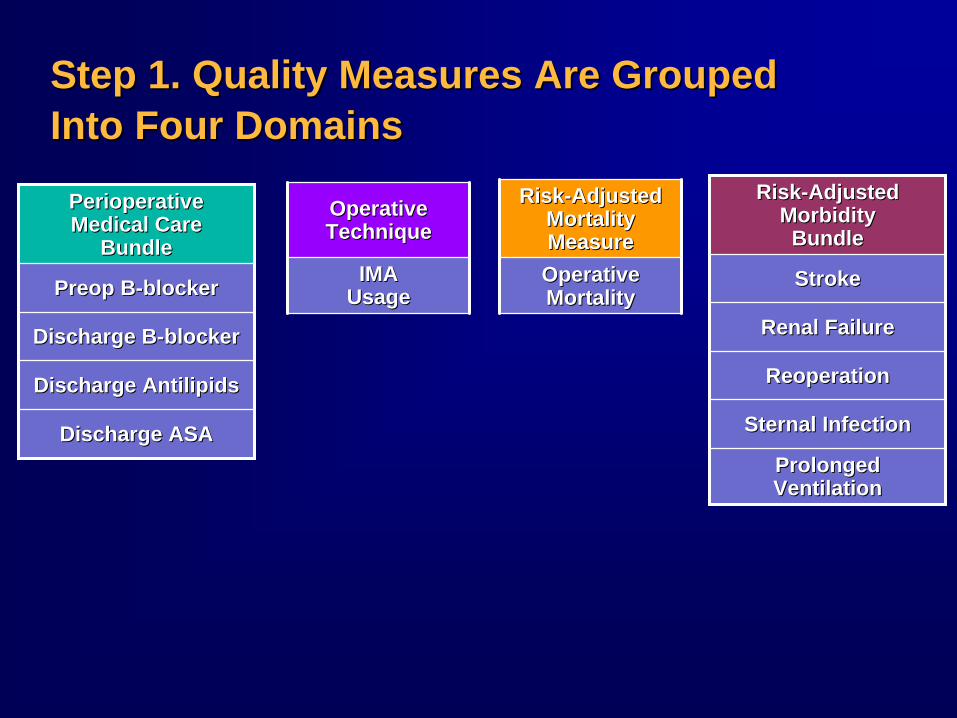
Step 1. Quality Measures Are Grouped Step 1. Quality Measures Are Grouped Into Four DomainsInto Four Domains
PerioperativePerioperative Medical Care Medical Care
BundleBundle
PreopPreop BB--blockerblocker
Discharge BDischarge B--blockerblocker
Discharge Discharge AntilipidsAntilipids
Discharge ASADischarge ASA
RiskRisk--AdjustedAdjusted Morbidity Morbidity
BundleBundle
StrokeStroke
Renal FailureRenal Failure
ReoperationReoperation
SternalSternal InfectionInfection
Prolonged Prolonged VentilationVentilation
Operative Operative TechniqueTechnique
IMAIMA UsageUsage
RiskRisk--Adjusted Adjusted MortalityMortality MeasureMeasure
Operative Operative MortalityMortality

Of Course Other Ways of Grouping Items Are Of Course Other Ways of Grouping Items Are PossiblePossible……
a)a) Those that belong to the EmperorThose that belong to the Emperorb)b) Embalmed onesEmbalmed onesc)c) Tame onesTame onesd)d) Suckling pigsSuckling pigse)e) SirensSirensf)f) Fabulous onesFabulous onesg)g) Stray dogsStray dogsh)h) Those included in the present classificationThose included in the present classificationi)i) Frenzied onesFrenzied onesj)j) Innumerable onesInnumerable onesk)k) Those drawn with a very fine camelhair brushThose drawn with a very fine camelhair brushl)l) OthersOthersm)m) Those that have just broken a water pitcherThose that have just broken a water pitchern)n) Those that from a long way off look like fliesThose that from a long way off look like flies
*According to Michel Foucault, The Order of Things, 1966*According to Michel Foucault, The Order of Things, 1966
Taxonomy of Animals in a Certain Chinese Encyclopedia*Taxonomy of Animals in a Certain Chinese Encyclopedia*
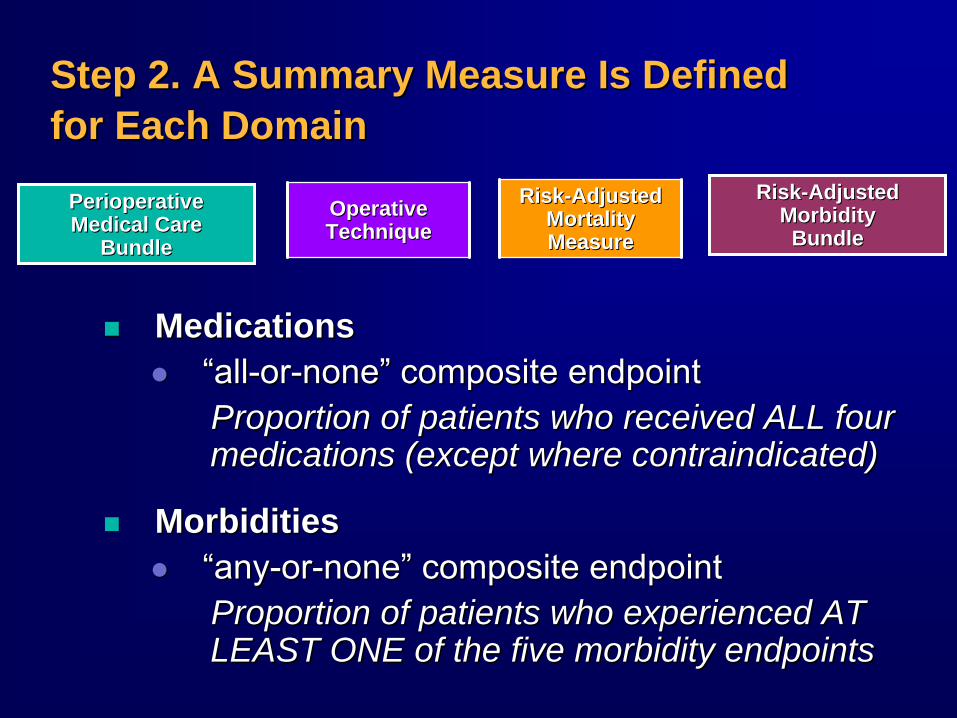
Step 2. A Summary Measure Is Defined Step 2. A Summary Measure Is Defined for Each Domainfor Each Domain
PerioperativePerioperative Medical Care Medical Care
BundleBundle
RiskRisk--AdjustedAdjusted Morbidity Morbidity
BundleBundleOperative Operative TechniqueTechnique
RiskRisk--Adjusted Adjusted MortalityMortality MeasureMeasure
MedicationsMedications““allall--oror--nonenone”” composite endpointcomposite endpointProportion of patients who received ALL four Proportion of patients who received ALL four medications (except where contraindicated)medications (except where contraindicated)
MorbiditiesMorbidities““anyany--oror--nonenone”” composite endpointcomposite endpointProportion of patients who experienced AT Proportion of patients who experienced AT LEAST ONE of the five morbidity endpointsLEAST ONE of the five morbidity endpoints
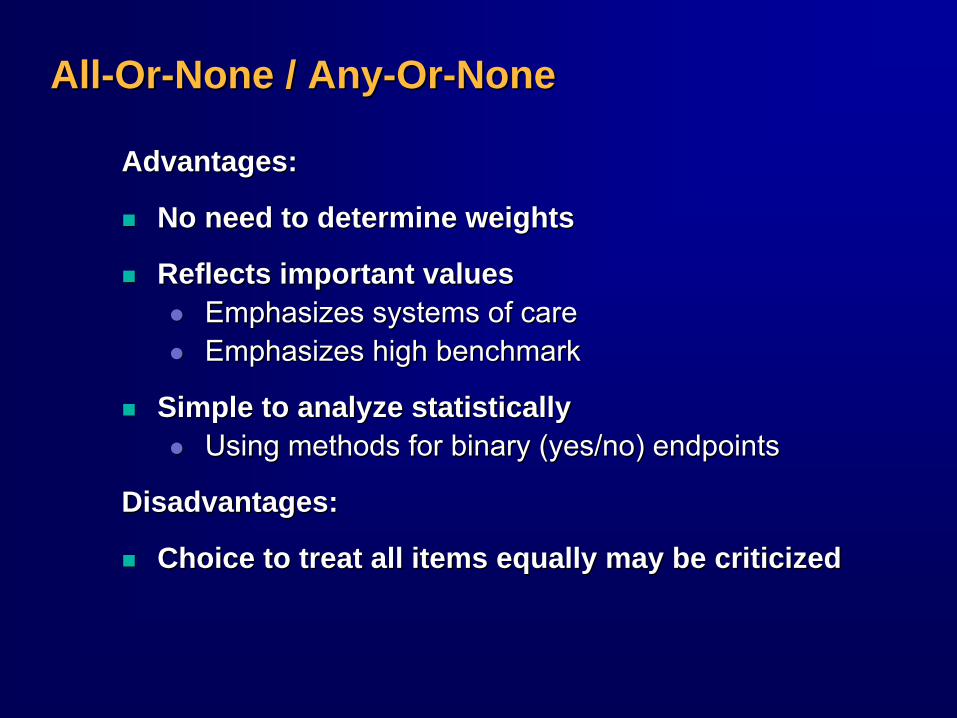
AllAll--OrOr--None / AnyNone / Any--OrOr--NoneNone
Advantages:Advantages:
No need to determine weightsNo need to determine weights
Reflects important valuesReflects important valuesEmphasizes systems of careEmphasizes systems of careEmphasizes high benchmarkEmphasizes high benchmark
Simple to analyze statisticallySimple to analyze statisticallyUsing methods for binary (yes/no) endpointsUsing methods for binary (yes/no) endpoints
Disadvantages:Disadvantages:
Choice to treat all items equally may be criticizedChoice to treat all items equally may be criticized
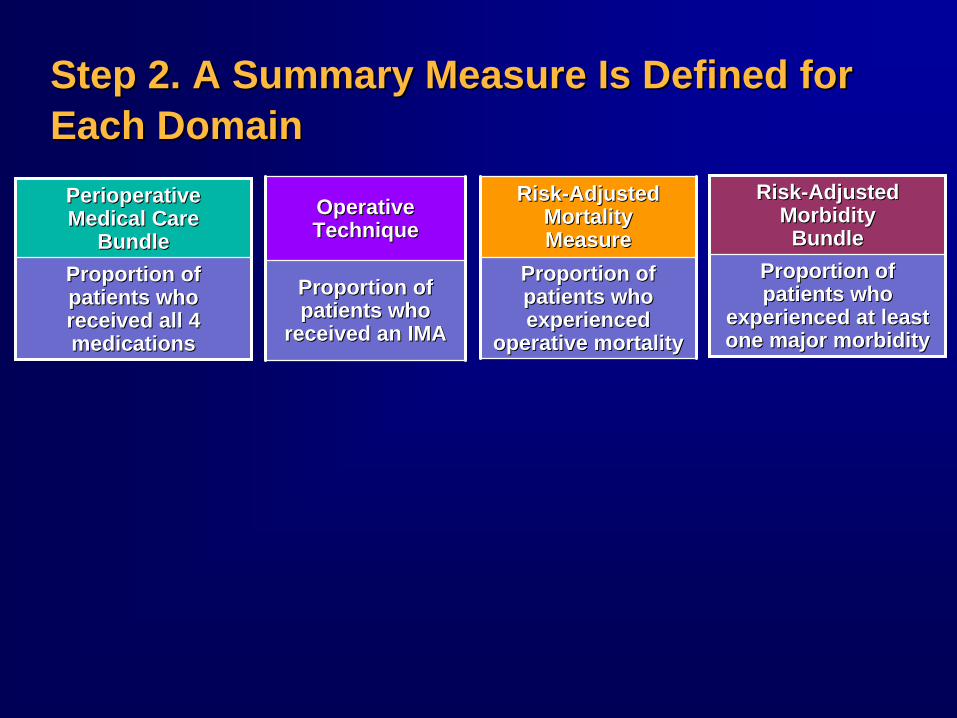
Step 2. A Summary Measure Is Defined for Step 2. A Summary Measure Is Defined for Each DomainEach Domain
PerioperativePerioperative Medical Care Medical Care
BundleBundleProportion of Proportion of patients who patients who received all 4 received all 4 medicationsmedications
RiskRisk--AdjustedAdjusted Morbidity Morbidity
BundleBundleProportion of Proportion of patients who patients who
experienced at least experienced at least one major morbidityone major morbidity
Operative Operative TechniqueTechnique
Proportion of Proportion of patients who patients who
received an IMAreceived an IMA
RiskRisk--Adjusted Adjusted MortalityMortality MeasureMeasure
Proportion of Proportion of patients who patients who experienced experienced
operative mortalityoperative mortality
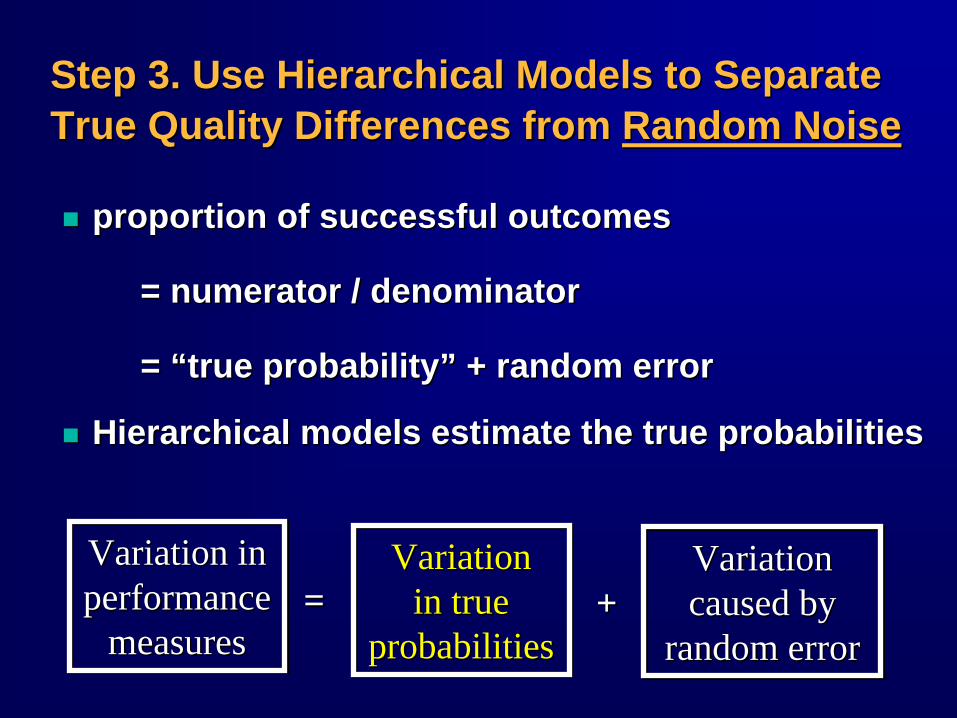
Step 3. Use Hierarchical Models to Separate Step 3. Use Hierarchical Models to Separate True Quality Differences from True Quality Differences from Random NoiseRandom Noise
proportion of successful outcomesproportion of successful outcomes
= numerator / denominator= numerator / denominator
= = ““true probabilitytrue probability”” + random error+ random error
Hierarchical models estimate the true probabilitiesHierarchical models estimate the true probabilities
Variation in performance
measures
Variation in performance
measures===
Variation in true
probabilities
Variation in true
probabilities
Variation caused by
random error
Variation caused by
random error+++

Example of Hierarchical ModelsExample of Hierarchical Models
0.0 0.01 0.02 0.03 0.04Hierarchical Estimates
Observed Estimates0.0 0.01 0.02 0.03 0.04
Figure. Mortality Rates in a Sample of STS HospitalsFigure. Mortality Rates in a Sample of STS Hospitals
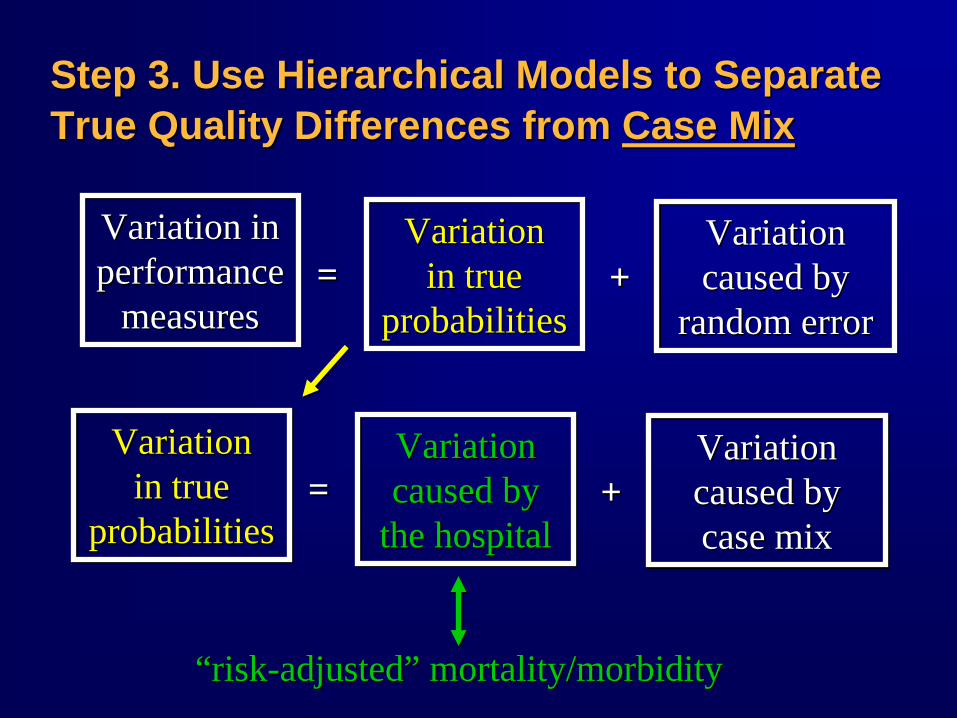
Step 3. Use Hierarchical Models to Separate Step 3. Use Hierarchical Models to Separate True Quality Differences from True Quality Differences from Case MixCase Mix
Variation in true
probabilities
Variation in true
probabilities===
Variation caused by
the hospital
Variation caused by
the hospital
Variation caused by case mix
Variation caused by case mix
+++
Variation in performance
measures
Variation in performance
measures===
Variation in true
probabilities
Variation in true
probabilities
Variation caused by
random error
Variation caused by
random error+++
“risk-adjusted” mortality/morbidity“risk-adjusted” mortality/morbidity
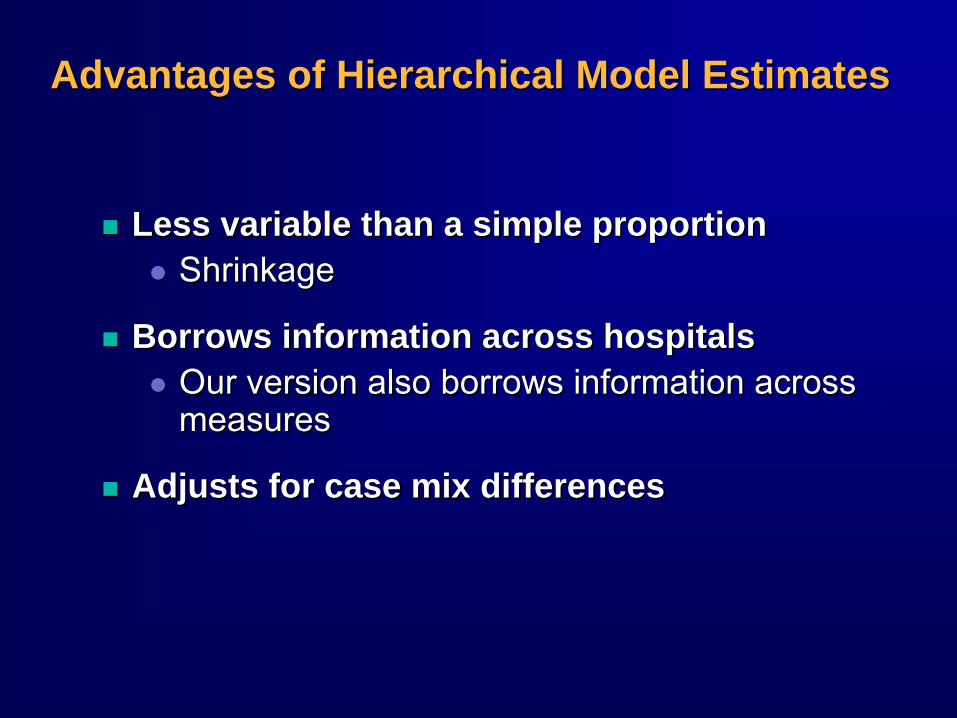
Advantages of Hierarchical Model EstimatesAdvantages of Hierarchical Model Estimates
Less variable than a simple proportionLess variable than a simple proportionShrinkageShrinkage
Borrows information across hospitalsBorrows information across hospitalsOur version also borrows information across Our version also borrows information across measuresmeasures
Adjusts for case mix differencesAdjusts for case mix differences
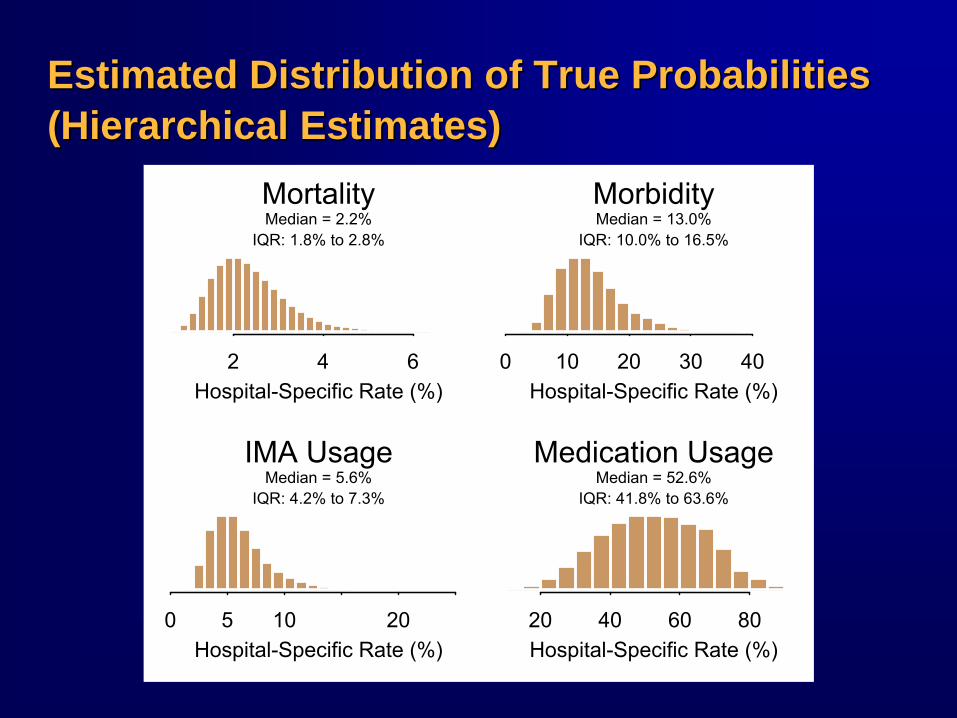
Estimated Distribution of True ProbabilitiesEstimated Distribution of True Probabilities (Hierarchical Estimates)(Hierarchical Estimates)
2 4 6Hospital-Specific Rate (%)
MortalityMedian = 2.2%
IQR: 1.8% to 2.8%
0 10 20 30 40Hospital-Specific Rate (%)
MorbidityMedian = 13.0%
IQR: 10.0% to 16.5%
0 5 10 20Hospital-Specific Rate (%)
IMA UsageMedian = 5.6%
IQR: 4.2% to 7.3%
20 40 60 80Hospital-Specific Rate (%)
Medication UsageMedian = 52.6%
IQR: 41.8% to 63.6%
Step 4. The Domain Scores Are Standardized Step 4. The Domain Scores Are Standardized to a Common Scale to a Common Scale
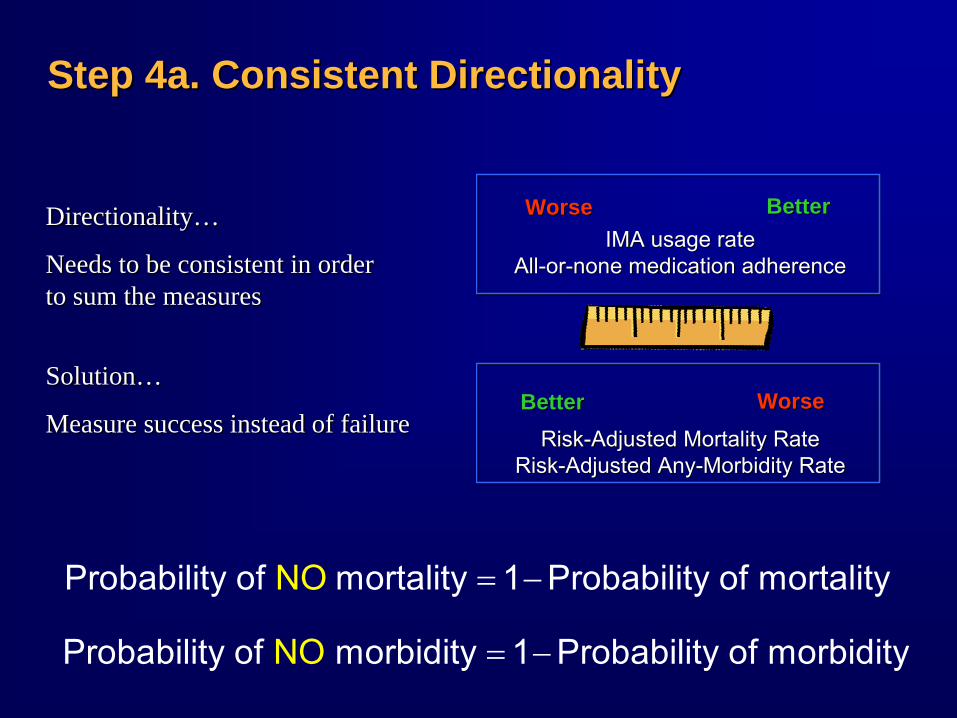
Step 4a. Consistent DirectionalityStep 4a. Consistent Directionality
WorseWorseIMA usage rate
All-or-none medication adherenceIMA usage rate
All-or-none medication adherence
BetterBetter
Risk-Adjusted Mortality RateRisk-Adjusted Any-Morbidity Rate
Risk-Adjusted Mortality RateRisk-Adjusted Any-Morbidity Rate
BetterBetter WorseWorse
Directionality…
Needs to be consistent in order to sum the measures
Solution…
Measure success instead of failure
Directionality…
Needs to be consistent in order to sum the measures
Solution…
Measure success instead of failure
= −Probability of morbidity 1 Probability of morNO bidity
= −Probability of mortality 1 Probability of morNO tality
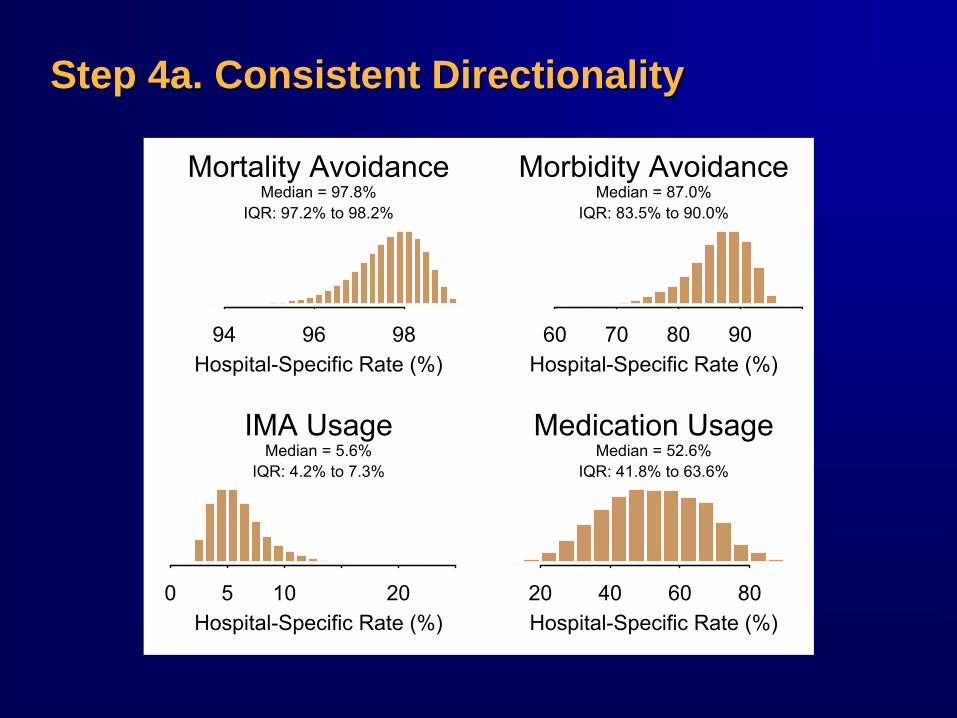
Step 4a. Consistent DirectionalityStep 4a. Consistent Directionality
94 96 98Hospital-Specific Rate (%)
Mortality AvoidanceMedian = 97.8%
IQR: 97.2% to 98.2%
60 70 80 90Hospital-Specific Rate (%)
Morbidity AvoidanceMedian = 87.0%
IQR: 83.5% to 90.0%
0 5 10 20Hospital-Specific Rate (%)
IMA UsageMedian = 5.6%
IQR: 4.2% to 7.3%
20 40 60 80Hospital-Specific Rate (%)
Medication UsageMedian = 52.6%
IQR: 41.8% to 63.6%
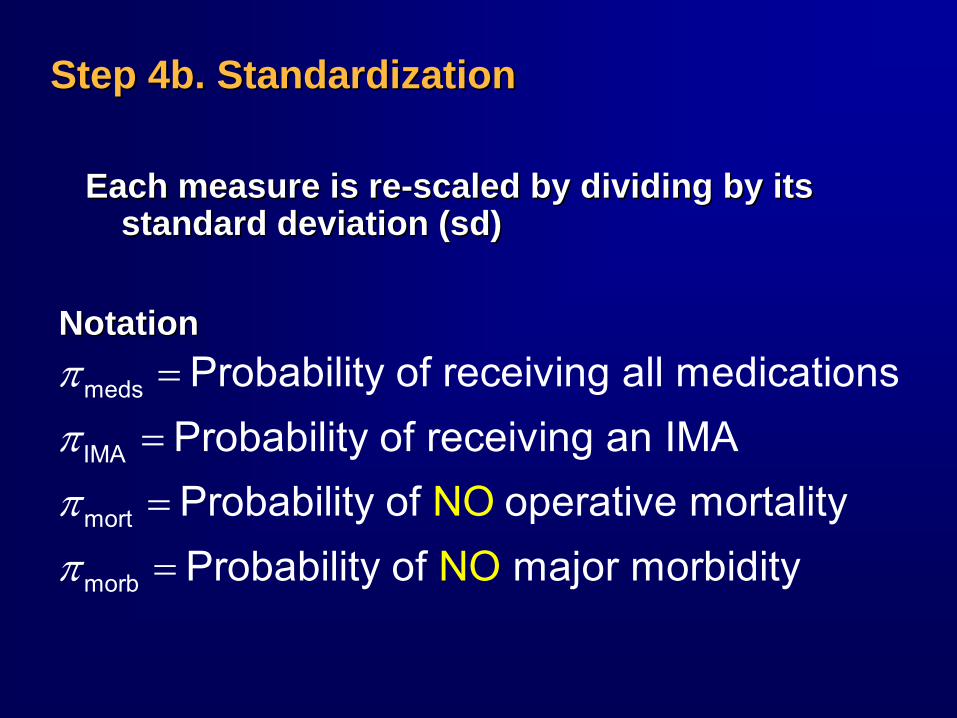
Step 4b. StandardizationStep 4b. Standardization
meds
IMA
mort
morb
Probability of receiving all medicationsProbability of receiving an IMAProbability of operative mortalityProbability o
NONOf major morbidity
ππππ
=
=
=
=
NotationNotation
Each measure is reEach measure is re--scaled by dividing by its scaled by dividing by its standard deviation (standard deviation (sdsd))
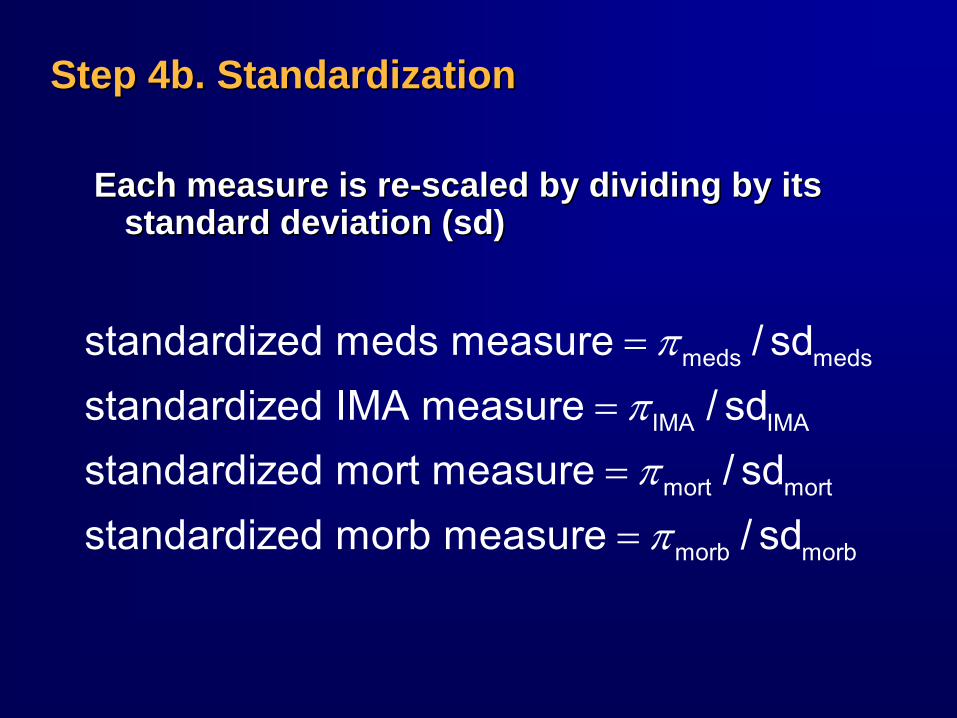
Step 4b. StandardizationStep 4b. Standardization
meds meds
IMA IMA
mort mort
morb morb
standardized meds measure / sdstandardized IMA measure / sdstandardized mort measure / sdstandardized morb measure / sd
ππππ
=
=
=
=
Each measure is reEach measure is re--scaled by dividing by its scaled by dividing by its standard deviation (standard deviation (sdsd))
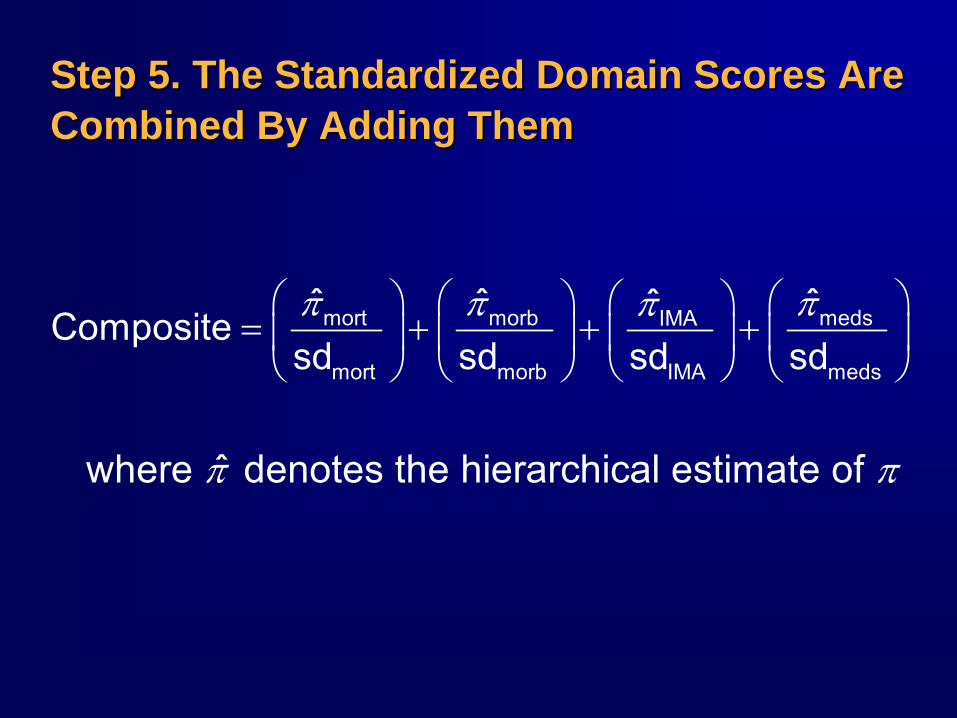
Step 5. The Standardized Domain Scores Are Step 5. The Standardized Domain Scores Are Combined By Adding ThemCombined By Adding Them
mort morb medsIMA
mort morb IMA meds
ˆ ˆ ˆˆCompositesd sd sd sdπ π ππ⎛ ⎞ ⎛ ⎞ ⎛ ⎞⎛ ⎞
= + + +⎜ ⎟ ⎜ ⎟ ⎜ ⎟⎜ ⎟⎝ ⎠⎝ ⎠ ⎝ ⎠ ⎝ ⎠
where ˆ denotes the hierarchical estimate of π π
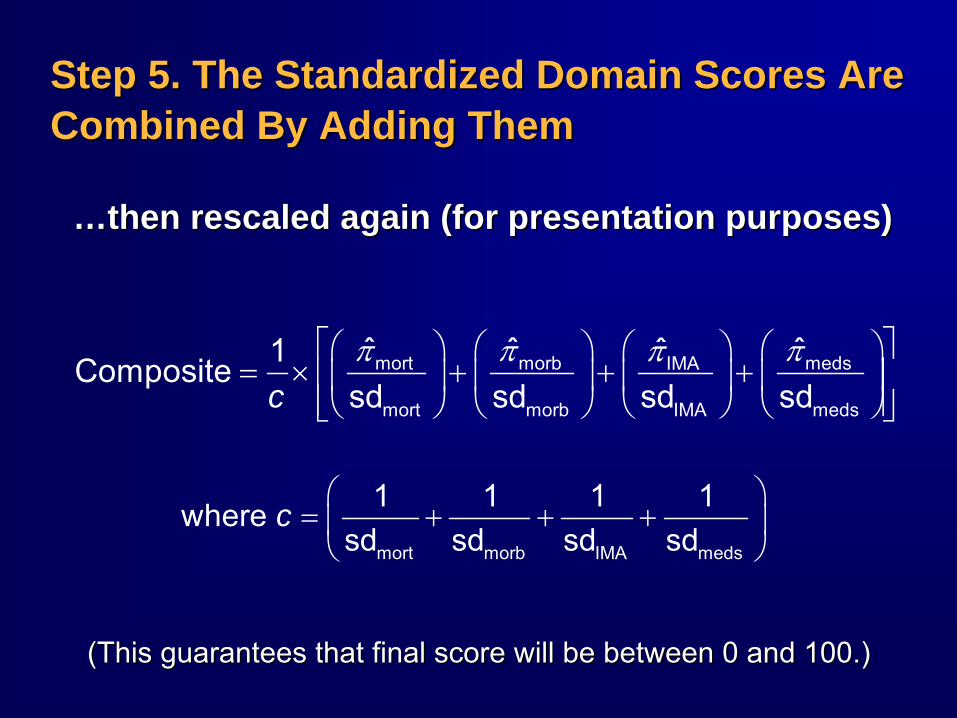
Step 5. The Standardized Domain Scores Are Step 5. The Standardized Domain Scores Are Combined By Adding ThemCombined By Adding Them
……then rescaled again (for presentation purposes)then rescaled again (for presentation purposes)
⎛ ⎞= + + +⎜ ⎟⎝ ⎠mort morb IMA meds
1 1 1 1where sd sd sd sd
c
π π ππ⎡ ⎤⎛ ⎞ ⎛ ⎞ ⎛ ⎞⎛ ⎞= × + + +⎢ ⎥⎜ ⎟ ⎜ ⎟ ⎜ ⎟⎜ ⎟
⎢ ⎥⎝ ⎠⎝ ⎠ ⎝ ⎠ ⎝ ⎠⎣ ⎦mort morb medsIMA
mort morb IMA meds
ˆ ˆ ˆˆ1Compositesd sd sd sdc
(This guarantees that final score will be between 0 and 100.)(This guarantees that final score will be between 0 and 100.)
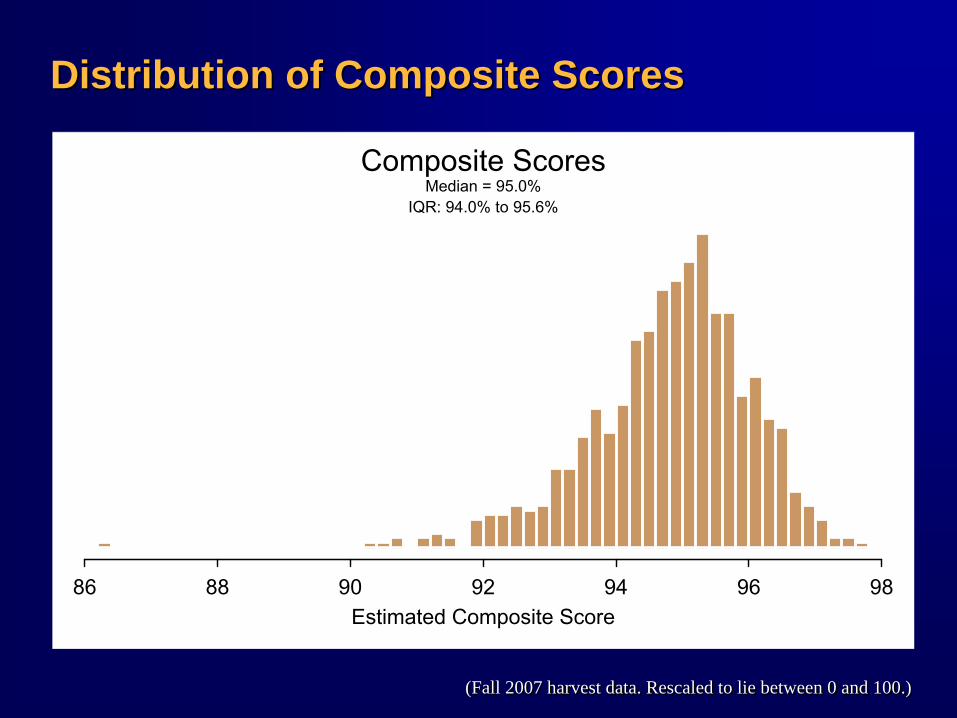
Distribution of Composite ScoresDistribution of Composite Scores
86 88 90 92 94 96 98Estimated Composite Score
Composite ScoresMedian = 95.0%
IQR: 94.0% to 95.6%
(Fall 2007 harvest data. Rescaled to lie between 0 and 100.)(Fall 2007 harvest data. Rescaled to lie between 0 and 100.)
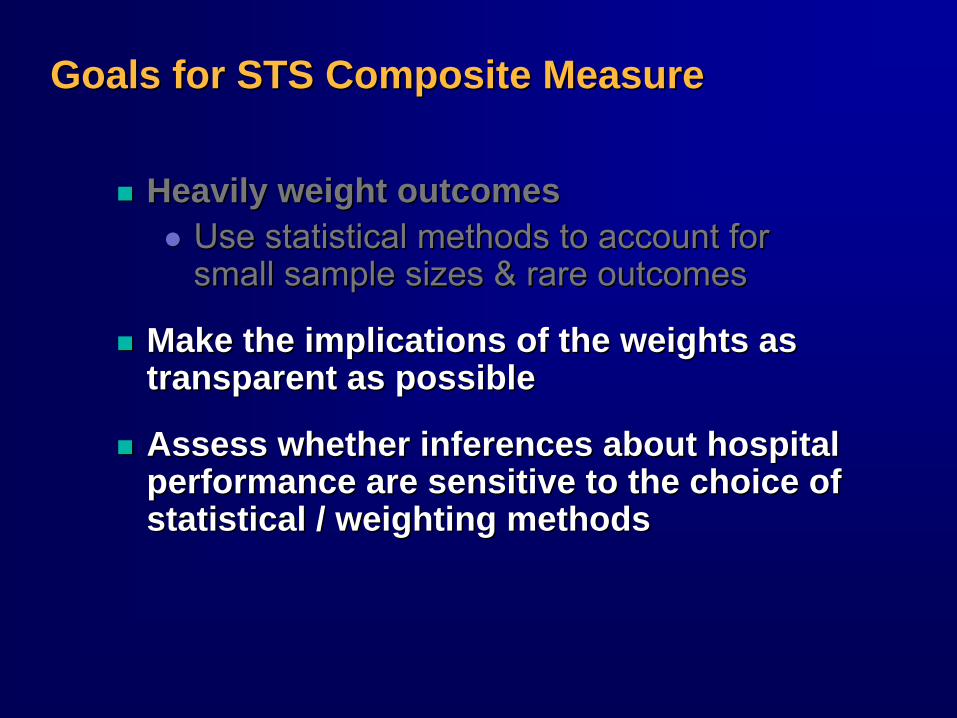
Goals for STS Composite MeasureGoals for STS Composite Measure
Heavily weight outcomesHeavily weight outcomesUse statistical methods to account for Use statistical methods to account for small sample sizes & rare outcomessmall sample sizes & rare outcomes
Make the implications of the weights as Make the implications of the weights as transparent as possibletransparent as possible
Assess whether inferences about hospital Assess whether inferences about hospital performance are sensitive to the choice of performance are sensitive to the choice of statistical / weighting methodsstatistical / weighting methods
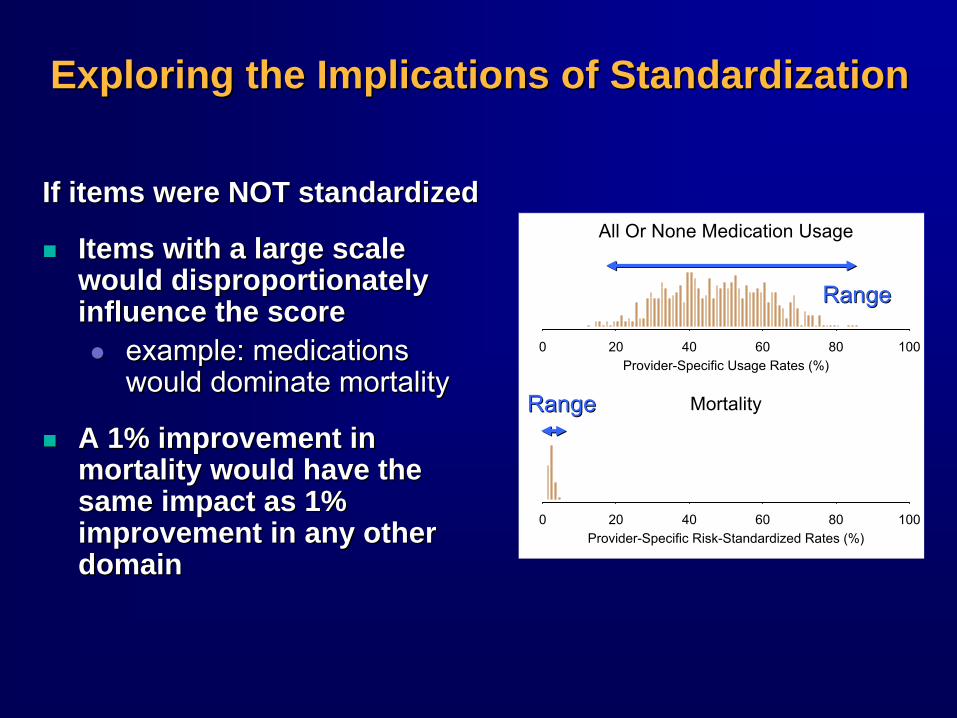
Exploring the Implications of StandardizationExploring the Implications of Standardization
If items were NOT standardizedIf items were NOT standardized
Items with a large scale Items with a large scale would disproportionately would disproportionately influence the scoreinfluence the score
example: medications example: medications would dominate mortalitywould dominate mortality
A 1% improvement in A 1% improvement in mortality would have the mortality would have the same impact as 1% same impact as 1% improvement in any other improvement in any other domaindomain
0 20 40 60 80 100Provider-Specific Usage Rates (%)
All Or None Medication Usage
0 20 40 60 80 100Provider-Specific Risk-Standardized Rates (%)
MortalityRangeRange
RangeRange
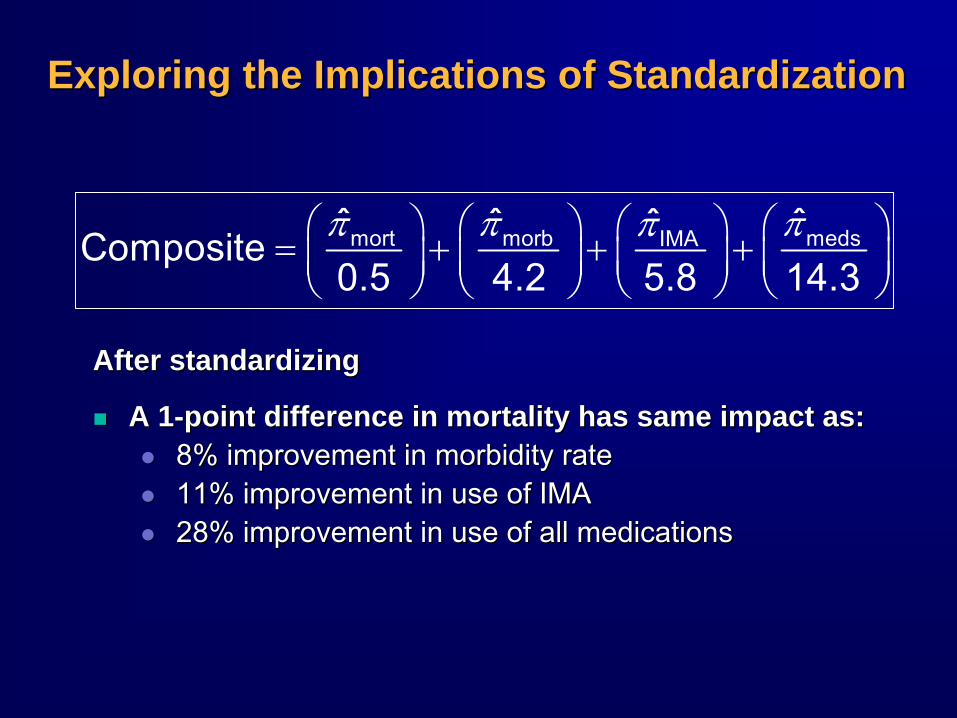
After standardizingAfter standardizing
A 1A 1--point difference in mortality has same impact as:point difference in mortality has same impact as:8% improvement in morbidity rate8% improvement in morbidity rate11% improvement in use of IMA11% improvement in use of IMA28% improvement in use of all medications 28% improvement in use of all medications
Exploring the Implications of StandardizationExploring the Implications of Standardization
mort morb medsIMAˆ ˆ ˆˆComposite0.5 4.2 5.8 14.3π π ππ⎛ ⎞ ⎛ ⎞ ⎛ ⎞⎛ ⎞= + + +⎜ ⎟⎜ ⎟ ⎜ ⎟ ⎜ ⎟
⎝ ⎠⎝ ⎠ ⎝ ⎠ ⎝ ⎠
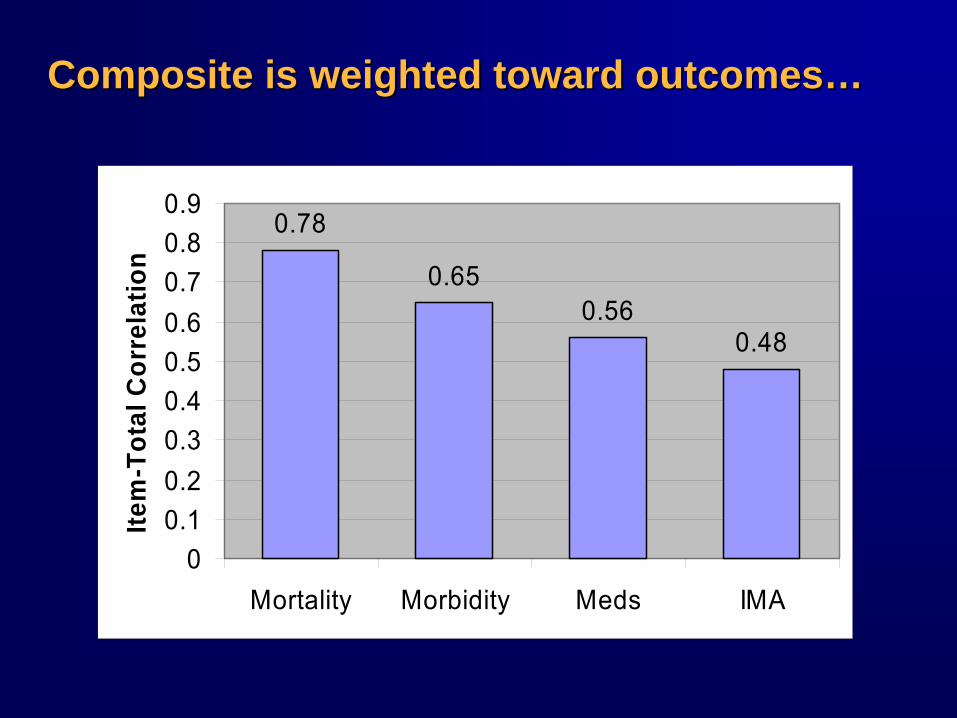
Composite is weighted toward outcomesComposite is weighted toward outcomes……
0.78
0.650.56
0.48
00.10.20.30.40.50.60.70.80.9
Mortality Morbidity Meds IMA
Item
-Tot
al C
orre
latio
n
Sensitivity AnalysesSensitivity Analyses
Key QuestionKey Question
Are inferences about hospital quality Are inferences about hospital quality sensitive to the choice of methods?sensitive to the choice of methods?
If not, then stakes are not so highIf not, then stakes are not so high……
AnalysisAnalysis
Calculate composite scores using a variety Calculate composite scores using a variety of different methods and compare resultsof different methods and compare results
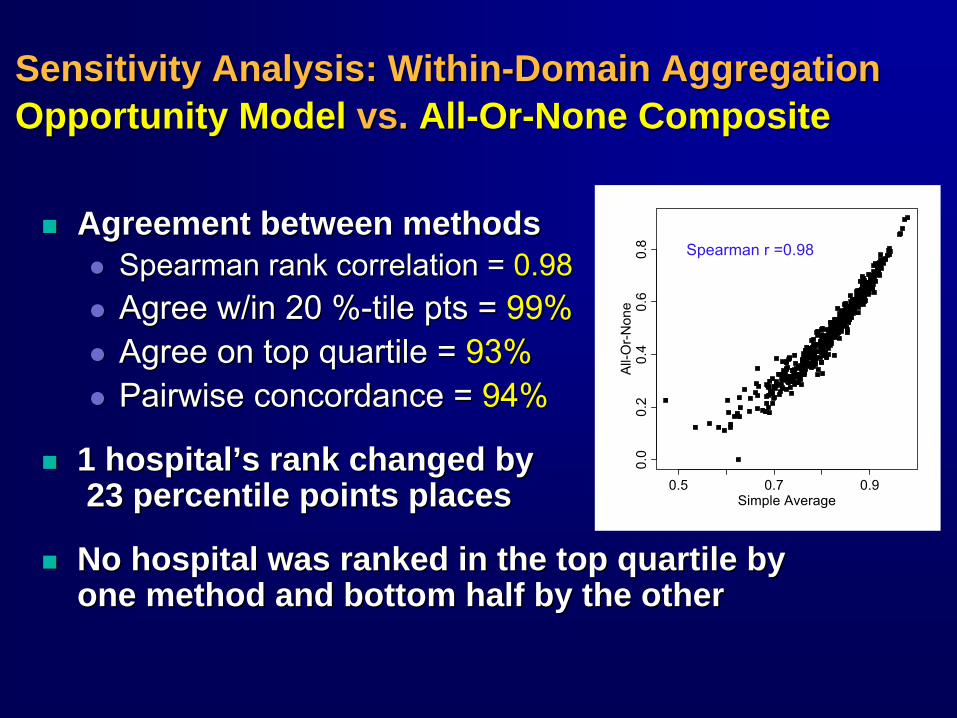
Agreement between methodsAgreement between methodsSpearman rank correlation = Spearman rank correlation = 0.980.98Agree w/in 20 %Agree w/in 20 %--tile pts = tile pts = 99%99%Agree on top quartile = Agree on top quartile = 93%93%PairwisePairwise concordance = concordance = 94%94%
1 hospital1 hospital’’s rank changed bys rank changed by23 percentile points places23 percentile points places
No hospital was ranked in the top quartile by No hospital was ranked in the top quartile by one method and bottom half by the otherone method and bottom half by the other
Simple Average
All-
Or-N
one
0.5 0.7 0.9
0.0
0.2
0.4
0.6
0.8 Spearman r =0.98
Sensitivity Analysis: WithinSensitivity Analysis: Within--Domain AggregationDomain Aggregation Opportunity Model Opportunity Model vs.vs. AllAll--OrOr--None CompositeNone Composite
Sensitivity Analysis: Method of StandardizationSensitivity Analysis: Method of Standardization
Method 1: Normalized by Standard Deviation
Met
hod
2: R
e-S
cale
d to
(0,1
)
40 41 42 43 440.
20.
40.
6 Spearman r = 0.99
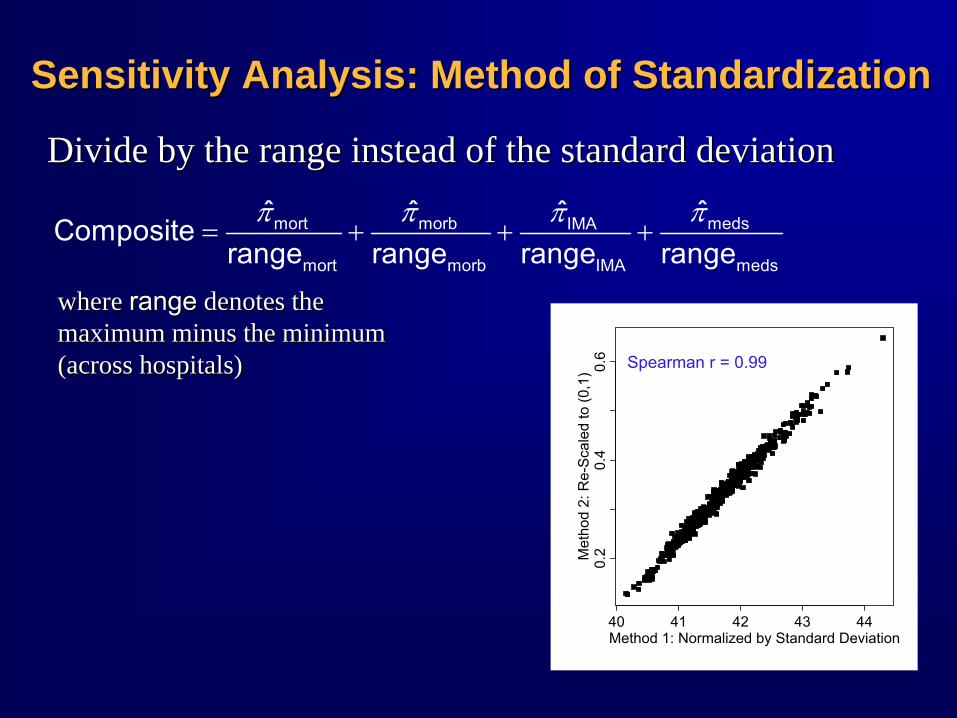
mort morb medsIMA
mort morb IMA meds
ˆ ˆ ˆˆCompositerange range range rangeπ π ππ
= + + +
where range
denotes the maximum minus the minimum (across hospitals)
where range
denotes the maximum minus the minimum (across hospitals)
Divide by the range instead of the standard deviationDivide by the range instead of the standard deviation
Sensitivity Analysis: Method of StandardizationSensitivity Analysis: Method of Standardization
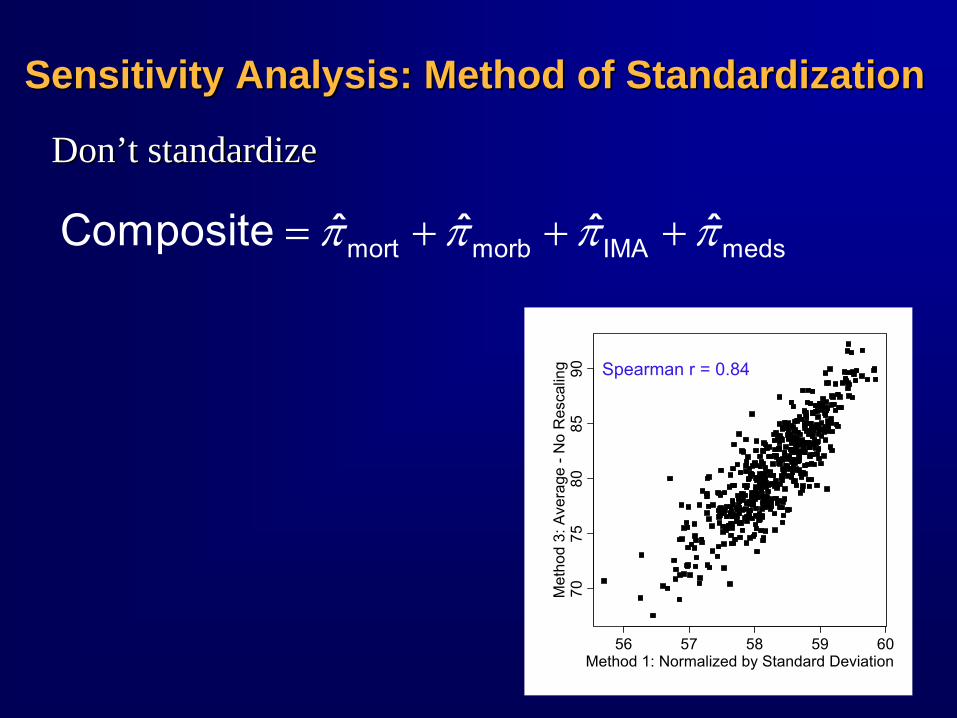
mort morb IMA medsComposite ˆ ˆ ˆ ˆπ π π π= + + +
Don’t standardizeDon’t standardize
Method 1: Normalized by Standard Deviation
Met
hod
3: A
vera
ge -
No
Res
calin
g
56 57 58 59 60
7075
8085
90 Spearman r = 0.84
Sensitivity Analysis: SummarySensitivity Analysis: Summary
Inferences about hospital quality are Inferences about hospital quality are generally robust to minor variations in the generally robust to minor variations in the methodologymethodology
However, standardizing vs. not However, standardizing vs. not standardizing has a large impact on hospital standardizing has a large impact on hospital rankingsrankings
Performance of Hospital Classifications Performance of Hospital Classifications Based on the STS Composite ScoreBased on the STS Composite Score
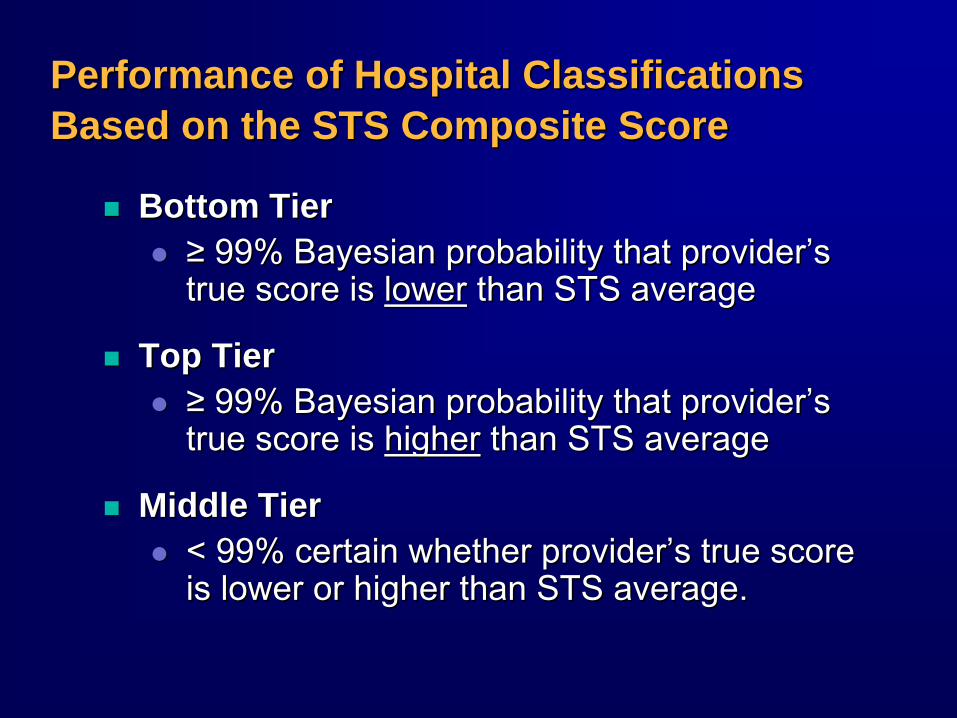
Bottom TierBottom Tier≥≥ 99% Bayesian probability that provider99% Bayesian probability that provider’’s s true score is true score is lowerlower than STS averagethan STS average
Top TierTop Tier≥≥ 99% Bayesian probability that provider99% Bayesian probability that provider’’s s true score is true score is higherhigher than STS averagethan STS average
Middle TierMiddle Tier< 99% certain whether provider< 99% certain whether provider’’s true score s true score is lower or higher than STS average. is lower or higher than STS average.
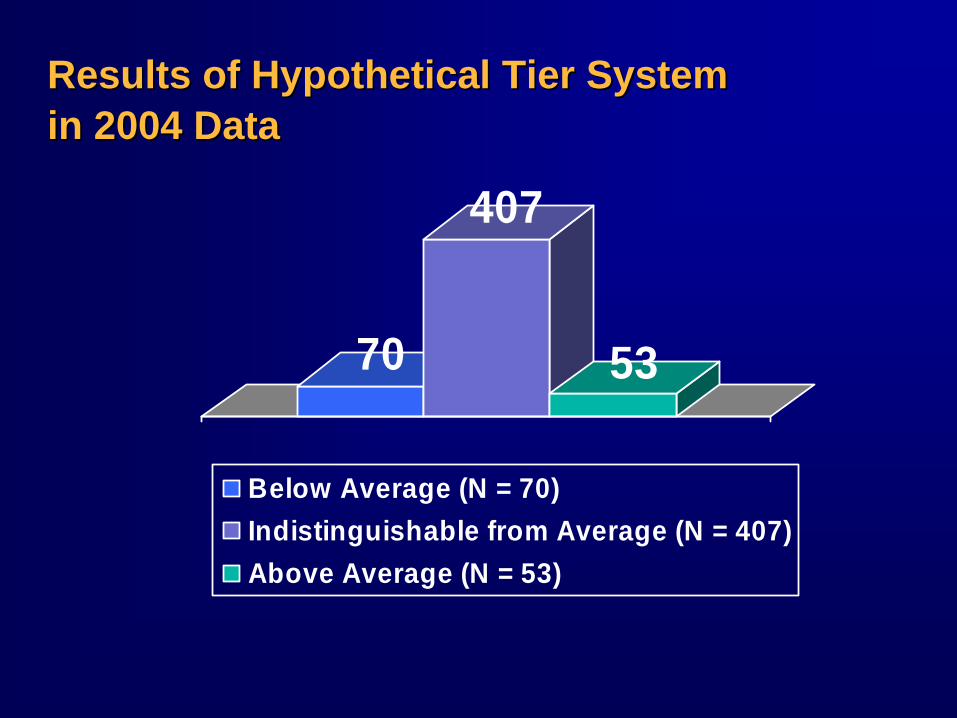
Results of Hypothetical Tier System Results of Hypothetical Tier System in 2004 Datain 2004 Data
70
407
53
Below Average (N = 70)Indistinguishable from Average (N = 407)Above Average (N = 53)
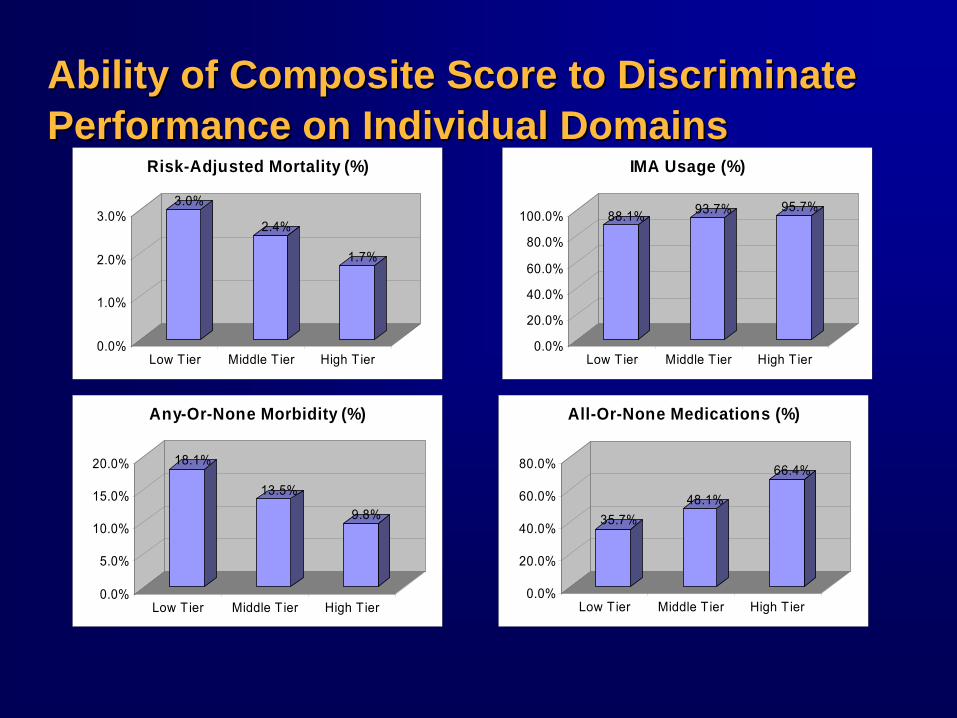
Ability of Composite Score to Discriminate Ability of Composite Score to Discriminate Performance on Individual DomainsPerformance on Individual Domains
3.0%
2.4%
1.7%
0.0%
1.0%
2.0%
3.0%
Low Tier Middle Tier High Tier
Risk-Adjusted Mortality (%)
18.1%
13.5%
9.8%
0.0%
5.0%
10.0%
15.0%
20.0%
Low Tier Middle Tier High Tier
Any-Or-None Morbidity (%)
35.7%48.1%
66.4%
0.0%
20.0%
40.0%
60.0%
80.0%
Low Tier Middle Tier High Tier
All-Or-None Medications (%)
88.1% 93.7% 95.7%
0.0%
20.0%
40.0%
60.0%
80.0%
100.0%
Low Tier Middle Tier High Tier
IMA Usage (%)
Summary of STS Composite MethodSummary of STS Composite Method
Use of allUse of all--oror--none composite for combining none composite for combining items within domainsitems within domains
Combining items was based on rescaling Combining items was based on rescaling and addingand adding
Estimation via Bayesian hierarchical modelsEstimation via Bayesian hierarchical models
Hospital classifications based on Bayesian Hospital classifications based on Bayesian probabilitiesprobabilities
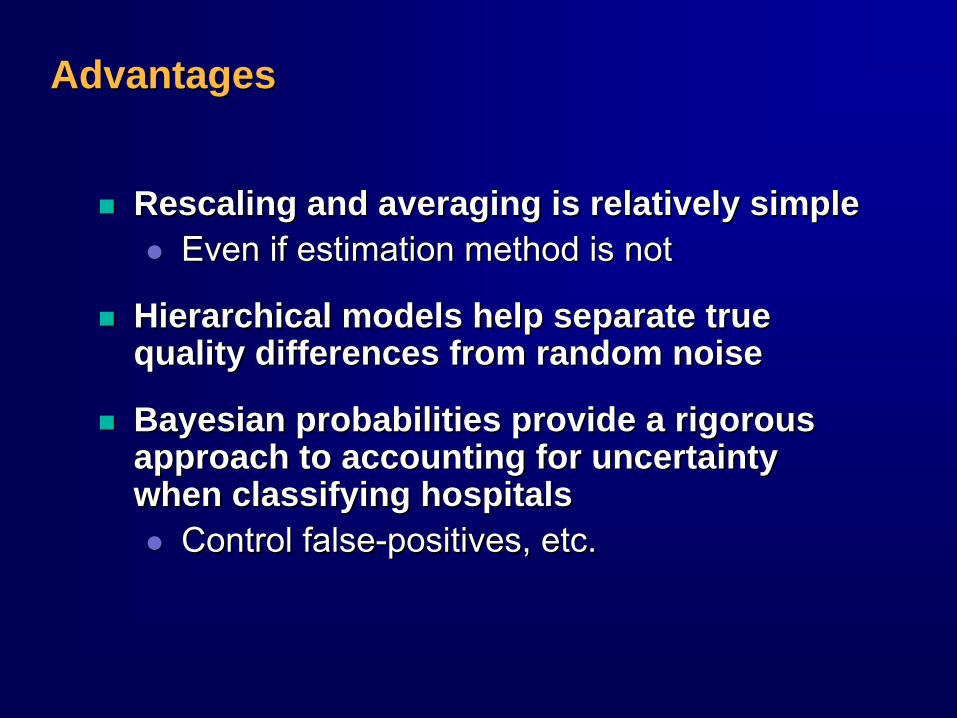
AdvantagesAdvantages
Rescaling and averaging is relatively simpleRescaling and averaging is relatively simpleEven if estimation method is notEven if estimation method is not
Hierarchical models help separate true Hierarchical models help separate true quality differences from random noisequality differences from random noise
Bayesian probabilities provide a rigorous Bayesian probabilities provide a rigorous approach to accounting for uncertainty approach to accounting for uncertainty when classifying hospitalswhen classifying hospitals
Control falseControl false--positives, etc.positives, etc.
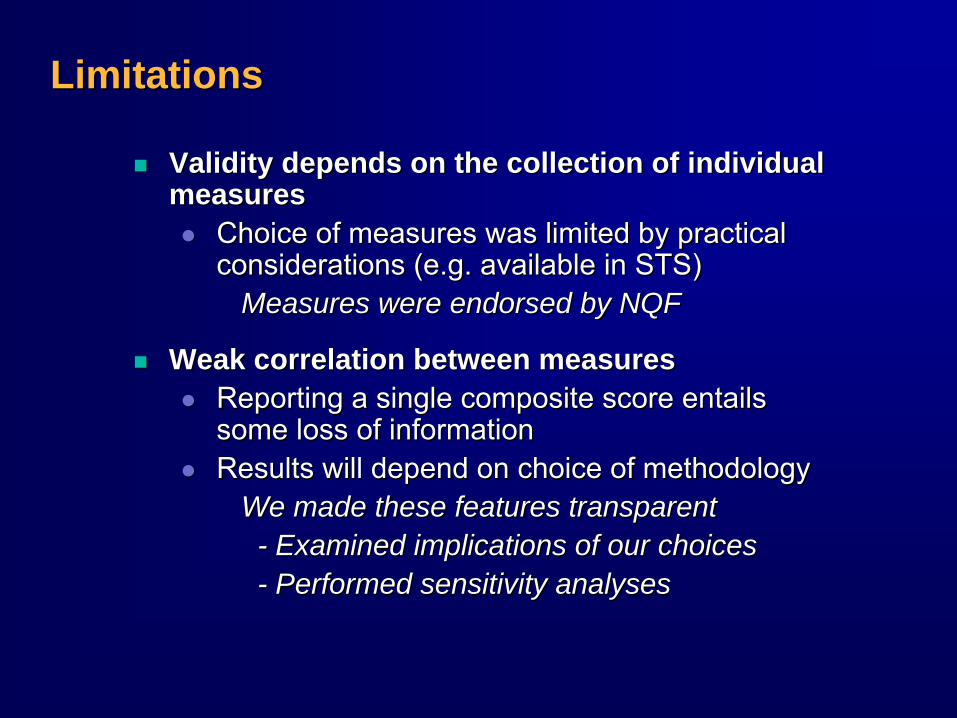
LimitationsLimitations
Validity depends on the collection of individual Validity depends on the collection of individual measuresmeasures
Choice of measures was limited by practical Choice of measures was limited by practical considerations (e.g. available in STS)considerations (e.g. available in STS)
Measures were endorsed by NQFMeasures were endorsed by NQF
Weak correlation between measuresWeak correlation between measuresReporting a single composite score entails Reporting a single composite score entails some loss of informationsome loss of informationResults will depend on choice of methodologyResults will depend on choice of methodology
We made these features transparentWe made these features transparent-- Examined implications of our choicesExamined implications of our choices-- Performed sensitivity analysesPerformed sensitivity analyses
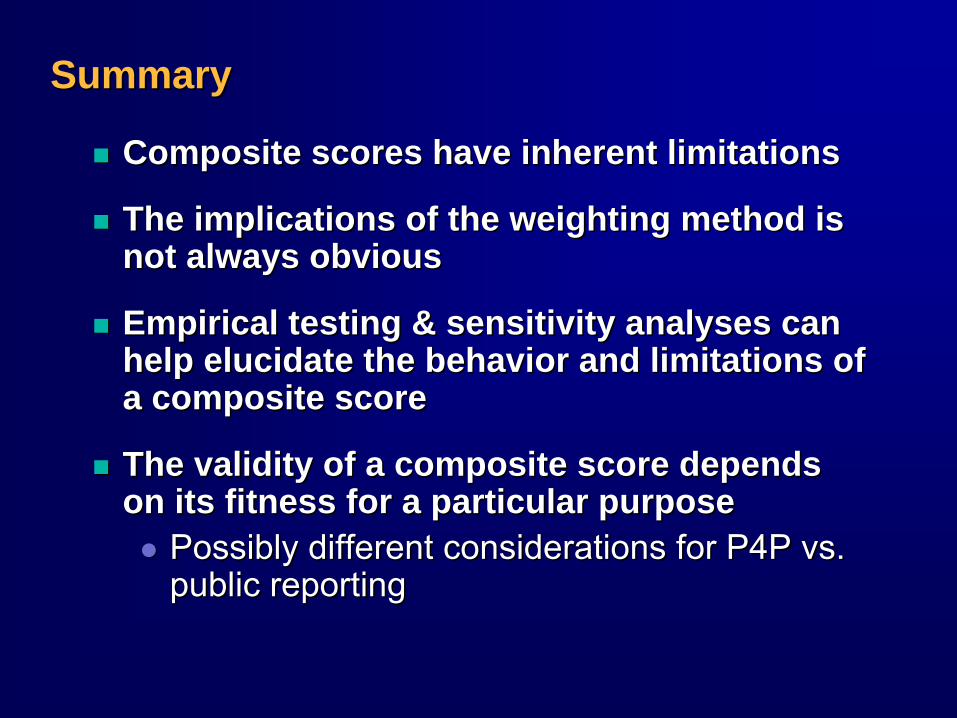
SummarySummary
Composite scores have inherent limitationsComposite scores have inherent limitations
The implications of the weighting method is The implications of the weighting method is not always obviousnot always obvious
Empirical testing & sensitivity analyses can Empirical testing & sensitivity analyses can help elucidate the behavior and limitations of help elucidate the behavior and limitations of a composite scorea composite score
The validity of a composite score depends The validity of a composite score depends on its fitness for a particular purposeon its fitness for a particular purpose
Possibly different considerations for P4P vs. Possibly different considerations for P4P vs. public reportingpublic reporting

Extra SlidesExtra Slides
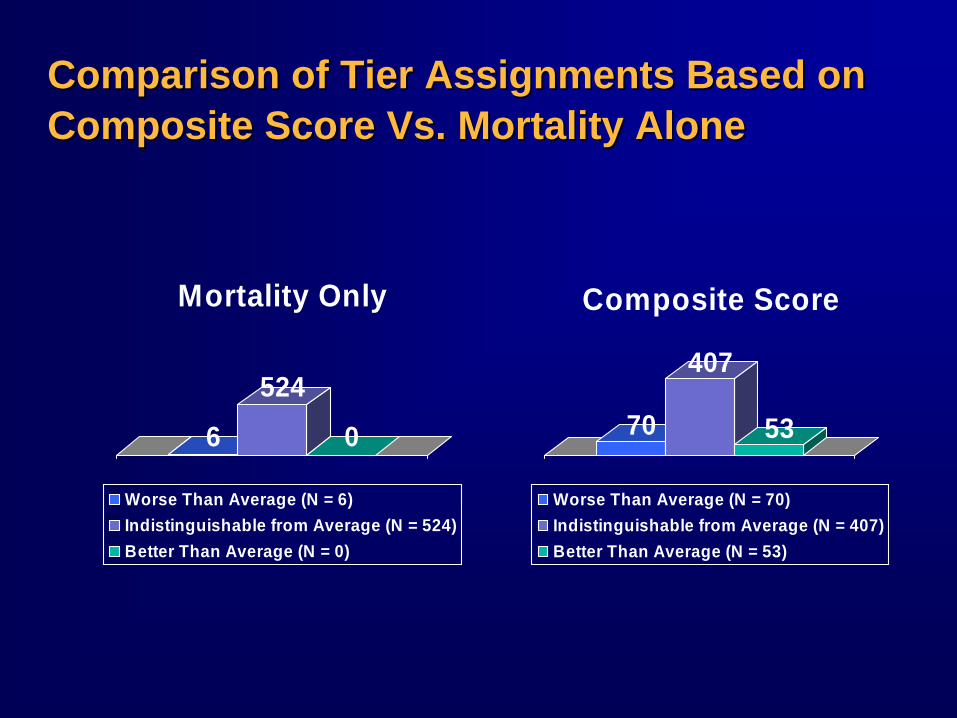
Comparison of Tier Assignments Based on Comparison of Tier Assignments Based on Composite Score Vs. Mortality AloneComposite Score Vs. Mortality Alone
6
524
0
Mortality Only
Worse Than Average (N = 6)Indistinguishable from Average (N = 524)Better Than Average (N = 0)
70
407
53
Composite Score
Worse Than Average (N = 70)Indistinguishable from Average (N = 407)Better Than Average (N = 53)

EXTRA SLIDES EXTRA SLIDES –– STAR RATINGS VS STAR RATINGS VS VOLUMEVOLUME

Frequency of Star Categories By VolumeFrequency of Star Categories By Volume
EXTRA SLIDES EXTRA SLIDES –– HQID METHOD APPLIED HQID METHOD APPLIED TO STS MEASURESTO STS MEASURES
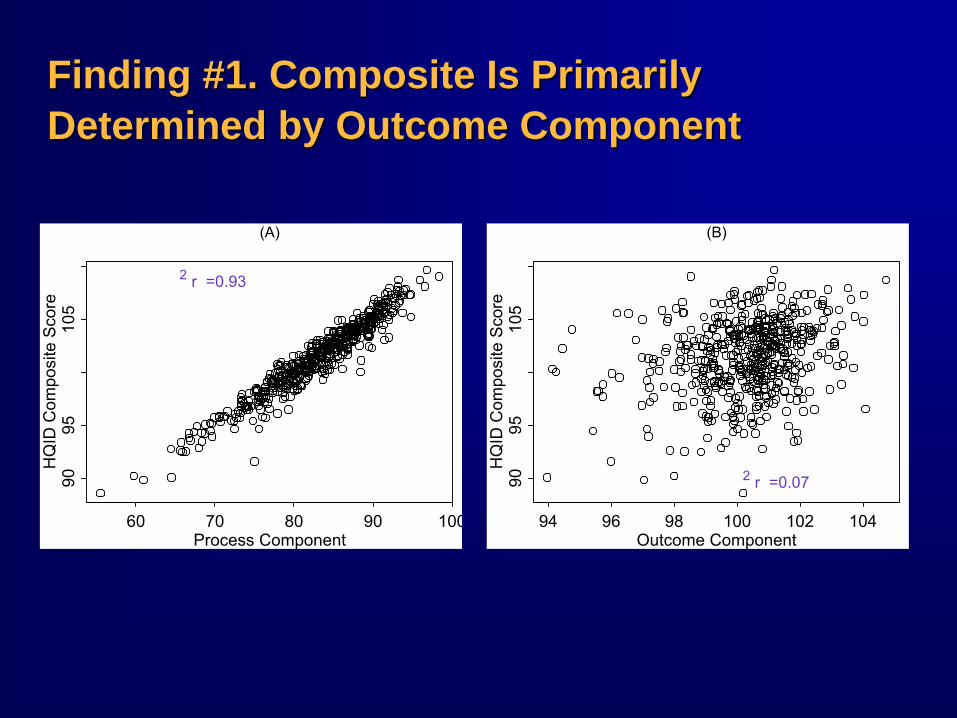
Finding #1. Composite Is Primarily Finding #1. Composite Is Primarily Determined by Outcome ComponentDetermined by Outcome Component
Process Component
HQ
ID C
ompo
site
Sco
re
60 70 80 90 100
9095
105
(A)
r =0.93 2
Outcome Component
HQ
ID C
ompo
site
Sco
re94 96 98 100 102 104
9095
105
(B)
r =0.07 2
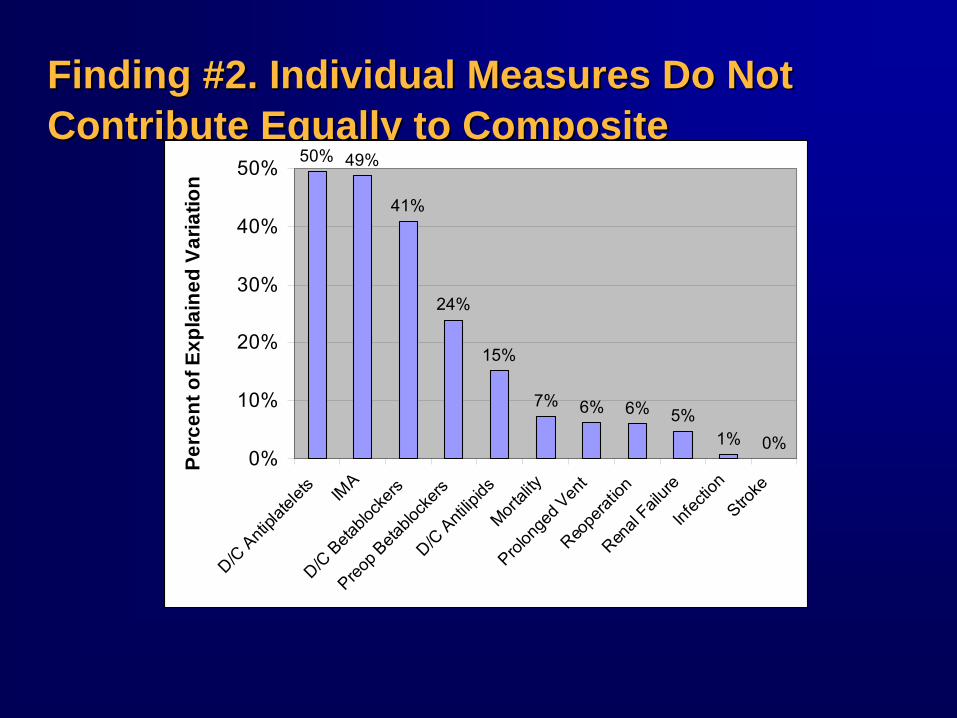
Finding #2. Individual Measures Do Not Finding #2. Individual Measures Do Not Contribute Equally to CompositeContribute Equally to Composite
50% 49%
41%
24%
15%
7% 6% 6% 5%1% 0%
0%
10%
20%
30%
40%
50%
D/C Anti
platel
ets IMA
D/C Beta
block
ers
Preop B
etablo
ckers
D/C Anti
lipids
Mortali
ty
Prolon
ged V
ent
Reope
ration
Renal
Failure
Infec
tion
Stroke
Perc
ent o
f Exp
lain
ed V
aria
tion
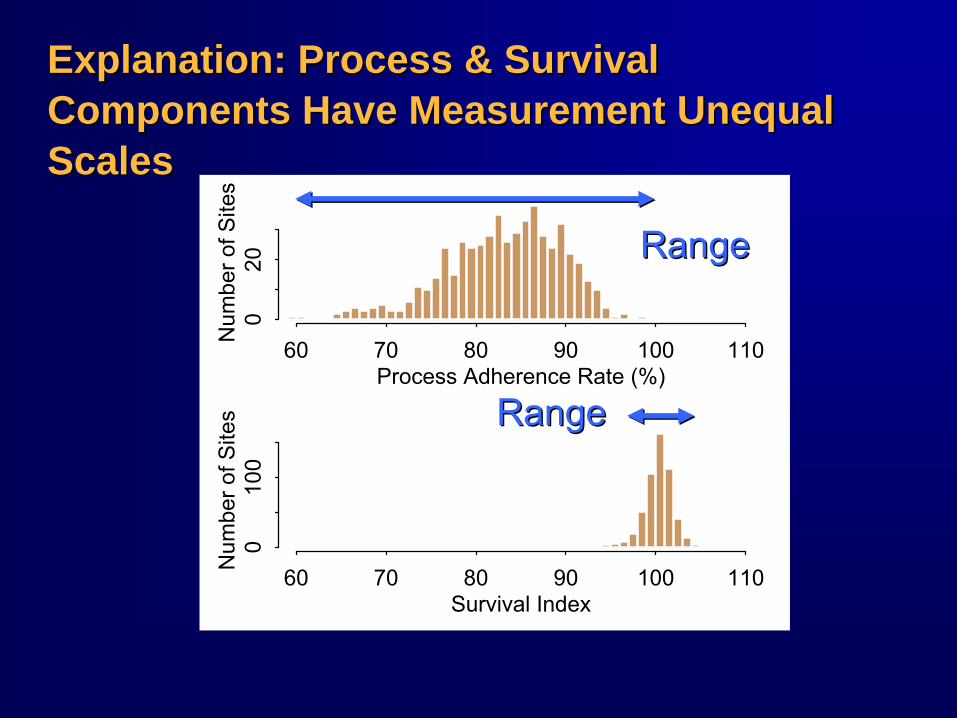
Explanation: Process & Survival Explanation: Process & Survival Components Have Measurement Unequal Components Have Measurement Unequal ScalesScales
60 70 80 90 100 110
020
Process Adherence Rate (%)
Num
ber o
f Site
s
60 70 80 90 100 110
010
0
Survival Index
Num
ber o
f Site
s RangeRange
RangeRange
EXTRA SLIDES EXTRA SLIDES –– CHOOSING MEASURESCHOOSING MEASURES
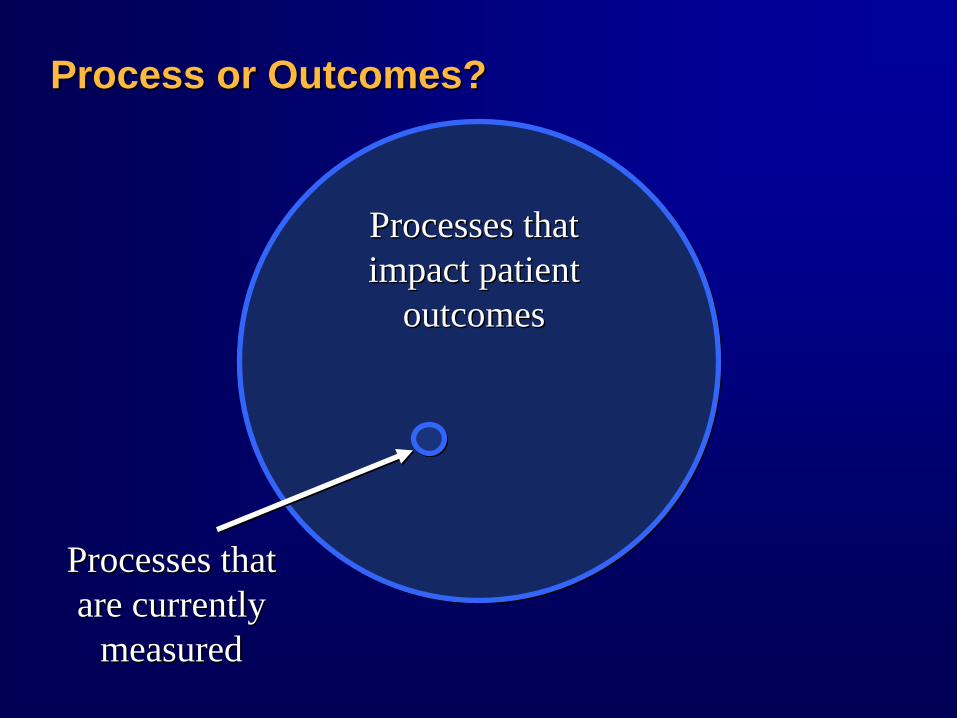
Process or Outcomes? Process or Outcomes?
Processes that impact patient
outcomes
Processes that impact patient
outcomes
Processes that are currently
measured
Processes that are currently
measured
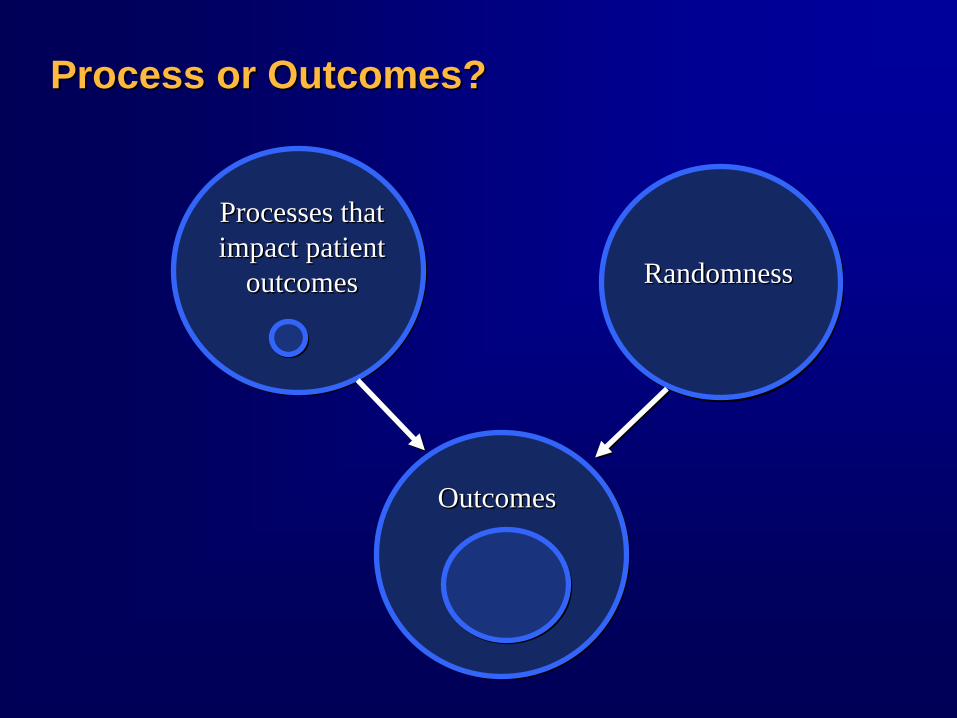
Process or Outcomes?Process or Outcomes?
Processes that impact patient
outcomes
Processes that impact patient
outcomes
OutcomesOutcomes
RandomnessRandomness

Structural Measures?Structural Measures?
Processes thatimpact patient
outcomes
Processes thatimpact patient
outcomes
OutcomesOutcomes
RandomnessRandomnessStructureStructure
EXTRA SLIDES EXTRA SLIDES –– ALTERNATE ALTERNATE PERSPECTIVES FOR DEVELOPING PERSPECTIVES FOR DEVELOPING COMPOSITE SCORESCOMPOSITE SCORES
Perspectives for Developing CompositesPerspectives for Developing Composites
Normative PerspectiveNormative PerspectiveConcept being measured is defined by the Concept being measured is defined by the choice of measures and their weightingchoice of measures and their weighting
Not vice versaNot vice versaWeighting different aspects of quality is Weighting different aspects of quality is inherently inherently normativenormative
-- Weights reflect a set of valuesWeights reflect a set of values-- Whose values? Whose values?
Perspectives for Developing CompositesPerspectives for Developing Composites
Behavioral PerspectiveBehavioral PerspectivePrimary goal is to provide an incentivePrimary goal is to provide an incentiveOptimal weights are ones that will cause the Optimal weights are ones that will cause the desired behavior among providersdesired behavior among providersIssues:Issues:
Reward outcomes or processes?Reward outcomes or processes?Rewarding X while hoping for YRewarding X while hoping for Y

SCRAPSCRAP

Domain- specific scores
Overall composite
score
3-starrating
categories
Graphical display of STS
distribution
Score + confidence
interval